
Sustainability Assessment Framework for Urban Transportation Combining System Dynamics Modeling and GIS; A TOD and Parking Policy Approach


 , and
, and
Abstract
Highlights
- The integrated System Dynamics and GIS framework can measure temporal feedback loops while considering spatial metrics (transit accessibility, parking supply) as input and output data to assess urban planning indicators.
- Scenario analyses indicate that transit-oriented development and parking policies can reduce car dependency and emissions. Also, limiting parking availability around transit nodes while investing in active transportation infrastructure significantly shifts travel behavior toward more sustainable modes.
- This paper’s model shows where planning policies should intervene in urban development. It combines TOD, parking limits, and active travel improvements to create feedback loops that support low-carbon mobility.
- The SD–GIS framework offers a scalable decision-support tool for urban planners, enabling them to model location-specific interventions and their long-term impacts on sustainability.
Abstract
1. Introduction
2. Literature Review
Integration of System Dynamics and GIS in Urban Sustainability Assessment

| Category | Indicators | References | |||||||||||||||||||||
|---|---|---|---|---|---|---|---|---|---|---|---|---|---|---|---|---|---|---|---|---|---|---|---|
| [43] | [42] | [45] | [46] | [47] | [48] | [49] | [50] | [51] | [52] | [53] | [54] | [55] | [56] | [57] | [58] | [59] | [60] | [61] | [62] | [63] | [64] | ||
| Built Environment | Density | X | X | X | X | X | X | X | X | X | X | X | X | X | X | X | X | X | X | X | X | X | X |
| Mixed land uses | X | X | X | X | X | X | X | X | X | X | X | X | X | X | X | X | X | X | X | X | X | ||
| Design | X | X | X | X | X | X | X | X | X | X | X | ||||||||||||
| Accessibility | X | X | X | X | X | X | X | X | X | X | X | X | X | X | X | X | X | X | X | X | X | ||
| Proximity | X | X | X | X | X | X | X | X | X | X | X | X | X | X | X | X | |||||||
| Walkability | X | X | X | X | X | X | X | X | X | X | X | X | X | X | X | X | X | X | |||||
| Bikeability | X | X | X | X | X | X | |||||||||||||||||
| Block size | X | X | X | X | X | X | |||||||||||||||||
| Green space/public space ratio | X | X | X | X | X | X | X | X | X | X | X | ||||||||||||
| Transportation | Transportation network | X | X | X | X | X | X | X | X | X | X | X | X | X | X | X | X | X | X | X | |||
| Distance to transit | X | X | X | X | X | X | X | X | X | X | X | X | X | X | X | X | X | X | X | ||||
| Public transit accessibility (travel time to key destinations) | X | X | X | X | X | X | X | X | X | X | X | X | X | X | X | X | X | X | X | X | X | ||
| Frequency and reliability of transit services | X | X | X | X | X | X | X | X | X | X | X | X | |||||||||||
| Number of transit stations/stops nearby | X | X | X | X | X | X | X | X | X | X | X | X | X | X | X | ||||||||
| Ridership levels | X | X | X | X | X | X | X | X | X | X | |||||||||||||
| Parking facilities and demand management | X | X | X | X | X | X | X | X | X | ||||||||||||||
| Walking infrastructure (walking routes) | X | X | X | X | X | X | X | X | X | X | X | X | X | ||||||||||
| Cycling infrastructure (bike lanes, bike-sharing systems) | X | X | X | X | X | X | X | X | X | X | X | X | X | X | |||||||||
| Traffic congestion and road safety | X | X | X | X | X | X | X | X | X | X | X | X | X | X | X | X | |||||||
| Socio- economic | Age distribution | X | X | X | X | X | |||||||||||||||||
| Ethnicity and cultural diversity | X | X | X | ||||||||||||||||||||
| Vehicle ownership rates | X | X | X | X | X | X | X | X | |||||||||||||||
| Education level | X | X | |||||||||||||||||||||
| Household income and affordability | X | X | X | X | X | X | X | X | X | X | X | X | X | ||||||||||
| Employment accessibility | X | X | X | X | X | X | X | X | X | X | X | X | X | X | |||||||||
| Social equity in transport services | X | X | X | ||||||||||||||||||||
3. Methodological Framework
3.1. Research Question and Objectives
- Develop a conceptual SD-GIS framework that combines dynamic feedback modeling with spatial analysis to evaluate the impacts of urban form, transit accessibility, and parking policies on travel behavior and sustainability outcomes.
- Identify key sustainability indicators relevant to urban mobility by extracting and re-fining variables from the literature and case studies.
- Explore the interactions between land use, parking regulations, and transit investments in shaping travel behavior and greenhouse gas (GHG) emissions, using a qualitative system modeling approach.
- Apply the proposed framework to two case studies (Bridge-Bonaventure and Lachine-Est) to conceptually assess how variations in density, transit accessibility, and parking policies influence mode share and vehicle ownership trends.
- Generate qualitative policy recommendations based on the framework’s insights, providing guidance for integrating TOD principles, parking management, and active transportation infrastructure in sustainable urban development.
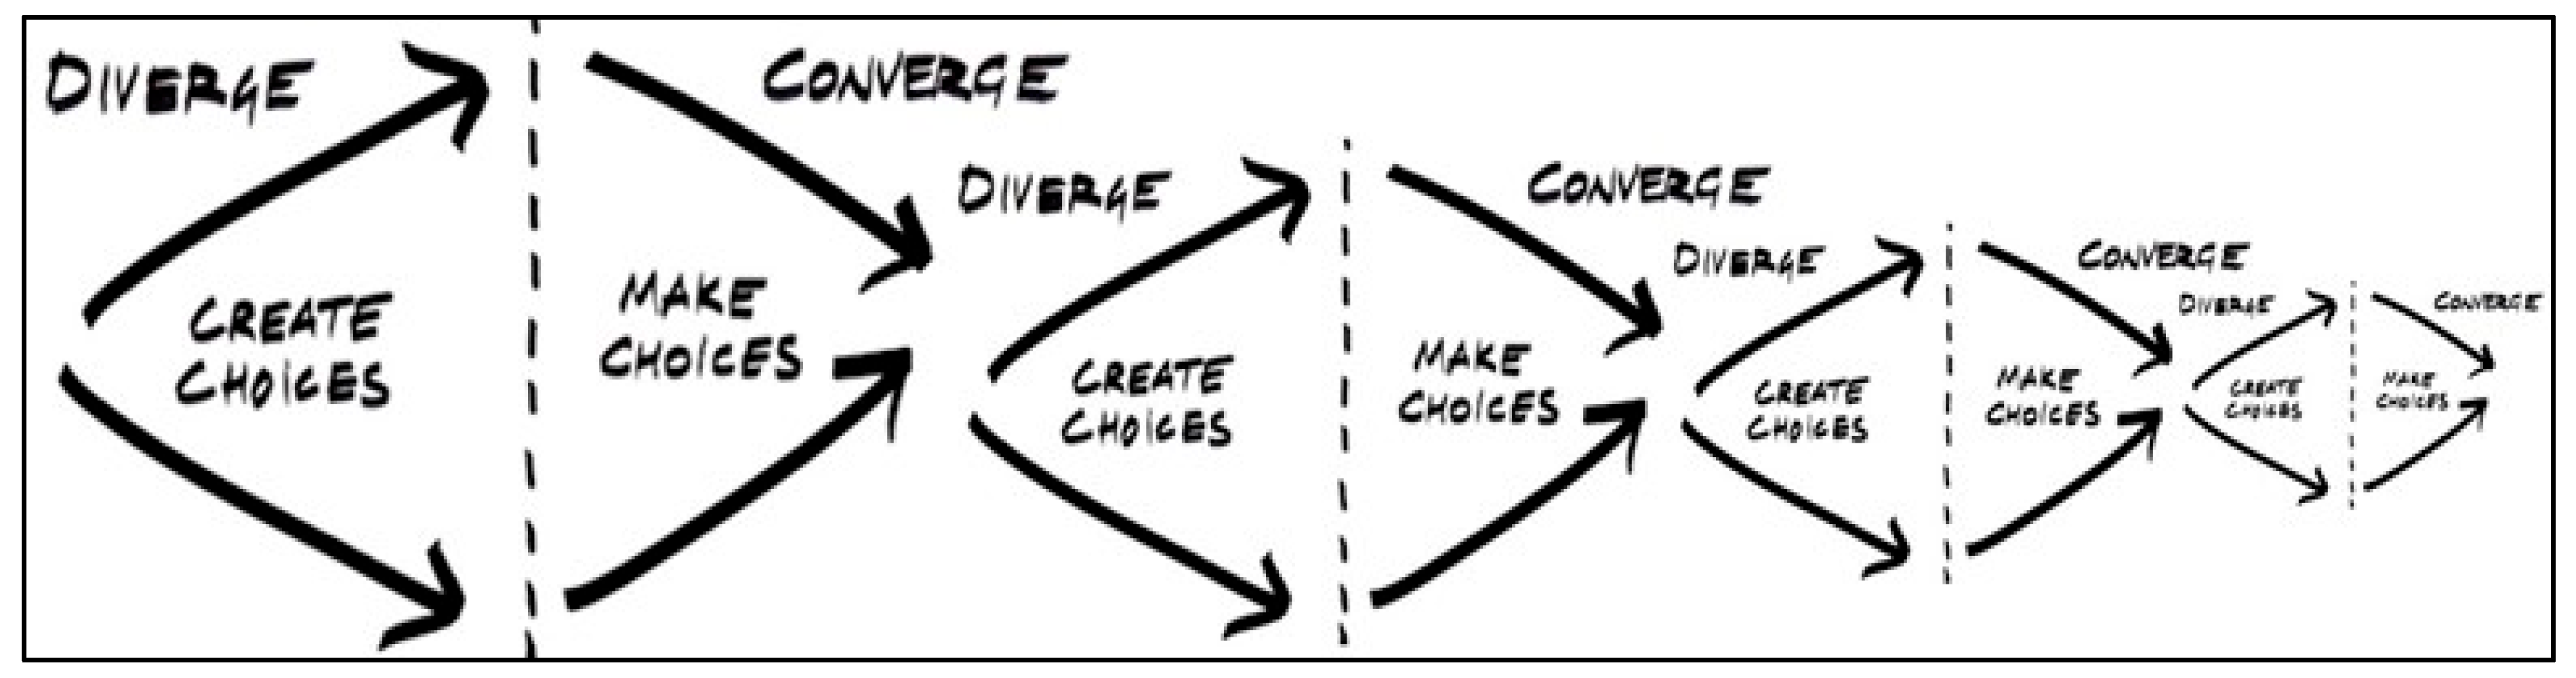
3.2. Design Thinking: Applying Divergent–Convergent
3.3. Modeling
- Capturing the temporal and feedback relationships among urban form, travel behavior, and sustainability indicators (e.g., greenhouse gas emissions, active transportation share).
- Quantifying spatial metrics, such as accessibility and proximity, to incorporate location-specific dynamics and spatial variations.
- Providing a tool for policymakers to evaluate the implications of urban development strategies, such as TOD and investments in active transportation infrastructure.
3.4. Integrating System Dynamics and GIS
- Urban Form Data (GIS): The framework begins with the collection and processing of spatial data related to urban form metrics such as land-use mix, density, street connectivity, and proximity to transportation infrastructure. These datasets are typically obtained from GIS sources like census data, OpenStreetMap, or municipal planning databases.
- Dynamic Inputs: The spatial metrics derived from the GIS analysis are converted into inputs for the System Dynamics model. These inputs represent critical variables such as transit accessibility, mode shares, and infrastructure quality, enabling a dynamic exploration of urban transportation systems.
- Proximity Planning: The final stage involves translating the model outputs into actionable insights for proximity planning. Policymakers and urban planners can use these findings to design and implement strategies that promote sustainable urban environments, such as TOD and investments in active transportation infrastructure development.
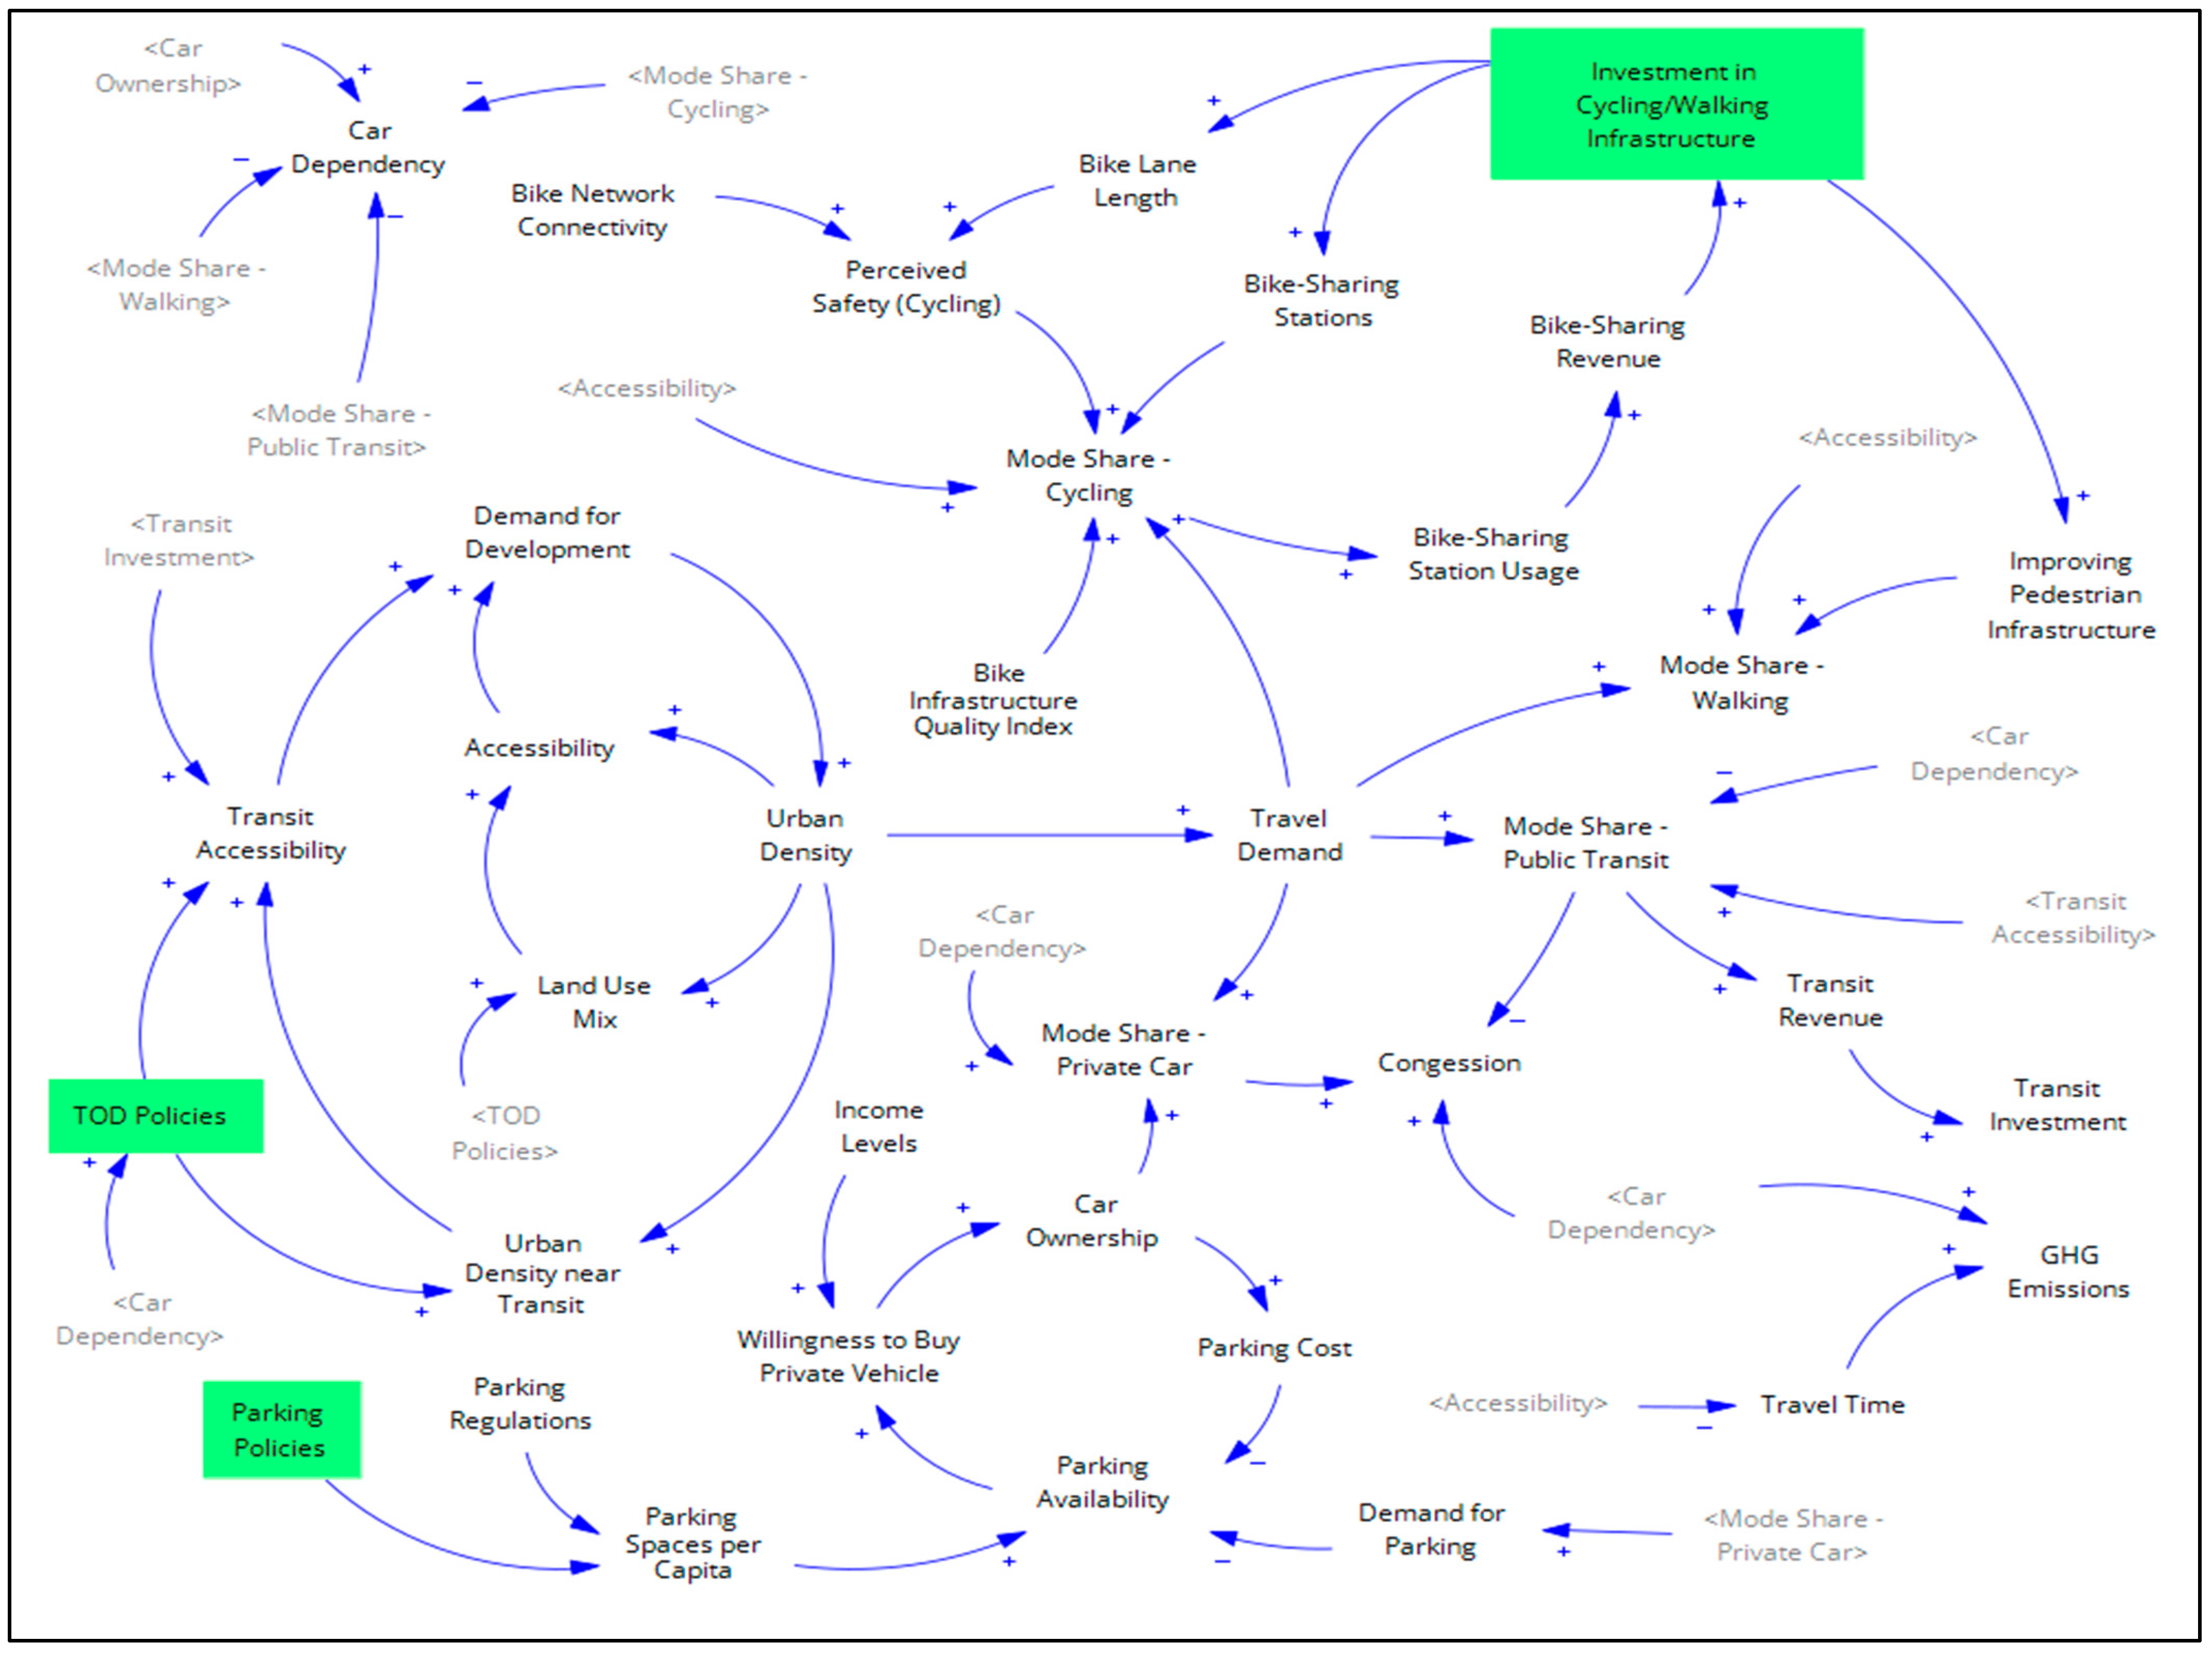
4. Model Structure
4.1. Urban Density and TOD Policies
4.1.1. The Role of TOD in Urban Density and Sustainable Mobility
4.1.2. Policy Implication: TOD in the Three Ds (Density, Diversity, and Design)
4.2. Parking Policies and Car Dependency
4.2.1. The Role of Parking Policies in Sustainable Urban Development
4.2.2. Breaking the Cycle: Parking Policies as a Regulatory Tool
- Reducing Parking Minimums in TOD Zones: Limiting mandatory parking requirements in high-density areas promotes TODs that prioritize sustainable mobility.
- Dynamic Parking Pricing: Adjusting parking fees based on demand discourages unnecessary car trips and increases the attractiveness of public transit.
- Caps on Parking Spaces Per Capita in New Developments: Placing restrictions on the number of parking spaces allocated per resident prevents an oversupply that reinforces vehicle dependency.
- Investment in Public Transit and Active Transportation: Expanding transit services and enhancing pedestrian and cycling infrastructure ensures that parking restrictions do not compromise accessibility but rather encourage multimodal transportation.
4.2.3. Policy Interference: Parking Policies
4.3. Investment in Active Transportation—Walking and Cycling
4.3.1. The Role of Active Transportation in Sustainable Urban Mobility
4.3.2. Strategies and Policy Levers
- Expanding Protected Bike Lanes and Sidewalks: Ensuring a safe, direct, and connected network for cyclists and pedestrians.
- Enhancing Bike-Sharing Networks: Increasing the availability of shared bikes to improve first-mile/last-mile connectivity.
- Improving Pedestrian Infrastructure: Prioritizing investments in sidewalks, crossings, and traffic-calming measures to enhance walkability.
- Integrating Active Transportation with Public Transit: Creating seamless connections between cycling, walking, and transit to reduce car dependency.
- Long-Term Funding and Policy Support for Active Modes: Allocating consistent financial resources to ensure infrastructure maintenance and expansion.
4.4. Integrating GIS into the System Dynamics Model: The Role of Spatial Analysis in TOD Policies
4.4.1. GIS Contributions to System Dynamics Modeling
- Defining and Analyzing TOD Zones involves identifying optimal areas for higher-density development by assessing their proximity to existing and planned transit stations [25,28,64]. It also requires evaluating land-use configurations to ensure that mixed-use developments are well integrated with accessibility and mobility objectives [25,43,62,64].
- Measuring Transit Accessibility Impacts includes analyzing how changes in density influence transit accessibility, thereby encouraging a shift toward public transportation [28,44,59,75,76,77]. Additionally, GIS-based network analysis is used to measure walking distances to transit stops and assess equitable access to transit services [36,103].
- Assessing Active Transportation Infrastructure entails evaluating walkability and bikeability within TOD zones to improve last-mile connectivity [37,92,95,96]. Furthermore, it involves identifying gaps in pedestrian and cycling infrastructure that could hinder the effectiveness of TOD initiatives [19,38,75].
- Optimizing Parking Policy Implementation requires conducting spatial analysis of parking distribution to inform strategies for reducing parking supply in TOD zones [11,12,83]. It also involves identifying areas where parking adjustments can help decrease car dependency while maintaining transit accessibility [78,82,90,91].
- Scenario-Based Planning for Sustainable Mobility includes simulating how variations in density and land-use configurations influence mode share, vehicle ownership, and GHG emissions [4,8]. Additionally, it involves testing different TOD and parking policy interventions to determine the most effective strategies for reducing automobile reliance [5,11,12,38].
4.4.2. Using GIS to Enhance TOD Policy Design
5. Case Study Context
- Bridge-Bonaventure: A planned Réseau express métropolitain (REM) station will be integrated within the development area, enhancing regional transit accessibility and reinforcing multimodal travel options [105].
6. Results and Discussion
7. Conclusions
8. Limitations
9. Future Research
Author Contributions
Funding
Data Availability Statement
Conflicts of Interest
Abbreviations
| CLD | Causal loop diagram |
| GHG | Greenhouse gas |
| GIS | Geographic Information Systems |
| SD | System Dynamics |
| SDGIS | System Dynamics Geographic Information Systems |
| SDM | System Dynamics Modeling |
| SFD | Stock and flow diagram |
| TOD | Transit-oriented development |
Appendix A
| Category | Indicator | Definition |
|---|---|---|
| Built Environment Indicators | Density | The concentration of people, jobs, or housing units within a given area, typically measured as population or employment per square kilometer or hectare. |
| Mixed land uses | The integration of different land uses (residential, commercial, institutional, recreational) within a given area to reduce travel distances and promote sustainable mobility. | |
| Design | The physical characteristics of the built environment, including street patterns, urban form, and spatial organization, which influence walkability and connectivity. | |
| Accessibility | The ease with which people can reach destinations such as jobs, schools, services, and transit stations within a reasonable amount of time. | |
| Proximity | The spatial distance between key locations, such as homes, workplaces, transit stops, and amenities, affecting travel behavior and mode choice. | |
| Walkability | The degree to which an area is pedestrian-friendly, based on factors such as sidewalk availability, street connectivity, land use mix, and perceived safety. | |
| Bikeability | The extent to which a built environment supports cycling, including the availability of bike lanes, bike-sharing systems, bike storage, and road safety measures. | |
| Block size | The average area of urban blocks, which influences street connectivity, pedestrian movement, and overall urban design. Smaller blocks typically enhance walkability. | |
| Green space/public space ratio | The proportion of land dedicated to parks, green spaces, and public open areas relative to the total urban area, affecting environmental sustainability and quality of life. | |
| Transport Indicators | Transportation network | The system of roads, railways, bike paths, and pedestrian walkways facilitate movement and connectivity within and between urban areas. |
| Distance to transit | The physical distance between a location (e.g., residence, workplace) and the nearest public transit stop or station, affecting transit usage. | |
| Public transit accessibility (travel time to key destinations) | The efficiency and ease with which people can use public transit to reach essential destinations like workplaces, schools, and shopping areas. | |
| Frequency and reliability of transit services | The consistency and availability of public transit services, including how often they run and how well they adhere to schedules. | |
| Number of transit stations/stops nearby | The density of public transit access points within a given area, influencing transit ridership and accessibility. | |
| Ridership levels | The number of passengers using public transit services over a given period, indicating the effectiveness of the transit system. | |
| Parking facilities and demand management | The availability and regulation of parking spaces to balance supply and demand, reduce congestion, and encourage sustainable transportation choices. | |
| Walking infrastructure (walking routes) | The presence of sidewalks, pedestrian paths, crosswalks, and pedestrian-friendly design features that facilitate safe and convenient walking. | |
| Cycling infrastructure (bike lanes, bike-sharing systems) | The presence of dedicated bike lanes, protected cycling paths, and bike-sharing programs that support and encourage cycling as a mode of transport. | |
| Traffic congestion and road safety | The level of traffic congestion and the safety conditions of roads, including accident rates, pedestrian safety, and overall mobility. | |
| Socio-Economic Indicators | Age distribution | The demographic composition of a population in terms of age groups, which influences travel behavior, housing needs, and mobility preferences. |
| Ethnicity and cultural diversity | The representation of different ethnic and cultural groups within a population, which can affect travel patterns, accessibility needs, and transportation equity. | |
| Vehicle ownership rates | The percentage of households or individuals who own one or more private vehicles, influencing mode choice and car dependency. | |
| Education level | The distribution of educational attainment within a population, which can correlate with employment locations, travel demand, and transit usage. | |
| Household income and affordability | The economic capacity of households, affecting housing location choices, transportation affordability, and access to services. | |
| Employment accessibility | The ease with which individuals can reach job opportunities using various modes of transport, affecting economic participation and commute patterns. | |
| Social equity in transport services | The fairness in the distribution of transportation resources and services across different demographic and socioeconomic groups, ensuring mobility access for all. |
Appendix B
| Category | Indicator | Variable in the Model |
|---|---|---|
| Built Environment Indicators | Density | Urban Density |
| Demand for Development | ||
| Mixed land uses | Land Use Mix | |
| Design | Accessibility | |
| Transport Indicators | Travel Mode Share—Public Transit | Distance to Transit |
| Transit Accessibility | ||
| Public Transit Trips | ||
| Private Car | Travel Mode Share—Private Vehicle | |
| Car Dependency | ||
| Parking Facilities and Demand Management | Parking Cost | |
| Parking Regulations | ||
| Parking Spaces per Capita | ||
| Public Parking Availability | ||
| Private Parking Availability | ||
| Travel Mode Share—Walking | Walking | |
| Pedestrian Infrastructure | ||
| Travel Mode Share—Biking | Biking | |
| Bike Infrastructure Quality Index | ||
| Bike Lane Length | ||
| Bike Network Connectivity | ||
| Bike-Sharing Usage | ||
| Bike-Sharing Stations | ||
| Perceived Safety (Cycling) | ||
| Travel Time | ||
| Congestion | ||
| Transit Investment | ||
| GHG Emission | ||
| Socio-Economic Indicators | Vehicle Ownership Rates | Willingness to Buy Private Vehicle |
| Household Income and Affordability | Income Level |
References
- May, A.D. Urban Transport and Sustainability: The Key Challenges. Int. J. Sustain. Transp. 2013, 7, 170–185. [Google Scholar] [CrossRef]
- Shah, K.J.; Pan, S.-Y.; Lee, I.; Kim, H.; You, Z.; Zheng, J.-M.; Chiang, P.-C. Green Transportation for Sustainability: Review of Current Barriers, Strategies, and Innovative Technologies. J. Clean. Prod. 2021, 326, 129392. [Google Scholar] [CrossRef]
- Chang, J.S. Models of the Relationship between Transport and Land-use: A Review. Transp. Rev. 2006, 26, 325–350. [Google Scholar] [CrossRef]
- Zahabi, S.A.H.; Miranda-Moreno, L.; Patterson, Z.; Barla, P.; Harding, C. Transportation Greenhouse Gas Emissions and Its Relationship with Urban Form, Transit Accessibility and Emerging Green Technologies: A Montreal Case Study. Procedia-Social Behav. Sci. 2012, 54, 966–978. [Google Scholar] [CrossRef]
- Langlois, M.; van Lierop, D.; Wasfi, R.A.; El-Geneidy, A.M. Chasing Sustainability: Do New Transit-Oriented Development Residents Adopt More Sustainable Modes of Transportation? Transp. Res. Rec. 2015, 2531, 83–92. [Google Scholar] [CrossRef]
- Newman, P. Planning for Transit Oriented Development in Australian Cities. In Environment Design Guide; Royal Australian Institute of Architects: Melbourne, Australia, 2007; pp. 1–11. [Google Scholar]
- Handy, S. Methodologies for Exploring the Link between Urban Form and Travel Behavior. Transp. Res. Part D Transp. Environ. 1996, 1, 151–165. [Google Scholar] [CrossRef]
- Ercan, T.; Onat, N.C.; Tatari, O. Investigating Carbon Footprint Reduction Potential of Public Transportation in United States: A System Dynamics Approach. J. Clean. Prod. 2016, 133, 1260–1276. [Google Scholar] [CrossRef]
- Karjalainen, L.E.; Juhola, S. Urban Transportation Sustainability Assessments: A Systematic Review of Literature. Transp. Rev. 2021, 41, 659–684. [Google Scholar] [CrossRef]
- Kennedy, C.; Miller, E.; Shalaby, A.; Maclean, H.; Coleman, J. The Four Pillars of Sustainable Urban Transportation. Transp. Rev. 2005, 25, 393–414. [Google Scholar] [CrossRef]
- Albalate, D.; Gragera, A. The Impact of Curbside Parking Regulations on Car Ownership. Reg. Sci. Urban Econ. 2020, 81, 103518. [Google Scholar] [CrossRef]
- Yan, X.; Levine, J.; Marans, R. The Effectiveness of Parking Policies to Reduce Parking Demand Pressure and Car Use. Transp. Policy 2019, 73, 41–50. [Google Scholar] [CrossRef]
- Belzer, D.; Autler, G. Transit Oriented Development: Moving from Rhetoric to Reality; Brookings Institution Center on Urban and Metropolitan Policy: Washington, DC, USA, 2002. [Google Scholar]
- Miller, P.; de Barros, A.G.; Kattan, L.; Wirasinghe, S.C. Public Transportation and Sustainability: A Review. KSCE J. Civ. Eng. 2016, 20, 1076–1083. [Google Scholar] [CrossRef]
- Knowles, R.D.; Ferbrache, F.; Nikitas, A. Transport’s Historical, Contemporary and Future Role in Shaping Urban Development: Re-Evaluating Transit Oriented Development. Cities 2020, 99, 102607. [Google Scholar] [CrossRef]
- Suzuki, H.; Cervero, R.; Iuchi, K. Transforming Cities with Transit: Transit and Land-Use Integration for Sustainable Urban Development; World Bank Publications: Washington, DC, USA, 2013. [Google Scholar]
- Krizek, K.J. Residential Relocation and Changes in Urban Travel: Does Neighborhood-Scale Urban Form Matter? J. Am. Plan. Assoc. 2003, 69, 265–281. [Google Scholar] [CrossRef]
- Padeiro, M.; Louro, A.; da Costa, N.M. Transit-Oriented Development and Gentrification: A Systematic Review. Transp. Rev. 2019, 39, 733–754. [Google Scholar] [CrossRef]
- Campos Ferreira, M.; Dias Costa, P.; Abrantes, D.; Hora, J.; Felício, S.; Coimbra, M.; Galvão Dias, T. Identifying the Determinants and Understanding Their Effect on the Perception of Safety, Security, and Comfort by Pedestrians and Cyclists: A Systematic Review. Transp. Res. Part F Traffic Psychol. Behav. 2022, 91, 136–163. [Google Scholar] [CrossRef]
- Cervero, R.; Sullivan, C. Green TODs: Marrying Transit-Oriented Development and Green Urbanism. Int. J. Sustain. Dev. World Ecol. 2011, 18, 210–218. [Google Scholar] [CrossRef]
- Ibraeva, A.; Correia, G.H.d.A.; Silva, C.; Antunes, A.P. Transit-Oriented Development: A Review of Research Achievements and Challenges. Transp. Res. Part A Policy Pract. 2020, 132, 110–130. [Google Scholar] [CrossRef]
- Loo, B.P.Y.; du Verle, F. Transit-Oriented Development in Future Cities: Towards a Two-Level Sustainable Mobility Strategy. Int. J. Urban Sci. 2017, 21, 54–67. [Google Scholar] [CrossRef]
- Ewing, R.; Cervero, R. “Does Compact Development Make People Drive Less?” The Answer Is Yes. J. Am. Plan. Assoc. 2017, 83, 19–25. [Google Scholar] [CrossRef]
- Næss, P. Urban Form and Travel Behavior: Experience from a Nordic Context. J. Transp. Land Use 2012, 5, 21–45. [Google Scholar] [CrossRef]
- Cervero, R. Walk-and-Ride: Factors Influencing Pedestrian Access to Transit. J. Public Transp. 2001, 3, 1–23. [Google Scholar] [CrossRef]
- Frank, L.D.; Pivo, G. Impacts of Mixed Use and Density on Utilization of Three Modes of Travel: Single-Occupant Vehicle, Transit, and Walking. Transp. Res. Rec. 1994, 1466, 44–52. [Google Scholar]
- Haider, M.; El-Geneidy, A. Public Transport and the Built Environment. In The Routledge Handbook of Public Transport; Routledge: London, UK, 2021; pp. 322–341. [Google Scholar]
- Cervero, R.; Kockelman, K. Travel Demand and the 3Ds: Density, Diversity, and Design. Transp. Res. Part D Transp. Environ. 1997, 2, 199–219. [Google Scholar] [CrossRef]
- Shepherd, S.P. A Review of System Dynamics Models Applied in Transportation. Transp. B Transp. Dyn. 2014, 2, 83–105. [Google Scholar] [CrossRef]
- Stroh, D.P. Systems Thinking for Social Change: A Practical Guide to Solving Complex Problems, Avoiding Unintended Consequences, and Achieving Lasting Results; Chelsea Green Publishing: Chelsea, VT, USA, 2015. [Google Scholar]
- Forrester, J.W. Counterintuitive Behavior of Social Systems. Theory Decis. 1971, 2, 109–140. [Google Scholar] [CrossRef]
- Fontoura, W.B.; Ribeiro, G.M.; Chaves, G.D.L.D. Brazilian Megacities: Quantifying the Impacts of the Brazilian Urban Mobility Policy. Proc. Inst. Civ. Eng. Munic. Eng. 2022, 175, 162–174. [Google Scholar] [CrossRef]
- Han, J.; Hayashi, Y.; Cao, X.; Imura, H. Application of an Integrated System Dynamics and Cellular Automata Model for Urban Growth Assessment: A Case Study of Shanghai, China. Landsc. Urban Plann. 2009, 91, 133–141. [Google Scholar] [CrossRef]
- Xu, Z.; Coors, V. Combining System Dynamics Model, GIS and 3D Visualization in Sustainability Assessment of Urban Residential Development. Build. Environ. 2012, 47, 272–287. [Google Scholar] [CrossRef]
- Guan, D.; Gao, W.; Su, W.; Li, H.; Hokao, K. Modeling and Dynamic Assessment of Urban Economy-Resource-Environment System with a Coupled System Dynamics—Geographic Information System Model. Ecol. Indic. 2011, 11, 1333–1344. [Google Scholar] [CrossRef]
- Liu, S.; Zhu, X. An Integrated GIS Approach to Accessibility Analysis. Trans. GIS 2004, 8, 45–62. [Google Scholar] [CrossRef]
- Carr, L.J.; Dunsiger, S.I.; Marcus, B.H. Walk ScoreTM As a Global Estimate of Neighborhood Walkability. Am. J. Prev. Med. 2010, 39, 460–463. [Google Scholar] [CrossRef] [PubMed]
- Chatman, D.G. Does TOD Need the T?: On the Importance of Factors Other Than Rail Access. J. Am. Plan. Assoc. 2013, 79, 17–31. [Google Scholar] [CrossRef]
- Mavoa, S.; Witten, K.; McCreanor, T.; O’Sullivan, D. GIS Based Destination Accessibility via Public Transit and Walking in Auckland, New Zealand. J. Transp. Geogr. 2012, 20, 15–22. [Google Scholar] [CrossRef]
- He, C.; Shi, P.; Chen, J.; Li, X.; Pan, Y.; Li, J.; Li, Y.; Li, J. Developing Land Use Scenario Dynamics Model by the Integration of System Dynamics Model and Cellular Automata Model. Sci. China Ser. D Earth Sci. 2005, 48, 1979–1989. [Google Scholar] [CrossRef]
- Pokharel, R.; Miller, E.J.; Chapple, K. Modeling Car Dependency and Policies towards Sustainable Mobility: A System Dynamics Approach. Transp. Res. Part D Transp. Environ. 2023, 125, 103978. [Google Scholar] [CrossRef]
- AlKhereibi, A.H.; Onat, N.; Furlan, R.; Grosvald, M.; Awwaad, R.Y. Underlying Mechanisms of Transit-Oriented Development: A Conceptual System Dynamics Model in Qatar. Designs 2022, 6, 71. [Google Scholar] [CrossRef]
- Robillard, A.; Boisjoly, G.; van Lierop, D. Transit-Oriented Development and Bikeability: Classifying Public Transport Station Areas in Montreal, Canada. Transp. Policy 2024, 148, 79–91. [Google Scholar] [CrossRef]
- Zhu, P.; Wang, K.; Ho, S.-N.; Tan, X. How Is Commute Mode Choice Related to Built Environment in a High-Density Urban Context? Cities 2023, 134, 104180. [Google Scholar] [CrossRef]
- Dorosan, M.; Dailisan, D.; Valenzuela, J.F.; Monterola, C. Use of Machine Learning in Understanding Transport Dynamics of Land Use and Public Transportation in a Developing City. Cities 2024, 144, 104587. [Google Scholar] [CrossRef]
- Monkkonen, P.; Guerra, E.; Montejano Escamilla, J.; Caudillo Cos, C.; Tapia-McClung, R. A Global Analysis of Land Use Regulation, Urban Form, and Greenhouse Gas Emissions. Cities 2024, 147, 104801. [Google Scholar] [CrossRef]
- Haseli, G.; Deveci, M.; Isik, M.; Gokasar, I.; Pamucar, D.; Hajiaghaei-Keshteli, M. Providing Climate Change Resilient Land-Use Transport Projects with Green Finance Using Z Extended Numbers Based Decision-Making Model. Expert Syst. Appl. 2024, 243, 122858. [Google Scholar] [CrossRef]
- Elmarakby, E.; Elkadi, H. Impact of Urban Morphology on Urban Heat Island in Manchester’s Transit-Oriented Development. J. Clean. Prod. 2024, 434, 140009. [Google Scholar] [CrossRef]
- Liao, C.; Scheuer, B. Evaluating the Performance of Transit-Oriented Development in Beijing Metro Station Areas: Integrating Morphology and Demand into the Node-Place Model. J. Transp. Geogr. 2022, 100, 103333. [Google Scholar] [CrossRef]
- Yang, W. The Nonlinear Effects of Multi-Scale Built Environments on CO2 Emissions from Commuting. Transp. Res. Part D Transp. Environ. 2023, 118, 103736. [Google Scholar] [CrossRef]
- Berrill, P.; Nachtigall, F.; Javaid, A.; Milojevic-Dupont, N.; Wagner, F.; Creutzig, F. Comparing Urban Form Influences on Travel Distance, Car Ownership, and Mode Choice. Transp. Res. Part D Transp. Environ. 2024, 128, 104087. [Google Scholar] [CrossRef]
- Nachtigall, F.; Wagner, F.; Berrill, P.; Creutzig, F. Built Environment and Travel: Tackling Non-Linear Residential Self-Selection with Double Machine Learning. Transp. Res. Part D Transp. Environ. 2025, 140, 104593. [Google Scholar] [CrossRef]
- Huang, P.; Qu, Y.; Shu, B.; Huang, T. Decoupling Relationship between Urban Land Use Morphology and Carbon Emissions: Evidence from the Yangtze River Delta Region, China. Ecol. Inform. 2024, 81, 102614. [Google Scholar] [CrossRef]
- Zeng, C.; Chai, B.; Stringer, L.C.; Li, Y.; Wang, Z.; Deng, X.; Ma, B.; Ren, J. Land-Based Transportation Influences Carbon Emission in Urbanized China: A Regional Spatial Spillover Perspective. Sustain. Cities Soc. 2024, 100, 105008. [Google Scholar] [CrossRef]
- Pekdemir, M.I.; Altintasi, O.; Ozen, M. Assessing the Impact of Public Transportation, Bicycle Infrastructure, and Land Use Parameters on a Small-Scale Bike-Sharing System: A Case Study of Izmir, Türkiye. Sustain. Cities Soc. 2024, 101, 105085. [Google Scholar] [CrossRef]
- Olsen, J.R.; Nicholls, N.; Whitley, E.; Mitchell, R. Association between Local Amenities, Travel Behaviours and Urban Planning: A Spatial Analysis of a Nationwide UK Household Panel Study. J. Transp. Health 2024, 36, 101784. [Google Scholar] [CrossRef]
- Fan, N.; Kockelman, K.M.; Caballero, P.; Hawkins, J.; Chen, X. How Does Upzoning Impact Land Use and Transport: A Case Study of Seattle. Transp. Plan. Technol. 2024, 47, 656–680. [Google Scholar] [CrossRef]
- Heroy, S.; Loaiza, I.; Pentland, A.; O’Clery, N. Are Neighbourhood Amenities Associated with More Walking and Less Driving? Yes, but Predominantly for the Wealthy. Environ. Plan. B Urban Anal. City Sci. 2023, 50, 958–982. [Google Scholar] [CrossRef]
- Jama, T.; Tenkanen, H.; Lönnqvist, H.; Joutsiniemi, A. Compact City and Urban Planning: Correlation between Density and Local Amenities. Environ. Plan. B Urban Anal. City Sci. 2025, 52, 44–58. [Google Scholar] [CrossRef]
- Loh, V.; Sahlqvist, S.; Veitch, J.; Walsh, A.; Cerin, E.; Salmon, J.; Mavoa, S.; Timperio, A. Active Travel, Public Transport and the Built Environment in Youth: Interactions with Perceived Safety, Distance to School, Age and Gender. J. Transp. Health 2024, 38, 101895. [Google Scholar] [CrossRef]
- Nenseth, V.; Røe, P.G. Sustainable Suburban Mobilities—Planning Practices and Paradoxes. Eur. Plan. Stud. 2024, 32, 1059–1077. [Google Scholar] [CrossRef]
- Rabiei, N.; Nasiri, F.; Eicker, U. Multistage Transit-Oriented Development Assessment: A Case Study of the Montréal Metro System. J. Urban Plan. Dev. 2022, 148, 05022024. [Google Scholar] [CrossRef]
- Sun, Y.; Han, B.; Lu, F. An Overview of TOD Level Assessment Around Rail Transit Stations. Urban Rail Transit. 2024, 10, 1–12. [Google Scholar] [CrossRef]
- Zhu, P.; Tan, X.; Zhao, S.; Shi, S.; Wang, M. Land Use Regulations, Transit Investment, and Commuting Preferences. Land Use Policy 2022, 122, 106343. [Google Scholar] [CrossRef]
- Cucuzzella, C. Systems Thinking and Modeling. In Proceedings of the ENCS 691 System Modelling for Sustainable Neighbourhood Development, Montreal, QC, Canada, May 2022. [Google Scholar]
- Pfaffenbichler, P.; Emberger, G.; Shepherd, S. A System Dynamics Approach to Land Use Transport Interaction Modelling: The Strategic Model MARS and Its Application. Syst. Dyn. Rev. 2010, 26, 262–282. [Google Scholar] [CrossRef]
- Pejic Bach, M.; Tustanovski, E.; Ip, A.W.; Yung, K.-L.; Roblek, V. System Dynamics Models for the Simulation of Sustainable Urban Development: A Review and Analysis and the Stakeholder Perspective. Kybernetes 2020, 49, 460–504. [Google Scholar] [CrossRef]
- Oliveira, V.T.d.; Teixeira, D.; Rocchi, L.; Boggia, A. Geographic Information System Applied to Sustainability Assessments: Conceptual Structure and Research Trends. ISPRS Int. J. Geo-Inf. 2022, 11, 569. [Google Scholar] [CrossRef]
- Malaker, T.; Meng, Q. Urban Disparity Analytics Using GIS: A Systematic Review. Sustainability 2024, 16, 5956. [Google Scholar] [CrossRef]
- Forrester, J.W. Urban Dynamics. IMR Ind. Manag. Rev. 1970, 11, 67. [Google Scholar] [CrossRef]
- Abbas, K.A.; Bell, M.G. System Dynamics Applicability to Transportation Modeling. Transp. Res. Part A Policy Pract. 1994, 28, 373–390. [Google Scholar] [CrossRef]
- Fabolude, G.; Knoble, C.; Vu, A.; Yu, D. Smart Cities, Smart Systems: A Comprehensive Review of System Dynamics Model Applications in Urban Studies in the Big Data Era. Geogr. Sustain. 2025, 6, 100246. [Google Scholar] [CrossRef]
- Cervero, R. Transit-Oriented Development in the United States: Experiences, Challenges, and Prospects; The National Academies Press: Washington, DC, USA, 2004. [Google Scholar]
- Cucuzzella, C.; Owen, J.; Goubran, S.; Walker, T. A TOD Index Integrating Development Potential, Economic Vibrancy, and Socio-Economic Factors for Encouraging Polycentric Cities. Cities 2022, 131, 103980. [Google Scholar] [CrossRef]
- Newman, P.; Kosonen, L.; Kenworthy, J. Theory of Urban Fabrics: Planning the Walking, Transit/Public Transport and Automobile/Motor Car Cities for Reduced Car Dependency. Town Plan. Rev. 2016, 87, 429–458. [Google Scholar] [CrossRef]
- Cervero, R. Built Environments and Mode Choice: Toward a Normative Framework. Transp. Res. Part D Transp. Environ. 2002, 7, 265–284. [Google Scholar] [CrossRef]
- Ewing, R.; Cervero, R. Travel and the Built Environment: A Meta-Analysis. J. Am. Plan. Assoc. 2010, 76, 265–294. [Google Scholar] [CrossRef]
- Handy, S.; Cao, X.; Mokhtarian, P. Correlation or Causality between the Built Environment and Travel Behavior? Evidence from Northern California. Transp. Res. Part D Transp. Environ. 2005, 10, 427–444. [Google Scholar] [CrossRef]
- Van Acker, V.; Witlox, F. Car Ownership as a Mediating Variable in Car Travel Behaviour Research Using a Structural Equation Modelling Approach to Identify Its Dual Relationship. J. Transp. Geogr. 2010, 18, 65–74. [Google Scholar] [CrossRef]
- Marsden, G. The Evidence Base for Parking Policies—A Review. Transp. Policy 2006, 13, 447–457. [Google Scholar] [CrossRef]
- Florian, M.; Los, M. Impact of the Supply of Parking Spaces on Parking Lot Choice. Transp. Res. Part B Methodol. 1980, 14, 155–163. [Google Scholar] [CrossRef]
- Shoup, D.C. Cruising for Parking. Transp. Policy 2006, 13, 479–486. [Google Scholar] [CrossRef]
- Guo, Z. Residential Street Parking and Car Ownership: A Study of Households With Off-Street Parking in the New York City Region. J. Am. Plan. Assoc. 2013, 79, 32–48. [Google Scholar] [CrossRef]
- He, S.Y.; Thøgersen, J. The Impact of Attitudes and Perceptions on Travel Mode Choice and Car Ownership in a Chinese Megacity: The Case of Guangzhou. Res. Transp. Econ. 2017, 62, 57–67. [Google Scholar] [CrossRef]
- Verma, M.; Manoj, M.; Verma, A. Analysis of the Influences of Attitudinal Factors on Car Ownership Decisions among Urban Young Adults in a Developing Country like India. Transp. Res. Part F Traffic Psychol. Behav. 2016, 42, 90–103. [Google Scholar] [CrossRef]
- Anowar, S.; Eluru, N.; Miranda-Moreno, L.F. Analysis of Vehicle Ownership Evolution in Montreal, Canada Using Pseudo Panel Analysis. Transportation 2016, 43, 531–548. [Google Scholar] [CrossRef]
- Ding, C.; Wang, D.; Liu, C.; Zhang, Y.; Yang, J. Exploring the Influence of Built Environment on Travel Mode Choice Considering the Mediating Effects of Car Ownership and Travel Distance. Transp. Res. Part A Policy Pract. 2017, 100, 65–80. [Google Scholar] [CrossRef]
- Christiansen, P.; Engebretsen, Ø.; Fearnley, N.; Usterud Hanssen, J. Parking Facilities and the Built Environment: Impacts on Travel Behaviour. Transp. Res. Part A Policy Pract. 2017, 95, 198–206. [Google Scholar] [CrossRef]
- Parmar, J.; Das, P.; Dave, S.M. Study on Demand and Characteristics of Parking System in Urban Areas: A Review. J. Traffic Transp. Eng. 2020, 7, 111–124. [Google Scholar] [CrossRef]
- Brown, J.; Hess, D.B.; Shoup, D. Unlimited Access. Transportation 2001, 28, 233–267. [Google Scholar] [CrossRef]
- Litman, T. Factors Affecting Parking Demand and Requirements. In Parking Management Best Practices; Routledge: London, UK, 2005; ISBN 978-1-351-17954-6. [Google Scholar]
- Pucher, J.; Dill, J.; Handy, S. Infrastructure, Programs, and Policies to Increase Bicycling: An International Review. Prev. Med. 2010, 50, S106–S125. [Google Scholar] [CrossRef]
- Sloman, L.; Cavill, N.; Cope, A.; Muller, L.; Kennedy, A. Analysis and Synthesis of Evidence on the Effects of Investment in Six Cycling Demonstration Towns; Department for Transport: London, UK, 2009.
- Hull, A.; O’Holleran, C. Bicycle Infrastructure: Can Good Design Encourage Cycling? Urban Plan. Transp. Res. 2014, 2, 369–406. [Google Scholar] [CrossRef]
- Southworth, M. Designing the Walkable City. J. Urban Plan. Dev. 2005, 131, 246–257. [Google Scholar] [CrossRef]
- Lawson, A.R.; Pakrashi, V.; Ghosh, B.; Szeto, W.Y. Perception of Safety of Cyclists in Dublin City. Accid. Anal. Prev. 2013, 50, 499–511. [Google Scholar] [CrossRef]
- Saelens, B.E.; Handy, S.L. Built Environment Correlates of Walking: A Review. Med. Sci. Sports Exerc. 2008, 40, S550–S566. [Google Scholar] [CrossRef] [PubMed]
- Buehler, R.; Pucher, J.; Gerike, R.; Götschi, T. Reducing Car Dependence in the Heart of Europe: Lessons from Germany, Austria, and Switzerland. Transp. Rev. 2017, 37, 4–28. [Google Scholar] [CrossRef]
- Laakso, S. Giving up Cars—The Impact of a Mobility Experiment on Carbon Emissions and Everyday Routines. J. Clean. Prod. 2017, 169, 135–142. [Google Scholar] [CrossRef]
- Mun Ng, K.; Wah Yuen, C.; Chuen Onn, C.; Ibtishamiah Ibrahim, N. Urban Mobility Mode Shift to Active Transport: Sociodemographic Dependency and Potential Greenhouse Gas Emission Reduction. SAGE Open 2024, 14, 21582440241228644. [Google Scholar] [CrossRef]
- Neves, A.; Brand, C. Assessing the Potential for Carbon Emissions Savings from Replacing Short Car Trips with Walking and Cycling Using a Mixed GPS-Travel Diary Approach. Transp. Res. Part A Policy Pract. 2019, 123, 130–146. [Google Scholar] [CrossRef]
- Ewing, R.H. Characteristics, Causes, and Effects of Sprawl: A Literature Review. In Urban Ecology: An International Perspective on the Interaction Between Humans and Nature; Marzluff, J.M., Shulenberger, E., Endlicher, W., Alberti, M., Bradley, G., Ryan, C., Simon, U., ZumBrunnen, C., Eds.; Springer: Boston, MA, USA, 2008; pp. 519–535. ISBN 978-0-387-73412-5. [Google Scholar]
- Leslie, E.; Coffee, N.; Frank, L.; Owen, N.; Bauman, A.; Hugo, G. Walkability of Local Communities: Using Geographic Information Systems to Objectively Assess Relevant Environmental Attributes. Health Place 2007, 13, 111–122. [Google Scholar] [CrossRef] [PubMed]
- Ville de Montréal. Un Programme Particulier D’urbanisme Pour L’écoquartier Lachine-Est. June 2023. Available online: https://montreal.ca/articles/un-programme-particulier-durbanisme-pour-lecoquartier-lachine-est-20856 (accessed on 29 January 2025).
- Ville de Montréal. The Bridge-Bonaventure Area: A Community to Revitalize. March 2023. Available online: https://montreal.ca/en/articles/bridge-bonaventure-area-community-to-revitalize-46916 (accessed on 29 January 2025).
- Autorité Régionale de Transport Métropolitain Projet du Grand Sud-Ouest de Montréal. Available online: https://www.artm.quebec/grands-projets/projets-dinfrastructure/projet-du-grand-sud-ouest-de-montreal/ (accessed on 29 January 2025).


| SN | Variables and Relationship | Causal Mechanism | Supporting Literature Examples |
|---|---|---|---|
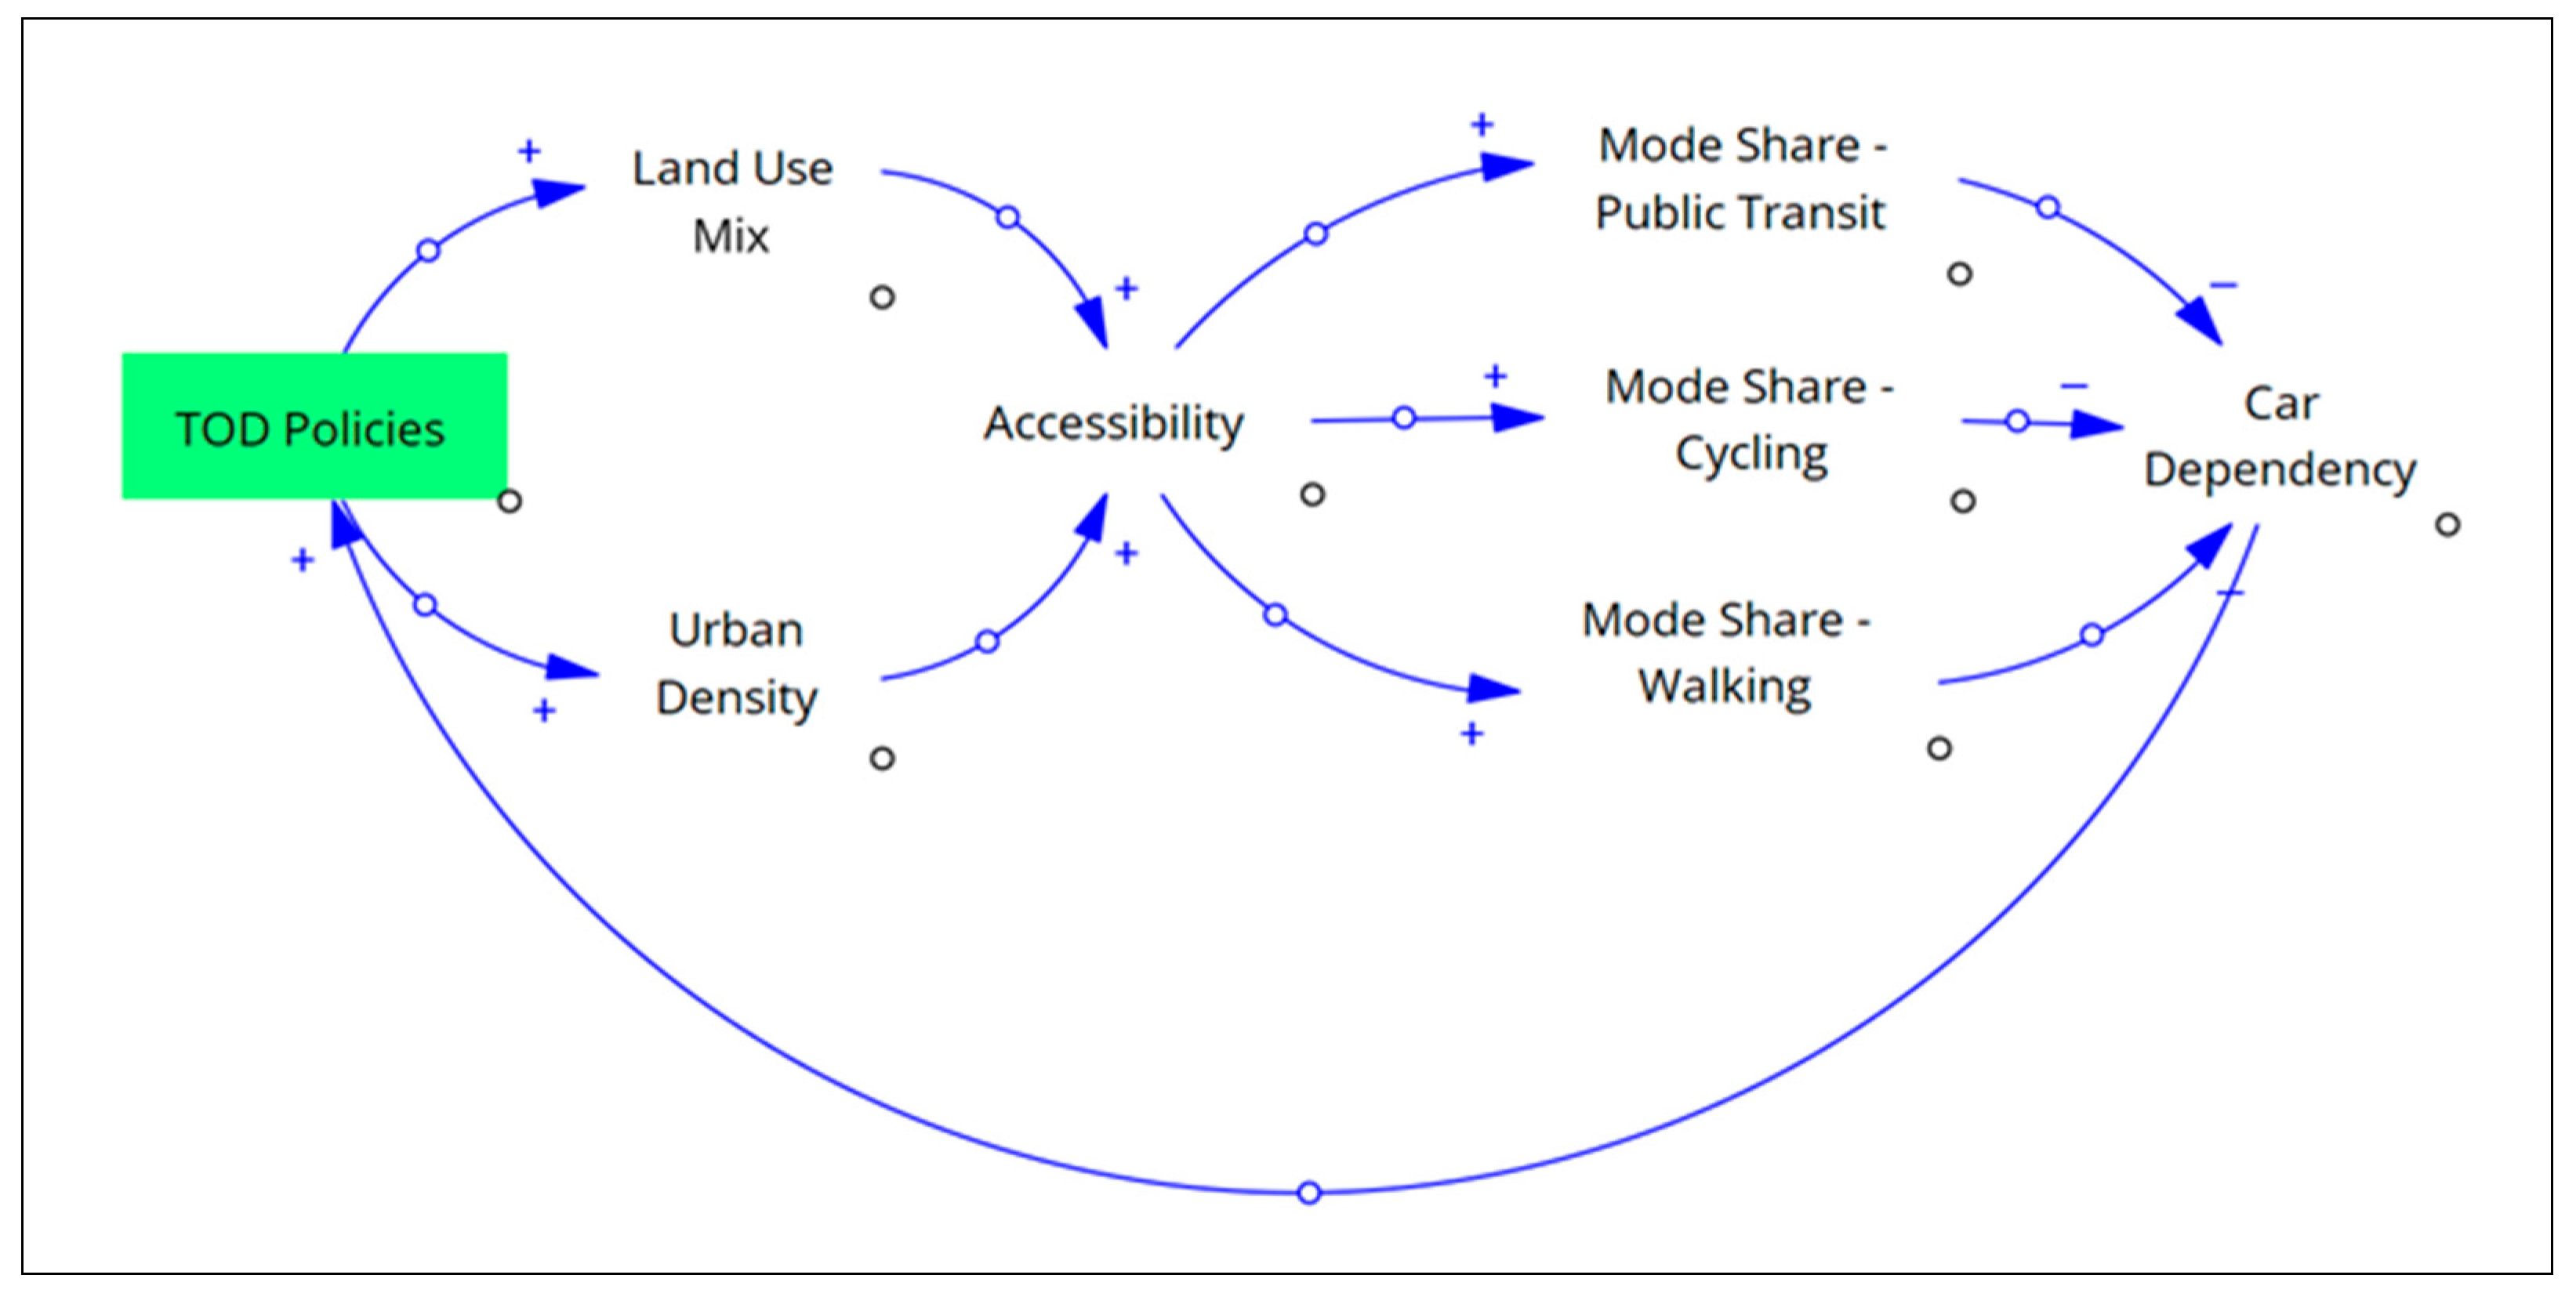
| 1 | Density near transit hubs → (+) Accessibility | Increasing density near transit hubs enhances accessibility to public transportation. | [28,75] |
| 2 | Accessibility → (+) Public transit ridership | Improved transit accessibility encourages more people to use public transit. | [76,77] |
| 3 | More people using transit and active modes → (−) Car dependency | A higher share of transit and active modes reduces reliance on private vehicles. | [4,14] |
| 4 | More people using transit and active modes → (−) Car dependency | Reduced reliance on private vehicles leads to a decline in car ownership. | [78,79] |
| 5 | More car dependency → (+) Justifies further TOD investment | More car dependency supports the essence of further investment in TOD policies. | [21,28] |
| SN | Variables and Relationship | Causal Mechanism | Supporting Literature Examples |
|---|---|---|---|
| 1 | Parking spaces per capita → (+) Parking availability | More parking spaces increase overall parking supply. | [81,82] |
| 2 | Parking availability → (+) Willingness to buy a private vehicle | Easier parking access encourages car ownership. | [12,83] |
| 3 | Willingness to buy a private vehicle → (+) Car ownership | Higher willingness to buy a car leads to increased vehicle ownership. | [84,85] |
| 4 | Car ownership → (+) Mode share for private cars | Increased vehicle ownership raises the percentage of car-based travel. | [14,86,87] |
| 5 | Mode share for private cars → (+) Demand for parking | A higher proportion of trips made by car increases parking demand. | [88,89] |
| 6 | Demand for parking → (−) Parking availability | Higher parking demand leads to lower parking spaces availability. | [79,90,91] |
| SN | Variables and Relationship | Causal Mechanism | Supporting Literature Examples |
|---|---|---|---|
| 1 | Investment in cycling/walking infrastructure → (+) Improved pedestrian and cycling infrastructure | Expanding bike lanes and pedestrian pathways enhance connectivity and safety. | [92,93] |
| 2 | Improved pedestrian and cycling infrastructure → (+) Perceived safety for walking and cycling | Dedicated infrastructure reduces risks, making active travel more attractive. | [94,95] |
| 3 | Perceived safety for walking and cycling → (+) Mode share for walking and cycling | Increased safety encourages greater adoption of non-motorized modes. | [96,97] |
| 4 | Higher walking and cycling mode share → (−) Car dependency | Increased active travel reduces reliance on private vehicles. | [75,98] |
| 5 | Reduced car dependency → (+) Less GHG emissions & congestion | Fewer car trips result in lower emissions and less road congestion. | [99,100,101] |
| 6 | Lower emissions and congestion → (+) Further lower investment needed in active transportation | Positive environmental outcomes justify that sufficient funding for sustainable mobility has been placed and lower funding is needed in the future. | [5,102] |
Disclaimer/Publisher’s Note: The statements, opinions and data contained in all publications are solely those of the individual author(s) and contributor(s) and not of MDPI and/or the editor(s). MDPI and/or the editor(s) disclaim responsibility for any injury to people or property resulting from any ideas, methods, instructions or products referred to in the content. |
© 2025 by the authors. Licensee MDPI, Basel, Switzerland. This article is an open access article distributed under the terms and conditions of the Creative Commons Attribution (CC BY) license (https://creativecommons.org/licenses/by/4.0/).
Share and Cite
Farnood, A.; Eicker, U.; Cucuzzella, C.; Gopakumar, G.; Khorramisarvestani, S. Sustainability Assessment Framework for Urban Transportation Combining System Dynamics Modeling and GIS; A TOD and Parking Policy Approach. Smart Cities 2025, 8, 107. https://doi.org/10.3390/smartcities8040107
Farnood A, Eicker U, Cucuzzella C, Gopakumar G, Khorramisarvestani S. Sustainability Assessment Framework for Urban Transportation Combining System Dynamics Modeling and GIS; A TOD and Parking Policy Approach. Smart Cities. 2025; 8(4):107. https://doi.org/10.3390/smartcities8040107
Chicago/Turabian StyleFarnood, Ahad, Ursula Eicker, Carmela Cucuzzella, Govind Gopakumar, and Sepideh Khorramisarvestani. 2025. "Sustainability Assessment Framework for Urban Transportation Combining System Dynamics Modeling and GIS; A TOD and Parking Policy Approach" Smart Cities 8, no. 4: 107. https://doi.org/10.3390/smartcities8040107
APA StyleFarnood, A., Eicker, U., Cucuzzella, C., Gopakumar, G., & Khorramisarvestani, S. (2025). Sustainability Assessment Framework for Urban Transportation Combining System Dynamics Modeling and GIS; A TOD and Parking Policy Approach. Smart Cities, 8(4), 107. https://doi.org/10.3390/smartcities8040107