1. Introduction
Over the past few decades, healthcare expenditure in Australia has grown consistently, becoming a critical component of the national economy and the public healthcare system. Statistics from the Australian government reveal a steady increase in the proportion of healthcare spending relative to gross domestic product (GDP). Notably, since 2000, the growth rate of healthcare expenditures has significantly outpaced that of GDP, compelling the government to allocate more resources to sustain the quality and accessibility of healthcare services [
1].
Australia’s healthcare spending encompasses diverse sectors, including hospital services, pharmaceuticals, aged care, and mental health services. The government has increased investments in these areas to address the rising demand for healthcare. While these expenditures have improved population health, they have also significantly strained national finances. To support the functioning of the public healthcare system, the government may be forced to adopt measures, such as raising taxes or increasing the national debt, which could jeopardize Australia’s economic stability [
2].
The growing healthcare expenditure not only strains the national economy but intensifies the challenges of resource allocation and management within the public healthcare system. A significant portion of funds is directed toward high-cost medical services, often at the expense of preventive care, potentially undermining long-term health outcomes. The healthcare system also faces challenges such as human resource shortages, particularly in remote areas where medical demand outstrips supply, exacerbating health inequities. Consequently, accurately predicting and effectively managing healthcare expenditures have become pressing challenges for governments and policymakers.
Traditional healthcare expenditure forecasting methods primarily rely on statistical techniques, such as time series analysis and regression analysis. These approaches can identify trends and linear relationships in the data—for example, a proportional increase in expenditures with GDP growth. However, they often encounter significant limitations when dealing with complex, multidimensional datasets where nonlinear patterns are likely to emerge due to variable interactions, threshold effects, or diminishing returns. These limitations become particularly evident when working with large and heterogeneous datasets [
3]. Consequently, there is an urgent need for more advanced and effective forecasting methods to address the challenges posed by the growing healthcare expenditures.
In recent years, machine learning methods have gained significant attention for various forecasting tasks. Compared to traditional statistical approaches, machine learning techniques excel at processing large-scale data and capturing intricate nonlinear relationships within the data [
4]. Moreover, machine learning models offer the additional advantage of feature importance analysis, providing valuable insights into the factors that significantly impact expenditure and delivering critical information for policymakers.
This study aims to predict Australia’s healthcare expenditure using machine learning techniques, and to investigate the key factors influencing expenditure through feature importance analysis. Unlike many prior studies that rely on either traditional models or single-method machine learning approaches, this research adopts a multi-model strategy and incorporates SHAP analysis to enhance result interpretability. This combination provides both robust predictive accuracy and explanatory clarity, making it particularly well-suited for national-level fiscal and policy analysis. By providing more accurate forecasting tools and uncovering the primary drivers of expenditure growth, this study seeks to support policymakers in optimizing resource allocation and facilitating the sustainable development of the healthcare system.
2. Literature Review
2.1. Healthcare Expenditure Analysis
Healthcare expenditure forecasting has been a crucial area of research in health economics. Traditional statistical methods, such as regression analysis and time series models (e.g., ARIMA), have been extensively utilized in this field for decades. These methods are recognized for their reliability in addressing linear relationships and relatively simple datasets. Prior studies have demonstrated that traditional approaches can yield accurate predictions for structured data, particularly when data availability is limited, and the number of variables is small [
5]. For instance, a study forecasting healthcare expenditures in Latin America and the Caribbean over the next 30 years employed traditional statistical models based on economic growth, population aging, and technological advancements. These models effectively captured long-term trends and performed well in macroeconomic forecasting [
6]. However, as data dimensionality and the complexity of variable relationships increase, these methods encounter significant limitations, particularly when addressing nonlinear and multidimensional datasets.
The growing complexity and scale of data have highlighted the shortcomings of traditional statistical methods, paving the way for machine learning applications in healthcare expenditure forecasting. Machine learning models, particularly ensemble learning and deep learning techniques, have gained attention due to their superior ability to handle large-scale datasets and to capture intricate nonlinear relationships [
7]. For example, a study using the New York State SPARCS dataset demonstrated that machine learning models, such as Random Forest and CatBoost regression, significantly enhanced the accuracy of healthcare cost predictions [
8]. These findings underscore the unique advantages of machine learning methods in managing big data and complex relationships, enabling improved prediction accuracy and offering deeper insights. Additionally, research utilizing CHAID decision tree technology to analyze healthcare expenditure determinants in OECD countries revealed the technique’s effectiveness in identifying and managing complex data patterns, demonstrating its applicability across diverse regional contexts [
9]. This further illustrates the vast potential of machine learning methods for processing intricate datasets. Meanwhile, complementary research in the public policy domain has emphasized the role of governance, administrative efficiency, and emergency responsiveness in shaping healthcare system performance. For example, Telles et al. [
10] examined procurement effectiveness and public health governance during the COVID-19 crisis, highlighting the importance of integrating institutional dynamics with data-driven forecasting approaches.
Despite their advantages in improving prediction accuracy, the adoption of machine learning models in healthcare expenditure forecasting faces challenges related to interpretability. For example, a study on public health services in Uganda highlighted that, while traditional budget control methods enhanced the efficiency of healthcare services, they failed to provide a deep understanding of complex expenditure patterns [
11]. To address these challenges, researchers advocate for integrating interpretability tools, such as SHAP values, into machine learning models. These tools enhance model transparency and decision support capabilities, thereby better supporting policy-making and resource allocation [
12].
2.2. Advantages of Machine Learning
With the advent of big data technologies, the advantages of machine learning methods in handling complex data and nonlinear relationships have become increasingly apparent. Traditional statistical methods often struggle with high-dimensional data, whereas machine learning approaches, particularly deep learning and ensemble learning models, excel at capturing intricate patterns through automated feature engineering and nonlinear modeling [
13]. For example, the application of deep learning models in healthcare expenditure forecasting has demonstrated their remarkable capabilities in managing large-scale datasets and uncovering complex nonlinear relationships [
14]. These models automatically extract features from data, thereby enhancing the accuracy and reliability of predictions.
In various application scenarios, deep learning and ensemble learning models have exhibited exceptional flexibility and predictive power. For instance, in medical diagnosis and treatment, models such as deep neural networks (DNNs) and convolutional neural networks (CNNs) effectively handle high-dimensional and complex data, extracting meaningful features with high precision. In certain prediction tasks, these models have achieved over 20% improvements in accuracy compared to traditional methods [
15]. Such characteristics are equally applicable to healthcare expenditure forecasting, particularly in capturing intricate relationships among economic, demographic, and technological factors. Deep learning models have consistently demonstrated unique advantages in these contexts [
16].
Beyond their predictive power, machine learning methods also enhance interpretability through the use of tools like SHAP values. These tools enable researchers to better understand and explain model predictions, improving transparency and fostering trust in real-world applications. For example, in a study on heart disease prediction, SHAP values were employed to interpret the decision-making process of an ensemble learning model, identifying the most influential features contributing to the prediction outcomes [
17]. The use of such interpretability methods is equally important in healthcare expenditure forecasting, as it provides policymakers with actionable insights to guide resource allocation and policy decisions [
18].
2.3. Feature Importance in Existing Research
In healthcare expenditure forecasting, understanding the contribution of each feature to the model’s output is essential. This enhances the model’s interpretability and provides valuable insights for policymakers to make more informed decisions regarding resource allocation and policy adjustments. Feature importance analysis identifies the most critical factors influencing predictions and clarifies their impact on the final outcomes [
19]. In this regard, SHAP (SHapley Additive exPlanations) values, derived from game theory, effectively quantify the marginal contribution of each feature to the model’s output. The distinct advantage of SHAP analysis lies in its ability to explain not only the individual contributions of features but the interactions between them, offering a more comprehensive explanation of the model’s predictions [
20].
SHAP analysis has been successfully applied across various fields to explain machine learning models, particularly in predictive tasks involving complex and multidimensional data. While most existing studies focus on medical diagnosis or financial forecasting, the methodology is equally applicable to healthcare expenditure forecasting. In this context, SHAP values have been widely used to identify the most influential economic, demographic, and healthcare factors in complex predictive models. For example, in a heart disease prediction model, researchers employed SHAP values to evaluate the contributions of an ensemble learning model’s features, discovering that variables such as the number of major blood vessels and the type of chest pain had significant impacts on the predictions. By improving model transparency, SHAP analysis enables decision-makers to better understand the model’s mechanisms and trust its predictions in real-world applications [
17].
In addition to healthcare, SHAP analysis has demonstrated its utility in stock return forecasting by uncovering complex feature interactions and providing a robust tool for analyzing multidimensional datasets. For instance, researchers found that specific macroeconomic variables and firm characteristics had varying impacts on model predictions under different market conditions. These insights highlight SHAP’s potential in healthcare expenditure forecasting to elucidate the roles of diverse economic variables within expenditure models [
21].
The integration of SHAP analysis into healthcare expenditure forecasting not only improves model interpretability but enhances its practical relevance. By quantifying the impact of each feature on prediction outcomes, SHAP analysis enables researchers and policymakers to identify key drivers of healthcare expenditures, facilitating the development of more effective policies. For instance, when forecasting healthcare expenditures over the next 30 years, SHAP analysis can reveal the relative importance of factors such as economic growth, population aging, and technological advancements, providing the government with precise insights for resource allocation and long-term planning [
6].
By increasing model transparency and offering data-driven support for policymaking, SHAP analysis plays a critical role in healthcare expenditure forecasting and management. These analytical methods empower decision-makers to better understand resource utilization, allocate resources more effectively, and make informed decisions for sustainable healthcare system development [
22].
3. Data and Method
3.1. Data Sources and Structure
The healthcare expenditure data used in this study is derived from publicly available datasets released by the Australian Institute of Health and Welfare (AIHW). The AIHW is the official statistical agency of the Australian government, responsible for collecting, analyzing, and reporting national health and welfare-related data. The dataset covers Australian healthcare expenditures from 1998 to 2021, including expenditure classifications and funding sources at both the national and state levels. The dataset is publicly accessible through the AIHW official website, ensuring the scientific accuracy and reliability of the data (data source:
https://www.aihw.gov.au/reports/health-welfare-expenditure/health-expenditure, accessed on 4 September 2024). The data includes detailed classifications of government and non-government funding sources, such as public hospital expenditure, public health, medical research, and other specific healthcare services. Using this data, a comprehensive analysis of the distribution trends and factors influencing Australian healthcare expenditures over the past 10 years can be conducted, providing a reliable data foundation for the subsequent forecasting models. This study selects the most recent data from 2011 to 2021 as the focus of research and analysis.
The dataset contains 7169 records spanning multiple dimensions of Australian healthcare expenditures, structured across seven key features, as shown in
Table 1.
3.2. Research Methods
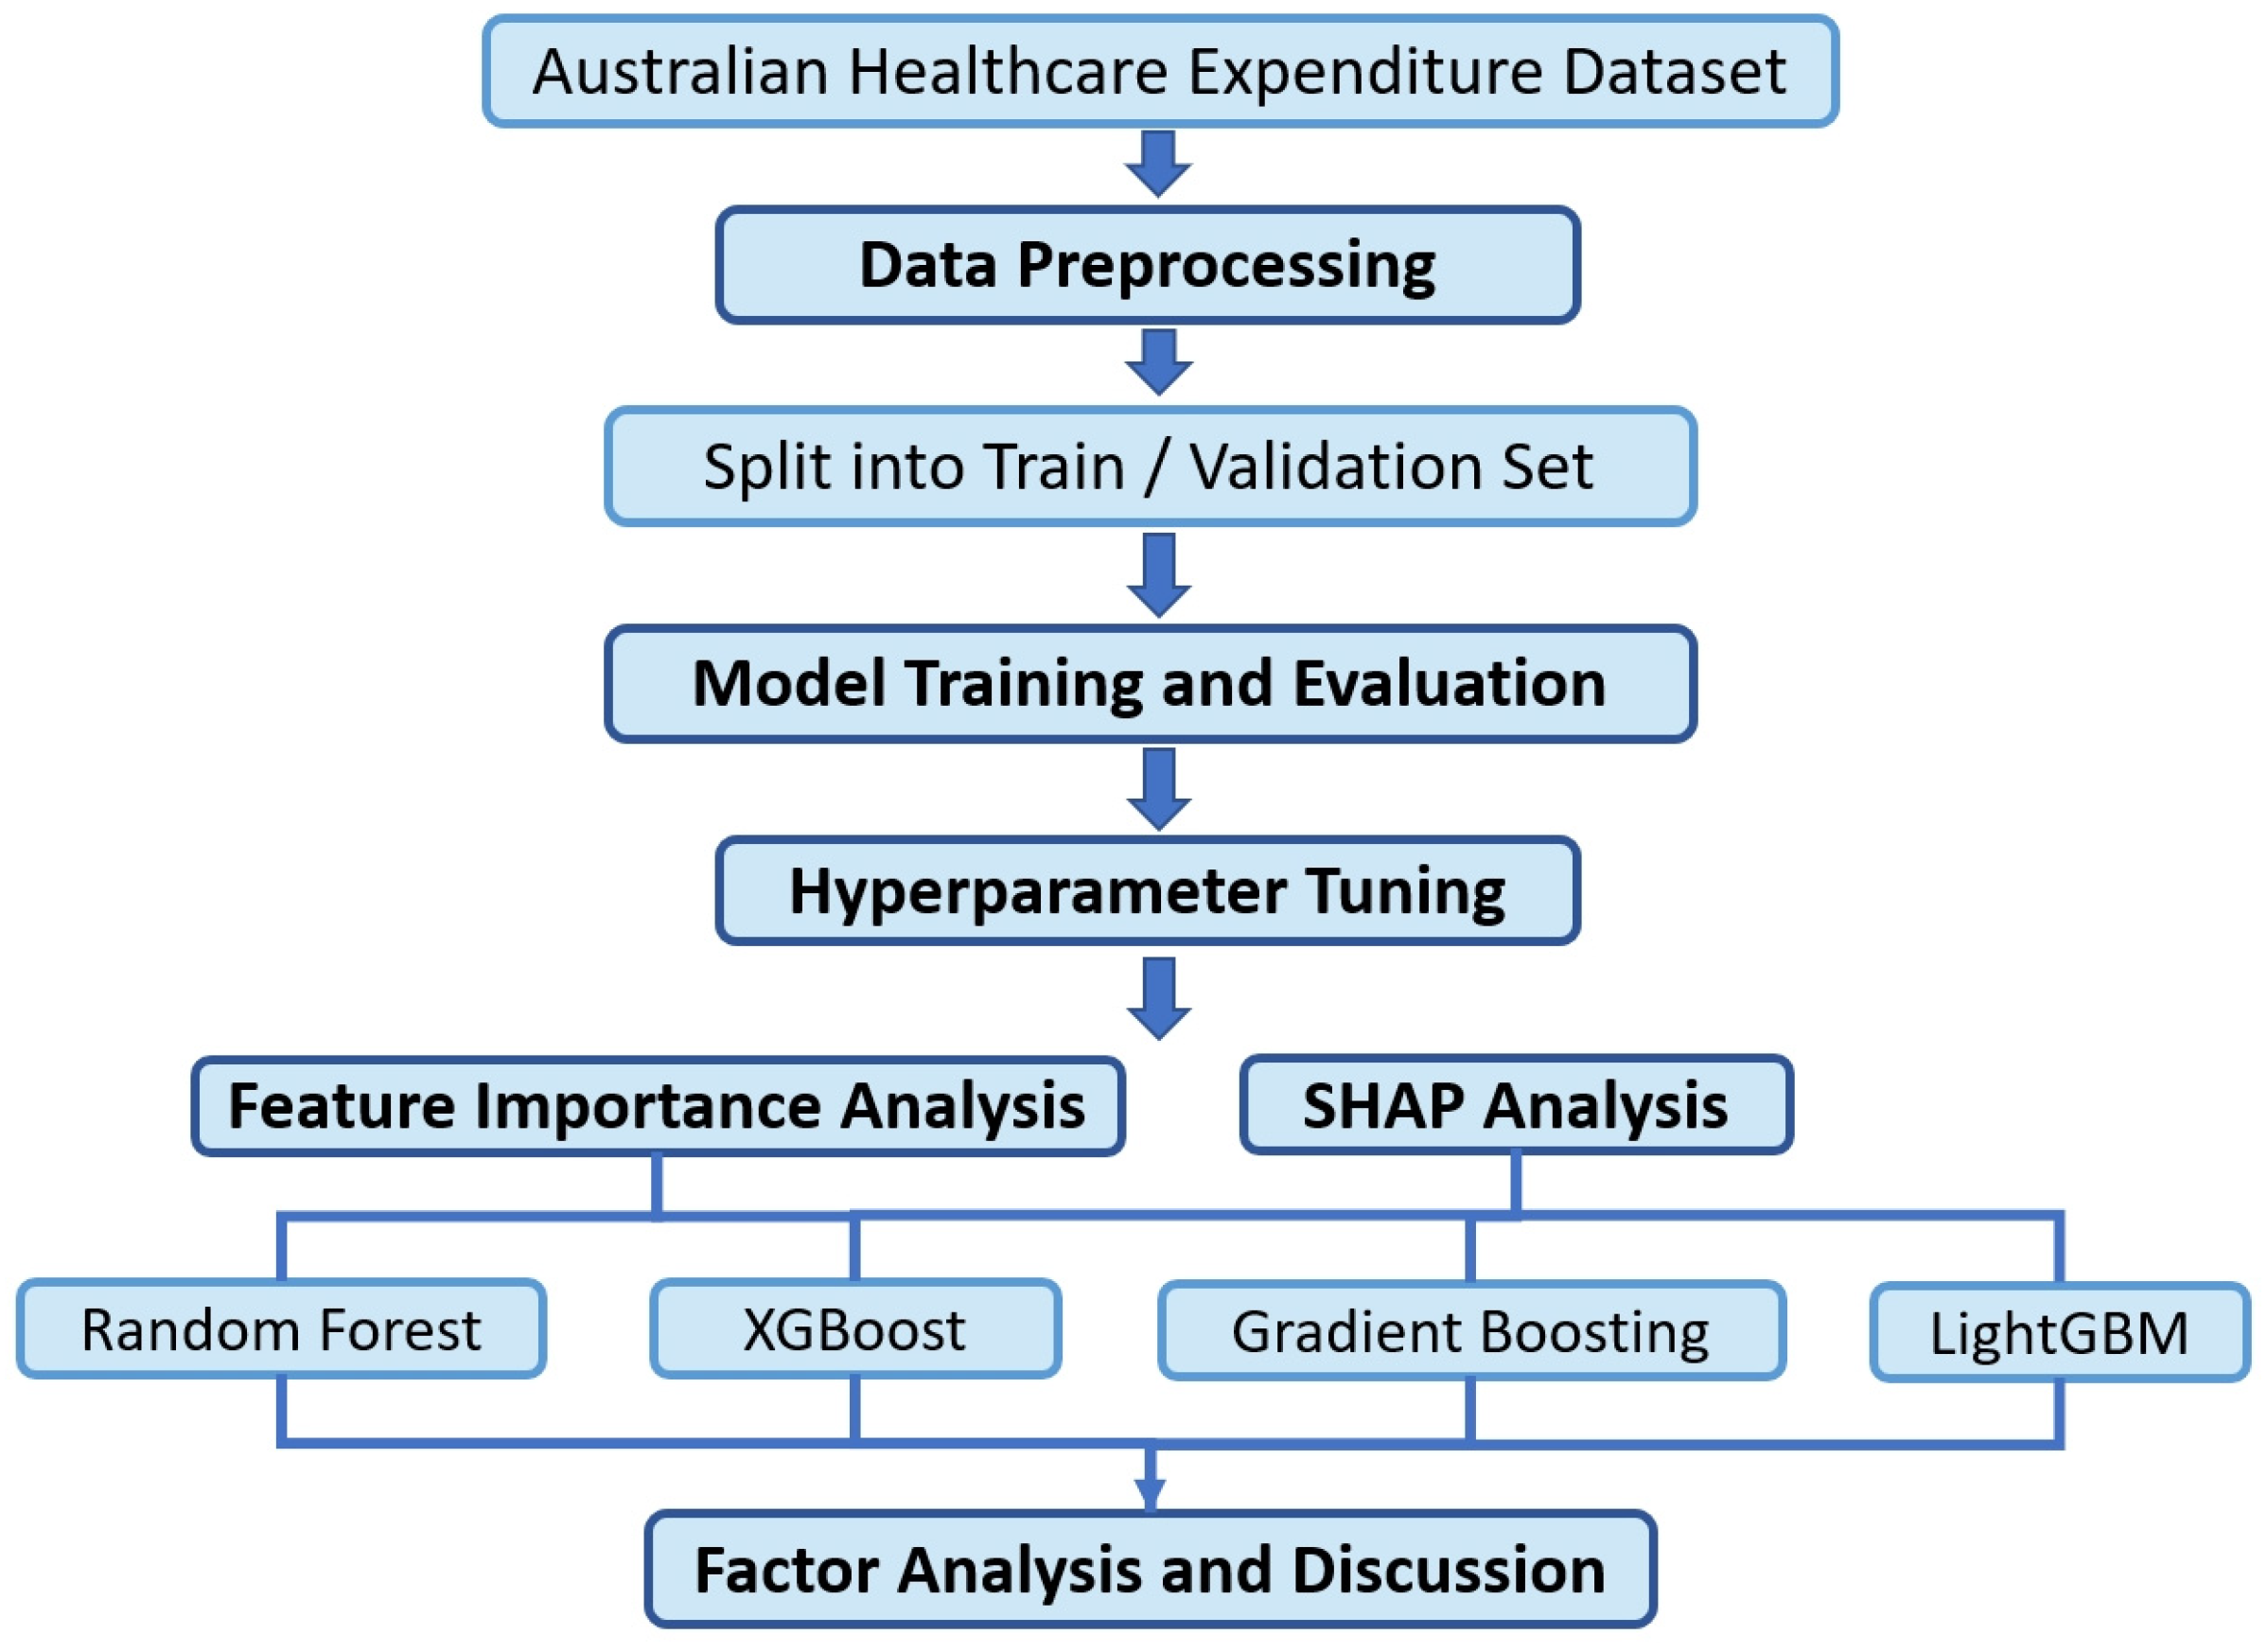
The overall methodology of this study involves a systematic process starting with data cleaning and feature engineering on Australian healthcare expenditure data, followed by splitting the processed dataset into training and validation sets in an 8:2 ratio. During the model training and validation phases, multiple mainstream machine learning regression algorithms were employed to perform regression predictions on the dataset. Hyperparameter tuning was conducted to identify the optimal parameter settings for each model. Each data instance represents a unique combination of region (e.g., state), funding source, service category, and year. The model performs predictions at this instance level rather than generating aggregated national or regional expenditure estimates. To analyze the factors significantly influencing healthcare expenditures, and to explore the underlying social causes, this study further focused on the models capable of feature importance analysis and SHAP (SHapley Additive exPlanations) analysis. These methods were utilized to gain deeper insights into the driving factors behind healthcare expenditures and to uncover the associated social implications. The workflow of this methodology is visually summarized in
Figure 1, illustrating the main stages from data preprocessing to policy-oriented analysis.
However, it should be noted that the modeling process was limited to the structured features provided in the AIHW dataset; variables such as population health status or macroeconomic conditions were not directly available, and therefore were not included in the analysis.
3.3. Data Preprocessing
Data preprocessing prepares data for model training and analysis, which mainly includes processes such as data cleaning, feature engineering, and data transformation.
In this study, the target variable, real_expenditure, was unit-converted from AUD to millions and rounded to integers to simplify the analysis and to improve model stability. To ensure compatibility with the machine learning models, features with duplicate values were disambiguated by adding prefixes to their names. Categorical variables were transformed using one-hot encoding, converting categories into binary indicators to maintain classification integrity and to avoid false linear assumptions. This process enhanced the model’s ability to recognize feature interactions while preserving the original categorical information. In addition, assessing the importance of features through correlation matrices is an important step in data analysis and feature selection. Before model training, the correlation matrix of the target variables was also drawn to help us understand the relationship between the data features and the target variables, so as to optimize model performance.
These preprocessing steps facilitated clearer insights into expenditure patterns and prepared the data for advanced modeling.
3.4. Model Training and Evaluation
This study explores the application of machine learning algorithms for the regression prediction of healthcare expenditures, aiming to identify the key features influencing expenditure, and to accurately forecast its changing trends. To address the diversity and complexity of the data, nine representative regression models were selected, encompassing linear models, tree-based models, ensemble methods, and neural network models. These models include Linear Regression, Random Forest Regression, Decision Tree Regression, Support Vector Regressor (SVR), Gradient Boosting Regression, AdaBoost Regression, Extreme Gradient Boosting (XGBoost) Regression, Light Gradient-Boosting Machine (LightGBM) Regression, and Multi-Layer Perceptron (MLP) Regressor.
The model selection is based on their respective characteristics and suitability for the task. Linear Regression, serving as the baseline model, provides a quick evaluation of linear relationships. Tree-based models, such as Decision Tree and Random Forest, are effective at handling nonlinear features and offer strong interpretability. Ensemble learning methods, including Gradient Boosting, AdaBoost, XGBoost, and LightGBM, excel at managing complex nonlinear relationships and reducing overfitting [
23,
24]. The Multi-Layer Perceptron (MLP) Regressor, leveraging neural network architectures, captures high-dimensional nonlinear relationships. By integrating the strengths of these models, this study examines data patterns from multiple perspectives, optimizing prediction performance.
To comprehensively evaluate model performance, three commonly used metrics were employed: the coefficient of determination (R2), mean absolute error (MAE), and root mean squared error (RMSE). The coefficient of determination (R2) measures the proportion of variance in the target variable explained by the model, with values closer to 1 indicating a better fit. MAE captures the average magnitude of prediction errors, providing an overall measure of accuracy. RMSE, which assigns greater weight to larger errors, offers a more sensitive evaluation of prediction accuracy and error distribution. Together, these metrics enable a multidimensional assessment of model performance, guiding optimization efforts and ensuring robust evaluation.
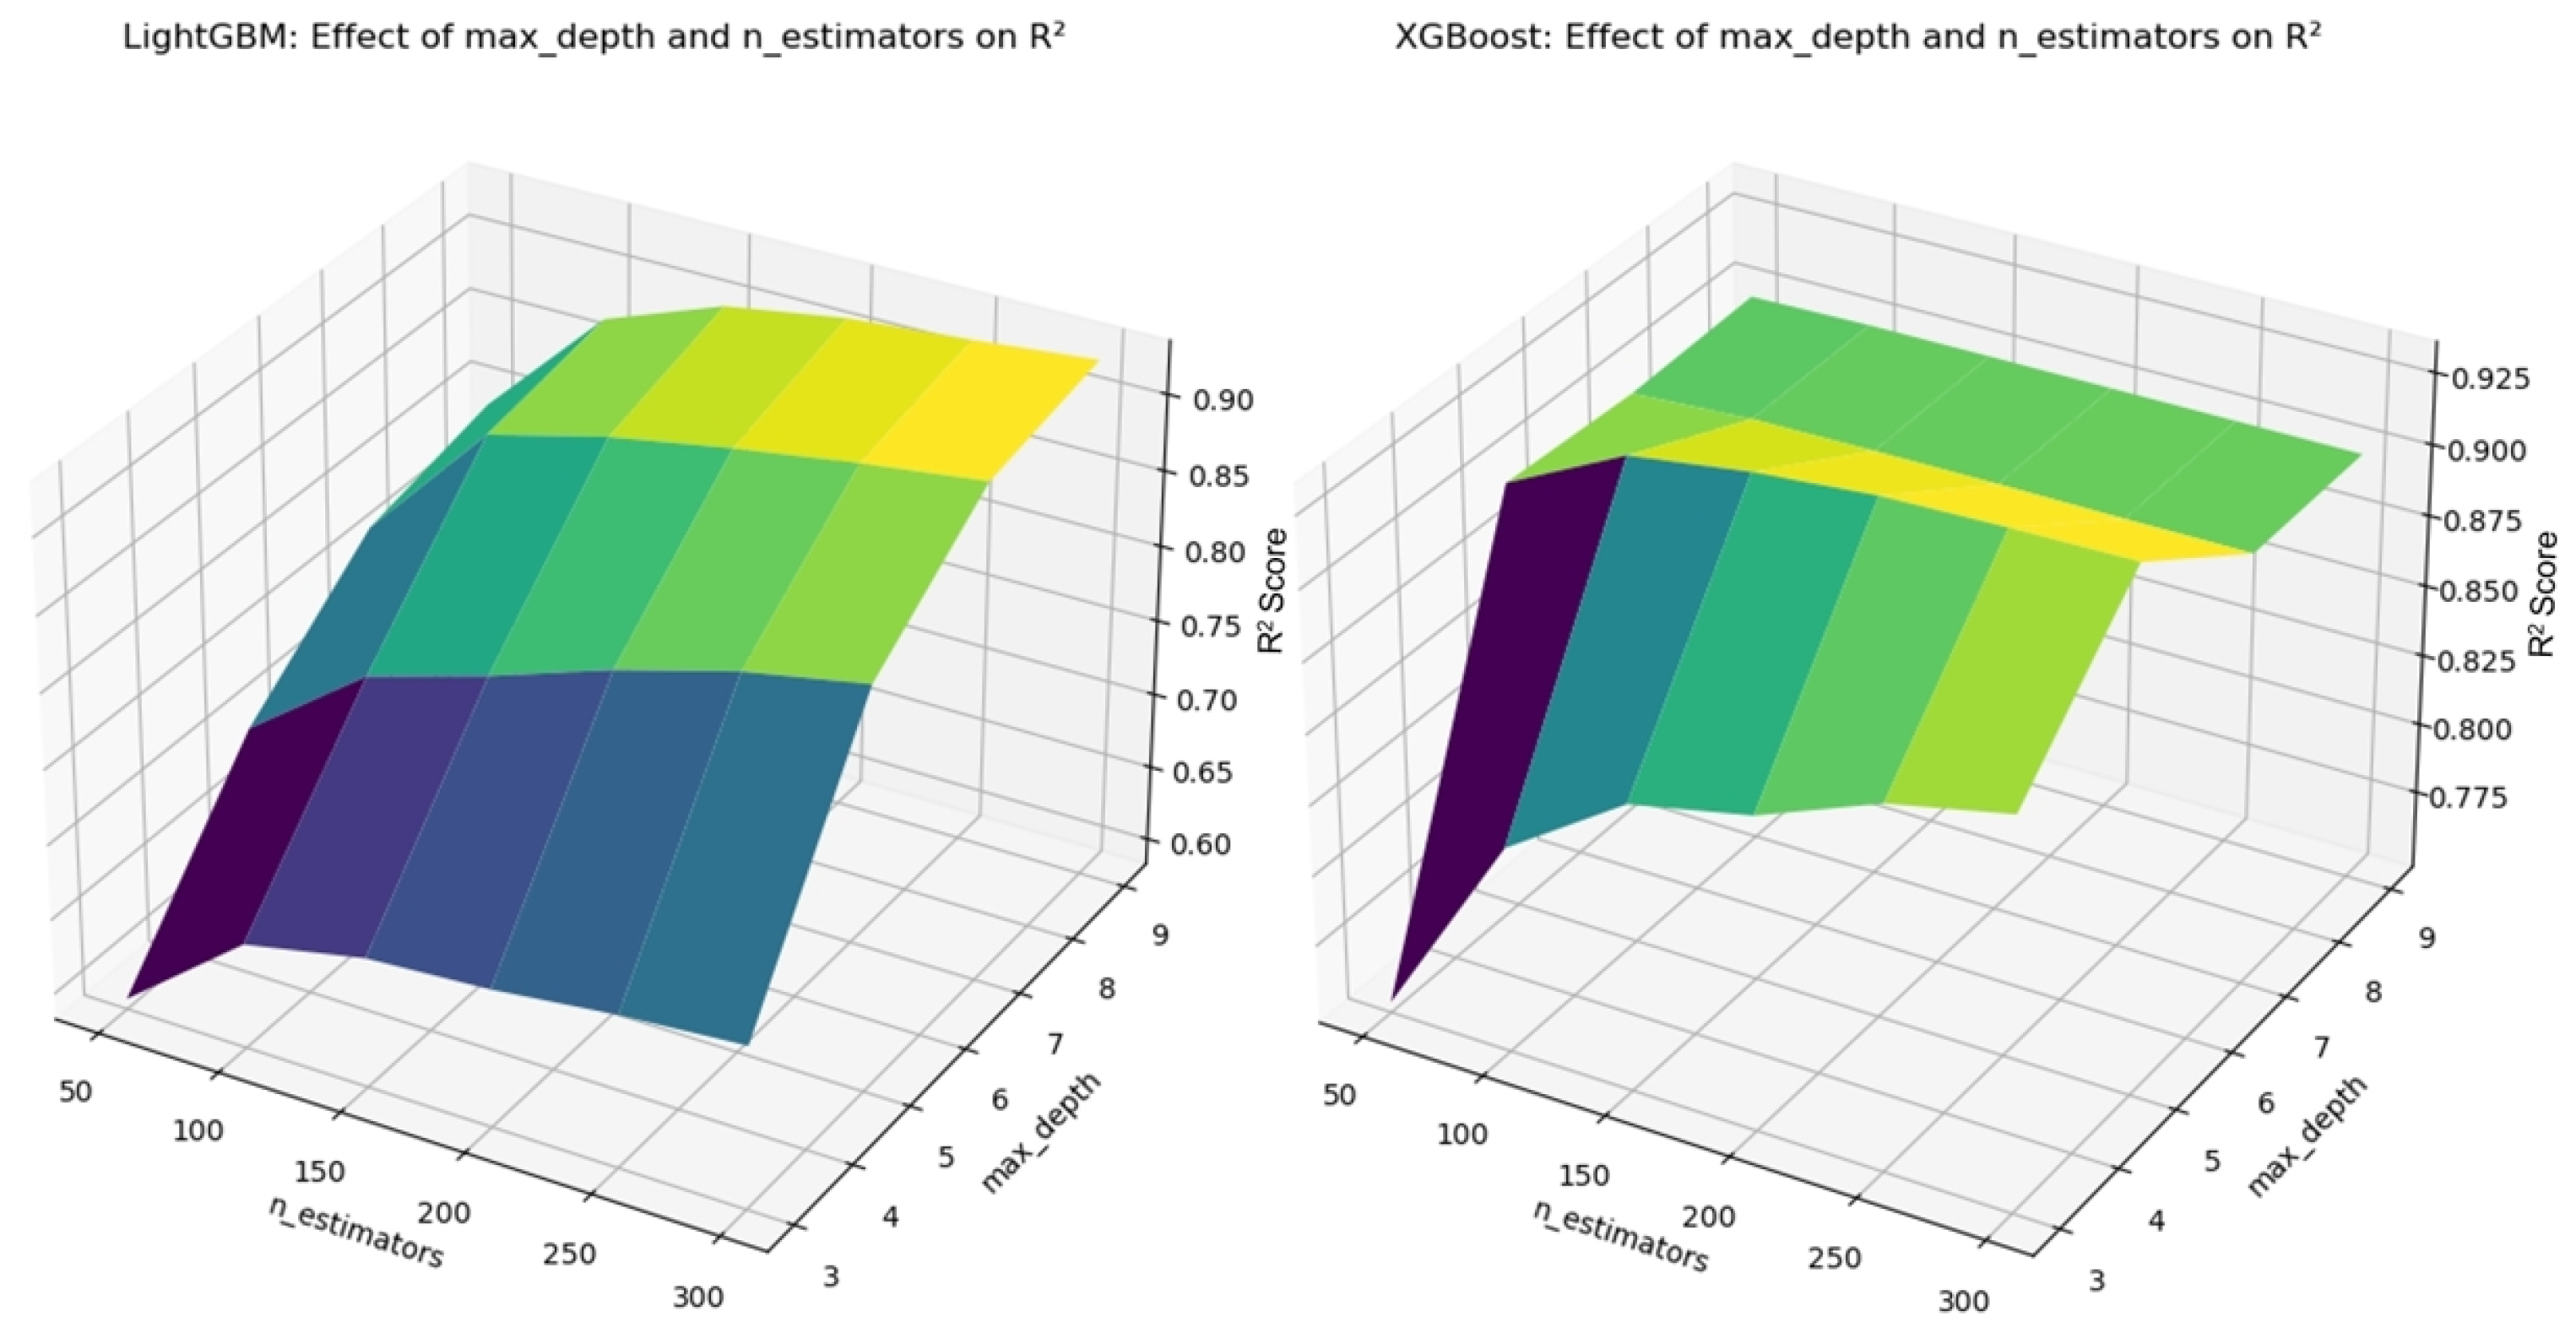
3.5. Hyperparameter Tuning
In machine learning models, hyperparameters refer to the parameters that must be manually set before training, and they have a significant impact on the model’s predictive performance. For example, the number of trees (n_estimators) and maximum depth (max_depth) in Random Forest, and the learning rate (learning_rate) and maximum depth in XGBoost, all substantially affect the model’s fitting ability and generalization performance. To ensure the model achieves optimal predictive performance, this study used cross-validation combined with grid search for hyperparameter tuning [
25]. Cross-validation involves splitting the dataset multiple times to validate the model’s performance, reducing bias caused by data partitioning. Grid search, on the other hand, explores predefined parameter combinations to identify the most optimal parameter settings. Through this process, issues of underfitting or overfitting due to improper parameter settings are avoided, enhancing the model’s stability and predictive power. The tuning results for Random Forest and Gradient Boosting are presented in
Figure 2, while the results for LightGBM and XGBoost are shown in
Figure 3.
4. Results
4.1. Model Performance Comparison
This study evaluated the predictive performance of nine regression models for healthcare expenditures using three metrics: the coefficient of determination (R
2), mean absolute error (MAE), and root mean squared error (RMSE). The results are summarized in
Table 2, and visual comparisons are provided through scatter and residual plots for intuitive interpretation.
Overall, the Multi-Layer Perceptron (MLP) Regressor achieved the best performance, with an R2 value of 0.970, indicating an excellent ability to explain the variance in the target variable. Its MAE (56.87) and RMSE (142.42) were also significantly lower than those of the other models. Random Forest and XGBoost performed notably well, with R2 values of 0.931 and 0.916, respectively, and relatively low prediction errors, demonstrating strong capabilities in capturing complex nonlinear relationships.
By contrast, the Linear Regression model performed poorly, with an R2 value of 0.269 and high RMSE and MAE values (710.55 and 379.32, respectively), underscoring its limited capacity to handle nonlinearity. The Support Vector Regressor (SVR) showed signs of severe underfitting, evidenced by a negative R2 value (−0.041). AdaBoost and Gradient Boosting also exhibited weaker performance compared to Random Forest and XGBoost, reflecting certain limitations in their predictive accuracy.
To further understand model performance, scatter plots comparing predicted vs. actual values and residual distribution plots were generated. In the scatter plots, the red dashed line represents the ideal fit (where predictions perfectly match actual values). The significant performance gap between the linear and nonlinear models in our results provides strong evidence of nonlinear relationships within the dataset. Specifically, the Linear Regression model exhibited a poor fit (R
2 = 0.269), while models such as Random Forest, XGBoost, and MLP achieved substantially higher accuracy. These differences suggest that key input variables, including funding types, service categories, and regional identifiers, interact with the expenditure outcome in ways that cannot be captured by linear assumptions. This is further supported by
Figure 4, where Linear Regression’s predicted values deviate widely from the ideal line, particularly at higher expenditure levels, revealing its inability to model the nonlinear dynamics present in the data.
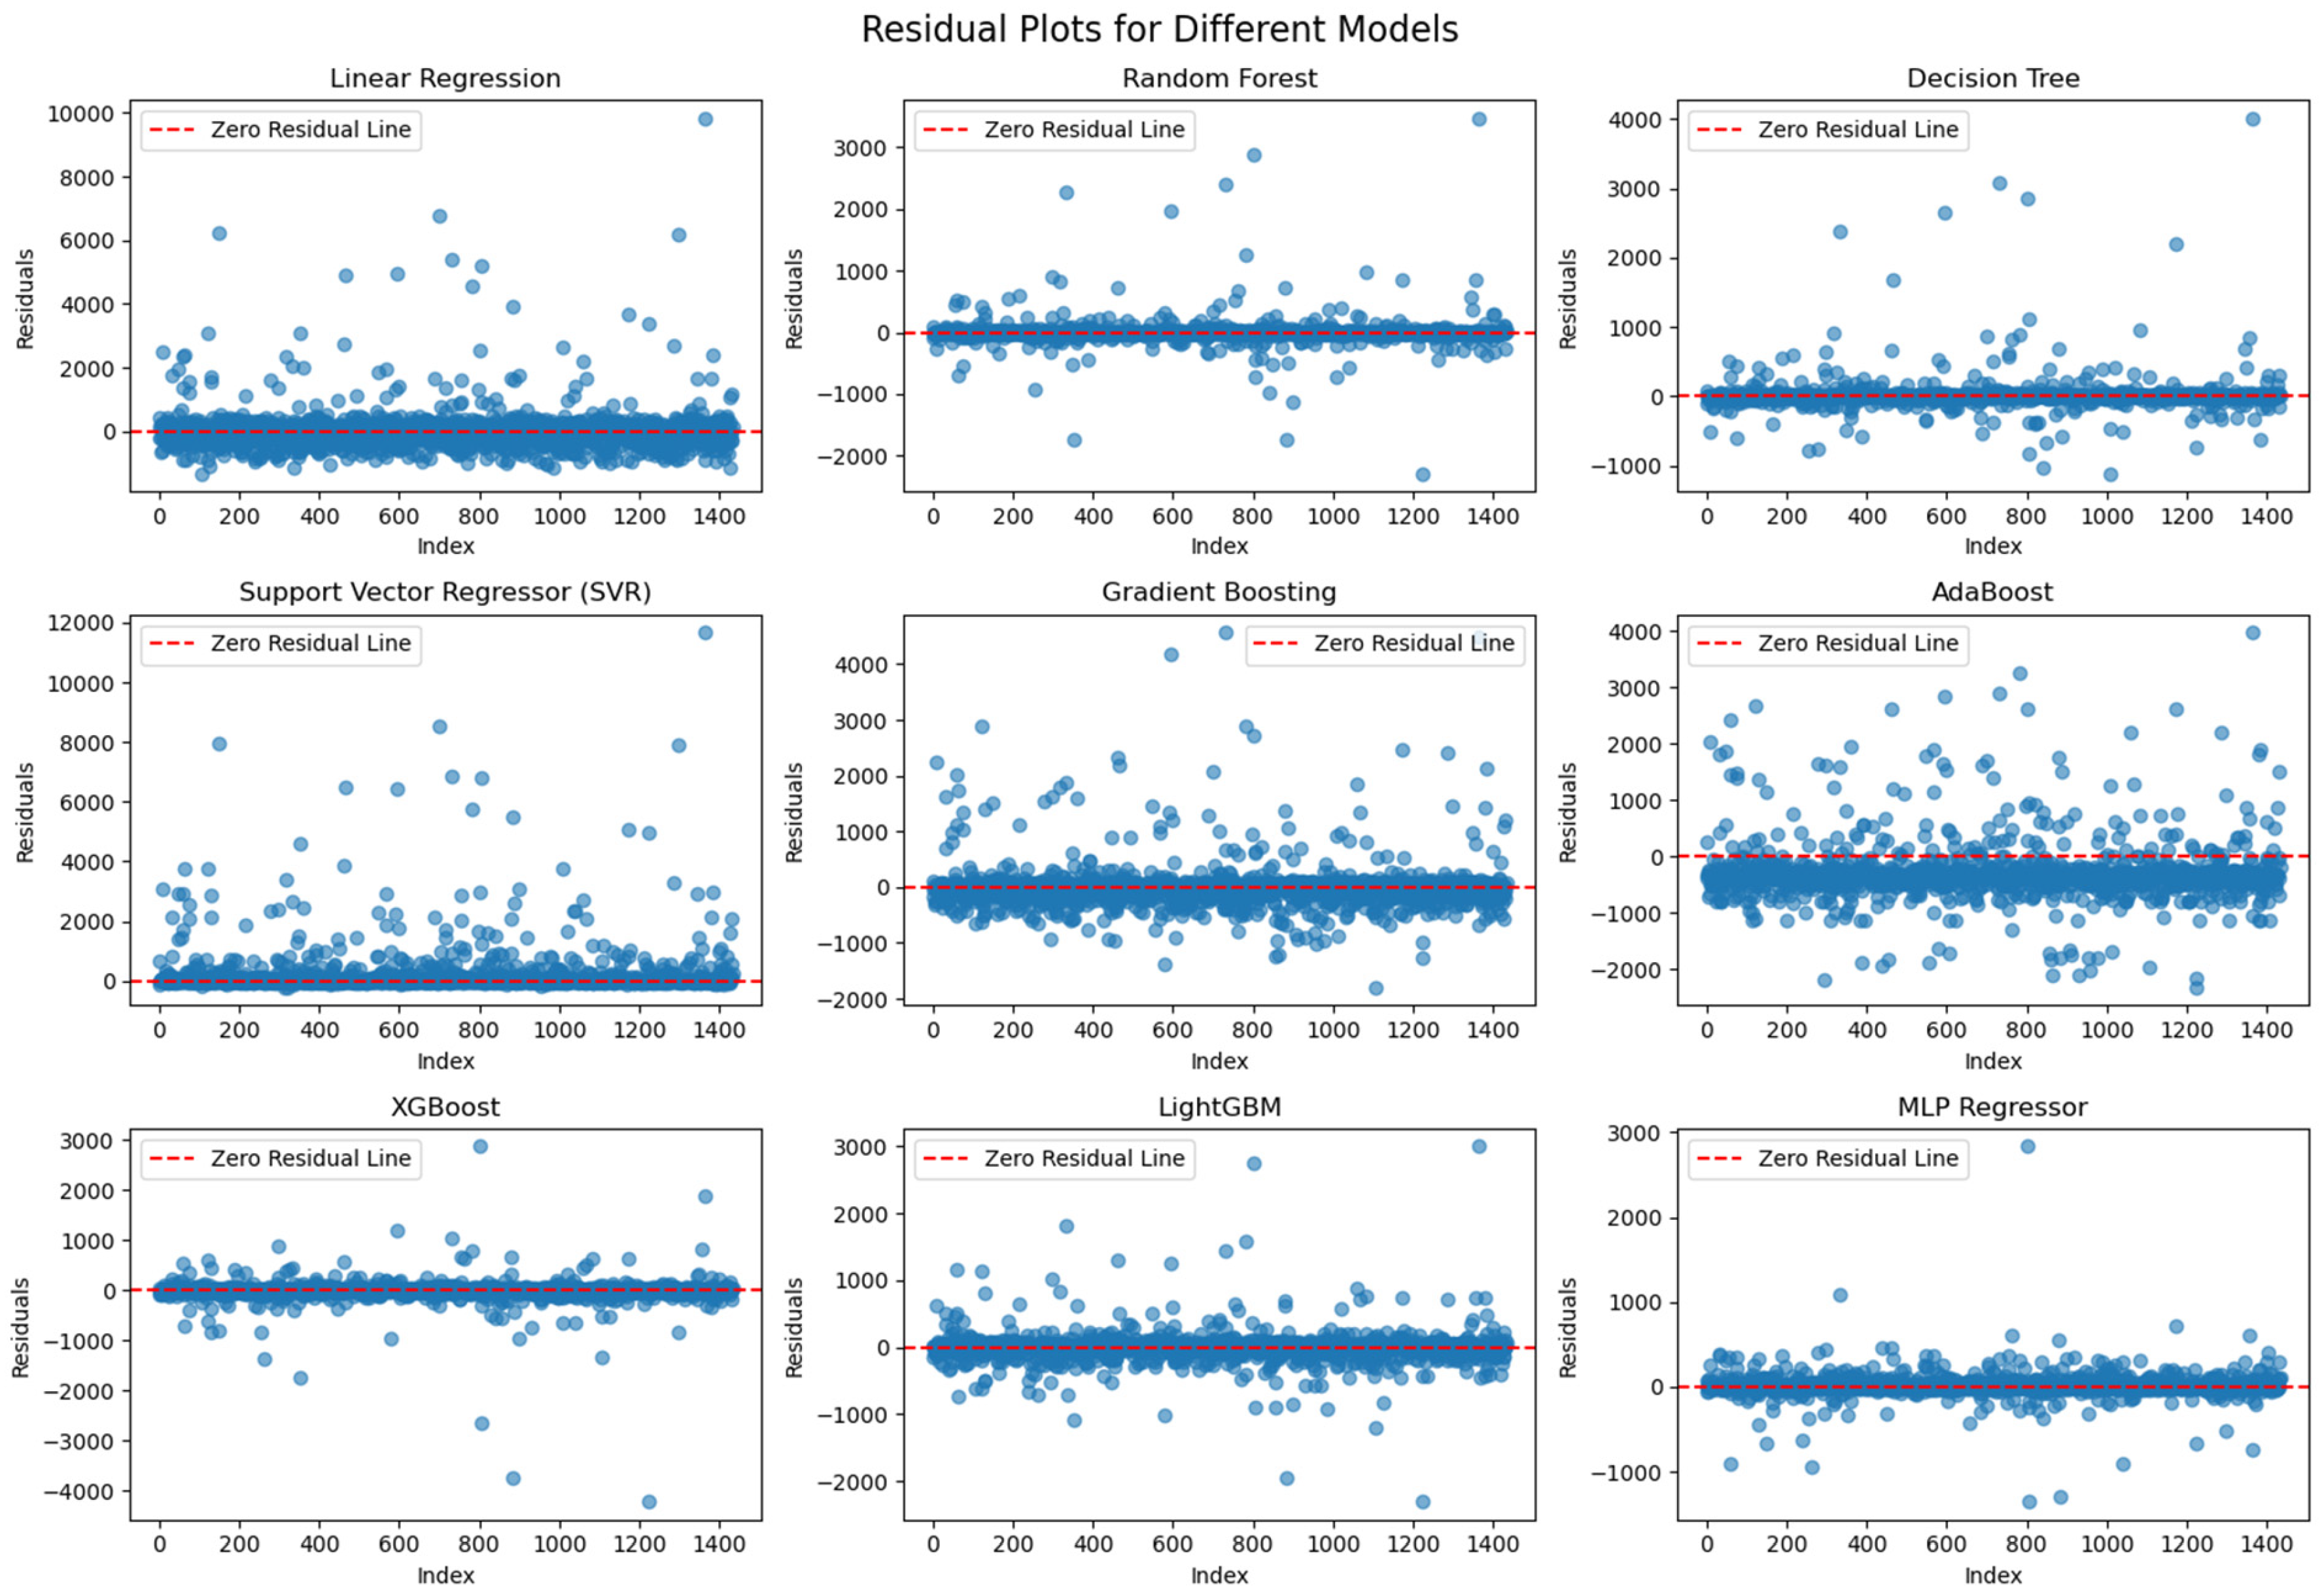
In the residual plots (
Figure 5), the Random Forest, XGBoost, and MLP models exhibit concentrated residuals close to zero, with no clear systematic bias across different value ranges. This suggests that these models effectively capture nonlinearities and distribute errors uniformly. On the other hand, Linear Regression and SVR display more scattered residuals, particularly in the higher actual value range, highlighting their difficulties in modeling complex relationships. AdaBoost and Gradient Boosting also show larger deviations in the residuals, possibly due to constraints in how they handle certain feature interactions.
These visualizations help assess overfitting and generalization quality. The uniform spread and narrow range of residuals in models like MLP and Random Forest suggest effective learning and minimal overfitting. By contrast, the SVR and Linear Regression plots reveal significant residual variance and systematic patterns—particularly an underprediction bias in high-value cases—indicating that these models struggle to capture the complex nonlinearities in the data. The plots reflect model performance using the full dataset.
In summary, deep learning (MLP) and certain ensemble methods (Random Forest, XGBoost) demonstrate clear advantages in predicting healthcare expenditures. Although Linear Regression and SVR performed poorly compared to tree-based and neural network models, they were retained in the analysis for benchmarking purposes. Linear Regression served as a baseline model, offering a reference point to quantify the improvements achieved by more complex methods. SVR, on the other hand, represents a classical kernel-based approach, and provides an informative contrast to modern ensemble and deep learning models. Including these models ensures a more comprehensive comparative framework and strengthens the robustness of our performance analysis.
4.2. Feature Importance Analysis
Feature importance analysis quantifies how much each input variable contributes to the predictive performance of a model. In tree-based methods, importance is often evaluated based on how much a feature reduces the loss function when used for splitting. Models like Random Forest and Gradient Boosting Decision Trees derive importance scores from the cumulative contribution of each feature to node splits, while LightGBM and XGBoost incorporate factors such as split gain and frequency.
As shown in
Figure 6, in the Random Forest model, “Detailed_DoHAC and other” emerges as the most important feature, indicating that funding source categories significantly influence healthcare expenditure predictions. Additionally, “NSW” (New South Wales) and “Broad_State and local government” stand out, suggesting that regional factors and funding allocations play central roles.
Similar patterns are observed in Gradient Boosting Decision Trees, with “Detailed_DoHAC and other”, “Public hospital services”, and “Broad_State and local government” ranking highly. As shown in
Figure 7, LightGBM results place “Public hospital services” at the top, followed by “Detailed_DoHAC and other” and “NSW”, highlighting that healthcare services and regional distribution are particularly influential. Note that, although both LightGBM and XGBoost display feature importance on the same x-axis label, the scales differ due to their distinct calculation methods: LightGBM presents absolute contribution scores, whereas XGBoost uses normalized importance scores summing to one. XGBoost identifies “Broad_State and local government”, “Referred medical services”, and “Public hospital services” as its leading factors, further stressing the significance of funding sources and healthcare service structures.
These features becoming key variables can be explained from the perspective of social development and governance. First, the significance of funding sources reflects the importance of public financial management. In social governance, the allocation and use of healthcare expenditures are directly influenced by funding sources, especially in addressing major public health events or promoting the equalization of healthcare services. The funding allocation mechanism determines the flow and efficiency of resources. Secondly, the importance of healthcare service domains (such as public hospital services and referred medical services) indicates that the construction of the healthcare system and resource allocation are critical aspects of social development. Particularly in the context of an aging population and the rapid growth in healthcare demands, optimizing healthcare resources becomes a core issue in social governance. Furthermore, the prominence of geographic region variables reflects the imbalance in the distribution of healthcare resources, which results from differences in economic development levels, population structures, and policy priorities across the regions. These features together reflect the complex relationship between fiscal investment, resource allocation, and regional development.
A comprehensive analysis of the feature importance results from the four models shows that funding sources, geographic regions, and healthcare service domain variables consistently exhibit high importance across all models. These results not only indicate the universal impact of different funding sources and healthcare service structures on healthcare expenditures but emphasize the critical role of regional disparities. This analysis provides data support for exploring the optimal allocation of healthcare resources and offers scientific evidence for policymakers to balance resource distribution across various dimensions.
4.3. SHAP Analysis
SHAP (SHapley Additive exPlanations) is a game theory-based model interpretation method that aims to quantify the specific contribution of each feature to the model’s predictions. By calculating the marginal contribution of each feature to the model output, SHAP values provide both global and local explanations for the model’s predictions. On a global level, SHAP values reveal the importance of features in the model’s predictions; on a local level, they explain how the features of individual samples impact specific predicted values, including the direction and magnitude of their influence.
Unlike traditional feature importance analysis, SHAP not only focuses on the overall importance of features for the model’s performance but reflects how changes in feature values dynamically affect the prediction outcomes [
26]. For example, while feature importance analysis provides a global ranking of features, SHAP values further refine this by showing the specific contributions of different features under particular circumstances, and by clearly distinguishing between features that positively or negatively impact the prediction results [
27].
In this study, SHAP analysis was used to interpret the prediction outcomes of the Random Forest, Gradient Boosting, XGBoost, and LightGBM models. The comprehensive analysis revealed that these models exhibit some consistency in feature importance rankings, as well as the specific impacts of these features on the prediction results, while also showing the unique characteristics in each model. The key results are interpreted from the perspectives of global feature importance and local feature distributions.
From a global perspective, the average SHAP value plots for Random Forest and LightGBM illustrate the overall impact of each feature on the prediction results, as shown in
Figure 8. Public hospital services and Detailed_DoHAC and other consistently rank as highly important across all models. This indicates that the expenditure on public hospital services and specific funding sources are key factors in predicting healthcare expenditures. Additionally, geographic variables, such as NSW (New South Wales) and Vic (Victoria), exhibit high SHAP values, further revealing the significant impact of regional differences on the allocation of healthcare resources. The consistency of these features across the different models suggests their universal importance in predicting healthcare expenditures.
From a local feature distribution perspective, the SHAP distribution plots for the XGBoost and Gradient Boosting models provide more detailed explanations, which is shown in
Figure 9. Taking Public hospital services as an example, high SHAP values primarily contribute positively to the prediction results, while low values correspond to negative impacts. This phenomenon reflects the positive driving effect of high-level public hospital service expenditure on the overall health resource input. Additionally, the distribution plot for Detailed_DoHAC and other shows that the higher values of this feature correspond to a substantial increase in the predicted results, further supporting the critical role of funding sources in predicting healthcare expenditures. It is also noteworthy that the SHAP distribution plot for Broad_State and local government reveals both positive and negative contributions, indicating the dynamic impact of local government funding on the prediction outcomes.
Through SHAP analysis, it is clear that funding sources, healthcare service domains, and regional characteristics occupy central positions in predicting healthcare expenditures. From the perspective of social governance, the importance of these features reflects several key points: first, the significance of funding sources underscores the importance of optimizing the fiscal allocation structure to improve the efficiency of healthcare resource utilization; second, the key role of public hospital services and other healthcare expenditures highlights the core significance of building a healthcare system for social welfare and public governance; finally, the prominence of regional variables reveals the imbalance in the distribution of healthcare resources, further emphasizing the importance of region-specific resource allocation and policy design. These results provide practical evidence for optimizing the allocation of healthcare resources and formulating effective policies.
5. Discussion
5.1. Interpretation of Results
This study utilized machine learning models to analyze the factors influencing healthcare expenditure in Australia. The model outputs, supported by SHAP analysis, reveal that funding sources, public hospital services, and geographic disparities are the most critical predictors driving expenditure growth. These findings suggest that the diversification of funding sources and imbalances in regional resource distribution play a significant role in shaping healthcare spending trends.
The prominence of funding sources highlights the pivotal role of public financial management. Government funding, particularly in public hospital services and aged care, is strongly associated with increases in healthcare expenditures. Although private health insurance-related variables do not rank among the top features in the model, the external evidence indicates that the growing prevalence of private health insurance among high-income groups may indirectly contribute to disparities in healthcare spending. This finding aligns with broader socioeconomic contexts, where uneven private and public funding mechanisms exacerbate inequalities, especially in low-income and remote areas.
The emphasis on healthcare service categories, such as public hospital services and long-term care, aligns with the demographic context of an aging society. While the model does not directly identify population aging as a top feature, well-established external data underscores that an aging population drives demand for chronic disease management and long-term care, further straining public healthcare expenditures [
28].
The geographic disparities identified by the model reflect uneven resource distribution across the states and remote regions. Although specific variables, such as economic development levels, local government policies, and healthcare accessibility, are not explicitly highlighted as top features, the model’s focus on regional factors aligns with real-world conditions. Wealthier regions often provide better healthcare services, while poorer or remote areas face resource shortages and elevated costs, highlighting persistent inequalities in healthcare access [
29].
In conclusion, the model results directly identify funding sources, healthcare service categories, and regional disparities as the key drivers of healthcare expenditures. Supplementary interpretations, including the influence of private health insurance dynamics, population aging, and local policy effectiveness, are consistent with the external findings, offering a comprehensive context for understanding the model’s outcomes.
5.2. Policy and Social Implications
The feature importance and SHAP analyses highlight that factors such as funding sources, healthcare service areas, and geographic disparities are central to understanding healthcare expenditures. These findings are strongly corroborated by the model outputs, which validate their significance in predicting healthcare expenditures. Although the model does not prioritize the variables representing population age structure or socio-economic inequalities as top predictors, these factors align with the broader social and policy contexts documented in the external literature. In other words, the model’s emphasis on funding and regional factors can be complemented by the existing research, which demonstrates that Australia faces complex social challenges, including population aging, health inequalities, and uneven regional development [
30]. Integrating model-supported factors with established demographic and socio-economic trends provides a more comprehensive understanding of Australia’s healthcare expenditure landscape.
5.2.1. The Impact of Population Aging on Healthcare Expenditure
Population aging is a well-documented social phenomenon, and is widely recognized as a key driver of increasing healthcare expenditures in Australia. Although the model results do not explicitly identify aging-related features as top predictors, the external statistical data and the literature clearly establish this connection. According to the Australian Bureau of Statistics, by 2031, individuals aged 65 and over are projected to account for more than 24% of the total population, significantly increasing healthcare demands, particularly in chronic disease management and long-term care.
As chronic illnesses and cognitive disorders, such as dementia, become more prevalent among the elderly, the demand for hospitalization, ongoing care, and complex treatment regimens escalates. While these needs are not directly reflected in the model’s top-ranked features, extensive demographic forecasts and health policy reports, including those from the Australian Institute of Health and Welfare, corroborate this trend. For instance, projections indicate that, by 2030, over 5 million elderly Australians will require long-term care services, contributing to the sustained growth in healthcare expenditures. The financial pressures associated with population aging may necessitate adjustments in government fiscal strategies [
31]. Established policy research suggests increased investment in aged care, community-based services, and preventive measures to alleviate the burden on hospital-centered healthcare structures originally designed for acute, rather than long-term, conditions.
Although the model emphasizes funding sources and service categories, the broader demographic context underscores the need for resource allocation adjustments. This may include higher taxes or public debt to maintain a sustainable healthcare system amid demographic shifts. To address the challenges posed by population aging, the government must adopt flexible and innovative policies, optimize resource distribution, and consider reforms to the social security system. By integrating model-supported findings with established demographic trends, policymakers can more effectively ensure sustainable healthcare expenditure growth while mitigating fiscal pressures.
5.2.2. The Impact of Health Inequality on Healthcare Expenditure
As Australia’s population continues to age, healthcare expenditure is influenced not only by the needs of the elderly but by socio-economic status, regional disparities, and broader health inequalities [
32]. While the model’s top features emphasize funding sources and regional factors, it does not explicitly include indicators of socio-economic status or health inequality.
In economically developed regions, such as New South Wales and Victoria, abundant healthcare resources, advanced facilities, and a skilled medical workforce facilitate preventive measures and public health initiatives, helping to reduce chronic disease rates and limit long-term expenditure growth. By contrast, remote regions, like Western Australia and the Northern Territory, experience slower economic development, limited healthcare infrastructure, and sparse populations. Although the model underscores the significance of regional variables, the specific links between lower socio-economic status and associated health risks in these remote areas are supported by external evidence rather than the model itself. Research shows that these conditions contribute to a higher reliance on emergency care, an increased prevalence of chronic diseases, poorer mental health outcomes and, ultimately, higher healthcare costs and inefficiencies [
33]. Moreover, the shortages of healthcare workers and outdated hospital facilities in remote areas force patients to seek care in distant urban centers, further escalating costs and highlighting structural inequalities in healthcare access. These dynamics reflect systemic patterns of inequality that, while not directly captured by the model’s top features, are well-documented in public health studies.
Health inequality also extends beyond geography, disproportionately affecting low-income households, immigrant communities, and Indigenous populations. Although the model does not prioritize income-related or ethnocultural variables, external data and policy reports reveal that these groups face greater burdens of chronic diseases and other health challenges, increasing their reliance on public healthcare and driving up overall expenditures [
34]. Tight budget constraints exacerbate the strain on public spending as governments struggle to meet the needs of these underserved populations.
To address health inequality in healthcare expenditure, policy interventions must extend beyond the model’s direct findings. The government should increase financial support for remote and low-income areas, implement differentiated funding strategies, and adjust resource allocation to enhance accessibility and reduce service gaps. These recommendations, informed by established social policy research, align with the model’s emphasis on regional disparities while incorporating broader socio-economic factors documented in external studies.
Policy changes play a crucial role in shaping the distribution and growth patterns of healthcare expenditures in Australia. While the model’s top features emphasize funding sources and service categories, it does not explicitly include variables representing healthcare policies or reforms.
In recent years, national-level policy reforms aimed at expanding universal healthcare coverage and improving public health services have substantively influenced both access and spending patterns, particularly for low-income groups and residents in remote areas [
35]. These policy-driven improvements—while enhancing health outcomes—have also contributed to rising public healthcare expenditures. For instance, the federal optimization of the Medicare system has expanded coverage for chronic disease management and elderly care [
36]. Although these policy interventions are not directly represented among the model’s top-ranked features, external reports clearly indicate that higher Medicare reimbursement rates, in conjunction with escalating drug prices, have reshaped expenditure structures, especially in public hospital services and pharmaceutical spending.
5.2.3. The Impact of Policy Changes on the Structure of Healthcare Expenditure
Broader access to medical care for elderly populations and low-income groups through improved reimbursement rates has naturally escalated government spending. Additionally, rising drug costs—especially for cancer treatments and chronic disease management—further shape expenditure structures. While the model highlights healthcare funding and service categories as vital factors, these cost patterns reflect the impact of major public policies, particularly the Pharmaceutical Benefits Scheme (PBS) and drug price control mechanisms, which have shaped pharmaceutical expenditures in recent years. Despite ongoing efforts in price control, pharmaceutical spending continues to rise, underscoring challenges not fully captured by the model’s top features. Similarly, government support for the elderly, particularly through aged care reforms, has expanded long-term care services and improved the quality of life for older individuals [
37]. However, this policy-driven shift has also increased public spending, especially in chronic disease management and elderly care, placing sustained fiscal pressure on the healthcare system. Strengthening the primary healthcare infrastructure, especially in remote areas, aligns with the model’s emphasis on regional disparities, but the specific connections to policy changes and their fiscal implications are drawn from documented reforms rather than model outputs.
Advancements in medical technology, including precision medicine and personalized treatments, have further improved treatment outcomes while simultaneously raising costs [
38]. Although the model emphasizes funding sources, it does not directly address the impact of technology-driven expenditure growth. Insights into balancing the adoption of innovative treatments with sustainable healthcare spending are derived from external policy analyses and healthcare reports.
In summary, while the model identifies key funding sources and service categories influencing healthcare expenditures, the broader impact of policy reforms—such as expanded coverage, pharmaceutical pricing strategies, aged care investments, and technological advancements—is supported by external evidence rather than direct model outputs. To ensure sustainable expenditure growth, the government must continue optimizing resource allocation, improving the efficiency of fund utilization, and considering reforms to the social security system.
5.2.4. The Impact of Medical Technological Advancements on Expenditure Structure
The introduction of advanced technologies, such as cutting-edge diagnostic equipment, innovative treatment techniques, and personalized medicine, has significantly transformed the structure of healthcare expenditures [
39]. Although the model’s top features emphasize funding and service factors, it does not directly capture the impact of technological advancements.
Technological innovations, including advanced imaging modalities (e.g., MRI, CT scans), precision cancer therapies (e.g., targeted treatments, immunotherapy), and gene editing techniques (e.g., CRISPR), have markedly improved diagnostic accuracy and treatment outcomes. However, these advancements have also driven substantial increases in healthcare costs. Rising expenditures for cancer treatments and the continuous development of new drugs illustrate how innovation, while enhancing patient survival and quality of life, imposes financial burdens on both governments and patients.
Similarly, the application of big data and artificial intelligence (AI) in healthcare—such as precision medicine, disease prediction, and health management—offers the potential for cost savings by reducing redundant tests and improving care coordination. However, the initial investments required for infrastructure, data processing capabilities, algorithm development, and ongoing system maintenance introduce significant fiscal pressures. While these technologies may eventually streamline some expenditures, the upfront costs and frequent upgrades present challenges not reflected in the model’s ranked features.
In summary, although the model does not explicitly account for technology-driven costs, extensive external evidence demonstrates that high-cost treatments, advanced diagnostic tools, and complex data systems are critical drivers of rising healthcare expenditures [
40]. To address these challenges, policymakers must implement fiscal and policy strategies that balance the benefits of technological innovation with sustainable resource allocation. This approach ensures that improvements in care quality and efficiency do not lead to unsustainable increases in public healthcare spending.
5.3. Policy Recommendations
Based on the model outputs and SHAP analysis results—particularly the dominant influence of funding sources, public hospital services, and geographic disparities—the following policy recommendations are proposed to optimize the management of healthcare fiscal expenditures.
Firstly, in response to the model’s identification of public hospital services as a major expenditure driver, it is essential to optimize resource allocation mechanisms. The government should enhance fund monitoring to ensure that public resources are directed to sectors with the greatest demand and impact. Targeted strategies are particularly needed for public hospital services and long-term care to maximize funding efficiency. In addition, real-time assessments of spending effectiveness are necessary to ensure timely and precise allocation.
Secondly, given the impact of regional disparities on expenditure variation, promoting equity in healthcare provision is vital. To improve conditions in underserved areas, the government could offer special subsidies or establish cross-regional resource-sharing mechanisms. An ongoing evaluation of resource usage would enable dynamic adjustments in regional fiscal allocations, ensuring adequate support for high-need or under-resourced regions.
Thirdly, although population aging was not a top-ranked feature in the model, its fiscal implications are supported by external evidence and align with increased long-term care demands. The government should prioritize developing community-based and long-term care services to ease the burden on public hospitals. Fiscal incentives, such as tax breaks or subsidies, could attract private investment, easing the pressure on public funds and fostering public–private collaboration.
Finally, in light of the importance of funding mechanisms in the model, strengthening the implementation and evaluation of healthcare policies is critical. A robust, data-driven evaluation system would enable the real-time monitoring of outcomes and ensure that spending delivers the intended social and economic benefits. The continuous refinement of policy design based on real-time feedback would further improve fairness and efficiency.
5.4. Limitations of the Study
While this study offers valuable insights into the factors driving healthcare expenditures in Australia through the application of interpretable machine learning techniques, it also faces several limitations that should be acknowledged. First, the analysis relies entirely on structured historical data made available by the Australian Institute of Health and Welfare (AIHW). The dataset includes categorical and financial variables, such as funding sources, service types, and regional identifiers, but lacks broader socioeconomic, demographic, or health status indicators. Furthermore, no variables are included that directly capture public policy decisions, management performance, or macroeconomic shocks. As such, the scope of the analysis is limited to what can be inferred from this structured fiscal dataset, and does not reflect the full complexity of the healthcare system or its governance structures. Similar concerns have been raised in international studies, where researchers have emphasized the need to integrate governance performance and procurement effectiveness into public healthcare expenditure analyses, especially under crisis conditions [
10].
Secondly, the machine learning models employed in this study identify statistical associations between input features and expenditure outcomes, but do not support causal inference. Although the feature importance and SHAP analyses offer interpretative insights into the role of variables, like regional disparities or funding sources, these findings reflect correlations—not definitive cause–effect relationships. Moreover, some of the variable names, such as “Public hospital services” or “State”, may suggest policy or administrative content, but in the context of the dataset, they are used strictly as structural descriptors. Interpretations related to inefficiency, inequality, or policy implications are derived through the external literature and contextual reasoning, not from the predictive model itself. Therefore, readers should be cautious not to overinterpret these outputs as evidence of policy effectiveness or institutional performance.
Lastly, the structure of the prediction task itself introduces certain limitations. The model performs regression at the instance level, where each data point represents a specific combination of attributes—region, funding type, service category, and year—and predicts expenditure accordingly. It does not provide national or regional-level aggregate forecasts. As such, it cannot be used to assess overall healthcare budget allocations across jurisdictions, or to evaluate policy outcomes at the macro level. Additionally, because the dataset reflects past spending behaviors, the model does not account for future changes in policy, population needs, or systemic reforms. Future studies may enhance predictive robustness by incorporating time-series models, broader policy indicators, and emerging trends, such as private expenditure patterns or health inequalities. These enhancements would help align the predictions more closely with the dynamic realities of healthcare governance.
6. Conclusions
This study applies machine learning methods to analyze the key drivers of Australia’s healthcare fiscal expenditure from 2011 to 2021. By leveraging advanced models in conjunction with SHAP (SHapley Additive exPlanations) analysis, the research identifies the core factors influencing healthcare expenditures, including funding sources, healthcare services, geographic disparities, and population aging. Among these, funding sources, public hospital services, and geographic regional differences emerge as particularly critical variables. Their consistent importance across the different models underscores the reliability and robustness of the findings.
The contributions of this research are multifaceted. First, it introduces an innovative application of machine learning models to a domain traditionally dominated by linear approaches. By employing ensemble and deep learning methods, this study effectively addresses the challenges of complex and nonlinear data. These advanced models capture intricate relationships among the variables and identify the most significant drivers of healthcare expenditures from a broad range of factors. Second, the research employs a comprehensive SHAP-based interpretative analysis, offering both a global perspective on each variable’s influence and a nuanced understanding of how the features dynamically affect predictions under varying conditions. This transparent and interpretable approach not only enhances the credibility of the findings but provides valuable decision-making support for policymakers seeking to optimize resource allocation and to improve public healthcare service efficiency.
From a social relevance and practical utility perspective, this study provides actionable policy insights for government decision-makers. By elucidating the impact of different funding sources, healthcare service categories, and regional disparities, the research helps policymakers understand the mechanisms driving healthcare expenditure growth. In particular, it highlights the implications of population aging and health inequalities, offering recommendations for fund allocation to address these challenges. Policymakers can thus ensure that elderly populations, low-income families, and residents in remote areas receive adequate healthcare resources, ultimately strengthening health security and promoting equity in service provision.
Looking ahead, future investigations could benefit from integrating time-series models to analyze the long-term trends in healthcare spending and to assess the effects of policy adjustments on these trajectories. especially by incorporating indicators of public sector governance and policy responsiveness as discussed in recent international studies. Combining explainable machine learning methodologies with economic models could also yield deeper insights into the dynamic consequences of policy shifts, thereby informing more effective and sustainable policy interventions. Although this study specifically analyzes Australia’s healthcare expenditure, the methodology—combining interpretable machine learning models with SHAP analysis—can be applied to other countries with structured healthcare finance data. Additionally, the findings regarding the influence of funding structures, service types, and regional disparities may inform policy decisions in other contexts facing similar healthcare budget and equity challenges.
In summary, this study provides a comprehensive examination of the underlying drivers of Australia’s healthcare expenditure growth, and demonstrates the value of applying advanced machine learning techniques for more accurate and transparent predictions. By addressing complex issues, such as population aging, health inequality, and regional resource distribution, it offers a rigorous scientific foundation for optimizing resource allocation, enhancing fund utilization efficiency, and formulating targeted policies. These findings serve as a valuable reference for future research in this domain.
Author Contributions
Conceptualization, W.G. and O.L.; data curation, W.G.; formal analysis, O.L.; funding acquisition, W.G. and O.L.; methodology, Z.Z.; resources, W.G.; software, Z.Z.; supervision, O.L.; validation, W.G. and Z.Z.; visualization, Z.Z.; writing—original draft, Z.Z.; writing—review and editing, Z.Z. and O.L. All authors have read and agreed to the published version of the manuscript.
Funding
This research was funded by Department of Science and Technology of Zhejiang Province, grant number 2025C02081, and by Wenzhou Institute University of Chinese Academy of Sciences, grant number WIUCASQD2022010.
Data Availability Statement
Conflicts of Interest
The authors declare no conflicts of interest.
References
- Richardson, J.R. Can we sustain health spending? Med. J. Aust. 2014, 200, 629–631. [Google Scholar] [CrossRef] [PubMed]
- Healy, J.; Sharman, E.; Lokuge, B. Australia: Health system review. Health Syst. Transit. 2006, 8, 100132. [Google Scholar]
- Saleh, M.H.; Alkhawaldeh, R.S.; Jaber, J.J. A predictive modeling for health expenditure using neural networks strategies. J. Open Innov. Technol. Mark. Complex. 2023, 9, 100132. [Google Scholar] [CrossRef]
- Wang, J.; Qin, Z.; Hsu, J.; Zhou, B. A fusion of machine learning algorithms and traditional statistical forecasting models for analyzing American healthcare expenditure. Healthc. Anal. 2024, 5, 100312. [Google Scholar] [CrossRef]
- Zhang, Y.; Tang, S.; Yu, G. An interpretable hybrid predictive model of COVID-19 cases using autoregressive model and LSTM. Sci. Rep. 2023, 13, 6708. [Google Scholar] [CrossRef]
- Rao, K.D.; Roberton, T.; Vecino_Ortiz, A.I.; Noonan, C.M.; Hernandez, A.L.; Mora-Garcia, C.A.; Prado, A.M.; Machado, C.J.; Vega-Landaeta, A.; Palacio-Martínez, N. Future health expenditures and its determinants in Latin America and the Caribbean: A multi-country projection study. Lancet Reg. Health–Am. 2025, 44, 100781. [Google Scholar] [CrossRef]
- Peláez-Rodríguez, C.; Torres-López, R.; Pérez-Aracil, J.; López-Laguna, N.; Sánchez-Rodríguez, S.; Salcedo-Sanz, S. An explainable machine learning approach for hospital emergency department visits forecasting using continuous training and multi-model regression. Comput. Methods Programs Biomed. 2024, 245, 108033. [Google Scholar] [CrossRef]
- Rao, A.R.; Jain, R.; Singh, M.; Garg, R. Predictive interpretable analytics models for forecasting healthcare costs using open healthcare data. Healthc. Anal. 2024, 6, 100351. [Google Scholar] [CrossRef]
- Issever, T.; Sennaroglu, B.; Donmez, C.C.; Corum, A. Identifying Influential Variables on Health Expenditure of the Organisation for Economic Co-Operation and Development (OECD) Countries. Iran. J. Public Health 2024, 53, 1847. [Google Scholar] [CrossRef]
- Telles, C.R.; Ayaz, A.M.; Mustafa, S.K.; Roy, A.; Ajmal, M.R.; Frigo, E.P. Future Risk Analysis of the Health Public Sector During COVID-19 Period (2020 to March 2021). In Designing Intelligent Healthcare Systems, Products, and Services Using Disruptive Technologies and Health Informatics; CRC Press: Boca Raton, FL, USA, 2022; pp. 27–44. [Google Scholar]
- Dickson, T.; Nyakundi, A.; David, N. Budgetary Control and Public Health Service Delivery in Uganda: A Case of Bushenyi-Ishaka Municipality. Res. Invent. J. Curr. Issues Arts Manag. 2024, 3, 108–123. [Google Scholar]
- Delgado, P.C. Prediction and Interpretation of Events Through Variable Relevance Analysis in Machine Learning Models. Ph.D. Thesis, University of Huelva, Huelva, Spain, 2022. [Google Scholar]
- Yang, D.H.; Zhu, K.H.; Wang, R.N. Forecasting healthcare service volumes with machine learning algorithms. J. Forecast. 2024, 43, 2358–2377. [Google Scholar] [CrossRef]
- Jagadeeswari, T.; Sadineni, G.; Srinivasa Rao, N. Deep Learning Multi-view Paradigm to Forecast Medical Spending on Patients. In International Conference on Intelligent Systems and Sustainable Computing; Springer: Singapore, 2022; pp. 311–321. [Google Scholar]
- Rajula, H.S.R.; Verlato, G.; Manchia, M.; Antonucci, N.; Fanos, V. Comparison of conventional statistical methods with machine learning in medicine: Diagnosis, drug development, and treatment. Medicina 2020, 56, 455. [Google Scholar] [CrossRef] [PubMed]
- Bote-Curiel, L.; Munoz-Romero, S.; Gerrero-Curieses, A.; Rojo-Álvarez, J.L. Deep learning and big data in healthcare: A double review for critical beginners. Appl. Sci. 2019, 9, 2331. [Google Scholar] [CrossRef]
- Mienye, I.D.; Jere, N. Optimized ensemble learning approach with explainable AI for improved heart disease prediction. Information 2024, 15, 394. [Google Scholar] [CrossRef]
- Hernandez, J.I.; van Cranenburgh, S.; de Bruin, M.; Stok, M.; Mouter, N. Using XGBoost and SHAP to explain citizens’ differences in policy support for reimposing COVID-19 measures in the Netherlands. Qual. Quant. 2024, 59, 381–409. [Google Scholar] [CrossRef]
- Rajbahadur, G.K.; Wang, S.; Oliva, G.A.; Kamei, Y.; Hassan, A.E. The impact of feature importance methods on the interpretation of defect classifiers. IEEE Trans. Softw. Eng. 2021, 48, 2245–2261. [Google Scholar] [CrossRef]
- Wang, Z.; Yuan, H.; Lin, K.; Zhang, Y.; Xue, Y.; Liu, P.; Chen, Z.; Wu, M. Artificial intelligence-empowered assessment of bile duct stone removal challenges. Expert Syst. Appl. 2024, 258, 125146. [Google Scholar] [CrossRef]
- Wang, C. Stock return prediction with multiple measures using neural network models. Financ. Innov. 2024, 10, 72. [Google Scholar] [CrossRef]
- Charles, V.; Rana, N.P.; Carter, L. Artificial Intelligence for Data-Driven Decision-Making and Governance in Public Affairs; Elsevier: Amsterdam, The Netherlands, 2022; Volume 39, p. 10 1742.
- Fatima, S.; Hussain, A.; Amir, S.B.; Ahmed, S.H.; Aslam, S.M.H. XGBoost and random forest algorithms: An in depth analysis. Pak. J. Sci. Res. 2023, 3, 26–31. [Google Scholar] [CrossRef]
- Bhadouria, A.S.; Singh, R.K. Machine learning model for healthcare investments predicting the length of stay in a hospital & mortality rate. Multimed. Tools Appl. 2024, 83, 27121–27191. [Google Scholar]
- Elgeldawi, E.; Sayed, A.; Galal, A.R.; Zaki, A.M. Hyperparameter tuning for machine learning algorithms used for arabic sentiment analysis. Informatics 2021, 8, 79. [Google Scholar] [CrossRef]
- Sixian, L.; Imamura, Y.; Ahmed, A. Application of Shapley Additive Explanation towards Determining Personalized Triage from Health Checkup Data. In International Conference on Pervasive Computing Technologies for Healthcare; Springer: Cham, Switzerland, 2022; pp. 496–509. [Google Scholar]
- Nordin, N.; Zainol, Z.; Noor, M.H.M.; Chan, L.F. An explainable predictive model for suicide attempt risk using an ensemble learning and Shapley Additive Explanations (SHAP) approach. Asian J. Psychiatry 2023, 79, 103316. [Google Scholar] [CrossRef]
- Wise, S.; Woods, M.; Van Gool, K. Pricing Long-Term Care for Older Persons; Australian Case Study; World Health Organization: Geneva, Switzerland, 2021. [Google Scholar]
- van Gaans, D.; Dent, E. Issues of accessibility to health services by older Australians: A review. Public Health Rev. 2018, 39, 20. [Google Scholar] [CrossRef]
- Sangal, A.; Joshi, S. The Determinants of Public Expenditure on Population Health Outcomes in Australia. J. Namib. Stud. 2023, 38, 761–773. [Google Scholar]
- García-Goñi, M.; Fouda, A.; Calder, R.V.; Paolucci, F. A new funding model for a chronic-care focused healthcare system in Australia. Health Policy Technol. 2018, 7, 293–301. [Google Scholar] [CrossRef]
- Rousis, N.I.; Li, Z.; Bade, R.; McLachlan, M.S.; Mueller, J.F.; O’Brien, J.W.; Samanipour, S.; Tscharke, B.J.; Thomaidis, N.S.; Thomas, K.V. Socioeconomic status and public health in Australia: A wastewater-based study. Environ. Int. 2022, 167, 107436. [Google Scholar] [CrossRef]
- Xu, P.; Blyth, F.M.; Naganathan, V.; Cumming, R.G.; Handelsman, D.J.; Seibel, M.J.; Le Couteur, D.G.; Waite, L.M.; Khalatbari-Soltani, S. Socioeconomic inequalities in Elective and nonelective hospitalizations in older men. JAMA Netw. Open 2022, 5, e226398. [Google Scholar] [CrossRef]
- Zhao, Y.; Atun, R.; Oldenburg, B.; McPake, B.; Tang, S.; Mercer, S.W.; Cowling, T.E.; Sum, G.; Qin, V.M.; Lee, J.T. Physical multimorbidity, health service use, and catastrophic health expenditure by socioeconomic groups in China: An analysis of population-based panel data. Lancet Glob. Health 2020, 8, e840–e849. [Google Scholar] [CrossRef]
- Duckett, S. Expanding the breadth of Medicare: Learning from Australia. Health Econ. Policy Law 2018, 13, 344–368. [Google Scholar] [CrossRef]
- Gibson, D.; Goss, J.; Hall, J. Health and Aged Care in the Intergenerational report. In More than Fiscal: The Intergenerational Report, Sustainability and Public Policy in Australia; ANU Press: Canberra, Australia, 2023; pp. 1–30. [Google Scholar]
- Kehoe, H.; Schütze, H.; Spurling, G.; Lovett, R. Medicare policy changes to primary health care funding for Australia’s indigenous Peoples 1996–2023: A scoping review. Int. J. Equity Health 2024, 23, 245. [Google Scholar] [CrossRef] [PubMed]
- Lartey, S.T.; Lung, T.; Serhal, S.; Bereznicki, L.; Bereznicki, B.; Emmerton, L.; Bosnic-Anticevich, S.; Saini, B.; Billot, L.; Krass, I. Healthcare expenditure and its socio-demographic and clinical predictors in Australians with poorly controlled asthma. PLoS ONE 2023, 18, e0279748. [Google Scholar] [CrossRef] [PubMed]
- Khan, M.; Shiwlani, A.; Qayyum, M.U.; Sherani, A.M.K.; Hussain, H.K. AI-powered healthcare revolution: An extensive examination of innovative methods in cancer treatment. BULLET J. Multidisiplin Ilmu 2024, 3, 87–98. [Google Scholar]
- Aswathy, R.; Sumathi, S. The evolving landscape of cervical cancer: Breakthroughs in screening and therapy through integrating biotechnology and artificial intelligence. Mol. Biotechnol. 2025, 67, 925–941. [Google Scholar] [CrossRef]
| Disclaimer/Publisher’s Note: The statements, opinions and data contained in all publications are solely those of the individual author(s) and contributor(s) and not of MDPI and/or the editor(s). MDPI and/or the editor(s) disclaim responsibility for any injury to people or property resulting from any ideas, methods, instructions or products referred to in the content. |
© 2025 by the authors. Licensee MDPI, Basel, Switzerland. This article is an open access article distributed under the terms and conditions of the Creative Commons Attribution (CC BY) license (https://creativecommons.org/licenses/by/4.0/).


