Article

Deep Multimodal-Interactive Document Summarization Network and Its Cross-Modal Text–Image Retrieval Application for Future Smart City Information Management Systems

1
Faculty of Data Science, City University of Macau, Macao SAR, China
2
Department of Automation, Tsinghua University, Beijing 100084, China
*
Authors to whom correspondence should be addressed.
Smart Cities 2025, 8(3), 96; https://doi.org/10.3390/smartcities8030096
Submission received: 28 March 2025 / Revised: 27 May 2025 / Accepted: 31 May 2025 / Published: 6 June 2025

Abstract

:

Highlights

What are the main findings?
  • A novel deep multimodal-interactive network is proposed to generate document abstracts and select important images, enhancing understanding of document content and showcasing strong summarization capabilities for future smart city data management.
  • A new multimodal dataset built upon an example of research papers overcomes the limitations of existing summarization benchmarks, where evaluation results suggest the proposed method would effectively manage complex urban document data in future smart city contexts.
What is the implication of the main finding?
  • The multimodal learning framework integrates textual and visual information to enhance document understanding and would aid smart city applications such as accident scene documentation and automated environmental monitoring.
  • The multimodal learning network excels in document summarization and enables effective image–text cross-modal retrieval, indicating its strong potential for smart city information management systems.

Abstract

Urban documents like city planning reports and environmental data often feature complex charts and texts that require effective summarization tools, particularly in smart city management systems. These documents increasingly use graphical abstracts alongside textual summaries to enhance readability, making automated abstract generation crucial. This study explores the application of summarization technology using scientific paper abstract generation as a case. The challenge lies in processing the longer multimodal content typical in research papers. To address this, a deep multimodal-interactive network is proposed for accurate document summarization. This model enhances structural information from both images and text, using a combination module to learn the correlation between them. The integrated model aids both summary generation and significant image selection. For the evaluation, a dataset is created that encompasses both textual and visual components along with structural information, such as the coordinates of the text and the layout of the images. While primarily focused on abstract generation and image selection, the model also supports text–image cross-modal retrieval. Experimental results on the proprietary dataset demonstrate that the proposed method substantially outperforms both extractive and abstractive baselines. In particular, it achieves a Rouge-1 score of 46.55, a Rouge-2 score of 16.13, and a Rouge-L score of 24.95, improving over the best comparison abstractive model (Pegasus: Rouge-1 43.63, Rouge-2 14.62, Rouge-L 24.46) by approximately 2.9, 1.5, and 0.5 points, respectively. Even against strong extractive methods like TextRank (Rouge-1 30.93) and LexRank (Rouge-1 29.63), our approach shows gains of over 15 points in Rouge-1, underlining its effectiveness in capturing both textual and visual semantics. These results suggest significant potential for smart city applications—such as accident scene documentation and automated environmental monitoring summaries—where rapid, accurate processing of urban multimodal data is essential.

1. Introduction

The rapid advancement of smart-city infrastructures has precipitated an urgent requirement for efficient processing of the ever-increasing volume of multimodal urban data. In particular, transportation incident reports demand concurrent interpretation of narrative descriptions and corresponding scene imagery to support timely decision-making and situational awareness [1]. Environmental monitoring systems [2] produce thousands of sensor data charts daily, while urban planning documents [3] feature complex text–diagram layouts. Scientific papers, as exemplars of structured multimodal documents, provide valuable methodological insights for tackling these urban data challenges. The exponential growth of scholarly publications has been further accelerated by recent technological advancements, including the emergence of large language models (LLMs) like GPT-4, Llama 3, and Qwen 2.5 [4], especially following the onset of the 2024 pandemic. According to the latest Stanford AI Index Report [5], the number of published scientific papers has surged 1.4 times over the past five years, now reaching approximately 500,000 annually, with significant contributions in areas such as multimodal language models, generative AI, and healthcare AI [6]. This rapid expansion poses a significant challenge for researchers, who must navigate an overwhelming volume of information.
To address these challenges, natural language processing (NLP) [7] technologies can be employed to generate multimodal summaries of scientific papers, thereby enabling researchers to efficiently grasp the forefront of research topics. Scientific papers are complex documents [8] that integrate text, visual, and structural information, encompassing not only textual content but also visual elements [9,10] such as charts, figures, and tables. These visual components provide researchers with a visual understanding of the paper’s content, while the textual components offer detailed information. Structural information, which includes the coordinate and layout of textual and visual elements, also plays a critical role in conveying meaning. For example, the positioning and scale of both images [11] and textual content often serve as indicators of their relative importance, with images placed earlier and text segments of larger size typically denoting greater significance. While the graphical abstract [12] effectively captures essential visual and structural aspects of the work, it falls short in conveying the specific details of the paper’s content. Consequently, a comprehensive multimodal summary, integrating both the abstract and key visual elements, is imperative. Such an approach can harness the complementary strengths of various modalities [13], thereby enhancing comprehension and advancing the efficiency of research.
Scientific document summarization has long been a foundational task in the field of NLP. Early summarization methods were limited to text-based approaches [14], but recent advancements in multimodal summarization have expanded its applications to domains such as social media analysis, e-learning, and medical imaging summarization [15]. Unlike traditional text-only models, multimodal summarization models provide a more holistic approach to capturing the essence of a document. In scientific papers, textual and visual information often conveys complementary content at different semantic levels, with a significant degree of semantic similarity between the two modalities [16,17,18]. These cross-modal correlations enable one modality to fill in the information gaps of the other. Furthermore, it is essential to consider the structural information, which includes the spatial arrangement and layout of textual and visual elements.
This paper takes scientific paper abstract generation as a methodological proving ground, proposing a novel deep multimodal-interactive network designed to simultaneously generate an abstract and select the most representative image from scientific papers. Figure 1 shows some input and output examples, which implies the primary goals and pipelines of this work. This approach enhances the understanding of the research content by integrating both textual and visual modalities. This multimodal learning framework has a structural information enhancement module that incorporates text coordinates and image layouts to improve semantic understanding of a paper’s structure. Leveraging large language models, our method generates abstracts and selects key images. We validate it on a newly constructed dataset integrating structural information for both text and images. Future work will extend the dataset to additional smart city document types and enable text–image cross-modal retrieval applications—such as accident-scene image localization, environmental-monitoring visualization, and decision support [19,20,21,22,23]. To summarize, the main contributions of this work are as follows:
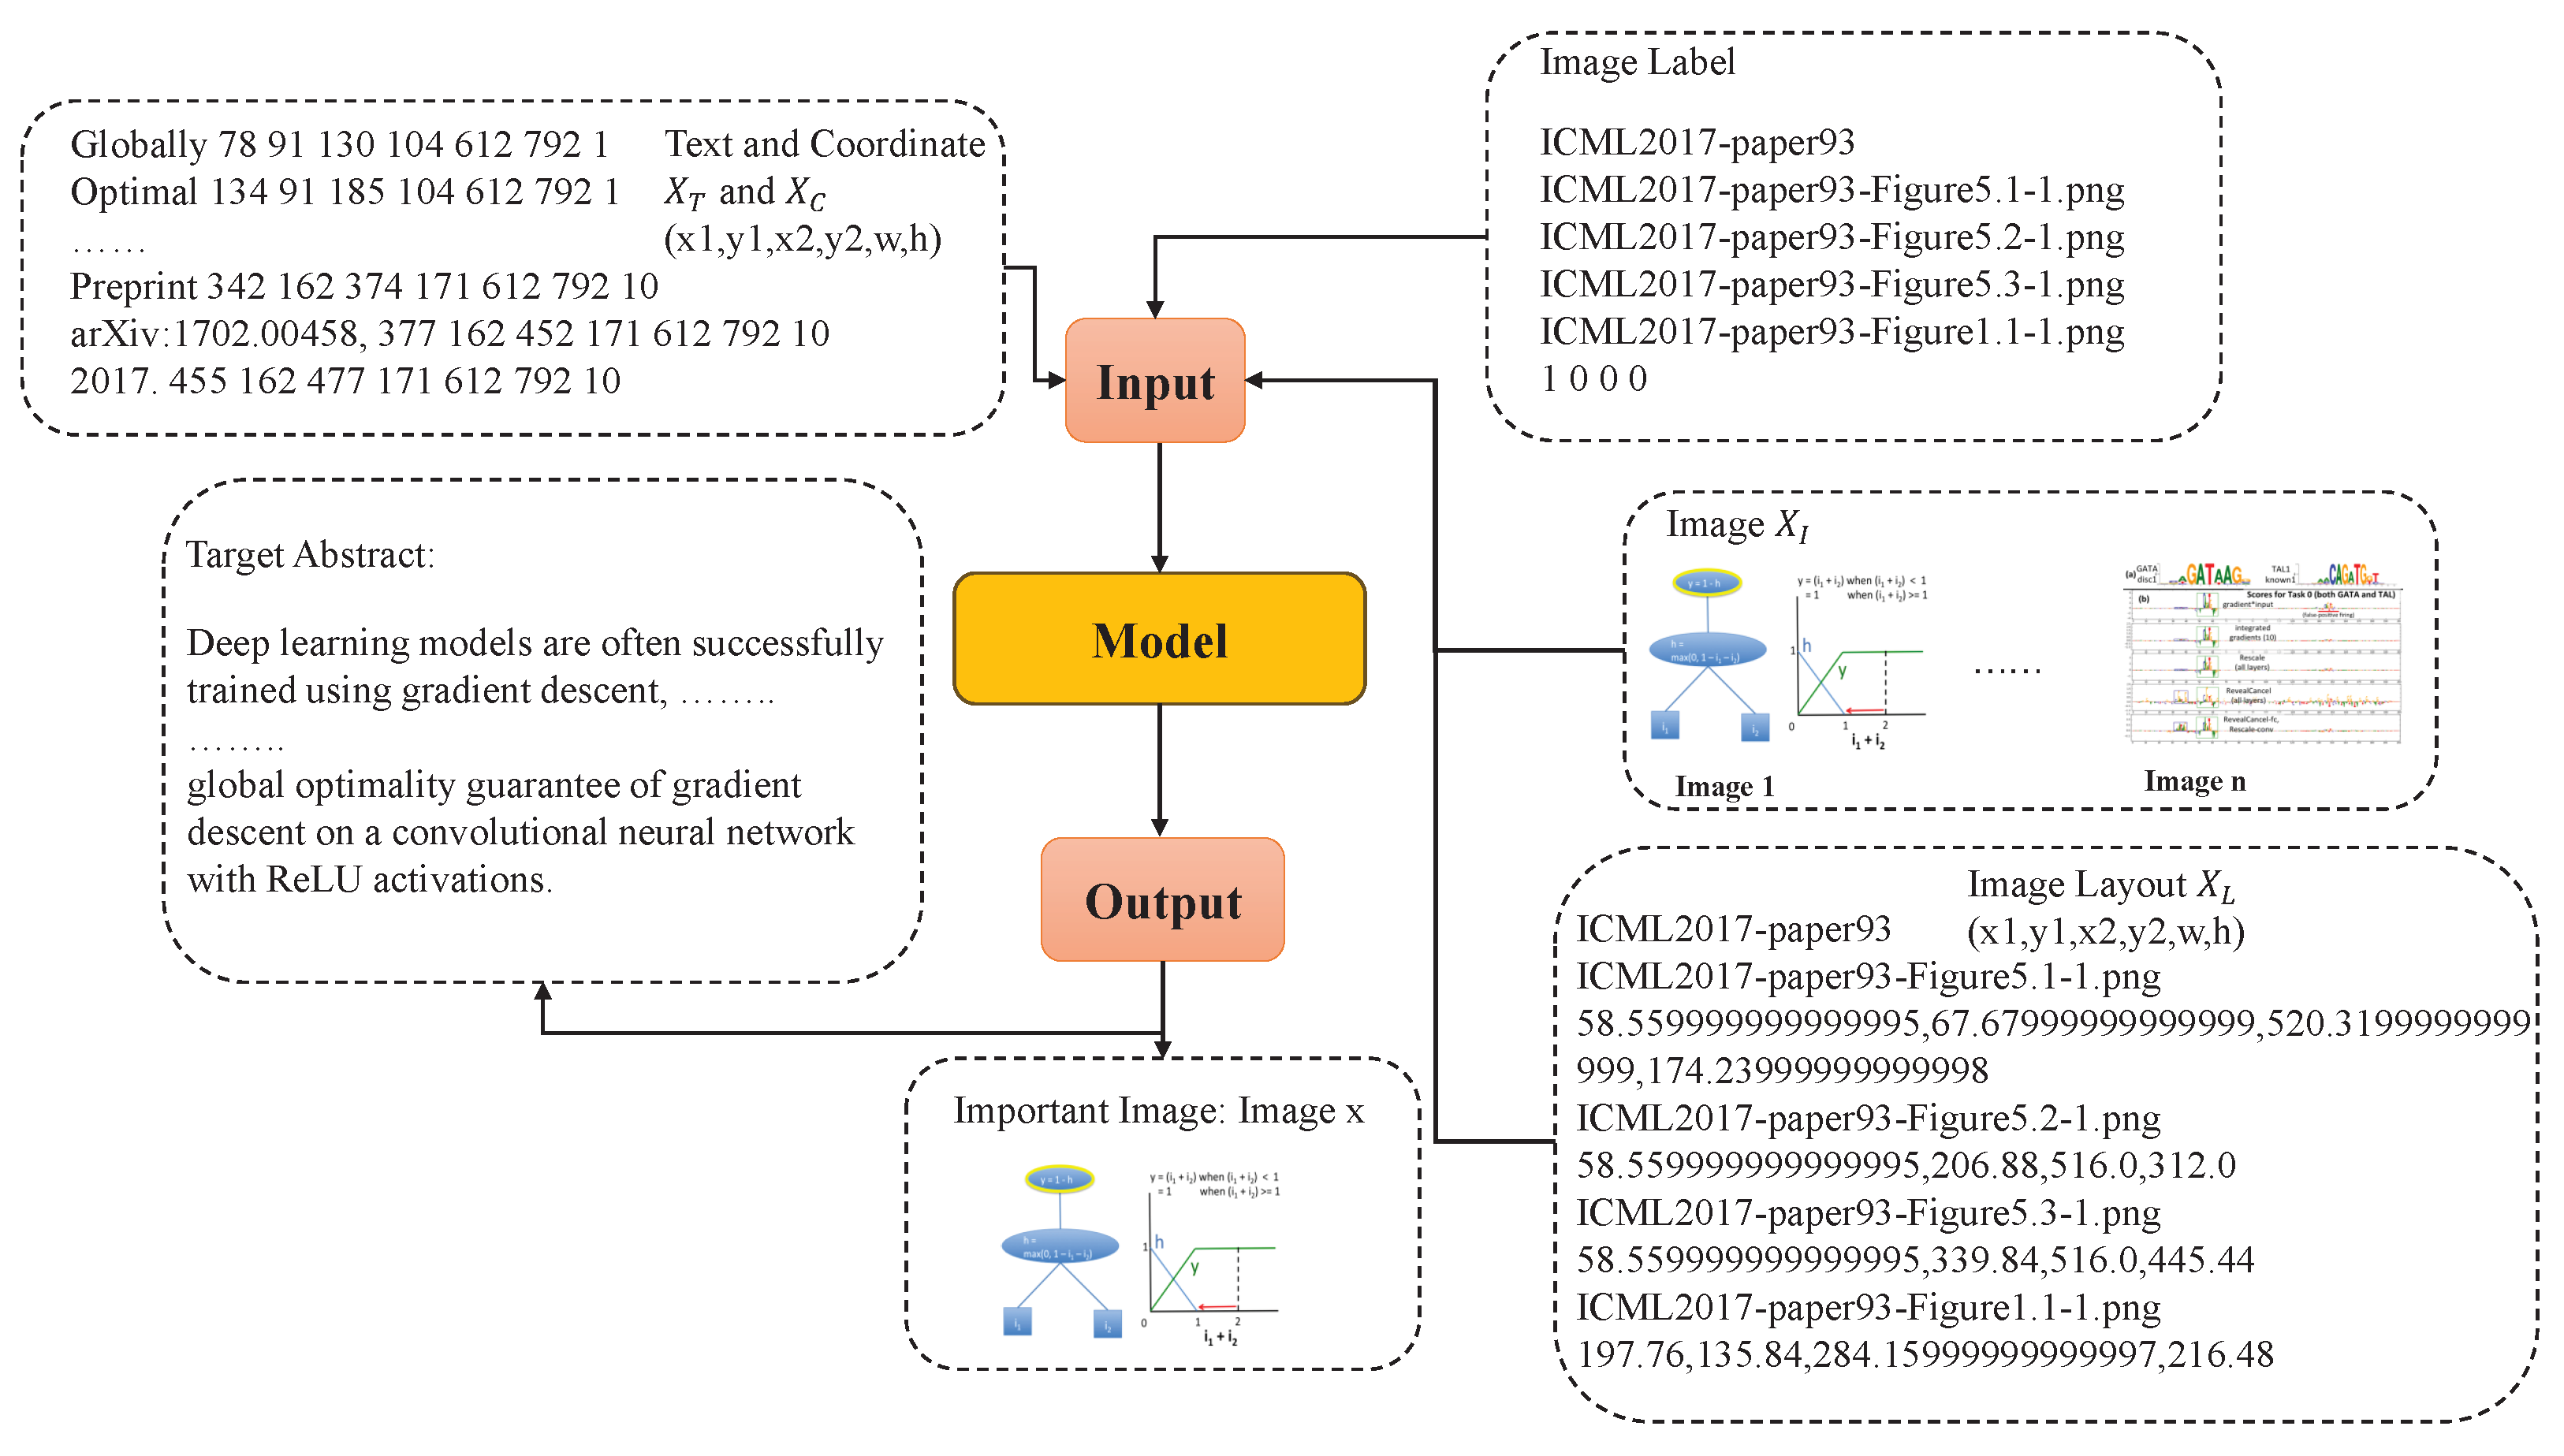
  • A novel deep multimodal-interactive network generates the abstract of a research paper while simultaneously selecting its most representative image. This approach facilitates a deeper understanding of the research content. By integrating both textual and visual modalities that convey complementary information at different semantic levels through a combination module, the multimodal learning framework enables researchers to access paper information beyond the constraints of text alone, thereby advancing scientific research.
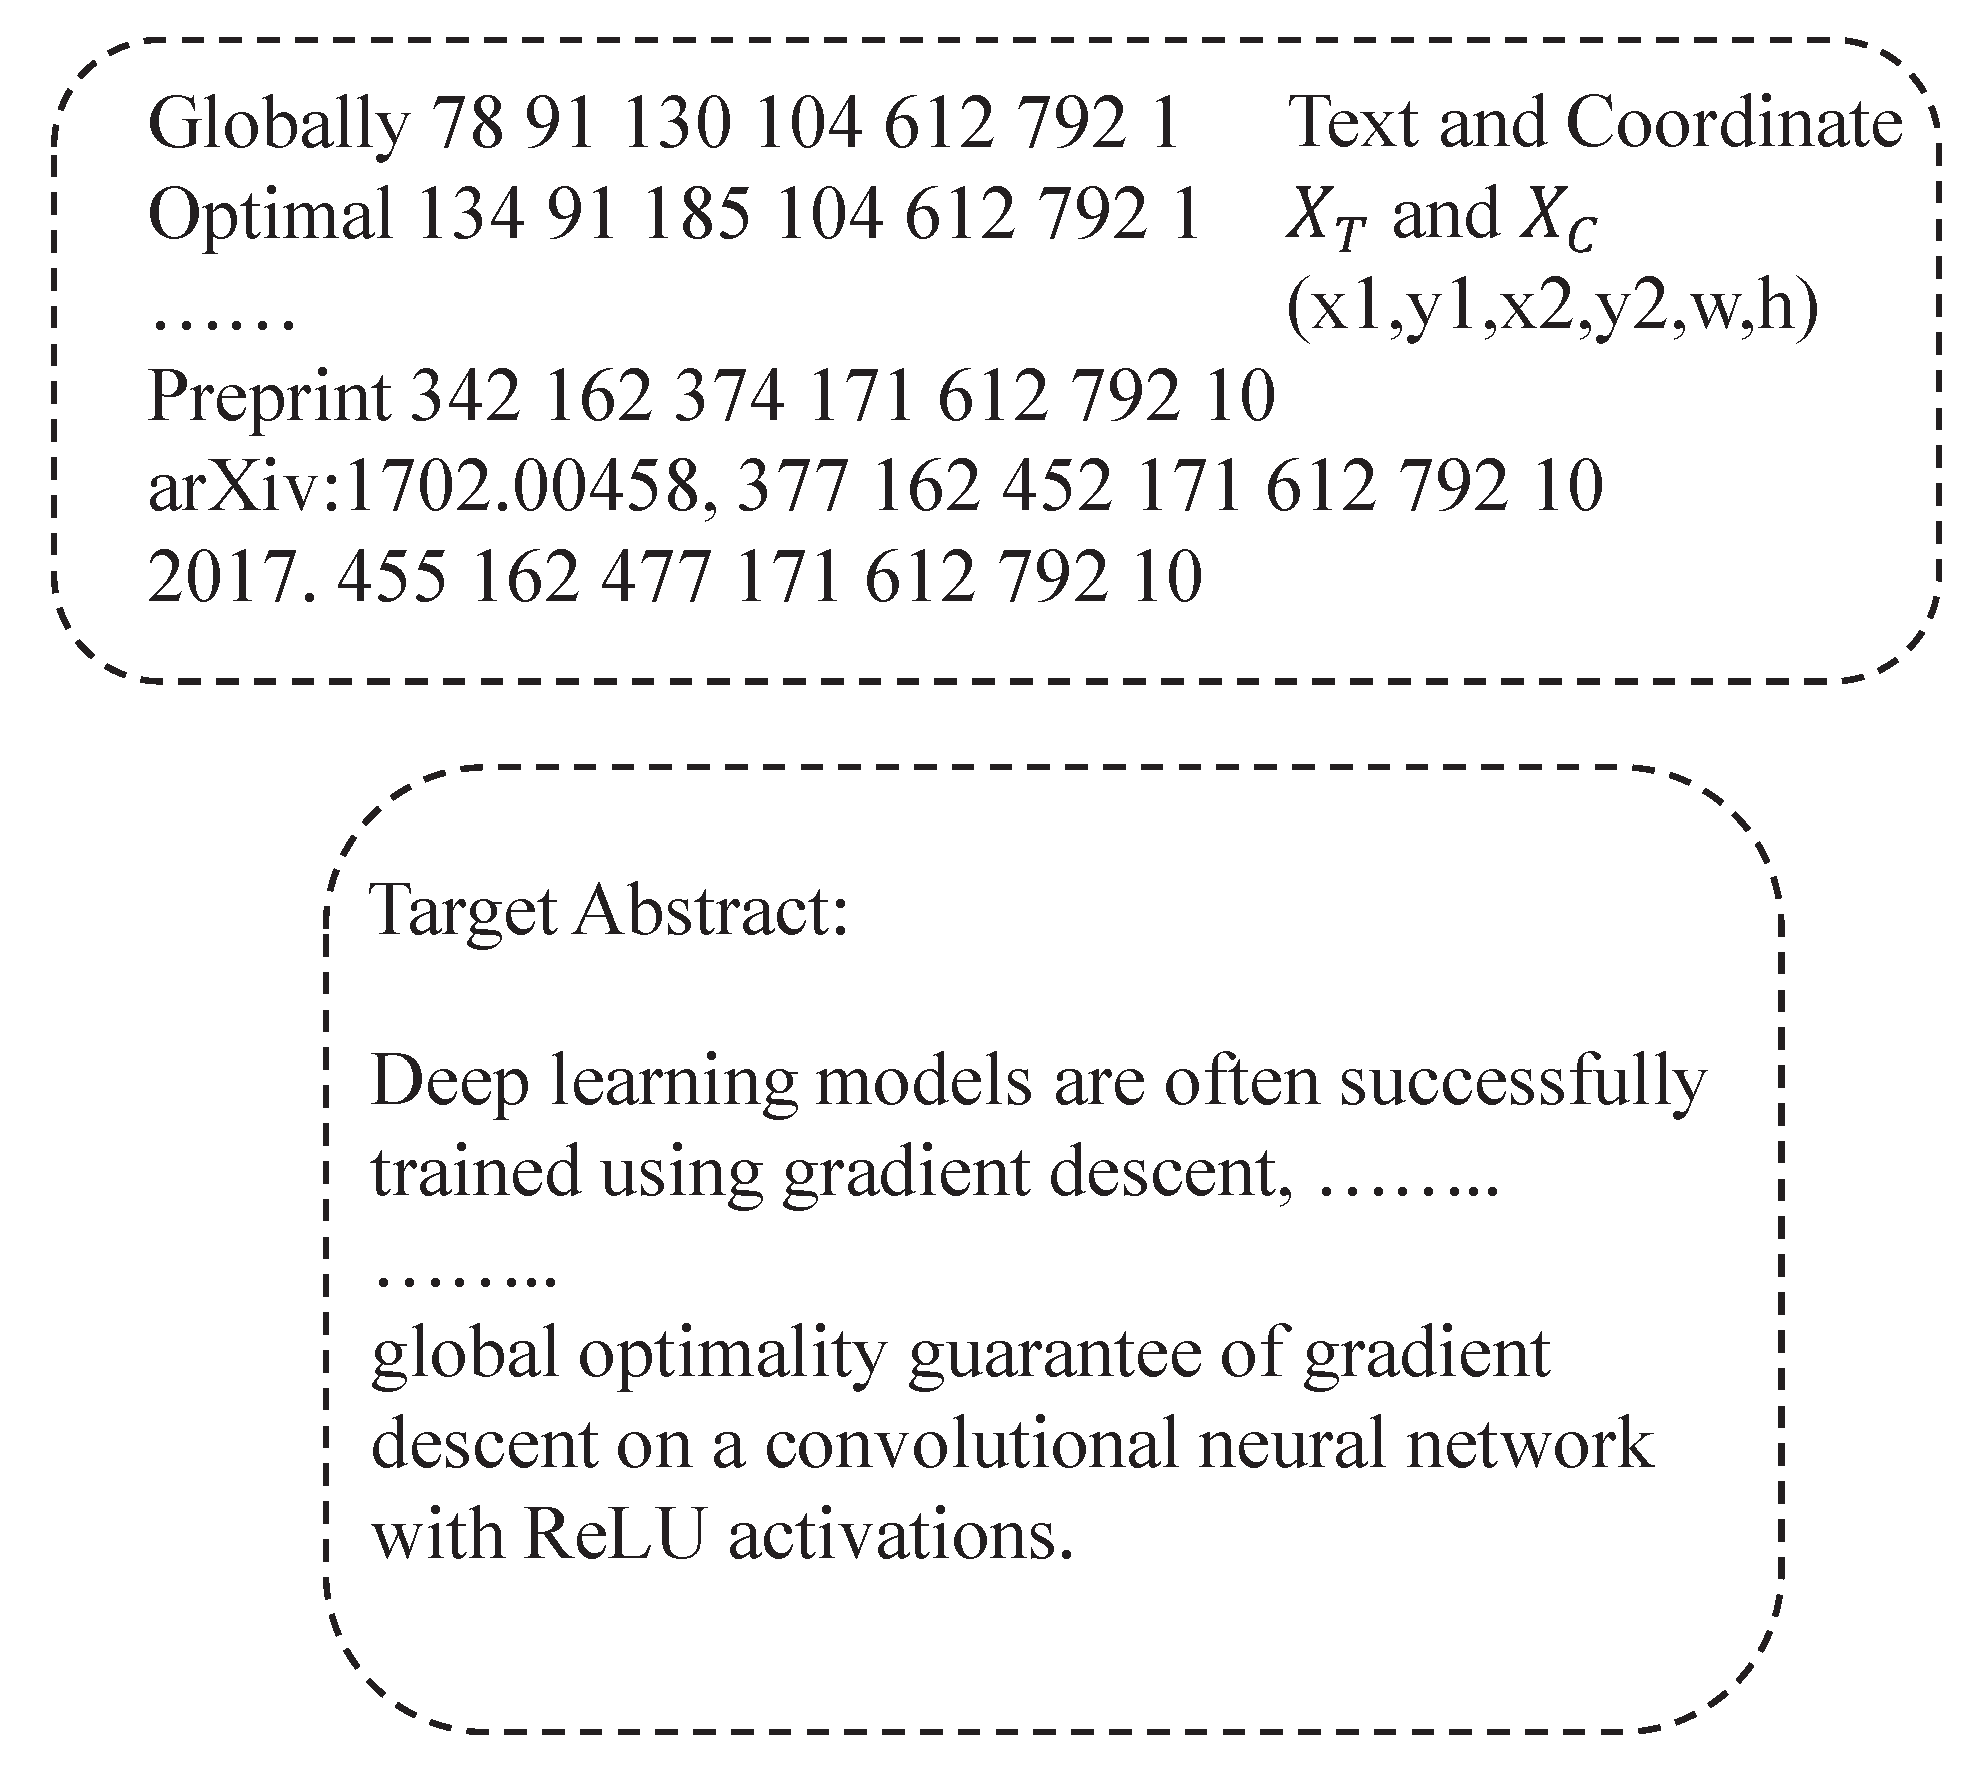
  • A structural information enhancement module is proposed, which integrates the spatial arrangement and layout of textual and visual components to improve semantic comprehension of document structure by generating concise summaries that incorporate both the abstract and the most salient image.
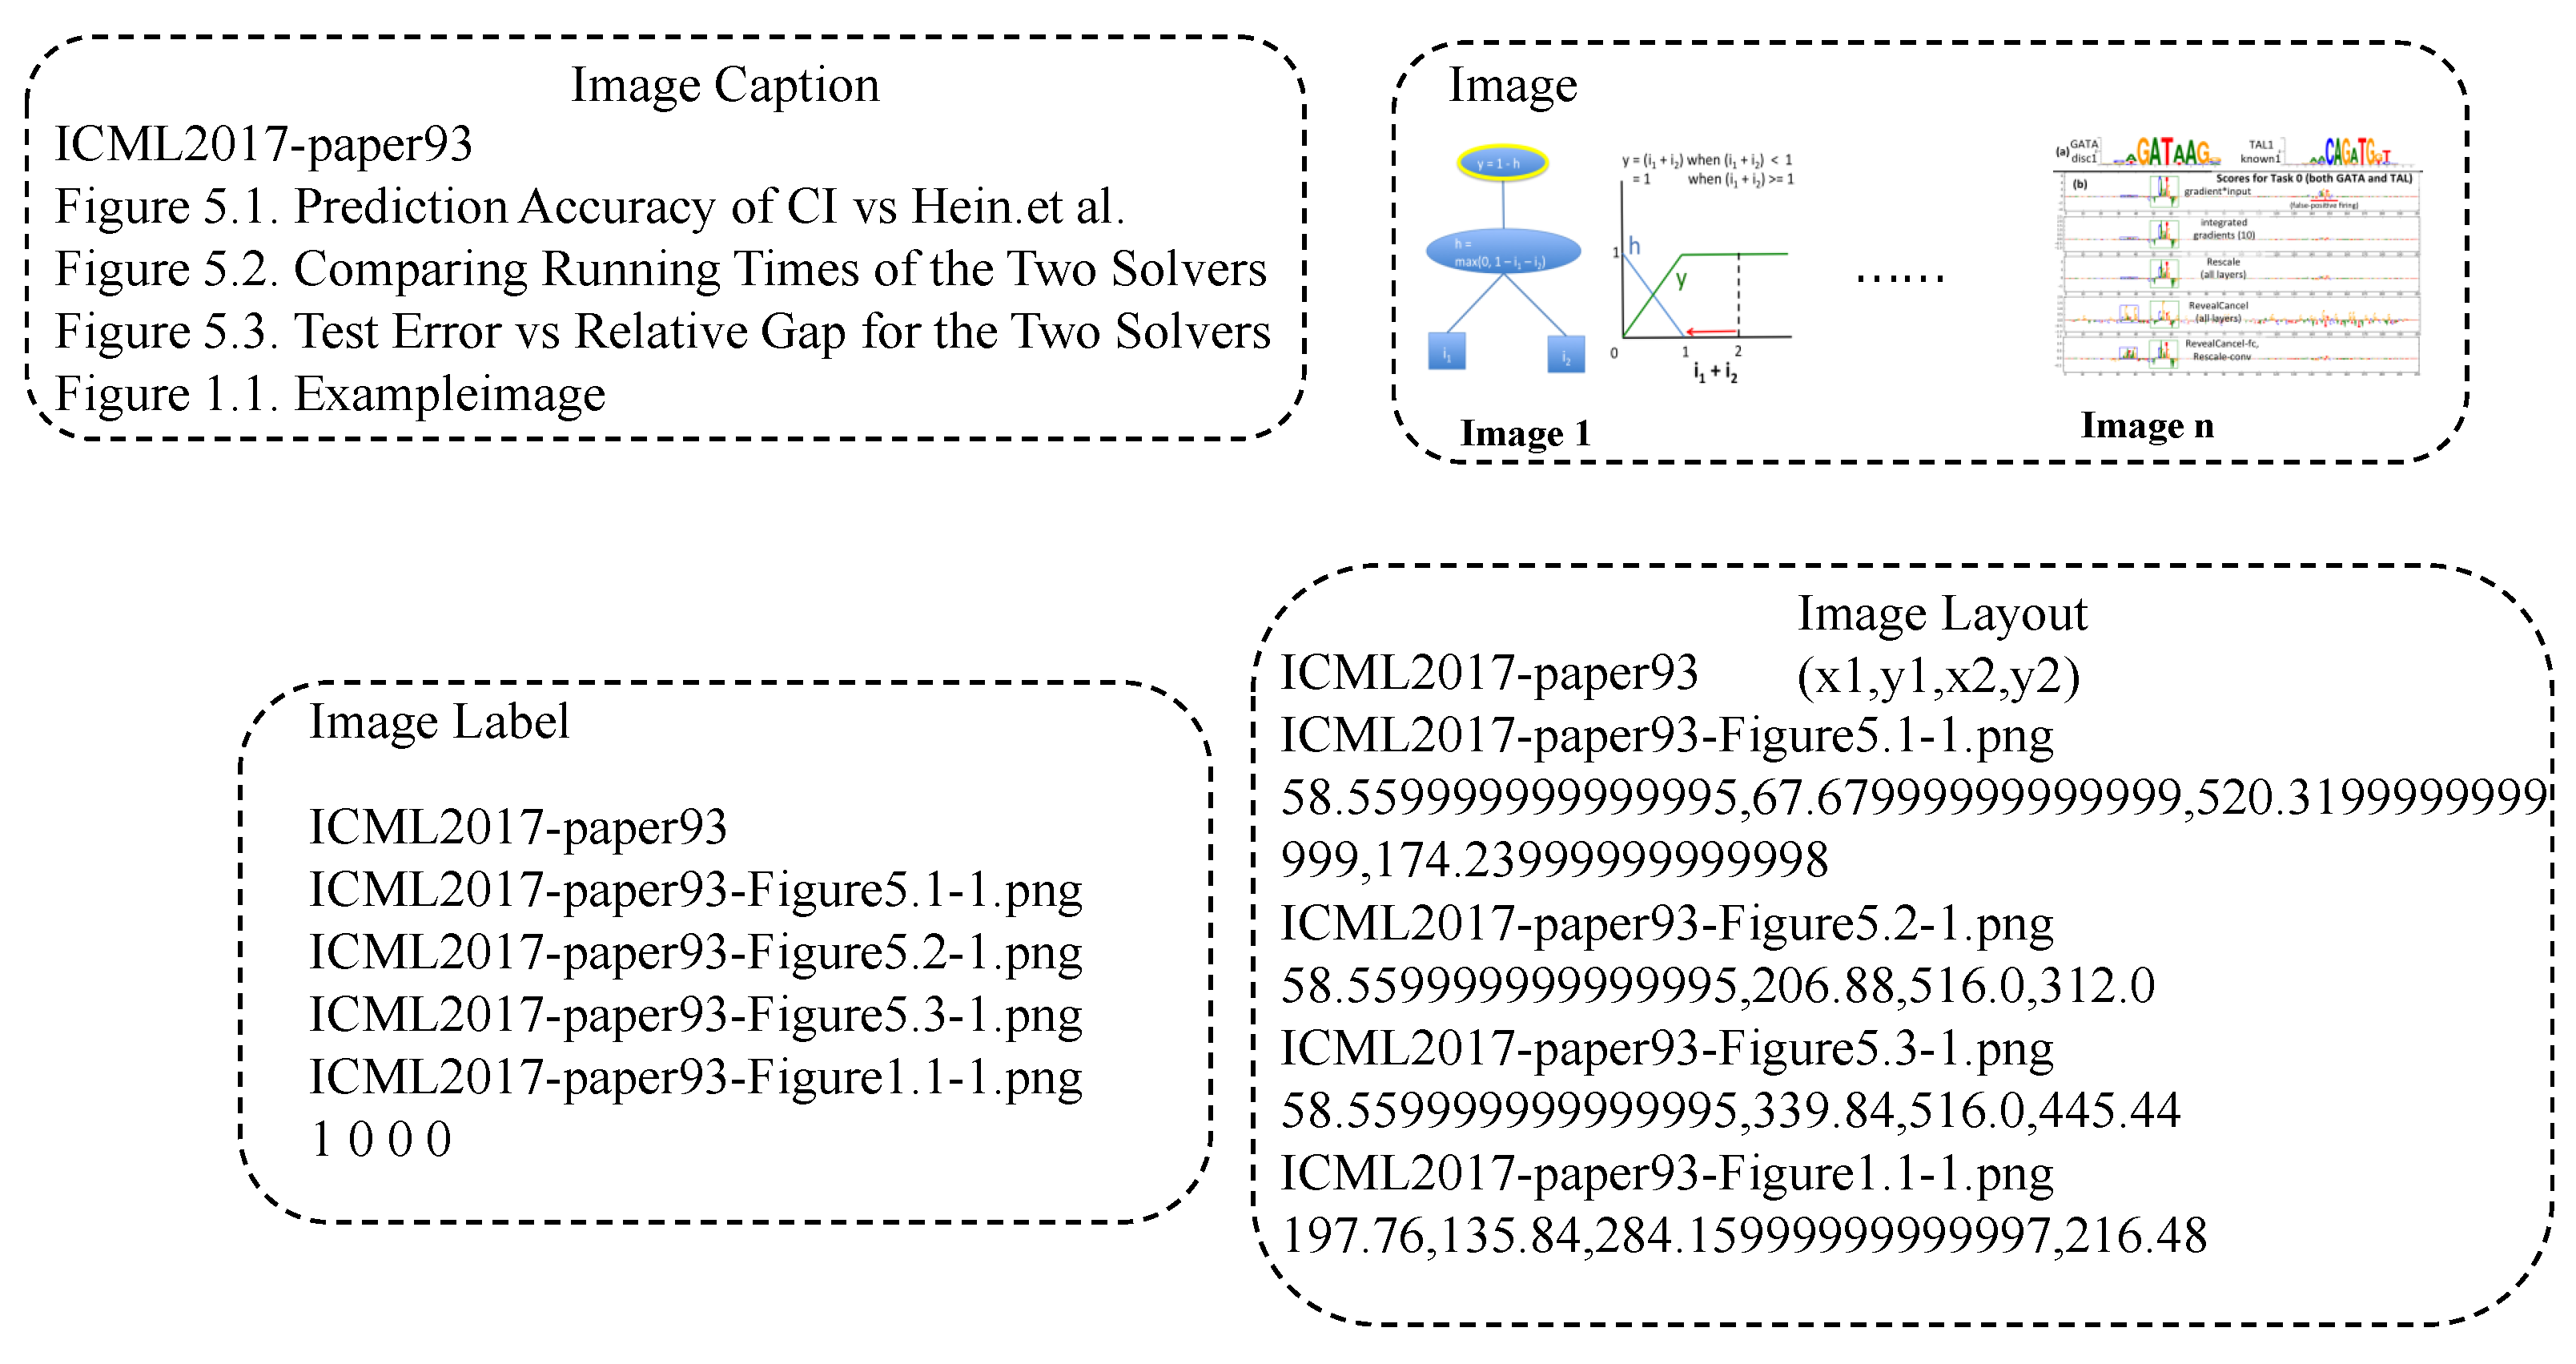
  • A novel multimodal dataset enriched with structural annotations is constructed to facilitate comprehensive evaluation. This dataset addresses the shortcomings of existing summarization corpora, which predominantly provide only textual and visual modalities for training and validation.
  • Extensive experiments validate the superiority of the proposed multimodal learning framework across several key performance metrics. Furthermore, the model supports image–text cross-modal retrieval, demonstrating its robust performance and promising applicability to future smart city information management systems.
In the next section, we discuss some related works in the field of paper summarization and abstract generation. Subsequently, the proposed framework is detailed in Section 3, followed by a presentation of all experimental results in Section 4. Finally, in Section 4.7 and Section 5, we discuss future research directions and summarize this work.

2. Related Work

2.1. Document Summarization

Smart city data, including spatiotemporal traffic data [24] and cargo transportation information [25], often comes in text and image formats. Natural language processing (NLP) is a common method used to analyze this data. NLP technology can evaluate the shape, sound, and context of the collected information by leveraging computational resources. In the context of smart city applications—such as text and voice assistants in homes and businesses—NLP plays a crucial role in efficient data retrieval and analysis. It is also applied in medical data analysis [26,27,28], managing social networking platforms, language translation for improved communication, opinion mining, and Big Data Analytics (BDA) [29,30]. Among them, scientific document summarization has emerged as a significant research topic within the field of NLP [31,32]. This area encompasses various research directions, including dataset creation and multiple generation tasks such as abstract generation, literature review generation, figure caption generation, keyword extraction, and paper poster generation [33,34,35]. The development of summarization models is greatly influenced by the characteristics of the underlying datasets. While some models utilize textual content directly, others incorporate auxiliary information, such as text length and structural features [36,37,38], to aid in summary generation, including abstract creation. The combination of different datasets and tasks has established a comprehensive research framework in the domain of scientific document summarization. However, most of these methods primarily rely on text-based approaches, often overlooking the rich information embedded within the papers. The intricate structure and extensive length of scientific documents create challenges in identifying the most representative components that effectively encapsulate the paper’s information. To address this, researchers have investigated alternative modalities, particularly graphical abstracts, to create more concise summaries. The graphical abstract serves as the most critical visual element in our methodology, providing a succinct yet comprehensive representation of the paper’s core concepts. Insights from related studies, such as those by Backer Johnsen et al. [39], emphasize the diversity of graphical abstracts in terms of expressive modes and clarity of arguments presented. Additionally, Ma et al. [40] highlighted the role of graphical abstracts in engaging readers and facilitating the dissemination of research findings to both domain experts and interdisciplinary scholars. Beyond textual descriptions, the visual modality offers unique advantages through the use of colors and line elements [41], thereby complementing the information conveyed by text. This synergy between textual and visual modalities underscores their complementary roles in effectively communicating scientific information [42,43].

2.2. Multimodal Summarization Techniques

Nowadays, multimodal summarization is rapidly developing, having many applications like reference text summarization [44] and meeting recordings summarization [45]. Different from the text-only summarization [46], multimodal summarization can combine the feature from many modalities such as text and images, generating a meaningful summary which contain the multimodal semantics. Multimodal summarization methodologies are roughly divided into two types: Multimodal Summarization with Single-modal Output (MSSO) [47] and Multimodal Summarization with Multimodal Output (MSMO) [48].
MSSO (Multimodal Summarization with Single Output) focuses on generating high-quality textual summaries from heterogeneous multimodal inputs, producing only a single (textual) output. Li et al. [49] proposed a pioneering multimodal summarization framework trained on asynchronous documents, images, audio, and video. Their approach leverages four complementary criteria for sentence selection—namely, relevance, redundancy reduction, modality agreement, and informativeness—to significantly enhance the fidelity and coherence of the resulting summaries. In a subsequent work, Li et al. [50] focused on the visual modality and proposed image filters, which are further refined through inner- and inter-modality attention mechanisms. These methods focus on critical image patches and text units to generate textual summaries, facilitating the extraction of useful information from both modalities. In parallel, several advancements have centered around the optimization of multimodal models through attention mechanisms. Xiao et al. [51] introduced a contribution network aimed at identifying the most informative image segments for multimodal summarization. This method efficiently integrates multimodal information, improving the semantic richness of the summaries. Building on this, Lu et al. [52] proposed an attention-based multimodal network that refines the synthesis of multimodal inputs. Their approach enhances the semantic depth and logical coherence of the generated summaries by optimizing the interplay between modalities. In order to improve the quality of multimodal summarization, Li et al. [53] introduced a visual-guided modality regularization technique. This method directs the model’s focus to the most crucial visual and textual elements within the source content, thereby improving sentence-level summarization. Yuan et al. [54] explored the trade-off between task-relevant and task-irrelevant visual information within an Information Bottleneck framework, aiming to optimize the extraction of meaningful content for task-specific summarization. In the realm of opinion summarization, Im et al. [55] presented the self-supervised multimodal opinion summarization model. This approach addresses the heterogeneity among input modalities, enabling more coherent and informative summaries from diverse sources. Song et al. [56] leveraged a vision-to-prompt methodology to generate product summaries. By converting visual information into semantic attribute prompts, this model harnesses the pre-trained language model’s capabilities for generating coherent and contextually rich summaries. On a different front, Liu et al. [57] developed an annotation framework for multimodal dialogue summarization. This framework includes a video scene-cutting model and a set of standards for evaluating dialogue summaries, facilitating better integration of multimodal content. Zhang et al. [58] designed a multimodal generative adversarial network (GAN) that employs reinforcement learning techniques to generate concise and informative product titles. This model emphasizes the synthesis of visual and textual information, delivering more effective outputs in product summarization tasks.
MSMO (Multimodal Summarization with Multiple Outputs) extends beyond MSSO by explicitly modeling interactions among modalities to generate both textual and visual summaries. Specifically, MSMO architectures employ multimodal interaction networks to capture cross-modal semantics and jointly optimize collaborative objectives—such as key-element selection, alignment, and cross-modal coherence—thereby producing heterogeneous outputs (e.g., images and text). An early exemplar in this field is the work of Chen et al. [59], who introduced a multimodal attention mechanism to process images and text in parallel, enabling the generation of informative image summaries that complement the textual synopsis. Fu et al. [60] advanced this idea by proposing a model with bi-hop attention and an improved late fusion mechanism, which refined the generated summaries by extracting relevant images from video content. Their method produced both textual summaries and significant images simultaneously, addressing the challenges in summarizing articles and videos. In the same vein, Zhu et al. [61] developed a model designed for abstractive summarization, generating both textual summaries and the most relevant images for a given context. Their work laid the groundwork for more complex models that integrate multiple modalities in summarization tasks. This line of research was further expanded by Zhu et al. [62], who introduced a multimodal objective function that incorporates both image and text references during training. The combined loss function facilitated the generation of more coherent multimodal summaries by jointly considering both tasks in the model’s learning process. Tan et al. [63] contributed to the field by utilizing the power of large language models (LLMs) while effectively integrating multimodal information within a unified framework. Their approach not only generated text summaries but also selected a graphical abstract, thus enhancing the ability to summarize complex multimodal content. Similarly, Zhu et al. [64] presented a unified framework for multimodal summarization that integrated various tasks into a single system. They also introduced three unsupervised multimodal ranking models, which could be tailored to different tasks or scenarios based on specific requirements. Zhang et al. [65] proposed a unified multimodal summarization framework based on an encoder–decoder multi-task architecture built on BART. This framework was capable of simultaneously generating text summaries and selecting images, enabling more effective multimodal summarization. In a subsequent study, Zhang et al. [66] further enhanced inter-modality interaction by introducing a multimodal visual graph learning method. This method helped capture both structural and content information, facilitating stronger interactions between modalities. Zhuang et al. [48] addressed the evaluation aspect of multimodal summarization by designing mLLM-EVAL, a reference-free evaluation method utilizing multimodal LLMs. This model aimed to improve the accuracy and reliability of evaluating multimodal summaries without relying on manually annotated references. Mukherjee et al. [67] proposed a multi-task learning approach that simultaneously tackled two tasks: classifying in-article images as either “on-topic” or “off-topic” and generating a multimodal summary. The classification task served as an auxiliary task, helping the model to extract combined features from text and images for more effective summary generation.
Existing datasets in multimodal summarization field lack the annotation of image labels and the simultaneous acquisition of coordinates to obtain the structural information, making the most important image selection task difficult to accomplish [68]. The proposed method learns the correlations between images and text accompanied by structural information like the coordinates of text and layout of image, and a new dataset is created to provide more perspectives on multimodal learning to generate a scientific paper abstract.

3. Methodology

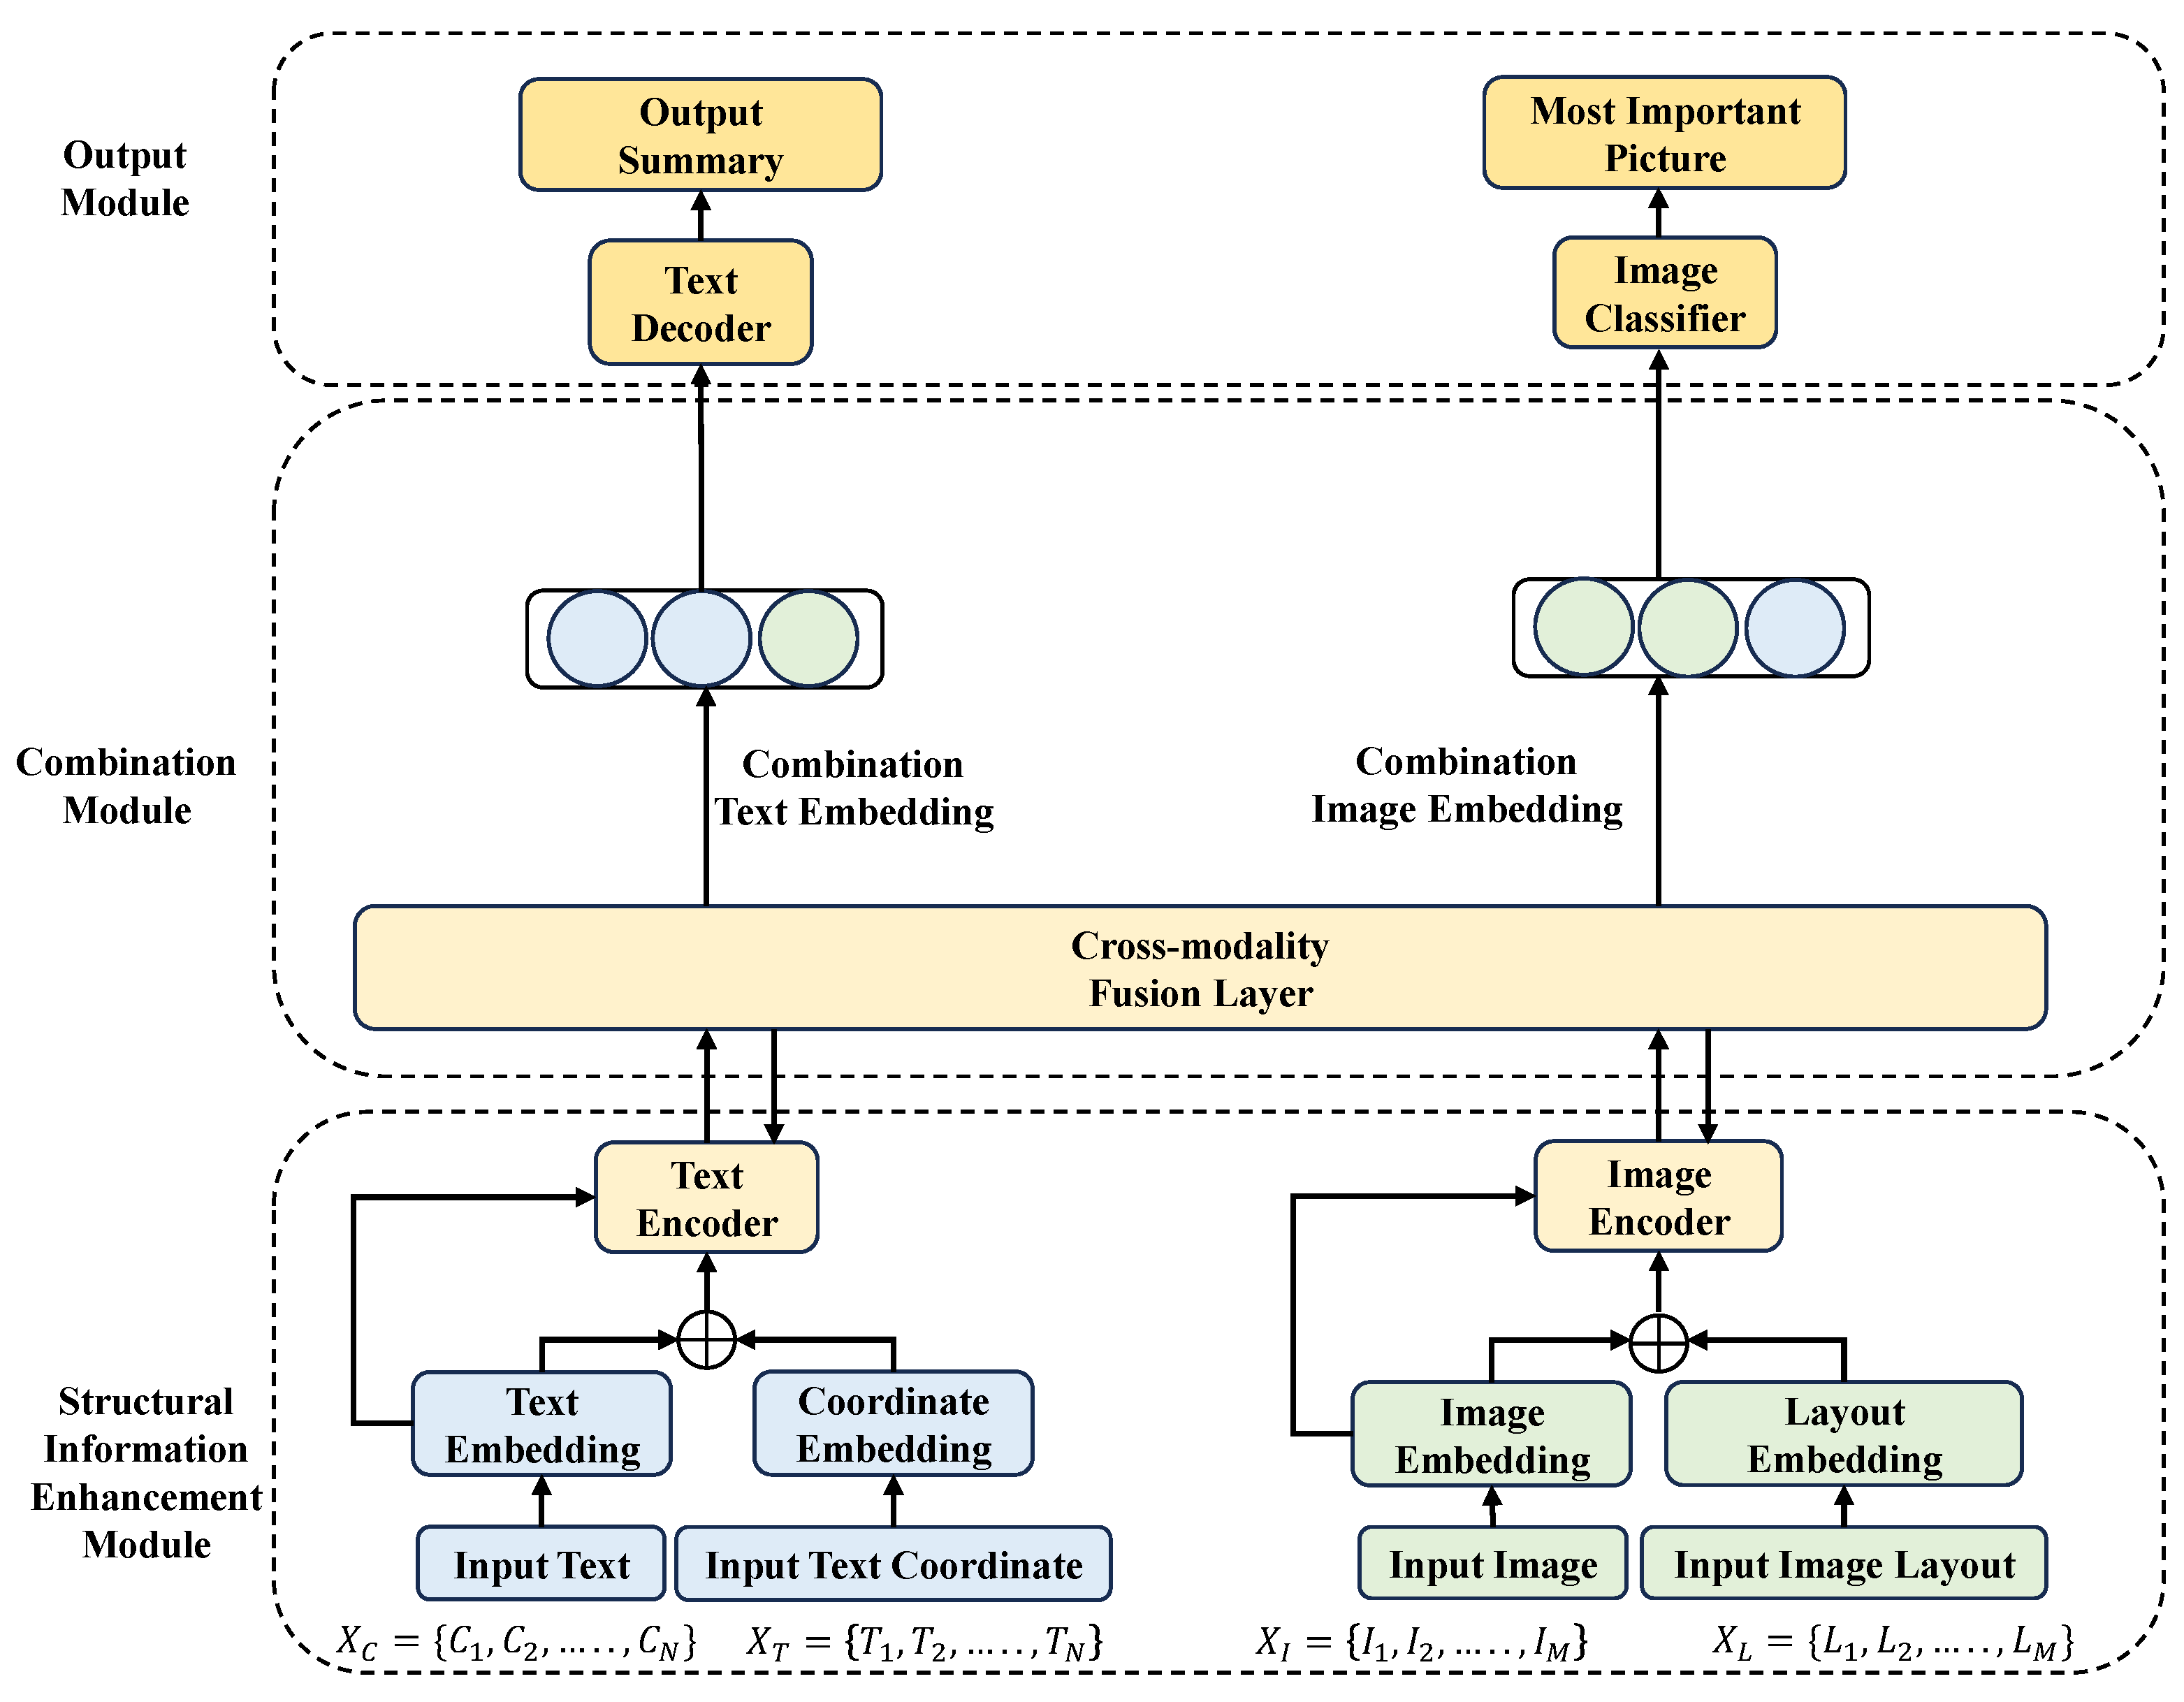
3.1. Overall Framework

The proposed novel multimodal deep learning framework jointly generates paper abstracts and identifies the most pertinent image. Our architecture enriches both textual and visual feature spaces through specialized modules, and then employs sophisticated fusion mechanisms to capitalize on cross-modal correlations. As depicted in Figure 2, the model comprises three core components: (1) a structural information enhancement module integrates spatial layout (e.g., text coordinates and image layout) into the feature extraction process, thereby preserving structural cues from both modalities; (2) a combination module establishes fine-grained alignments between semantic representations of text and image to produce a unified feature embedding; (3) an output module simultaneously refines the abstract generation and image selection objectives through a multi-task learning strategy. By hierarchically fusing information from text semantics, visual content, spatial coordinates, and layout, our framework effectively leverages complementary modalities to boost performance on both generation and retrieval tasks.
Our model takes as input the textual content X T = ( T 1 , , T N ) , text coordinates X C = ( C 1 , , C N ) , paper images X I = ( I 1 , , I M ) , and image layout information X L = ( L 1 , , L M ) of a scientific paper. The goal is to generate a multimodal summary consisting of an abstract Y t = ( y 1 , y 2 , , y t ) and the most important image Y i = I N . The model is defined by a set of trainable parameters θ and aims to solve the following optimization problem:
a r g m a x θ L Y t , Y i X T , X C , X I , X L ; θ
where L represents the loss function to be minimized in Equation (1).

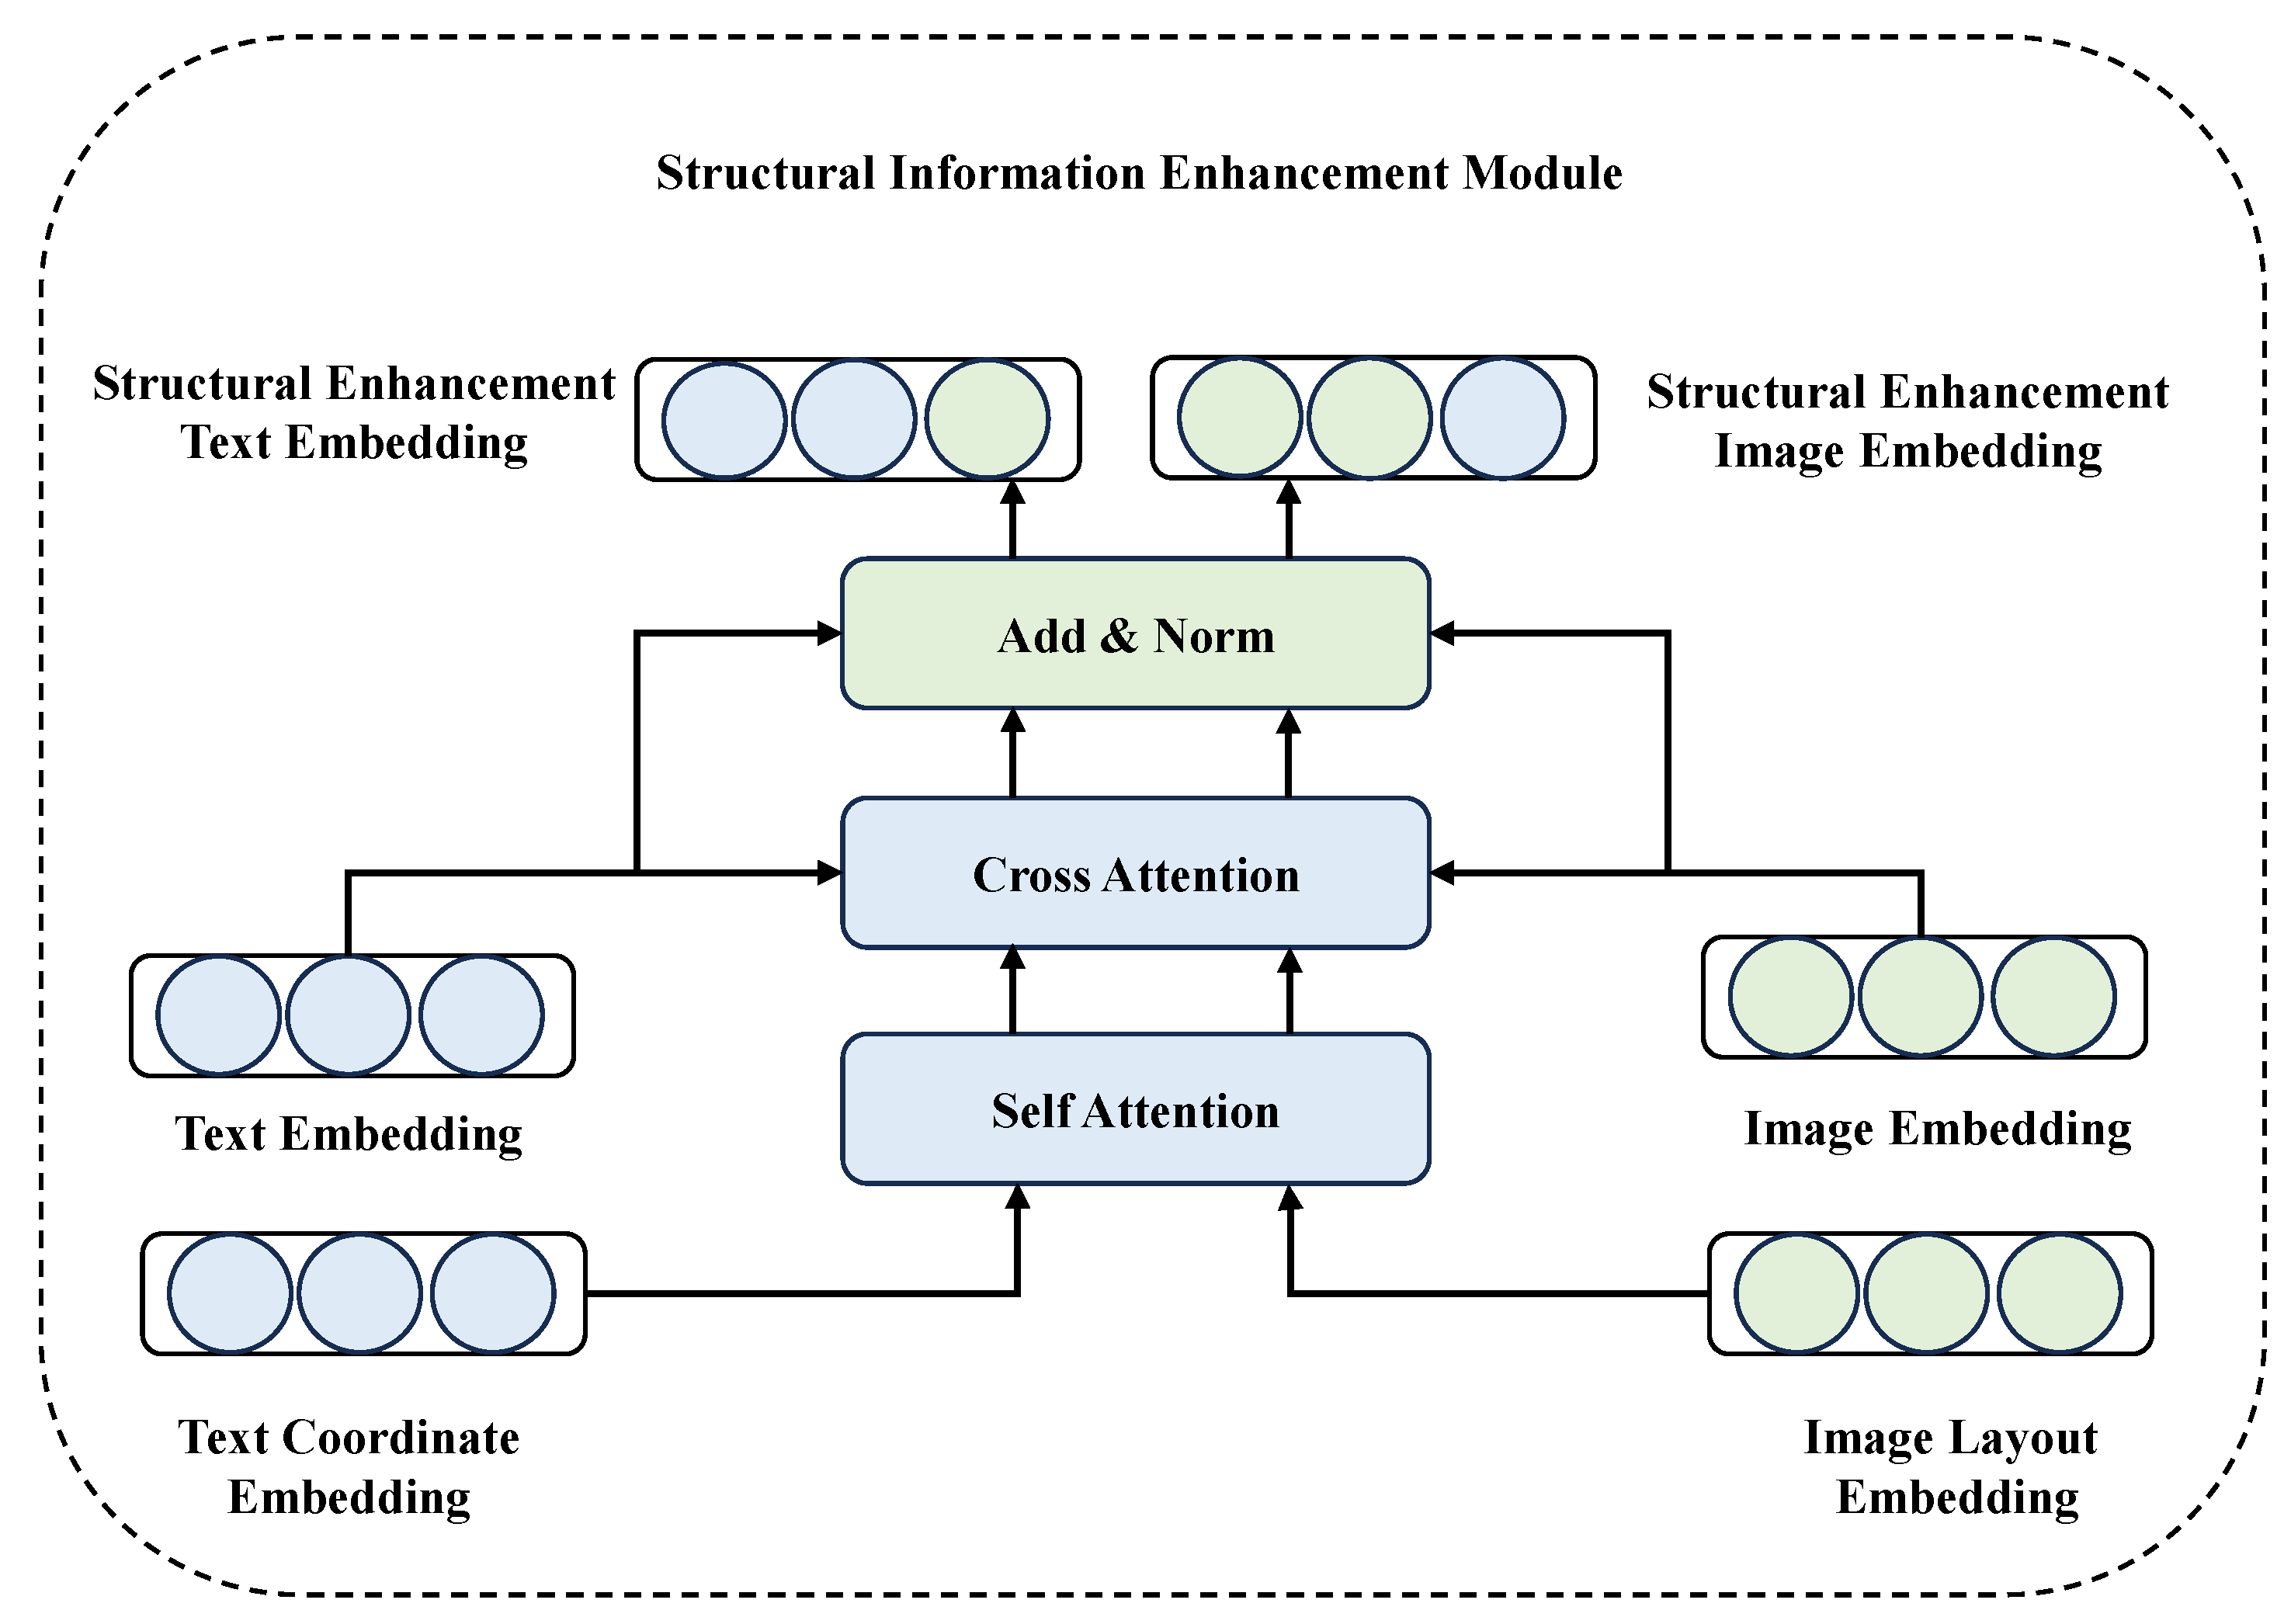
3.2. Structural Information Enhancement Module

To effectively incorporate the structural information of images and text into the feature representation, a structural information enhancement module is proposed. This component processes the image and text components separately, as illustrated in Figure 3.

3.2.1. Structural Embedding Layer

Given a collection of image layouts X L = { L 1 , L 2 , , L M } and text coordinates X C = { C 1 , C 2 , , C N } , the proposed method employs them to enhance the image and text embeddings by incorporating structural information. Specifically, the structural embedding layer is trained to generate layout embeddings and coordinate embeddings, which are subsequently integrated into the respective image and text embeddings. For image embedding enhancement, distinct embedding functions are defined for each layout dimension ( X 1 , Y 1 , X 2 , Y 2 , W , H ) and these embeddings are aggregated to compute the overall position embedding as follows (Equations (2) and (3)), where E ( X 1 ) , E ( Y 1 ) , E ( X 2 ) , E ( Y 2 ) , E ( W ) , and E ( H ) are trainable embedding functions for each layout dimension. The resulting embedding, denoted as X L a , is the summation of these individual embeddings.
L a y o u t E m b e d d i n g ( X L ) = E ( X 1 ) + E ( Y 1 ) + E ( X 2 ) + E ( Y 2 ) + E ( W ) + E ( H )
X L a = L a y o u t E m b e d d i n g ( X L )
Similarly, for text embedding enhancement, we define separate position embeddings for each coordinate dimension ( X 1 , Y 1 , X 2 , Y 2 , W , H ) and combine them to form the overall position embedding (Equations (4) and (5)), where X C a represents the aggregated embedding derived from these coordinate-specific embeddings.
C o o r d E m b e d d i n g ( X C ) = E ( X 1 ) + E ( Y 1 ) + E ( X 2 ) + E ( Y 2 ) + E ( W ) + E ( H )
X C a = C o o r d E m b e d d i n g ( X C )

3.2.2. Image Enhancement

Given a set of paper images X I = { I 1 , I 2 , , I M } , we utilize ResNet-152 [18,69,70] to extract visual features, thereby obtaining the image embedding X I a . The feature extraction process can be expressed as Equation (6):
X I a = R e s N e t 152 ( X I )
In addition, a layout embedding has been derived X L a from the image layout, as described earlier, and a standard attention mechanism is used, with Equation (7). When the query, key, and value all come from the same sequence, it is referred to as self-attention. When the query comes from one sequence and the key and value come from another sequence, it is referred to as cross-attention. To enhance the image embedding, a self-attention mechanism (Equation (8)) is first applied to strengthen the layout information, followed by a cross-attention mechanism (Equation (9)) to fuse the image and layout features. The operations are defined as follows:
A t t e n t i o n ( Q , K , V ) = S o f t m a x Q K T d V
X L b = S e l f A t t e n t i o n ( X L a , X L a , X L a )
X L c = C r o s s A t t e n t i o n ( X I a , X L b , X L b )
Here, X L b represents the output of the self-attention layer, while X L c denotes the output of the cross-attention layer. The final enhanced image embedding is obtained by integrating the layout-enhanced features into the original image embedding in Equation (10), where W 1 is a trainable weight, and X I d (Equation (11)) is the result of applying a feed-forward network with residual connections and normalization. Notably, all layers except the feature extraction component are retrained to adapt to the specific task.
X I c = X I a + W 1 X L c
X I d = A d d N o r m ( F F N ( A d d N o r m ( X I c ) ) )

3.2.3. Text Enhancement

Given a set of paper text X T = { T 1 , T 2 , , T N } , we leverage the BART model [71] to extract text embeddings X T a through its embedding layer. The process can be expressed as Equation (12):
X T a = B A R T e m b e d d i n g l a y e r ( X T )
A coordinate embedding X C a is also derived from the text coordinates, as described earlier. To enhance the text embedding, a self-attention mechanism (Equation (13)) is first applied to emphasize the coordinate information and then employ a cross-attention mechanism (Equation (14)) to combine the text and coordinate features. The operations are defined as follows:
X C b = S e l f A t t e n t i o n ( X C a , X C a , X C a )
X C c = C r o s s A t t e n t i o n ( X T a , X C b , X C b )
Here, X C b represents the output of the self-attention layer, while X C c denotes the output of the cross-attention layer. The final enhanced text embedding is obtained by integrating the coordinate-enhanced features into the original text embedding in Equation (15), where W 2 is a trainable weight, and X T d (Equation (16)) is the result of applying a feed-forward network with residual connections and normalization. Unlike the image enhancement process, pre-trained weights are utilized for layers overlapping with the original BART model to improve performance.
X T c = X T a + W 2 X C c
X T d = A d d N o r m ( F F N ( A d d N o r m ( X T c ) ) )

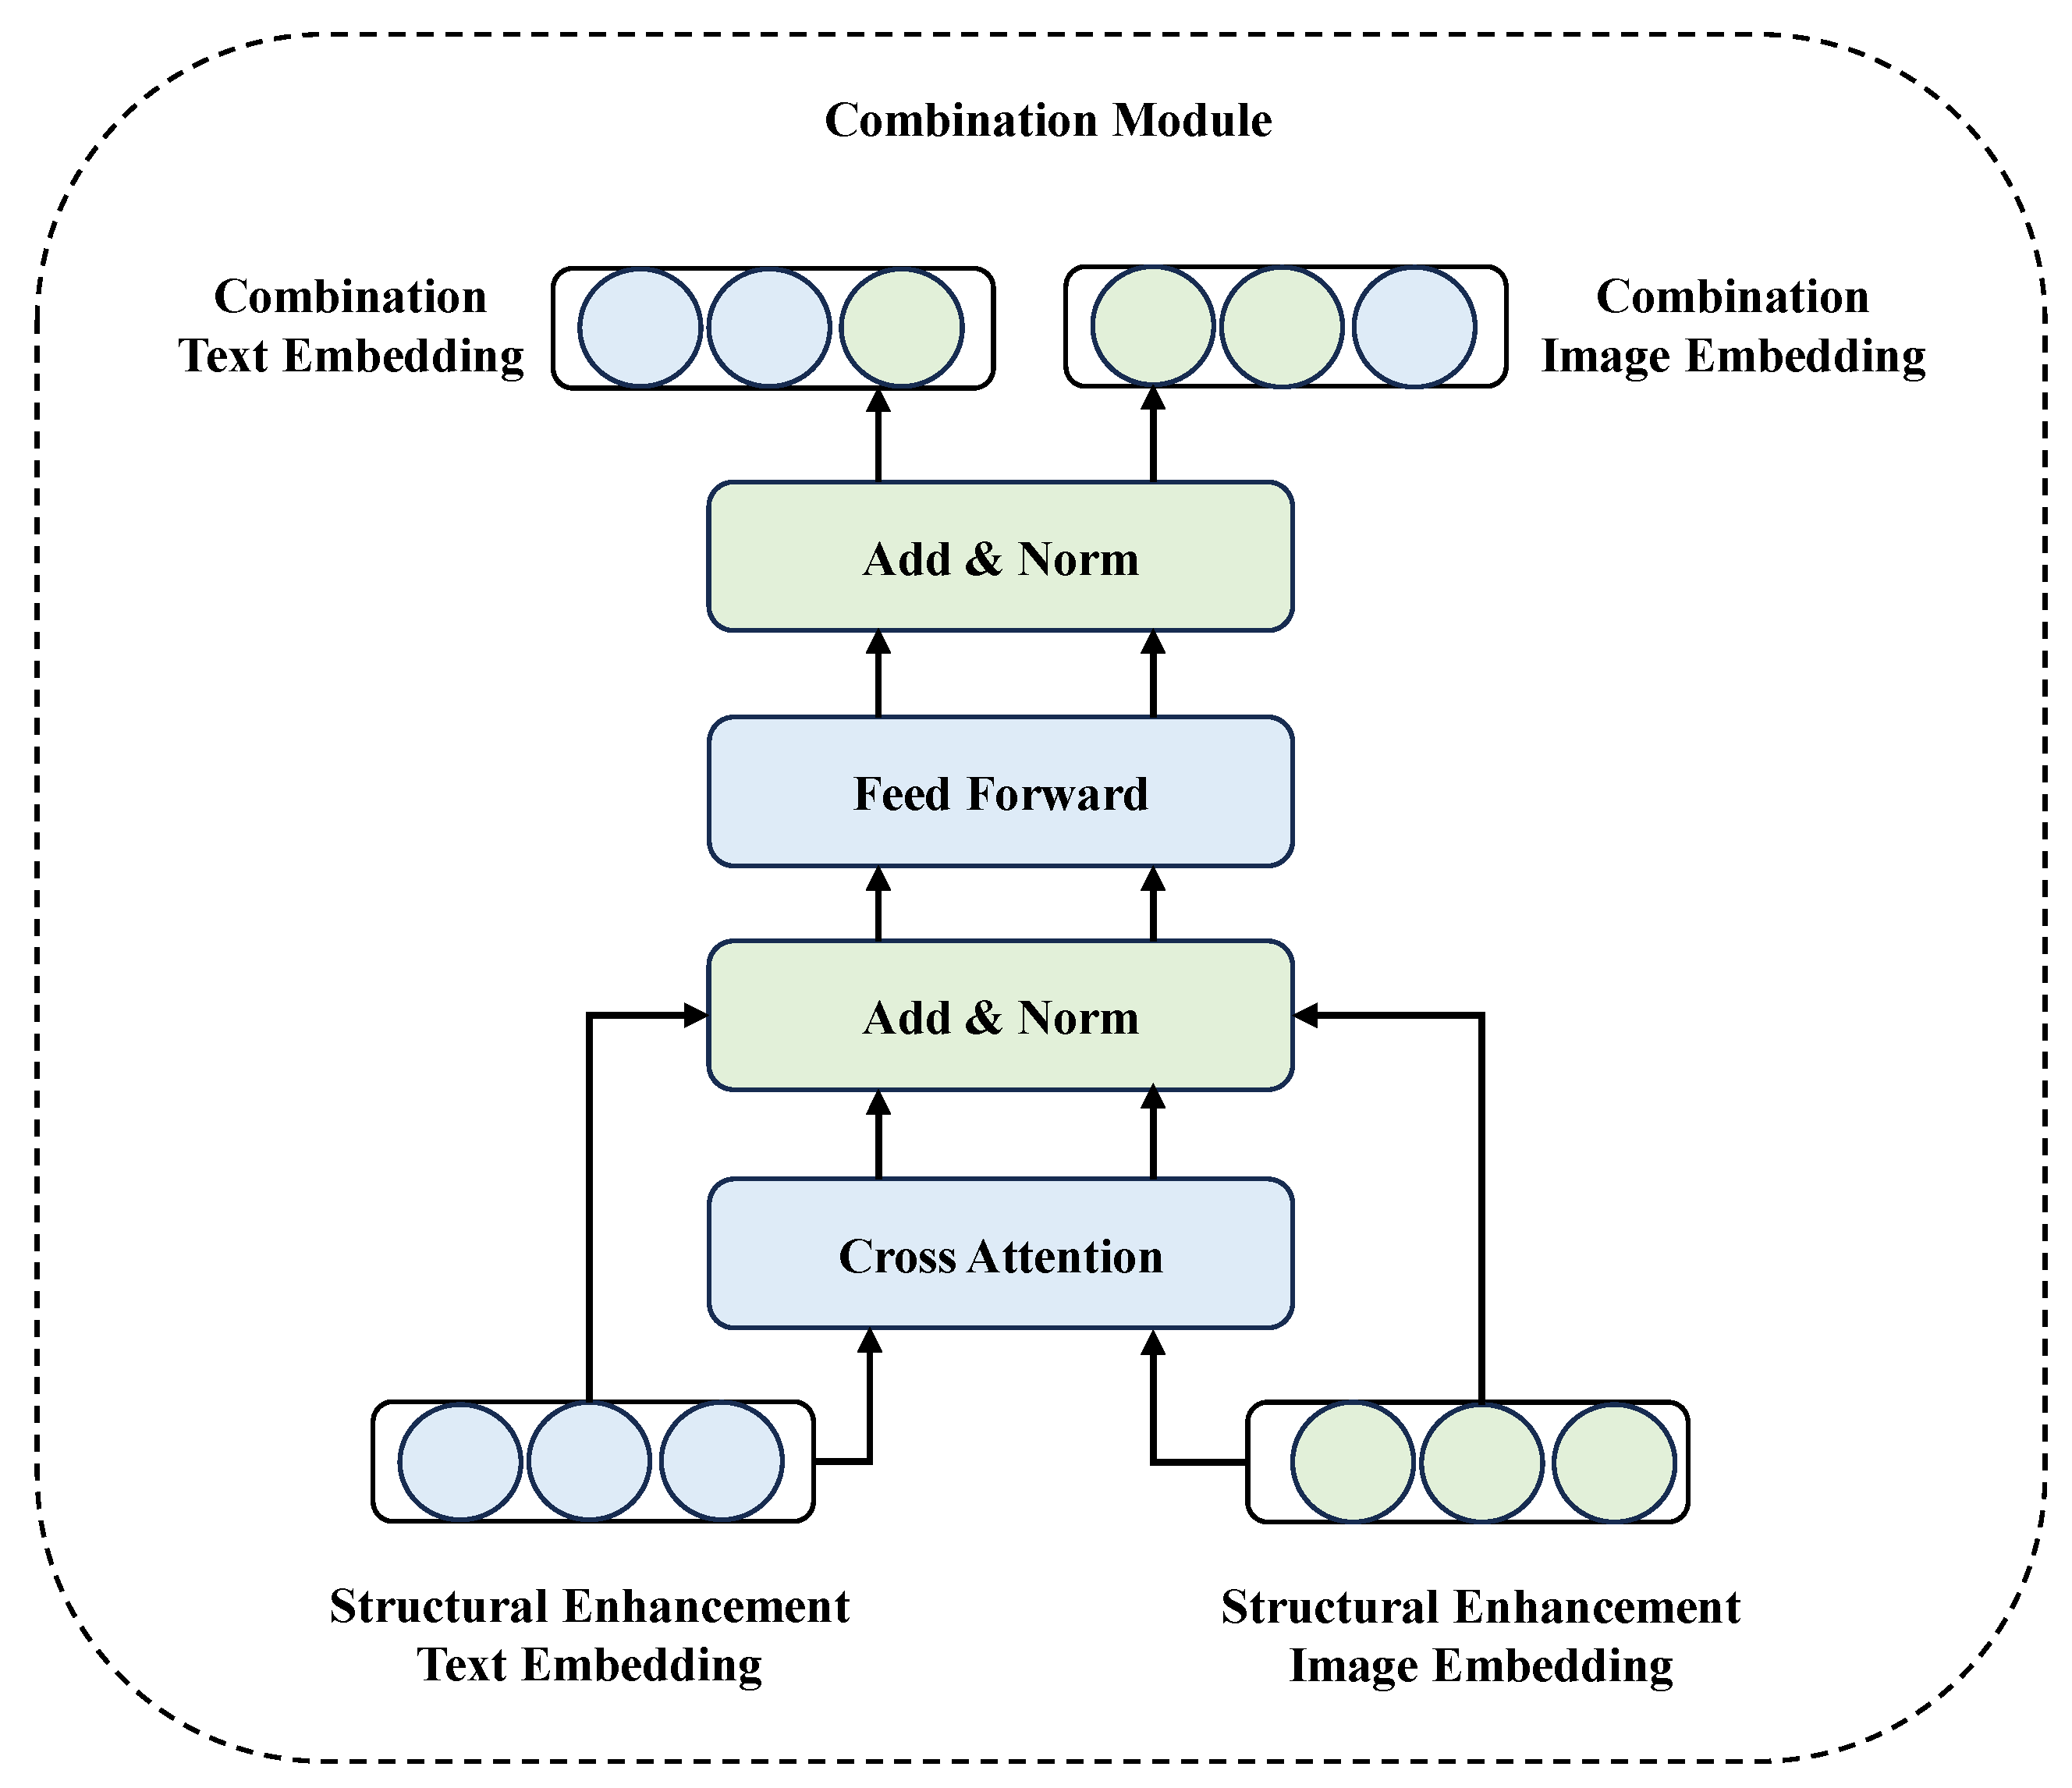
3.3. Combination Module

The integration of visual and textual information is crucial for capturing comprehensive and diverse representations of scientific papers. Specifically, the most important image should encapsulate the primary topic of the paper, while the abstract contains key information. Therefore, text and image modalities can complement each other, providing a more holistic understanding. This module is designed to fuse the information between images and text, as illustrated in Figure 4.

3.3.1. Image-to-Text Combination

To integrate image and text features, a two-stage process begins with compressing and transforming the text features before combining them with the image features. Specifically, the text embedding X T d is compressed into a vector using an averaging operation and then expanded back into a matrix (Equation (17)). This matrix is transformed using a trainable weight matrix W 3 (Equation (18)) and passed through a linear layer to generate a new feature representation (Equation (19)). Subsequently, a cross-attention mechanism is applied to combine these transformed text features with the image features X I d (Equation (20)), which already contain structural information. The final output is obtained by weighting and summing the enhanced features (Equation (21)). The image–text combination process is implemented as follows:
M T a = R e p e a t ( M e a n ( X T d ) )
M T b = M T a W 3
M T c = L i n e a r ( M T b )
M T d = C r o s s A t t e n t i o n ( X I d , M T c , M T c )
M I T a = X I d + W 4 M T d
M I T b = A d d N o r m ( F F N ( A d d N o r m ( M I T a ) ) )
Here, M T a (Equation (22)) represents the compressed and expanded text embedding, M T b is the transformed text feature, and M T c is the output of the linear transformation. The cross-attention mechanism produces M T d , which is then combined with the image features X I d to form M I T a . Finally, M I T b is obtained through a feed-forward network with residual connections and normalization.

3.3.2. Text-to-Image Combination
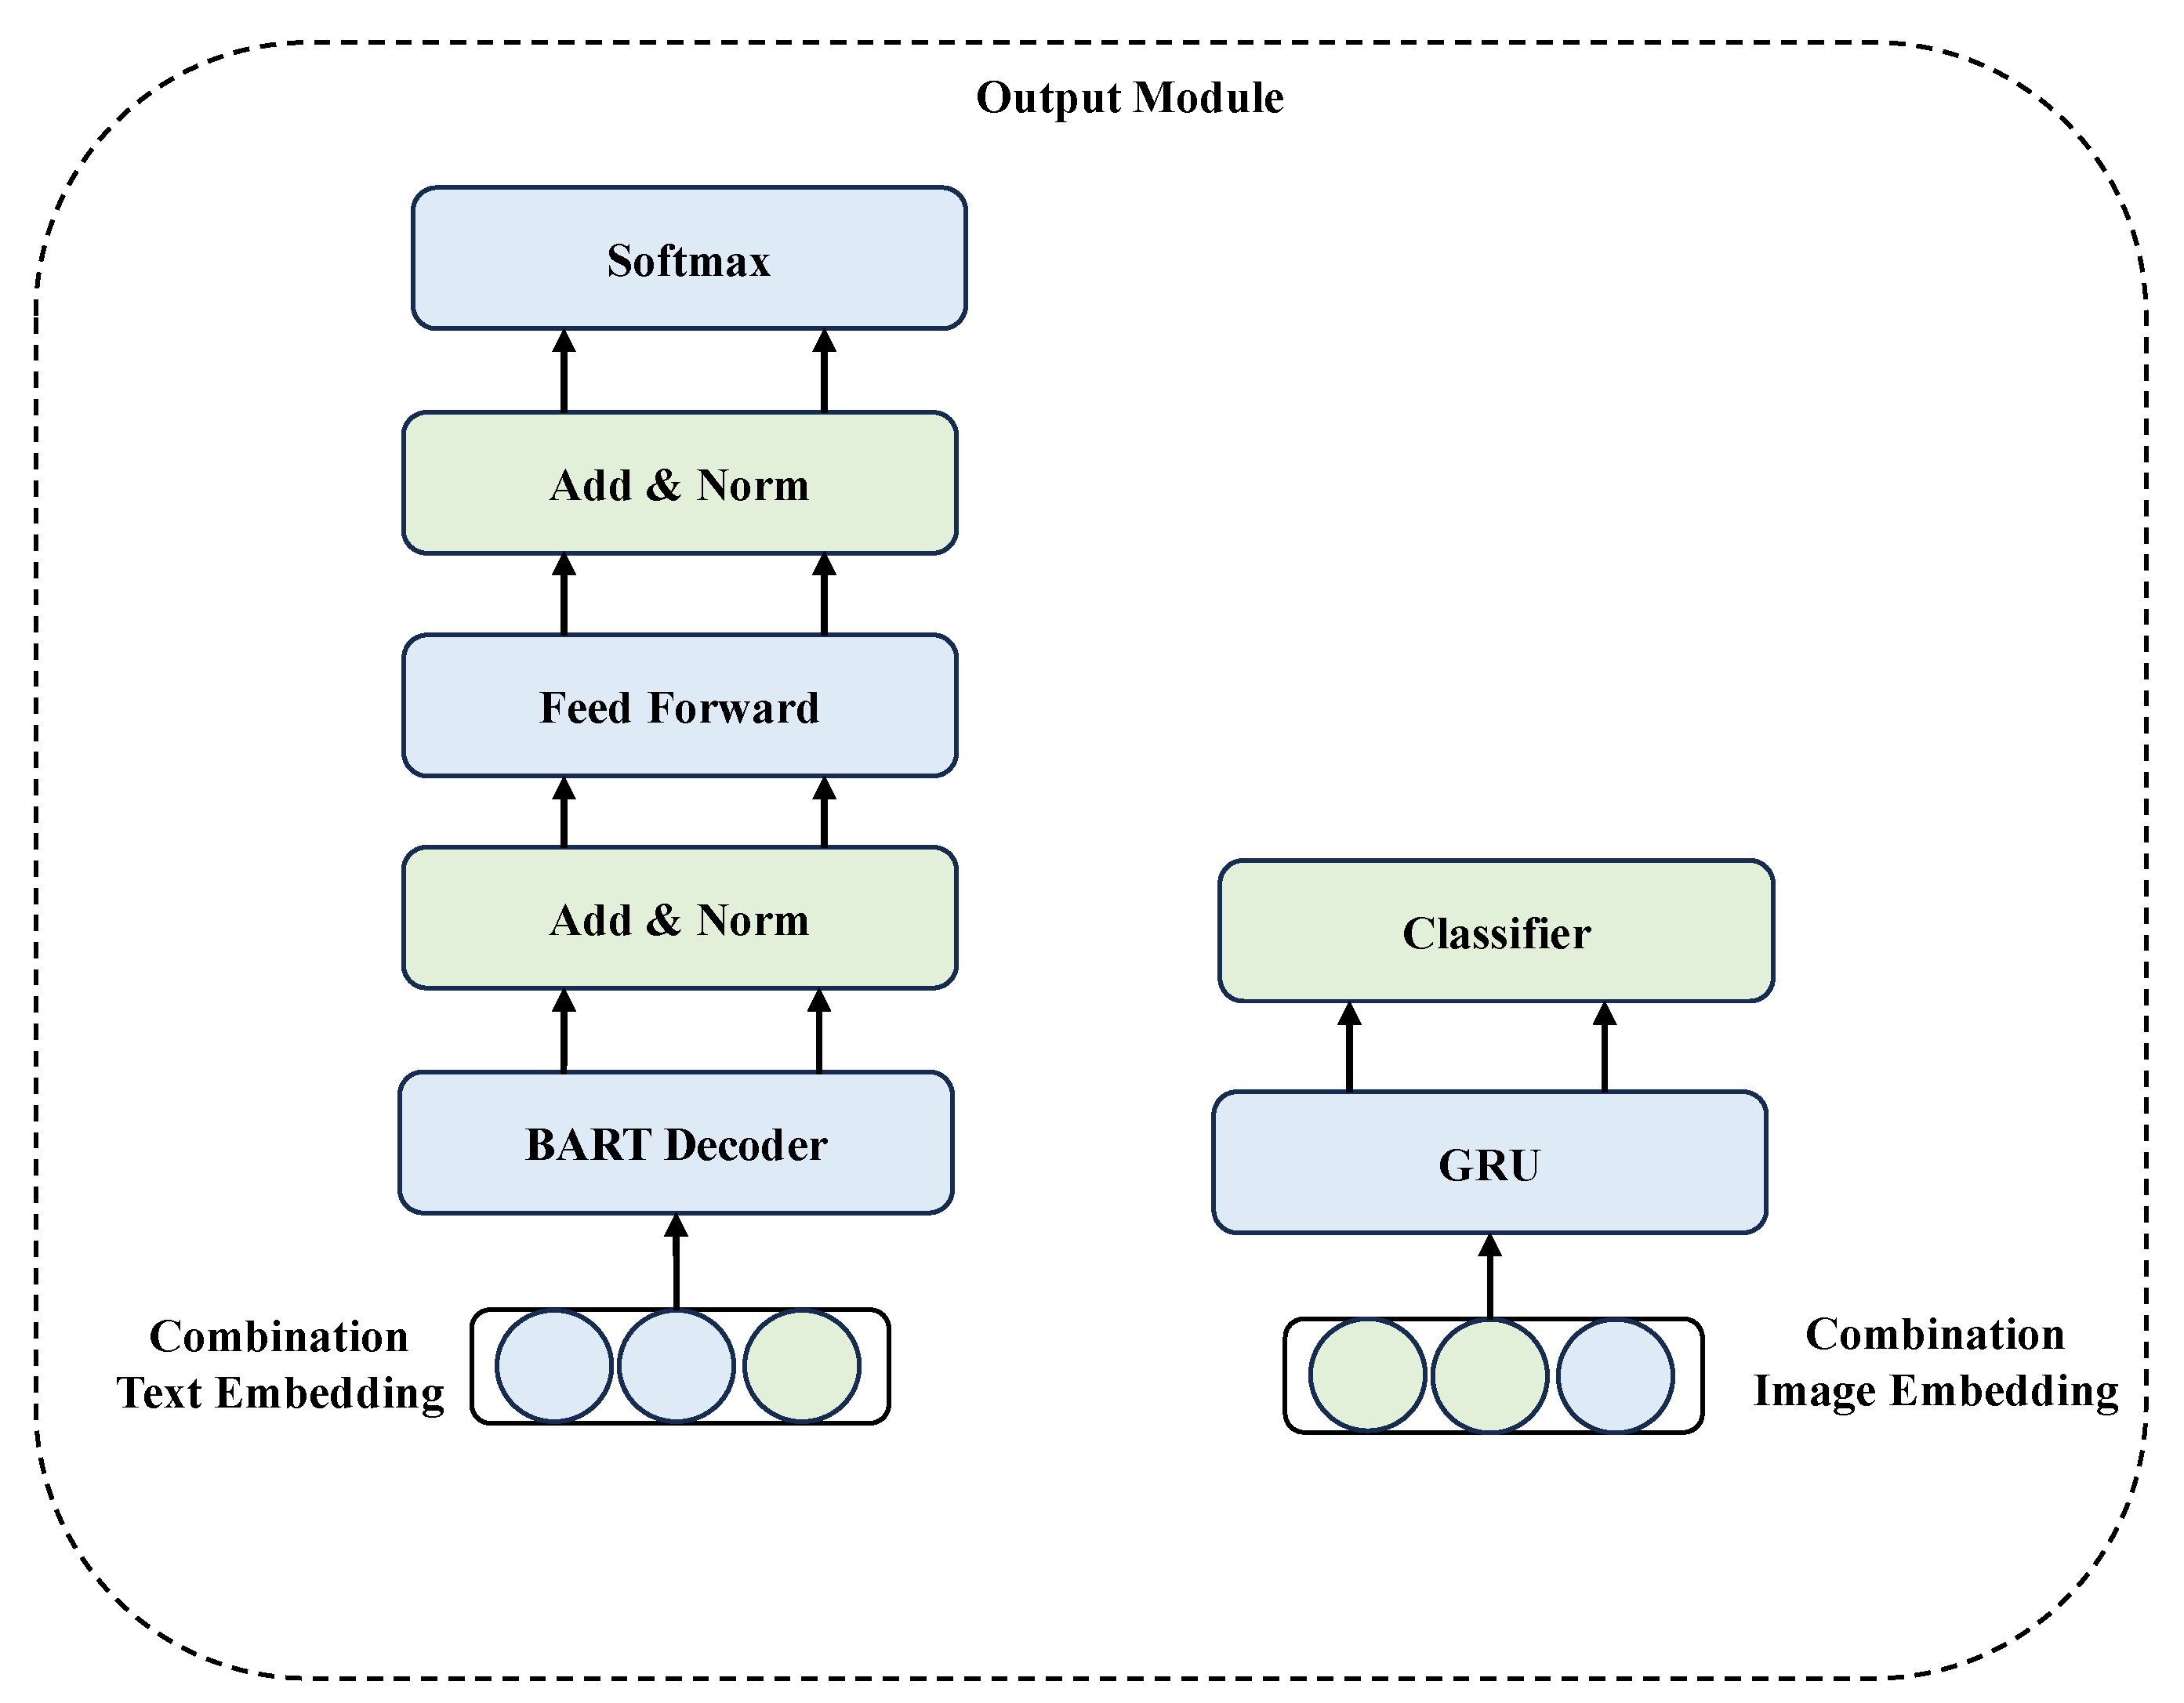
In parallel, a complementary strategy is developed to integrate image and text features in the reverse direction, ensuring a bidirectional flow of information. The image embedding X I d is first compressed into a vector using an averaging operation and then expanded back into a matrix (Equation (23)). This matrix is transformed using a trainable weight matrix W 5 (Equation (24)) and passed through a linear layer to generate a new feature representation (Equation (25)). Subsequently, a cross-attention mechanism (Equation (26)) is applied to combine these transformed image features with the text features X T d , which already contain structural information. The final output is obtained by weighting and summing the enhanced features (Equation (27)). The text–image combination process is implemented as follows:
M I a = R e p e a t ( M e a n ( X I d ) )
M I b = M I a W 5
M I c = L i n e a r ( M I b )
M I d = C r o s s A t t e n t i o n ( X T d , M I c , M I c )
M T I a = X T d + W 4 M I d
M T I b = A d d N o r m ( F F N ( A d d N o r m ( M T I a ) ) )
Here, M I a (Equation (28)) represents the compressed and expanded image embedding, M I b is the transformed image feature, and M I c is the output of the linear transformation. The cross-attention mechanism produces M I d , which is then combined with the text features X T d to form M T I a . Finally, M T I b is obtained through a feed-forward network with residual connections and normalization.

3.4. Output Module

To maximize the utilization of multimodal information, an output module capable of concurrently generating the paper abstract and selecting the most representative image was developed. This module leverages a pre-trained BART decoder to derive decoded text features, which are subsequently employed for abstract generation. Simultaneously, the most significant image is identified using the encoded visual information, enabling the two modalities to complement each other and enhance task performance. For training, the negative log-likelihood loss is employed for abstract generation and cross-entropy loss for image selection. A multi-task learning framework [72] is implemented to train both tasks in parallel, as illustrated in Figure 5.

3.4.1. Paper Abstract Generation

The abstract generation task aims to utilize the integrated text–image feature M T I b to produce the paper’s abstract. This is achieved by feeding the fused text–image embedding into a pre-trained BART decoder [71] to extract decoded embeddings, which are then used for abstract generation. The decoding process can be mathematically represented as Equation (29):
M T I c = B A R T d e c o d e r ( M T I b )
Here, M T I c denotes the decoded embeddings. Subsequently, these embeddings undergo a series of transformations to generate token probabilities (Equations (30) and (31)):
M T I d = A d d N o r m ( F F N ( A d d N o r m ( M T I c ) ) )
P t = S o f t m a x ( M T I d )
In these equations, M T I d represents the output after applying a feed-forward network, residual connections, and normalization. P t signifies the probability distribution over tokens. The loss function is defined as Equation (32):
L θ T e x t = t log P t ( y t )
This negative log-likelihood loss is minimized during training to refine the model’s ability to generate tokens closely resembling the target sequence y t .

3.4.2. Most Important Image Selection

For the image selection task, the importance of both visual and textual information is recognized in identifying the most representative image. This task is performed using the previously derived image–text embedding M I T b . The process involves transforming the embedding through a linear layer (Equation (33)) to match the dimensionality required by a GRU [73] model (Equation (34)), which captures the temporal relationships among images. The resulting features are subsequently reduced to a 1D tensor (Equations (35) and (36)), enabling the selection of the most crucial image for each paper. The process can be formalized as follows:
M I T c = L i n e a r ( M I T b )
M I T d = G R U ( M I T c )
C l a s s i f i e r I m a g e ( M I T e ) = L i n e a r 1 D ( M I T e )
y I = C l a s s i f i e r I m a g e ( M I T e )
In this formulation, M I T c represents the output of the linear transformation layer, M I T d is the GRU output, and y I denotes the computed score for each image. The loss function is defined as Equation (37):
L θ I m a g e = 1 N i = 1 N y I ^ log ( y I ) + ( 1 y I ^ ) log ( 1 y I )
This cross-entropy loss measures the discrepancy between the predicted scores y I and the ground truth scores y I ^ . The selected image not only serves as the most representative visual summary but also aligns with the textual content.

3.5. Total Loss Function

The proposed model enables joint training of the abstract generation and image selection tasks. Both tasks are optimized simultaneously through the combined loss function in Equation (38):
L θ T o t a l = a L θ I m a g e + b L θ T e x t
Here, a and b are learnable parameters that balance the contributions of the two tasks during training.

4. Experiment and Result
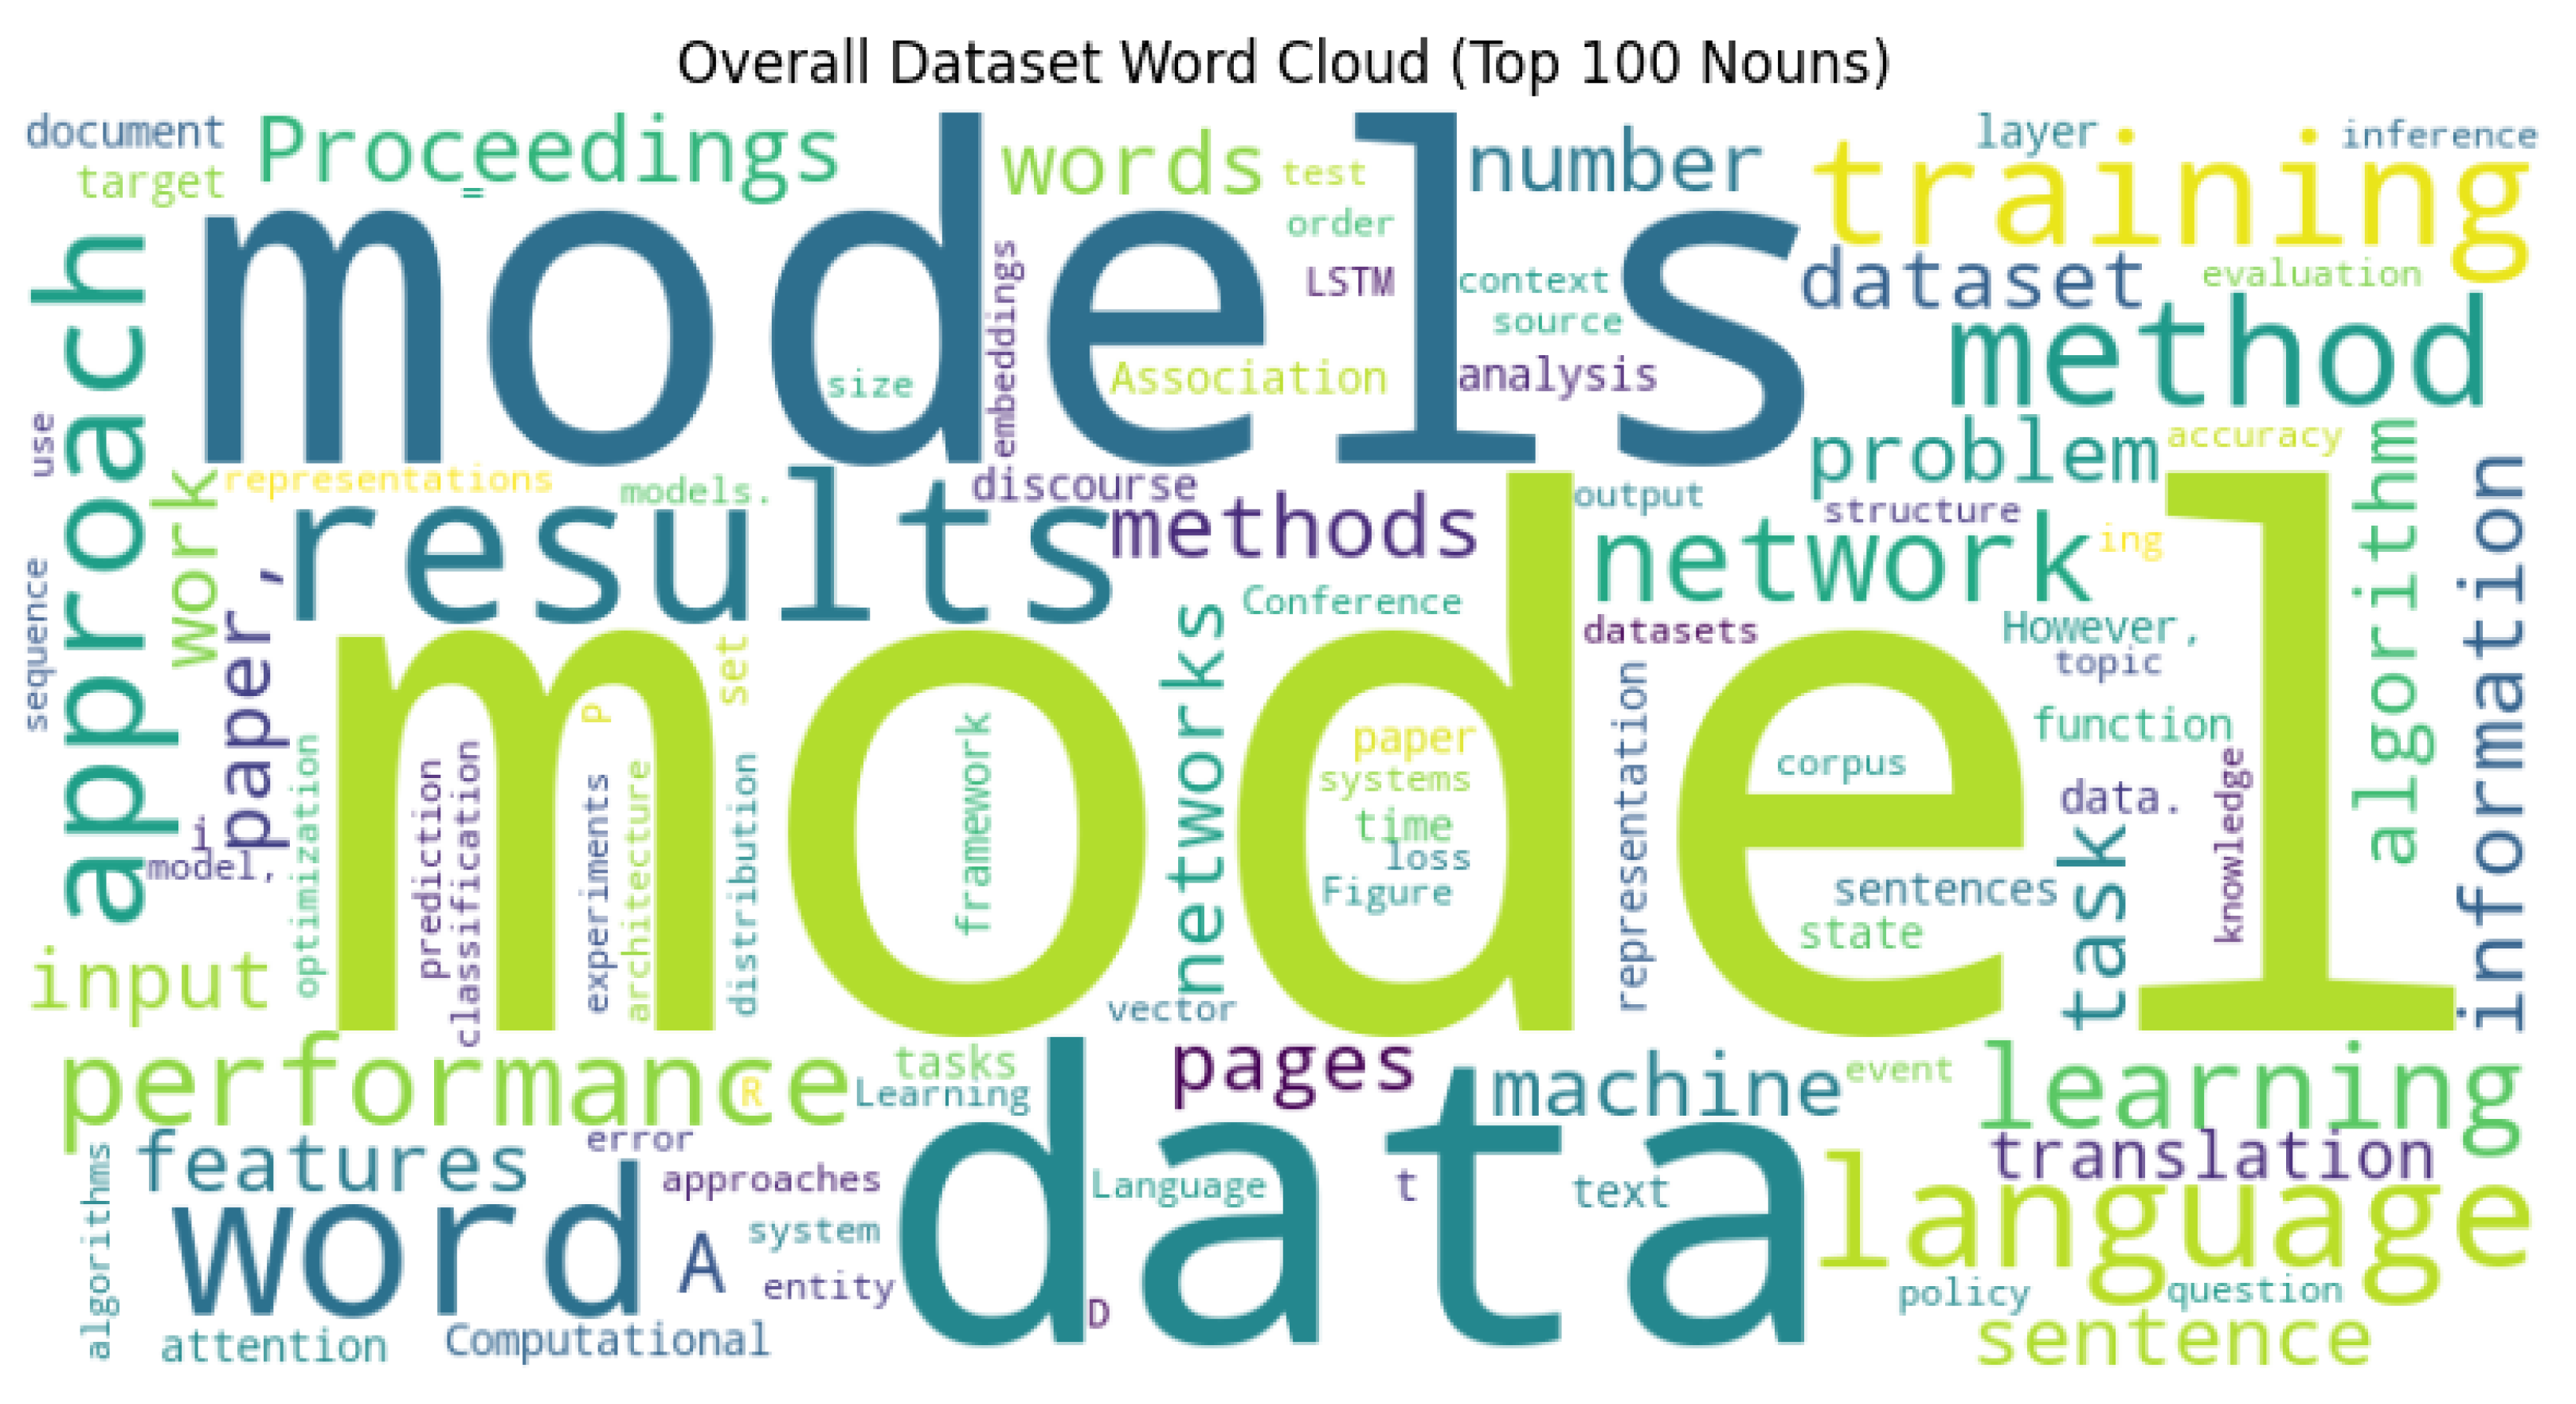
4.1. Dataset Detail

Existing summarization datasets typically contain either text or images for training and validation. To address this limitation, a novel dataset incorporates both text and images, along with structural information such as text coordinates and image layouts. The dataset creation methodology draws inspiration from recent advancements in the field. Below, the dataset construction process is outlined.
First, a diverse collection of scientific publications was first sourced from reputable open-access repositories, including proceedings of top-tier conferences such as NIPS, ACL, and ICML. Images and their associated structural information were extracted using PDFigCapX [74], a robust tool for parsing the content of academic papers. After collecting the original image data, a labeling process was implemented. Following the methodology proposed by Tan et al. [63], the most significant image was identified in each paper based on specific keywords in the captions, such as “overview”, “overall”, and “model architecture”. This step ensured that the selected images were representative of the paper’s core content. The output included figures, their captions, and layout, as illustrated in Figure 6.
Additionally, the dataset creation method outlined by [36] to extract token-level information, including token coordinates (x1, y1, x2, y2, w, h), is demonstrated in Figure 7.
Table 1 provides a detailed overview of our dataset, including the number of papers, images, and associated metadata. Figure 8 shows the word cloud of the top 100 most frequent words in the dataset. Figure 9 shows the bar chart of the top 30 most frequent words in the dataset.

4.2. Implementation Detail

Data Preprocessing: the BART tokenizer [75] was utilized to tokenize all text content from our scientific papers.
Model Architecture: A text embedding matrix was initialized using the pre-trained BART model, which features a vocabulary size of 50,264 and an embedding dimension of 1024. Both the source text (including paper content and summaries) and the target text shared the same vocabulary. For image processing, the ResNet-152 encoder was employed to extract visual features, resulting in a 2048-dimensional representation for each image.
Training: The model was trained with the following hyperparameters: batch size of 2, learning rate of 0.00001, and the Adam optimizer [76]. All experiments were conducted on an NVIDIA RTX 4090 GPU.
Testing: During evaluation, the maximum decoding length was set to 256 tokens. Other parameters, such as beam size and length penalty, were kept at their default values.
Evaluation Metrics: the ROUGE [77] metric was employed to assess summary quality, considering dimensions such as Rouge-1, Rouge-2, Rouge-L, and RougeLSum. Additionally, the quality of image selection was measured using Top-K Accuracy [78,79].

4.3. Baseline Model

To assess the performance of our proposed model, a comprehensive comparison against various baseline approaches was conducted, encompassing both extractive and abstractive summarization methods.
Extractive Models: Extractive summarization techniques [80] identify and aggregate the most salient sentences or phrases from the source document to compose concise summaries. Celebrated for their operational efficiency and fidelity to original content, these approaches ensure semantic integrity. In our investigation, we evaluate the following leading extractive architectures:
  • Lead-3: Lead-3 is a simple yet widely used baseline model that selects the first three sentences of a document as the summary. It is based on the assumption that the most important information is often located at the beginning of a text.
  • SumBasic: SumBasic is a sentence extraction algorithm that relies on basic features such as sentence length, position, and the presence of capital words. It assigns scores to sentences based on these features and selects the top-ranked sentences to form the summary.
  • TF-IDF: TF-IDF (Term Frequency-Inverse Document Frequency) identifies important words in a document by calculating their frequency and their rarity across a corpus. The model then extracts sentences containing these high-weight words to form the summary.
  • TextRank: TextRank treats sentences as nodes in a graph and computes their importance based on their similarity to other sentences. It iteratively ranks sentences and selects the top-ranked ones to generate the summary.
  • LexRank: LexRank is an improved version of TextRank that uses a more efficient algorithm to compute sentence importance. It also focuses on maintaining semantic similarity between sentences to produce coherent summaries.
  • Luhn: Luhn is one of the earliest extractive summarization algorithms, proposed by Hans Peter Luhn in 1958. It selects sentences based on word frequency and significance, assuming that frequently occurring content words carry the core meaning of a document.
  • KL-Sum: KL-Sum is an unsupervised extractive summarization method that formulates summary generation as an optimization problem, minimizing the Kullback–Leibler divergence between the word distribution of the summary and that of the original document. It balances informativeness and brevity.
Abstractive methods [81] employ deep semantic comprehension to craft summaries through fluent paraphrasing of the original text. Such models yield outputs that are markedly more coherent and human-like than those derived via extractive techniques. In this study, we benchmark the following representative abstractive architectures:
  • T5: T5 is a versatile and powerful model designed for various text-based tasks, including text summarization. It leverages a pre-training approach on a wide range of text-to-text tasks and has shown remarkable performance in generating concise and coherent summaries.
  • MBart: MBart is a multilingual pre-trained model optimized for text summarization and machine translation. Its ability to handle multiple languages makes it particularly suitable for cross-lingual summarization tasks, providing robust performance across diverse datasets.
  • LED: LED is a model specifically designed for document summarization, focusing on generating informative and concise summaries. It employs a lightweight approach to editing and compression, making it efficient for handling long texts.
  • Pegasus: Pegasus is a model developed for abstractive summarization tasks. It utilizes a novel pre-training strategy that incorporates extracted summarization guidance, enabling it to generate high-quality, human-like summaries.
  • DistilBART: DistilBART is a lightweight and efficient variant of the BART model, designed to reduce computational resources while maintaining high performance. It is particularly useful for scenarios where resource constraints are a concern.
  • GPT2: GPT-2 is a large-scale generative pre-trained transformer model developed by OpenAI. It is capable of performing abstractive summarization by fine-tuning on summarization datasets, generating fluent and coherent summaries in a left-to-right decoding manner.
  • RoBERTa: RoBERTa (Robustly optimized BERT approach) is an improved variant of BERT, pre-trained with more data and longer training schedules. For summarization, it is commonly used as an encoder backbone in sequence-to-sequence frameworks, providing strong contextual representations for both extractive and abstractive methods.

4.4. Comparison Result

To evaluate the effectiveness of our proposed model, a comprehensive comparison with baseline models was conducted, which can be categorized into extractive and abstractive models. Notably, the abstractive models were pre-trained on the widely used CNN Daily Mail dataset prior to being fine-tuned on the target dataset. As demonstrated in Table 2, the proposed model achieves superior performance across all metrics. The findings reveal three key insights. First, abstractive models consistently outperform extractive models, underscoring the importance of content generation over mere information extraction for effective summarization. Second, the model demonstrates the best performance among all abstractive approaches, likely due to its unique architecture that integrates both multimodal data and multi-task learning. The incorporation of multiple modalities, combined with structural information, enables the model to effectively capture the interdependencies between images and text. Third, experiments indicate that the image selection task, when conducted in tandem with the primary abstract generation task, enhances the model’s ability to identify salient images while producing high-quality summaries. This dual capability contributes significantly to the model’s overall performance.

4.5. Visualization Results

Table 3 presents the output summaries generated by different models. For reference, the original abstract is included in the top line of Table 3. To assess the quality of the generated summaries, human evaluation is employed. In Table 3, blue labels are used to mark segments whose meaning matches that of the original summary, red labels to denote segments that are semantically irrelevant to the original summary, and orange labels to identify redundant parts that have been generated multiple times. Findings indicate that the results of the human evaluation align closely with the trends observed in the ROUGE scores. Summaries that achieve higher ROUGE scores tend to be more precise and semantically accurate. As shown in Table 3, the integration of image features in this model enables the generation of summaries that are not only more accurate but also more meaningful, selecting the most relevant image to represent the content.
We selected one of the articles to output Figure 10. There is an attention map of generated text. The principle is to randomly select 30 generated summary tokens, calculate the weight between them and the source token, and finally select the 100 pairs with the highest weight.

4.6. Ablation Study

To investigate the impact of different components on model performance, ablation studies were conducted on two modules by modifying the full model architecture. In the first study, two configurations of the designed module were compared: one that included the CM and one that did not (W/o CM). In the second study focusing on the structural information enhancement module (SEM), configurations with and without the SEM (W/o SEM) were similarly compared. The experiments focused on three tasks: the most important image selection task (I), the scientific paper abstract generation task (T), and a joint task that combined both (I+T). The results, shown in Table 4 and Table 5, indicate that incorporating both the CM and SEM significantly improves performance across all tasks. With the integration of these modules, the model demonstrates enhanced capabilities in both image selection and abstract generation, highlighting the effective fusion of visual and textual information. Conversely, when only a single module is utilized (W/o CM or SEM), the performance declines, emphasizing the importance of multimodal data fusion. Notably, in the joint task (I+T), our model achieves slightly higher ROUGE scores compared to the single-modality tasks, reinforcing the significance of the image selection task in enhancing overall model performance.

4.7. Cross-Modal Retrieval Application

The model was further applied to cross-modal retrieval tasks in the forms of image-to-text and text-to-image. This application holds significant value in the realm of information retrieval, as it can greatly enhance the efficiency with which researchers retrieve relevant scientific literature. In the context of text-to-image retrieval, the abstract of a paper is utilized to compute its similarity with images associated with the paper, identifying the most relevant image and verifying whether it corresponds to the same article. Conversely, in image-to-text retrieval, the similarity between the paper’s image and its abstract was assessed, aiming to retrieve the most pertinent abstract and determine if it pertains to the same paper. To evaluate the effectiveness of the retrieval process, the Mean Average Precision at Top-K (MAP@K) metric [20,22] is employed, which is commonly used for evaluating performance in both text-to-image and image-to-text retrieval tasks. MAP offers a holistic evaluation of a retrieval system’s performance by considering its ability to rank relevant results highly, taking into account precision at various recall levels. The MAP score is derived by averaging the Average Precision (AP) scores for all queries in the dataset. In these experiments, the value of K was adjusted such as 10, 30, 50, 80, and 100, and comparative tests were conducted by substituting the GRU in the image selection model with other architectures like CNN, MLP, LSTM, RNN, and Transformer. The results of these information retrieval experiments are summarized in Table 6. Overall, this model demonstrates superior retrieval performance compared to other benchmark models in both text-to-image and image-to-text retrieval tasks.

4.8. Discussion

The findings presented in this study demonstrate the critical role of multimodal integration in scientific paper abstract generation. The structural information enhancement module and combination module successfully bridge the modality gap between textual and visual representations and simultaneously incorporate structural information, addressing a persistent challenge in cross-modal understanding. Compared to conventional text-centric approaches [101], the multimodal framework achieves higher performance. This performance gain validates a hypothesis that complementary information from figures and diagrams can effectively compensate for textual information loss during summarization. Notably, the proposed multi-task learning paradigm introduces an important innovation by simultaneously optimizing for summary quality and image selection. This dual-objective strategy [102] creates a self-reinforcing mechanism where improved image–text alignment facilitates better summary generation, enhancing image selection accuracy. The ablation studies confirm that removing either the structural information enhancement module or the combination module reduces ROUGE scores, emphasizing their synergistic importance.
The success of the proposed multimodal fusion framework in scientific paper abstract generation provides a methodological foundation for smart city multimodal data processing. The joint modeling of text coordinates and image layouts through the structural information enhancement module can be transferred to intelligent transportation report parsing scenarios, enabling precise alignment between road network diagrams and accident description texts [103]. Notably, the semantic alignment capability developed through the multi-task learning mechanism can be extended to environmental monitoring data visualization summarization tasks, such as generating joint summaries of air quality sensor data charts and monitoring reports to support rapid decision-making by urban administrators [104].
Nevertheless, two notable limitations merit further consideration. First, our model’s reliance on a bespoke figure-labeling procedure may impede its deployment across diverse contexts. Second, although the dataset spans key areas of computer science, adapting to documents from the humanities or smart-city domains—where visual conventions differ—could present significant challenges. Future research ought to pursue self-supervised pre-training techniques [105] to alleviate annotation requirements, as well as dynamic modality-weighting schemes [106] to better accommodate heterogeneous document formats.
Moreover, the approach demonstrates strong scalability and applicability to other multimodal tasks such as text classification and sentiment analysis. Specifically, the structural information enhancement module can accurately align key textual elements (e.g., keywords, topic segments) with corresponding visual features (e.g., data distributions in tables and charts), thus enhancing the discriminative power of multimodal representations. In text classification, category cues contained in images or diagrams (e.g., labeled experimental setups) serve as auxiliary features, which, when fed alongside textual inputs into a classifier, can yield higher classification accuracy. In sentiment analysis, emotion-related visual elements (e.g., emojis in screenshot comments or sentiment word clouds) can be optimized jointly with textual sentiment scores through our multi-task learning mechanism, further improving sentiment discrimination. Preliminary experiments on large-scale, cross-domain datasets indicate that as the data volume increases, multimodal fusion delivers sustained performance gains and remains robust across heterogeneous document types (e.g., news articles with embedded images, social media posts). Future work may explore dynamic modality weighting strategies to adapt to varying contributions of visual and textual information in different tasks.

5. Conclusions

In this paper, an innovative model is presented for generating abstracts of scientific papers using multimodal fusion and multi-task learning techniques. Additionally, this study explores new pathways for multimodal information fusion in smart cities. The proposed model effectively combines both text and image modalities to enhance the quality of the generated summaries. A significant contribution of this work is the integration of structural information from both text and image modalities through a structural information enhancement module. A combination module has been also developed that enables deep interaction and integration of the enhanced text and image features, capturing the correlation between the two modalities. The output module is responsible for generating a multimodal summary while simultaneously selecting the most relevant image to better align the semantics of the image with the text. Unlike previous studies that primarily focus on a single modality, especially textual data, this approach addresses the gap in multimodal content processing. Much of the existing research has centered on text-only materials; This work broadens the focus by incorporating image data, thus enriching the summary generation process. Experimental results demonstrate that this model produces more informative and accurate summaries, showcasing its effectiveness. While the current research is centered on academic literature, the underlying architectural design already incorporates characteristics of urban multimodal data, such as the fusion of traffic flow time-series data and spatial distribution maps. Future research will focus on integrating heterogeneous, city-specific datasets—including continuous IoT data streams and multimedia attachments within citizen emergency requests—to foster an intelligent, multimodal decision-making paradigm for more effective, collaborative urban governance.

Author Contributions

Conceptualization, W.Y., G.W. and J.H.; methodology, W.Y., G.W. and J.H.; software, W.Y.; validation, W.Y.; formal analysis, W.Y. and G.W.; investigation, W.Y., G.W. and J.H.; resources, G.W.; data curation, W.Y. and G.W.; writing—original draft preparation, W.Y.; writing—review and editing, W.Y., G.W. and J.H.; visualization, W.Y.; supervision, G.W.; project administration, W.Y., G.W. and J.H.; funding acquisition, G.W. All authors have read and agreed to the published version of the manuscript.

Funding

This research was funded by the Science and Technology Development Fund, Macao SAR. Grant number: 0004/2023/ITP1.

Data Availability Statement

The code and data can be accessible from the corresponding author upon a reasonable request.

Conflicts of Interest

The authors declare no conflicts of interest.

References

  1. Elassy, M.; Al-Hattab, M.; Takruri, M.; Badawi, S. Intelligent transportation systems for sustainable smart cities. Transp. Eng. 2024, 16, 100252. [Google Scholar] [CrossRef]
  2. Kumar, A.; Kim, H.; Hancke, G.P. Environmental monitoring systems: A review. IEEE Sens. J. 2012, 13, 1329–1339. [Google Scholar] [CrossRef]
  3. Yarashynskaya, A.; Prus, P. Smart Energy for a Smart City: A Review of Polish Urban Development Plans. Energies 2022, 15, 8676. [Google Scholar] [CrossRef]
  4. Chang, Y.; Wang, X.; Wang, J.; Wu, Y.; Yang, L.; Zhu, K.; Chen, H.; Yi, X.; Wang, C.; Wang, Y.; et al. A survey on evaluation of large language models. ACM Trans. Intell. Syst. Technol. 2024, 15, 1–45. [Google Scholar] [CrossRef]
  5. Maslej, N.; Fattorini, L.; Brynjolfsson, E.; Etchemendy, J.; Ligett, K.; Lyons, T.; Manyika, J.; Ngo, H.; Niebles, J.C.; Parli, V.; et al. Artificial intelligence index report 2023. arXiv 2023, arXiv:2310.03715. [Google Scholar]
  6. Utkirov, A. Artificial Intelligence Impact on Higher Education Quality and Efficiency. 2024. Available online: https://ssrn.com/abstract=4942428 (accessed on 3 October 2024).
  7. Zhang, Z.; Sun, Y.; Su, S. Multimodal Learning for Automatic Summarization: A Survey. In Proceedings of the International Conference on Advanced Data Mining and Applications, Shenyang, China, 21–23 August 2023; Springer: Berlin/Heidelberg, Germany, 2023; pp. 362–376. [Google Scholar]
  8. Altmami, N.I.; Menai, M.E.B. Automatic summarization of scientific articles: A survey. J. King Saud-Univ.-Comput. Inf. Sci. 2022, 34, 1011–1028. [Google Scholar] [CrossRef]
  9. Zhao, B.; Yin, W.; Meng, L.; Sigal, L. Layout2image: Image generation from layout. Int. J. Comput. Vis. 2020, 128, 2418–2435. [Google Scholar] [CrossRef]
  10. Ding, X.; Zhang, X.; Ma, N.; Han, J.; Ding, G.; Sun, J. Repvgg: Making vgg-style convnets great again. In Proceedings of the IEEE/CVF Conference on Computer Vision and Pattern Recognition, Nashville, TN, USA, 20–25 June 2021; pp. 13733–13742. [Google Scholar]
  11. Haralick. Document image understanding: Geometric and logical layout. In Proceedings of the 1994 Proceedings of IEEE Conference on Computer Vision and Pattern Recognition, Seattle, WA, USA, 21–23 June 1994; pp. 385–390. [Google Scholar]
  12. Hendges, G.R.; Florek, C.S. The graphical abstract as a new genre in the promotion of science. In Science Communication on the Internet; John Benjamins Publishing Company: Amsterdam, The Netherlands, 2019; pp. 59–80. [Google Scholar]
  13. Ye, X.; Chaomurilige; Liu, Z.; Luo, H.; Dong, J.; Luo, Y. Multimodal Summarization with Modality-Aware Fusion and Summarization Ranking. In Proceedings of the International Conference on Algorithms and Architectures for Parallel Processing, Macau, China, 29–31 October 2024; Springer: Berlin/Heidelberg, Germany, 2024; pp. 146–164. [Google Scholar]
  14. Ramathulasi, T.; Kumaran, U.; Lokesh, K. A survey on text-based topic summarization techniques. In Advanced Practical Approaches to Web Mining Techniques and Application; IGI Global Scientific Publishing: Hersey, PA, USA, 2022; pp. 1–13. [Google Scholar]
  15. Zhang, H.; Yu, P.S.; Zhang, J. A systematic survey of text summarization: From statistical methods to large language models. arXiv 2024, arXiv:2406.11289. [Google Scholar] [CrossRef]
  16. Zhou, X.; Wu, G.; Sun, X.; Hu, P.; Liu, Y. Attention-Based Multi-Kernelized and Boundary-Aware Network for image semantic segmentation. Neurocomputing 2024, 597, 127988. [Google Scholar] [CrossRef]
  17. Cui, C.; Liang, X.; Wu, S.; Li, Z. Align vision-language semantics by multi-task learning for multi-modal summarization. Neural Comput. Appl. 2024, 36, 15653–15666. [Google Scholar] [CrossRef]
  18. Liu, Y.; Zhang, D.; Zhang, Q.; Han, J. Part-object relational visual saliency. IEEE Trans. Pattern Anal. Mach. Intell. 2021, 44, 3688–3704. [Google Scholar] [CrossRef] [PubMed]
  19. Anwaar, M.U.; Labintcev, E.; Kleinsteuber, M. Compositional learning of image-text query for image retrieval. In Proceedings of the IEEE/CVF Winter Conference on Applications of Computer Vision, Virtual, 5–9 January 2021; pp. 1140–1149. [Google Scholar]
  20. Wu, G.; Lin, Z.; Han, J.; Liu, L.; Ding, G.; Zhang, B.; Shen, J. Unsupervised Deep Hashing via Binary Latent Factor Models for Large-scale Cross-modal Retrieval. In Proceedings of the International Joint Conference on Artificial Intelligence (IJCAI), Stockholm, Sweden; 2018; Volume 1, p. 5. [Google Scholar]
  21. Chen, C.; Debattista, K.; Han, J. Virtual Category Learning: A Semi-Supervised Learning Method for Dense Prediction with Extremely Limited Labels. In Proceedings of the IEEE Transactions on Pattern Analysis and Machine Intelligence, Online, 20 February 2024; pp. 5595–5611. [Google Scholar]
  22. Henderson, P.; Ferrari, V. End-to-end training of object class detectors for mean average precision. In Proceedings of the Computer Vision–ACCV 2016: 13th Asian Conference on Computer Vision, Taipei, Taiwan, 20–24 November 2016; Revised Selected Papers, Part V 13. Springer: Berlin/Heidelberg, Germany, 2017; pp. 198–213. [Google Scholar]
  23. Yigitcanlar, T. Smart cities: An effective urban development and management model? Aust. Plan. 2015, 52, 27–34. [Google Scholar] [CrossRef]
  24. Wang, B.; Leng, Y.; Wang, G.; Wang, Y. Fusiontransnet for smart urban mobility: Spatiotemporal traffic forecasting through multimodal network integration. arXiv 2024, arXiv:2405.05786. [Google Scholar]
  25. Dzemydienė, D.; Burinskienė, A.; Čižiūnienė, K. An approach of integration of contextual data in e-service system for management of multimodal cargo transportation. Sustainability 2024, 16, 7893. [Google Scholar] [CrossRef]
  26. Fadhel, M.A.; Duhaim, A.M.; Saihood, A.; Sewify, A.; Al-Hamadani, M.N.; Albahri, A.; Alzubaidi, L.; Gupta, A.; Mirjalili, S.; Gu, Y. Comprehensive systematic review of information fusion methods in smart cities and urban environments. Inf. Fusion 2024, 107, 102317. [Google Scholar] [CrossRef]
  27. Doss, S.; Paranthaman, J. Artificial intelligence approach for community data safety and vulnerability in smart city. Artif. Intell. 2024, 11, 1–19. [Google Scholar]
  28. Amrit, P.; Singh, A.K. AutoCRW: Learning based robust watermarking for smart city applications. Softw. Pract. Exp. 2024, 54, 1957–1971. [Google Scholar] [CrossRef]
  29. Tyagi, N.; Bhushan, B. Demystifying the role of natural language processing (NLP) in smart city applications: Background, motivation, recent advances, and future research directions. Wirel. Pers. Commun. 2023, 130, 857–908. [Google Scholar] [CrossRef]
  30. Fu, X. Natural language processing in urban planning: A research agenda. J. Plan. Lit. 2024, 39, 395–407. [Google Scholar] [CrossRef]
  31. Reshamwala, A.; Mishra, D.; Pawar, P. Review on natural language processing. IRACST Eng. Sci. Technol. Int. J. (ESTIJ) 2013, 3, 113–116. [Google Scholar]
  32. Goswami, J.; Prajapati, K.K.; Saha, A.; Saha, A.K. Parameter-efficient fine-tuning large language model approach for hospital discharge paper summarization. Appl. Soft Comput. 2024, 157, 111531. [Google Scholar] [CrossRef]
  33. Wibawa, A.P.; Kurniawan, F. A survey of text summarization: Techniques, evaluation and challenges. Nat. Lang. Process. J. 2024, 7, 100070. [Google Scholar]
  34. Ghosh, A.; Tomar, M.; Tiwari, A.; Saha, S.; Salve, J.; Sinha, S. From sights to insights: Towards summarization of multimodal clinical documents. In Proceedings of the 62nd Annual Meeting of the Association for Computational Linguistics (Volume 1: Long Papers), Bangkok, Thailand, 11–16 August 2024; pp. 13117–13129. [Google Scholar]
  35. Chen, T.C. Multimodal Multi-Document Evidence Summarization for Fact-Checking. Ph.D. Thesis, Virginia Polytechnic Institute and State University, Blacksburg, VA, USA, 2024. [Google Scholar]
  36. Nguyen, L.; Scialom, T.; Piwowarski, B.; Staiano, J. LoRaLay: A multilingual and multimodal dataset for long range and layout-aware summarization. arXiv 2023, arXiv:2301.11312. [Google Scholar]
  37. Zhu, Z.; Gong, S.; Qi, J.; Tong, C. HTPosum: Heterogeneous Tree Structure augmented with Triplet Positions for extractive Summarization of scientific papers. Expert Syst. Appl. 2024, 238, 122364. [Google Scholar] [CrossRef]
  38. Zhang, L.; Zhang, X.; Han, L.; Yu, Z.; Liu, Y.; Li, Z. Multi-task hierarchical heterogeneous fusion framework for multimodal summarization. Inf. Process. Manag. 2024, 61, 103693. [Google Scholar] [CrossRef]
  39. Backer Johnsen, H. Graphical Abstract?-Reflections on Visual Summaries of Scientific Research. Master’s Thesis, Aalto University, Aalto, Finland, April 2022. [Google Scholar]
  40. Ma, Y.; Jiang, F.K. Verbal and visual resources in graphical abstracts: Analyzing patterns of knowledge presentation in digital genres. Ibérica Rev. Asociación Eur. Lenguas Fines Específicos (AELFE) 2023, 46, 129–154. [Google Scholar] [CrossRef]
  41. Jambor, H.K.; Bornhäuser, M. Ten simple rules for designing graphical abstracts. PLoS Comput. Biol. 2024, 20, e1011789. [Google Scholar] [CrossRef]
  42. Givchi, A.; Ramezani, R.; Baraani-Dastjerdi, A. Graph-based abstractive biomedical text summarization. J. Biomed. Inform. 2022, 132, 104099. [Google Scholar] [CrossRef]
  43. Wang, H.; Liu, J.; Duan, M.; Gong, P.; Wu, Z.; Wang, J.; Han, B. Cross-modal knowledge guided model for abstractive summarization. Complex Intell. Syst. 2024, 10, 577–594. [Google Scholar] [CrossRef]
  44. Jangra, A.; Mukherjee, S.; Jatowt, A.; Saha, S.; Hasanuzzaman, M. A survey on multi-modal summarization. ACM Comput. Surv. 2023, 55, 1–36. [Google Scholar] [CrossRef]
  45. Li, M.; Zhang, L.; Ji, H.; Radke, R.J. Keep meeting summaries on topic: Abstractive multi-modal meeting summarization. In Proceedings of the 57th Annual Meeting of the Association for Computational Linguistics, Florence, Italy, 28 July–2 August 2019; pp. 2190–2196. [Google Scholar]
  46. Bhatia, N.; Jaiswal, A. Automatic text summarization and it’s methods-a review. In Proceedings of the 2016 6th International Conference-Cloud System and Big Data Engineering (Confluence), Noida, India, 14–15 January 2016; pp. 65–72. [Google Scholar]
  47. Chen, Z.; Lu, Z.; Rong, H.; Zhao, C.; Xu, F. Multi-modal anchor adaptation learning for multi-modal summarization. Neurocomputing 2024, 570, 127144. [Google Scholar] [CrossRef]
  48. Zhuang, H.; Zhang, W.E.; Xie, L.; Chen, W.; Yang, J.; Sheng, Q. Automatic, meta and human evaluation for multimodal summarization with multimodal output. In Proceedings of the 2024 Conference of the North American Chapter of the Association for Computational Linguistics: Human Language Technologies (Volume 1: Long Papers), Mexico City, Mexico, 16–21 June 2024; pp. 7768–7790. [Google Scholar]
  49. Li, H.; Zhu, J.; Ma, C.; Zhang, J.; Zong, C. Multi-modal summarization for asynchronous collection of text, image, audio and video. In Proceedings of the 2017 Conference on Empirical Methods in Natural Language Processing, Copenhagen, Denmark, 9–11 September 2017; pp. 1092–1102. [Google Scholar]
  50. Li, H.; Zhu, J.; Liu, T.; Zhang, J.; Zong, C. Multi-modal Sentence Summarization with Modality Attention and Image Filtering. In Proceedings of the International Joint Conference on Artificial Intelligence (IJCAI), Stockholm, Sweden, 13–19 July 2018; pp. 4152–4158. [Google Scholar]
  51. Xiao, M.; Zhu, J.; Lin, H.; Zhou, Y.; Zong, C. Cfsum: A coarse-to-fine contribution network for multimodal summarization. arXiv 2023, arXiv:2307.02716. [Google Scholar]
  52. Lu, M.; Liu, Y.; Zhang, X. A modality-enhanced multi-channel attention network for multi-modal dialogue summarization. Appl. Sci. 2024, 14, 9184. [Google Scholar] [CrossRef]
  53. Li, H.; Zhu, J.; Zhang, J.; He, X.; Zong, C. Multimodal sentence summarization via multimodal selective encoding. In Proceedings of the 28th International Conference on Computational Linguistics, Barcelona, Spain, 13–18 September 2020; pp. 5655–5667. [Google Scholar]
  54. Yuan, M.; Cui, S.; Zhang, X.; Wang, S.; Xu, H.; Liu, T. Exploring the Trade-Off within Visual Information for MultiModal Sentence Summarization. In Proceedings of the 47th International ACM SIGIR Conference on Research and Development in Information Retrieval, Washington, DC, USA, 14–18 July 2024; pp. 2006–2017. [Google Scholar]
  55. Im, J.; Kim, M.; Lee, H.; Cho, H.; Chung, S. Self-supervised multimodal opinion summarization. arXiv 2021, arXiv:2105.13135. [Google Scholar]
  56. Song, X.; Jing, L.; Lin, D.; Zhao, Z.; Chen, H.; Nie, L. V2P: Vision-to-prompt based multi-modal product summary generation. In Proceedings of the 45th International ACM SIGIR Conference on Research and Development in Information Retrieval, Madrid, Spain, 11–15 July 2022; pp. 992–1001. [Google Scholar]
  57. Liu, Z.; Zhang, X.; Zhang, L.; Yu, Z. MDS: A Fine-Grained Dataset for Multi-Modal Dialogue Summarization. In Proceedings of the 2024 Joint International Conference on Computational Linguistics, Language Resources and Evaluation (LREC-COLING 2024), Torino, Italy, 20–25 May 2024; pp. 11123–11137. [Google Scholar]
  58. Zhang, J.G.; Zou, P.; Li, Z.; Wan, Y.; Pan, X.; Gong, Y.; Yu, P.S. Multi-modal generative adversarial network for short product title generation in mobile e-commerce. arXiv 2019, arXiv:1904.01735. [Google Scholar]
  59. Chen, J.; Zhuge, H. Abstractive text-image summarization using multi-modal attentional hierarchical RNN. In Proceedings of the 2018 Conference on Empirical Methods in Natural Language Processing, Brussels, Belgium, 31 October–4 November 2018; pp. 4046–4056. [Google Scholar]
  60. Fu, X.; Wang, J.; Yang, Z. Multi-modal summarization for video-containing documents. arXiv 2020, arXiv:2009.08018. [Google Scholar]
  61. Zhu, J.; Li, H.; Liu, T.; Zhou, Y.; Zhang, J.; Zong, C. MSMO: Multimodal summarization with multimodal output. In Proceedings of the 2018 Conference on Empirical Methods in Natural Language Processing, Brussels, Belgium, 31 October–4 November 2018; pp. 4154–4164. [Google Scholar]
  62. Zhu, J.; Zhou, Y.; Zhang, J.; Li, H.; Zong, C.; Li, C. Multimodal summarization with guidance of multimodal reference. In Proceedings of the AAAI Conference on Artificial Intelligence, New York, NY, USA, 7–12 February 2020; Volume 34, pp. 9749–9756. [Google Scholar]
  63. Tan, Z.; Zhong, X.; Ji, J.Y.; Jiang, W.; Chiu, B. Enhancing Large Language Models for Scientific Multimodal Summarization with Multimodal Output. In Proceedings of the 31st International Conference on Computational Linguistics: Industry Track, Abu Dhabi, United Arab Emirates, 19–24 January 2025; pp. 263–275. [Google Scholar]
  64. Zhu, J.; Xiang, L.; Zhou, Y.; Zhang, J.; Zong, C. Graph-based multimodal ranking models for multimodal summarization. Trans. Asian Low-Resour. Lang. Inf. Process. 2021, 20, 1–21. [Google Scholar] [CrossRef]
  65. Zhang, Z.; Meng, X.; Wang, Y.; Jiang, X.; Liu, Q.; Yang, Z. Unims: A unified framework for multimodal summarization with knowledge distillation. In Proceedings of the AAAI Conference on Artificial Intelligence, Virtual, 22 February–1 March 2022; Volume 36, pp. 11757–11764. [Google Scholar]
  66. Zhang, L.; Zhang, X.; Pan, J. Hierarchical cross-modality semantic correlation learning model for multimodal summarization. In Proceedings of the AAAI Conference on Artificial Intelligence, Virtual, 22 February–1 March 2022; Volume 36, pp. 11676–11684. [Google Scholar]
  67. Mukherjee, S.; Jangra, A.; Saha, S.; Jatowt, A. Topic-aware multimodal summarization. In Proceedings of the Findings of the Association for Computational Linguistics: AACL-IJCNLP 2022, Online, 20–23 November 2022; pp. 387–398. [Google Scholar]
  68. Fu, X.; Wang, J.; Yang, Z. Mm-avs: A full-scale dataset for multi-modal summarization. In Proceedings of the 2021 Conference of the North American Chapter of the Association for Computational Linguistics: Human Language Technologies, Online, 6–11 June 2021; pp. 5922–5926. [Google Scholar]
  69. Jin, X.; Liu, K.; Jiang, J.; Xu, T.; Ding, Z.; Hu, X.; Huang, Y.; Zhang, D.; Li, S.; Xue, K.; et al. Pattern recognition of distributed optical fiber vibration sensors based on resnet 152. IEEE Sens. J. 2023, 23, 19717–19725. [Google Scholar] [CrossRef]
  70. Liu, Y.; Dong, X.; Zhang, D.; Xu, S. Deep unsupervised part-whole relational visual saliency. Neurocomputing 2023, 563, 126916. [Google Scholar] [CrossRef]
  71. Lewis, M.; Liu, Y.; Goyal, N.; Ghazvininejad, M.; Mohamed, A.; Levy, O.; Stoyanov, V.; Zettlemoyer, L. Bart: Denoising sequence-to-sequence pre-training for natural language generation, translation, and comprehension. arXiv 2019, arXiv:1910.13461. [Google Scholar]
  72. Zhang, Y.; Yang, Q. An overview of multi-task learning. Natl. Sci. Rev. 2018, 5, 30–43. [Google Scholar] [CrossRef]
  73. Dey, R.; Salem, F.M. Gate-variants of gated recurrent unit (GRU) neural networks. In Proceedings of the 2017 IEEE 60th International Midwest Symposium on Circuits and Systems (MWSCAS), Boston, MA, USA, 6–9 August 2017; pp. 1597–1600. [Google Scholar]
  74. Li, P.; Jiang, X.; Shatkay, H. Figure and caption extraction from biomedical documents. Bioinformatics 2019, 35, 4381–4388. [Google Scholar] [CrossRef]
  75. Yadav, H.; Patel, N.; Jani, D. Fine-tuning BART for abstractive reviews summarization. In Computational Intelligence: Select Proceedings of InCITe 2022; Springer: Berlin/Heidelberg, Germany, 2023; pp. 375–385. [Google Scholar]
  76. Zhang, Z. Improved adam optimizer for deep neural networks. In Proceedings of the 2018 IEEE/ACM 26th International Symposium on Quality of Service (IWQoS), Banff, AB, Canada, 4–6 June 2018; pp. 1–2. [Google Scholar]
  77. Ng, J.P.; Abrecht, V. Better summarization evaluation with word embeddings for ROUGE. arXiv 2015, arXiv:1508.06034. [Google Scholar]
  78. Liu, Y.; Li, C.; Xu, S.; Han, J. Part-whole relational fusion towards multi-modal scene understanding. Int. J. Comput. Vis. 2025, 1–11. [Google Scholar] [CrossRef]
  79. Lee, J.; Lee, D.; Lee, Y.; Hwang, W.; Kim, S. Improving the accuracy of top-N recommendation using a preference model. Inf. Sci. 2015, 290–304. [Google Scholar]
  80. Moratanch, N.; Chitrakala, S. A survey on extractive text summarization. In Proceedings of the 2017 International Conference on Computer, Communication and Signal Processing (ICCCSP), Chennai, India, 10–11 January 2017; pp. 1–6. [Google Scholar]
  81. Gupta, S.; Gupta, S.K. Abstractive summarization: An overview of the state of the art. Expert Syst. Appl. 2019, 121, 49–65. [Google Scholar] [CrossRef]
  82. Zhu, C.; Yang, Z.; Gmyr, R.; Zeng, M.; Huang, X. Make Lead Bias in Your Favor: A Simple and Effective Method for News Summarization. ICLR 2020 Conference Blind Submission, 26 September 2019, Modified: 6 May 2023. Available online: https://openreview.net/forum?id=ryxAY34YwB (accessed on 6 May 2023).
  83. Nenkova, A.; Vanderwende, L. The Impact of Frequency on Summarization; Technical Report MSR-TR-2005; Microsoft Research: Redmond, WA, USA, 2005; Volume 101. [Google Scholar]
  84. Mihalcea, R.; Tarau, P. Textrank: Bringing order into text. In Proceedings of the 2004 Conference on Empirical Methods in Natural Language Processing, Barcelona, Spain, 25–26 July 2004; pp. 404–411. [Google Scholar]
  85. Erkan, G.; Radev, D.R. Lexrank: Graph-based lexical centrality as salience in text summarization. J. Artif. Intell. Res. 2004, 22, 457–479. [Google Scholar] [CrossRef]
  86. Christian, H.; Agus, M.P.; Suhartono, D. Single document automatic text summarization using term frequency-inverse document frequency (TF-IDF). ComTech Comput. Math. Eng. Appl. 2016, 7, 285–294. [Google Scholar] [CrossRef]
  87. Luhn, H.P. The automatic creation of literature abstracts. IBM J. Res. Dev. 1958, 2, 159–165. [Google Scholar] [CrossRef]
  88. Ercan, G. Automated Text Summarization and Keyphrase Extraction. Master’s Thesis, Bilkent University, Ankara, Turkey, 2006. Unpublished. [Google Scholar]
  89. Etemad, A.G.; Abidi, A.I.; Chhabra, M. Fine-tuned t5 for abstractive summarization. Int. J. Perform. Eng. 2021, 17, 900. [Google Scholar]
  90. Li, J.; Chen, J.; Chen, H.; Zhao, D.; Yan, R. Multilingual Generation in Abstractive Summarization: A Comparative Study. In Proceedings of the 2024 Joint International Conference on Computational Linguistics, Language Resources and Evaluation (LREC-COLING 2024), Torino, Italy, 20–25 May 2024; pp. 11827–11837. [Google Scholar]
  91. Abualigah, L.; Bashabsheh, M.Q.; Alabool, H.; Shehab, M. Text summarization: A brief review. In Recent Advances in NLP: The Case of Arabic Language; Springer: Cham, Switzerland, 2020; pp. 1–15. [Google Scholar]
  92. Zhang, J.; Zhao, Y.; Saleh, M.; Liu, P. Pegasus: Pre-training with extracted gap-sentences for abstractive summarization. In Proceedings of the International Conference on Machine Learning, PMLR, Virtual, 13–18 July 2020; pp. 11328–11339. [Google Scholar]
  93. Mishra, N.; Sahu, G.; Calixto, I.; Abu-Hanna, A.; Laradji, I.H. LLM aided semi-supervision for Extractive Dialog Summarization. arXiv 2023, arXiv:2311.11462. [Google Scholar]
  94. Darapaneni, N.; Prajeesh, R.; Dutta, P.; Pillai, V.K.; Karak, A.; Paduri, A.R. Abstractive text summarization using bert and gpt-2 models. In Proceedings of the 2023 International Conference on Signal Processing, Computation, Electronics, Power and Telecommunication (IConSCEPT), Karaikal, India, 25–26 May 2023; pp. 1–6. [Google Scholar]
  95. Mengi, R.; Ghorpade, H.; Kakade, A. Fine-tuning t5 and roberta models for enhanced text summarization and sentiment analysis. Great Lakes Bot. 2023, 12. Available online: https://www.researchgate.net/publication/376232167_Fine-tuning_T5_and_RoBERTa_Models_for_Enhanced_Text_Summarization_and_Sentiment_Analysis (accessed on 6 May 2023).
  96. Pinkus, A. Approximation theory of the MLP model in neural networks. Acta Numer. 1999, 8, 143–195. [Google Scholar] [CrossRef]
  97. Abdulnabi, A.H.; Wang, G.; Lu, J.; Jia, K. Multi-task CNN model for attribute prediction. IEEE Trans. Multimed. 2015, 17, 1949–1959. [Google Scholar] [CrossRef]
  98. Bhojanapalli, S.; Chakrabarti, A.; Glasner, D.; Li, D.; Unterthiner, T.; Veit, A. Understanding robustness of transformers for image classification. In Proceedings of the IEEE/CVF International Conference on Computer Vision, Montreal, BC, Canada, 11–17 October 2021; pp. 10231–10241. [Google Scholar]
  99. Dhruv, P.; Naskar, S. Image classification using convolutional neural network (CNN) and recurrent neural network (RNN): A review. In Machine Learning and Information Processing: Proceedings of ICMLIP 2019; Springer: Singapore, 2020; pp. 367–381. [Google Scholar]
  100. Tatsunami, Y.; Taki, M. Sequencer: Deep lstm for image classification. Adv. Neural Inf. Process. Syst. 2022, 35, 38204–38217. [Google Scholar]
  101. Krubiński, M. Multimodal Summarization. Ph.D. Thesis, Charles University, Prague, Cszech Republic, 2024. [Google Scholar]
  102. Chen, Z.; Zhou, Y.; He, X.; Zhang, J. Learning task relationships in evolutionary multitasking for multiobjective continuous optimization. IEEE Trans. Cybern. 2020, 52, 5278–5289. [Google Scholar] [CrossRef]
  103. Bhatti, F.; Shah, M.A.; Maple, C.; Islam, S.U. A novel internet of things-enabled accident detection and reporting system for smart city environments. Sensors 2019, 19, 2071. [Google Scholar] [CrossRef]
  104. Ma, M.; Preum, S.M.; Ahmed, M.Y.; Tärneberg, W.; Hendawi, A.; Stankovic, J.A. Data sets, modeling, and decision making in smart cities: A survey. ACM Trans. Cyber-Phys. Syst. 2019, 4, 1–28. [Google Scholar] [CrossRef]
  105. Chen, T.; Liu, S.; Chang, S.; Cheng, Y.; Amini, L.; Wang, Z. Adversarial robustness: From self-supervised pre-training to fine-tuning. In Proceedings of the IEEE/CVF Conference on Computer Vision and Pattern Recognition, Seattle, WA, USA, 13–19 June 2020; pp. 699–708. [Google Scholar]
  106. Yang, Y.; Wan, F.; Jiang, Q.Y.; Xu, Y. Facilitating multimodal classification via dynamically learning modality gap. Adv. Neural Inf. Process. Syst. 2024, 37, 62108–62122. [Google Scholar]
Figure 1. Input and output examples from the proposed multimodal-interactive network.
Smartcities 08 00096 g001
Figure 2. Overall framework of our model.
Smartcities 08 00096 g002
Figure 3. Structural information enhancement module.
Smartcities 08 00096 g003
Figure 4. Combination module.
Smartcities 08 00096 g004
Figure 5. Output module.
Smartcities 08 00096 g005
Figure 6. Image part of the dataset.
Smartcities 08 00096 g006
Figure 7. Text part of the dataset.
Smartcities 08 00096 g007
Figure 8. Word cloud of the dataset.
Smartcities 08 00096 g008
Figure 9. Bar chart of the dataset.
Smartcities 08 00096 g009
Figure 10. Attention map of one example article.
Smartcities 08 00096 g010
Table 1. Dataset statistics.
TrainValidTest
Num. Papers61565163
Avg. Num. Words in papers6784.907088.756836.77
Avg. Num. Words in Summary124.30128.78125.64
Avg. Num. Image in Papers6.696.856.74
Max. Num. Image in Papers191725
Min. Num. Image in Papers111
Max. Num. Words in Papers14,08412,74613,119
Min. Num. Words in Papers285431663085
Max. Num. Words in Summary285216285
Min. Num. Words in Summary405632
Table 2. Performance of comparative models on the dataset.
ModelRouge1Rouge2RougeLRougeLSum
Extractive ModelsLead3[82]24.94876.375413.691913.6954
Sumbasic [83]22.92433.966611.379311.3944
TextRrank [84]30.93476.292417.065217.0658
LexRank [85]29.63145.860316.18416.2027
TF-IDF [86]24.88685.035011.418811.4339
Luhn [87]5.87793.09013.77533.7759
KL-Sum [88]5.82223.13453.68133.6819
Abstractive ModelsT5 [89]30.45627.595019.048319.0540
Mbart [90]37.32019.010419.860119.8400
Led [91]42.185212.376320.343820.3380
Pegasus [92]43.626714.620124.457824.4086
DistilBart [93]38.948610.957421.066221.0610
GPT2 [94]25.21573.274712.642412.6543
RoBERTa [95]15.33631.63479.94419.9185
Proposed46.554516.133624.954824.9227
Table 3. Comparison of output between the proposed network and other models.
ModelOutput
Ground TruthSmartcities 08 00096 i001Smartcities 08 00096 i002
T5Smartcities 08 00096 i003
MBartSmartcities 08 00096 i004
LedSmartcities 08 00096 i005
PegasusSmartcities 08 00096 i006
DistilBartSmartcities 08 00096 i007
ProposedSmartcities 08 00096 i008Smartcities 08 00096 i009
Table 4. Ablation study of the combination module on the dataset.
TypeTaskRouge1Rouge2RougeLRougeLSumTop-1Top-2
W/o CMI----85.28%94.48%
T45.870715.490824.725924.6456--
I+T46.018215.561224.764824.767485.89%95.09%
With CMI----86.50%93.87%
T46.276215.848324.744124.7765--
I+T (ours)46.554516.133624.954824.922787.12%95.71%
Table 5. Ablation study of the structural information enhancement module on the dataset.
TypeTaskRouge1Rouge2RougeLRougeLSumTop-1Top-2
W/o SEMI----84.66%93.87%
T45.837215.696624.516724.5102--
I+T46.210815.881324.768224.819985.28%95.09%
With SEMI----86.50%93.87%
T46.276215.848324.744124.7765--
I+T (ours)46.554516.133624.954824.922787.12%95.71%
Table 6. Retrieval performance of text query image and image query text tasks.
TaskModel10305080100
Text query ImageMLP [96]0.01810.02530.02820.03100.0324
CNN [97]0.01790.02420.02760.03030.0316
Transformer [98]0.01620.02310.02630.02900.0304
RNN [99]0.01720.02460.02770.03040.0319
LSTM [100]0.01540.02140.02480.02780.0289
Proposed0.02160.02860.03150.03440.0356
Image query TextMLP [96]0.02560.03110.03410.03780.0385
CNN [97]0.01930.02420.02700.02990.0312
Transformer [98]0.02440.03120.03340.03690.0383
RNN [99]0.01530.02410.02830.03180.0332
LSTM [100]0.01700.02280.02560.02890.0302
Proposed0.02700.03440.03750.04090.0420
Disclaimer/Publisher’s Note: The statements, opinions and data contained in all publications are solely those of the individual author(s) and contributor(s) and not of MDPI and/or the editor(s). MDPI and/or the editor(s) disclaim responsibility for any injury to people or property resulting from any ideas, methods, instructions or products referred to in the content.

