Article

Optimizing Smart City Street Design with Interval-Fuzzy Multi-Criteria Decision Making and Game Theory for Autonomous Vehicles and Cyclists

by
Maryam Fayyaz
1,
Gaetano Fusco
2,
Chiara Colombaroni
2,
Esther González-González
1,* and
Soledad Nogués
1
1
GEURBAN Research Group, School of Civil Engineering, University of Cantabria, 39005 Santander, Spain
2
Department of Civil, Constructional and Environmental Engineering (DICEA), Sapienza University of Rome, 00184 Rome, Italy
*
Author to whom correspondence should be addressed.
Smart Cities 2024, 7(6), 3936-3961; https://doi.org/10.3390/smartcities7060152
Submission received: 1 October 2024 / Revised: 6 December 2024 / Accepted: 10 December 2024 / Published: 12 December 2024

Abstract

:

Highlights

What are the main findings?
  • Safety is the most critical factor in designing urban streets that integrate cyclists and autonomous vehicles (AVs);
  • Green infrastructure and smart technology adoption are the optimal integration strategies.
What are the implications of the main findings?
  • These strategies foster a balanced coexistence of cyclists and AVs, leading to a more efficient transport system and a more sustainable urban environment in the driverless era.
  • This research provides valuable guidance for urban planners and decision makers on the implementation of AVs on our streets, while advocating for sustainable and active mobility.

Abstract

Encouraging older and newer mobility alternatives to standard privately owned cars, such as cycling and autonomous vehicles, is necessary to reduce pollution, enhance safety, increase transportation efficiency, and create a more sustainable urban environment. Implementing mobility plans that identify the use of different transport modes in their confidence intervals can lead to the development of smarter and more efficient cities, where all citizens can benefit from safe and environmentally friendly streets. This research aims to provide insights into designing urban streets that seamlessly integrate autonomous vehicles and cyclists, promoting sustainable mobility while ensuring urban transport efficiency. With this aim, the research identifies and prioritizes the factors that are relevant to street design as well as the appropriate strategies to address them. Our methodology combines Multi-Criteria Decision-Making (MCDM) with Game theory to identify and realize the most convenient conditions for this integration. Initially, the basic factors were identified using the value-interval fuzzy Delphi method. Following this, the factors were weighted with the interval-fuzzy Analytic Network Process (ANP), and the cause-and-effect variables were evaluated using the interval-fuzzy Decision-Making Trial and Evaluation Laboratory ANP (DANP). Finally, Game theory was employed to determine the optimal model for addressing these challenges. The results indicate that safety emerged as the most significant factor and two optimal strategies were identified; the integration of green infrastructure and smart technology.

1. Introduction

In recent years, there has been a growing interest in transport alternatives that can offer more sustainable, efficient, and inclusive solutions for urban mobility, such as bicycles, or that enhance technological performance, such as self-driving or Autonomous Vehicles (AVs).
Achieving dynamic, inclusive, and environmentally friendly urban environments that accommodate the varied requirements and desires of city dwellers is linked to the prioritizing non-motorized modes of transport [1,2], such as cycling. Bicycles are low-cost, zero-emission, and healthy modes of transport that can improve physical and mental well-being and reduce the demand for car trips and parking spaces [3]. By providing secure and easily accessible pathways for cyclists, citizens’ health is improved, car dependency is decreased, and both traffic congestion and atmospheric contamination are alleviated [4,5]. However, urban cyclists face various challenges, such as safety concerns, a lack of dedicated infrastructure, traffic congestion, and conflicts with other road users [6], which result in their minority use in most cities.
The imminent arrival of AVs has generated an increasing need to plan and design roadway spaces that can accommodate both traditional and new transportation modes [7], which can make cycling even more difficult. Emerging AVs can operate without human intervention, using sensors, cameras, and artificial intelligence to comprehend and navigate the traffic environment [8,9], and it is expected that AVs can potentially enhance the safety, convenience, and accessibility of urban transport, as well as optimize the use of road space and energy [10]. However, to fully realize the benefits of AVs, it is not enough to simply introduce them into existing street spaces designed for conventional cars [10,11]. Cyclists are vulnerable road users who require adequate infrastructure and protection from motorized traffic, while AVs are intelligent agents who need technological devices to communicate and cooperate with other vehicles and streets, requiring new traffic regulations and formal rules [12,13].
Autonomous vehicles have distinct capacities to tackle certain difficulties. They are primarily designed to strictly comply with traffic restrictions, therefore minimizing the likelihood of accidents caused by human mistakes, which is a major issue for cyclists [14]. Furthermore, AVs’ capacity to effectively communicate with one another and the surrounding infrastructure shows a potential for improving bicycle safety and preventing accidents through precise anticipation of their actions. By sharing real-time data with other AVs and traffic management systems, they can adjust their speed, direction, and braking patterns to avoid collisions [15]. For instance, if an AV detects a cyclist approaching an intersection, it can communicate this information to other AVs nearby, prompting them to slow down or stop to ensure the cyclist’s safety. Additionally, AVs can interact with smart traffic signals and road signs, which can provide warnings to both drivers and cyclists about potential hazards ahead. This interconnected network enhances the overall safety of urban environments by minimizing human error and ensuring a coordinated response to dynamic traffic situations [16]. Moreover, AVs can potentially mitigate traffic congestion by optimizing routes and decreasing the number of vehicles on the road [17], therefore improving the practicality and effectiveness of cycling as a means of urban transportation.
While there are positive aspects to consider, designing streets to accommodate a variety of transportation modes, including bicycles and self-driving cars, poses challenges that require thorough evaluation and prioritization, based on their importance and level of uncertainty [16,18]. Although previous studies analyzed street design factors and aspects of the interaction between cyclists and AVs, no comprehensive research was found that simultaneously addresses the identification of lane design factors and the proposal of strategies to address them. This research aims to provide valuable insights into the issues and guidelines for redesigning streets to integrate autonomous vehicles and cyclists harmoniously and efficiently, creating a more balanced relationship between different road users and promoting sustainable mobility patterns. This research proposes a novel mixed-method approach, combining Multi-Criteria Decision Making methods (MCDM), fuzzy Delphi, and Analytical Network Process (ANP) with DEMATEL (DANP) with Game theory. The Delphi method involves consulting experts on the most relevant factors affecting street design for autonomous vehicles and cyclists, as extracted from the literature. Then, the DANP is applied to evaluate and rank these factors. Later, Game theory is used to address the issues with several technological, behavioral, spatial, and policy strategies. This combination introduces several advantages, namely, comprehensive evaluation of conflicting factors, flexibility in decision making, providing multiple optimal strategies, and practicality, ensuring robustness against uncertainties.
Based on the above, the present study is organized as follows: Section 2 reviews the existing literature to understand the factors involved in designing street spaces for both bicycles and AVs and methods used to assess and estimate urban design and planning factors and policies. Section 3 details the combined methodology of fuzzy MDCM and Game theory, outlining how these methods collectively identify and prioritize key issues in smart city street design and strategies to overcome them. Section 4 presents the results obtained, pointing to the most effective strategies to address the integration of cyclists and AVs. Finally, Section 5 provides the main conclusions of the research, discusses the results, and introduces further lines of research.

2. Literature Review

2.1. Street Design for Cyclists and AVs

Bicycle use is directly linked to several factors that relate not only to the formal configuration of cycling infrastructures, i.e., the existence and width of cycling lanes, but also to the urban environment in which they are located [19,20]. These factors can be classified into barriers that discourage or facilitators that enhance the activity [21,22].
In a study of the relationship between urban planning and physical activity, Lee and Moudon [23] established four categories of barriers that discourage activities such as walking and cycling, namely, opportunity, distance, access, and safety. These barriers include unsafe route conditions, poor maintenance, or a lack of high-quality route-related facilities. Based on this classification, Wang et al. [19] conducted an extensive review of the literature, organizing the barriers as follows: opportunity barriers related to the lack of cycling or recreational facilities; access and distance barriers associated with unconnected networks or large travel distances; safety barriers regarding insecure environments or crossing points and high crime and accident rates; and physical setting barriers involving pleasant landscapes, high-quality environments, and weather conditions. Well-maintained paths and short and flattened trails were identified as the most effective attributes to encourage cycling.
Traffic and interaction with motorized vehicles are highlighted as major concerns. Streets with heavy traffic and/or high traffic speeds put cyclists at risk and create a sense of insecurity [24,25], which particularly affects women [26]. The provision of appropriate cycling infrastructures/facilities, such as cycling lanes or trails and bike racks, is obviously the first requirement to enhance this mode of transportation [20,21]. However, the physical separation of theses cycle lanes increases objective and perceived levels of safety and comfort, as pointed out by several studies [27,28].
A relevant factor when talking about cycling infrastructure is accessibility. To make cycling accessible and usable for all people, including people with disabilities, inclusive street design should be promoted, and it is a topic on which there is still little research [29,30]. Design requirements should consider, among other technical aspects, a wider lane width and turning radius, adapted to the specific characteristics of the type of bicycle used by people with disabilities [29]. In addition, the continuity of networks and on-street bicycle lanes is considered a major facilitator to cycling activity [20,31].
Intersections, where the interaction between cyclists and other road users is higher, are a particularly sensitive element [31,32,33]. In their study of cyclists’ risk perceptions, Parkin et al. [27] demonstrated that roundabouts were associated with higher perceived risk than traffic signal-controlled intersections. Roundabouts can be designed as high-capacity and high-speed intersections or as intersections with wide approaches and traffic lanes that help calm traffic while providing connections between different links in the network [34]. Intersections not only increase the perceived risk for cyclists, who are some of the most vulnerable road users, but also account for a significant proportion of all crashes [34].
A number of accidents are due to drivers failing to see cyclists in time, demonstrating that visibility is also an important factor. Improving the visibility of cyclists is particularly relevant in adverse weather conditions, on streets with poor or no lighting and at night [35,36]. Solving such problems can also help improve the sustainability of street conditions. Sustainable practices, including the use of renewable materials and energy-efficient designs, are key to improving safety while reducing environmental impacts and ensuring long-term sustainability. For example, adaptive street lighting that adjusts intensity based on the detection of vehicles, pedestrians, and cyclists, is a priority when dealing with visibility issues, as well as the promotion of energy-efficient street design [37]. Similarly, new pavements can prevent falls and injuries and also mitigate the heat island effect and water runoff problems associated with asphalt [38]. In fact, road surface conditions are also relevant factors in cycling infrastructures: deteriorated pavement, the presence of obstacles, glass/debris, and especially slopes have a negative influence [19,21,24,25]. Although it may be attractive to some experienced cyclists [39], in general the presence of steep inclines is a factor negatively associated with cycling for transportation [40]. This is because unfavorable slopes can cause accidents and slow traffic flow.
Atmospheric environmental factors, such as meteorological conditions and air quality, also exert influences on individuals’ cycling activity levels. Bad weather, ice and snow, and the presence of air pollutants have been found to have deterrent effects for cyclists [19,25]. These findings concur with those of Helbich et al. [41], who confirmed significant weather effects on cycling, highlighting that trips for leisure and in surrounding areas are more sensitive to weather conditions than trips for commuting and in more densely populated central areas.
Urban design features of travel lanes and intersections will be affected by the introduction of AVs [42,43], which may either emphasize or reduce some of the above-mentioned negative factors that affect cycling. Research on cyclist autonomous vehicle interaction has focused on similar key issues, often linked to safety, such as communication technology requirements and the design of traffic infrastructure. For example, several authors highlight the difficulties in detecting and predicting the trajectory and behavior of cyclists [44,45,46,47]. To address these issues, authors have proposed improving the interaction through communication systems. Using intelligent sensors for AVs, vehicles can better communicate the intention to merge with or overtake cyclists [48]. Solutions to facilitate safe interactions include equipping not only AVs but also the cyclists. Berge et al. [44] propose a support system for cyclists based on a passive beacon or chip system that connects them with vehicles and other road users as well as with infrastructure. On the other hand, in addition to improving current technologies, such as adaptive driving algorithms [45], advances in artificial intelligence are expected to help increase the detection capabilities of AVs [49].
In general, authors suggest that to improve the safety of cyclists it is necessary to segregate lanes by mode and multi-level crossing with AVs and active travel modes [50]. In a recent study, Ngwu et al. [51] evaluated adolescent cyclists’ perceptions of traffic infrastructure designs, pointing to spacious bike lanes, separated lanes for cyclists and AVs, most preferably with physical barriers, and clear markings and signage for AVs and cyclists as the most important design elements.
However, AV-only lanes may also pose a challenge to trips undertaken by other modes of transport [52]. In contrast to suburban areas, AVs may negatively affect street compatibility with cyclists in city centers due to increased traffic volume [53]. An efficient approach involves assessing the effects of lane design on both traffic congestion and environmental considerations. When designing lanes that allow bicycles and autonomous cars to coexist peacefully, it is important to consider different route choices and the interactions between human-driven vehicles (HVs) and AVs. Allocating exclusive lanes for connected and autonomous vehicles (CAVs) can significantly enhance and decrease emissions traffic efficiency [54,55] and reduce the likelihood of accidents [56]. In addition, the process of incorporating AVs into the current road infrastructure necessitates substantial financial resources and a considerable amount of time [57].
Another feasible design option to enhance network efficiency is the implementation of a multi-lane AV zone, dedicated to both AVs and HVs, as suggested by Roy et al. [58]. In this case, AVs must possess the ability to reliably perceive and respond appropriately to interactions with cyclists and drivers. This includes being able to interpret visual cues such as eye contact and manual signals, as emphasized by Park and Sohn [56].
Despite its significance, research on improving bicycle AV interactions has been scarce. This scarcity is attributed by Wang et al. [59] to the quick progress of AV technology, which surpasses academic research endeavors, posing challenges for academics in staying updated with advancements and conducting thorough studies. In addition, the complexity of urban settings and the ever-changing interactions between street users present difficulties in creating feasible simulation scenarios and gathering pertinent data [2].
These contributions serve as examples of research that emphasizes the importance of carefully planning and designing streets that improve cycling experiences and interactions between cyclists and AVs. Even while cutting-edge AV technology has the potential to dramatically lower accident rates and increase bike safety, challenges involving the requirements for suitable infrastructure and intricate urban interactions still exist. These types of complex decisions, where diverse conflicting factors should be considered simultaneously, need decision support tools that can help planners and designers identify the most optimal design and planning strategies, as explained below.

2.2. Methods Used to Assess and Estimate Urban Design and Planning Challenges and Policies

The design of street spaces affects the mobility, safety, and well-being of various road users, and is always associated with several factors that seem even more complex with the introduction of new modes of transport, such as AVs. To assess and identify these factors, various methods and criteria can be used, e.g., Multi-Criteria Decision Making (MCDM) or Game theory.
MCDM methods assist decision makers in making well-informed choices in intricate scenarios with numerous objectives and constraints [60]. The fuzzy approach to MCMD has the relevant advantage that it enables a better representation of the vagueness of different criteria perceptions inherent in the human decision-making process involving quantitative and qualitative attributes.
For example, the fuzzy Delphi method (FDM) is an MCDM technique that uses expert opinions and linguistic variables to reach a consensus on the importance and uncertainty of the factors [61]. Liu et al. [62] showed that the FDM can effectively prioritize the infrastructure needs for connected and autonomous vehicles (CAVs), such as safe harbors and charging facilities, which are crucial for their integration into urban environments. Additionally, Liu et al. [63] demonstrated the application of this method in optimizing dedicated lanes for CAVs, considering factors like traffic flow and safety, which are pertinent to urban design and transportation planning. Using the MCDM technique like Electre III and AHP, Kiciński et al. [64] assessed various scenarios for the urban public transportation system in Cracow, Poland. Ten criteria encompassing economic, technical, social, and environmental elements formed the basis of the assessment of several combinations of high-speed rail, tram, bus, and subterranean transportation systems.
Game theory is a branch of mathematics and economics that studies the strategic behavior of rational agents in situations of conflict and co-operation [65,66,67], and can be used to model and analyze various phenomena in urban planning, design, and transport studies [68,69]. For example, Cortés-Berrueco et al. [70] applied Game theory to analyze driver strategies and their impact on traffic flow. Their study highlights a method of optimizing mobility by modeling driver interactions and lane-changing behaviors, with significant implications for both urban design and traffic control strategies. In a similar vein, Zhu et al. [71] propose a Game theory-based lane-changing conflict management model for automated vehicles. It addresses conflicts of interest between vehicles, such as sacrificing speed for lane-changing vehicles. This method has also been used in autonomous-driving-related studies, such as by Liu et al. [62]. By integrating autonomous driving technologies, cities can optimize transportation systems, promote sustainability, and enhance the urban experience. Urban planners can focus on optimizing traffic flow, reducing congestion, and promoting alternative modes of transportation. The framework also emphasizes safety, reducing accidents, and promoting pedestrian-friendly environments. Also related to AVs, Wang and colleagues [59] introduced a novel approach to determine lane changes in communal spaces, which could influence urban planning. They utilized the overtaking expectation parameter and a unique approach to determine the optimal option in situations where no driver is willing to switch lanes.

3. Research Methodology

This research proposes to create a thorough three-step model by combining Multi-Criteria Decision Making (MCDM)—fuzzy Delphi and fuzzy DANP—with Game theory to facilitate the design of road space for the peaceful and effective cohabitation of cyclists and AVs. It utilizes a range of tactics, including technical breakthroughs, behavioral insights, spatial considerations, and legislative frameworks, to tackle the issues related to their interplay.
In this study, MCDM techniques were employed to assess and rank the different factors that impact cyclists’ AV interactions in lane design, like safety, efficiency, and user preferences [72]. The fuzzy Delphi method (FDM) is an enhancement of the traditional Delphi method, integrating fuzzy logic to handle the inherent uncertainty and subjectivity in expert opinions. The traditional Delphi method involves a series of iterative rounds of questioning among a panel of experts to reach a consensus on a particular issue. The FDM could offer significant advantages in identifying factors (i.e., barriers and facilitators) in smart city street design for AVs and cyclists by systematically aggregating expert opinions with uncertainty handling, ensuring robust consensus. This method enhances decision-making accuracy by incorporating diverse perspectives and addressing the inherent vagueness in expert judgments. By incorporating fuzzy logic, FDM allows for a more flexible and nuanced expression of expert judgments, capturing the degree of confidence or uncertainty in their responses.
The combination of the fuzzy ANP and the Decision-Making Trial and Evaluation Laboratory (DEMATEL) was then used to determine the final relative importance of designing factors and calculate the internal relationships among them, given that this hybrid method may manage complicated situations with interdependencies and feedback among criteria (i.e., factors) and alternatives [73,74]. Combining fuzzy ANP with DEMATEL (DANP) has the potential to simplify and standardize decision making, while also offering a more thorough and practical examination of the issue at hand [75].
Lastly, Game theory under fuzzy sets also provides a significant framework for comprehending and simulating the strategic interactions between cyclists and AVs. Game theory models can accurately represent the motivations and actions of both parties involved, taking into account elements such as the perception of risk, the willingness to co-operate, and the drive to compete. Researchers can utilize Game theory to analyze cyclist AV interactions and devise techniques to enhance safety and optimize co-operation on the road.
By integrating these three methodologies, a thorough and resilient framework was constructed to facilitate decision making in the design of lanes for bicycles and AVs, while also considering various factors and uncertainties (Figure 1). Specifically, combining MCDM and Game theory enables a comprehensive evaluation that optimizes conflicting design factors, allows for a flexible decision making by offering multiple optimal strategies, and ensures the robustness of solutions against uncertainties. To achieve this, this methodology was grounded in the following assumptions:
  • Decision makers are rational and aim to optimize the model’s defined objectives;
  • The methods applied (fuzzy Delphi, fuzzy DANP, and Game theory) effectively manage uncertainties and complex interdependencies among the factors;
  • Interactions between factors and strategies are modeled linearly using normalized weights derived from the fuzzy ANP;
  • The data collected from expert surveys are reliable and accurately represent real-world priorities.

3.1. Identifying Factors for Bicycles and AVs Street Design with Interval Fuzzy Delphi Technique

The first step in designing street spaces is to identify and prioritize the most relevant factors or criteria (barriers and facilitators) in lane design for bicycles and AVs. To validate and ensure the selection of factors, the interval-fuzzy Delphi technique was used.
First, the desired factors were extracted from the literature review. We conducted a comprehensive literature search using electronic databases such as Google Scholar, Scopus, Science Direct, and others to identify relevant articles related to cycling infrastructure design, barriers to cycling, smart city street design, AV street design, and interactions between cyclists and AVs. As a result, seven key factors were identified in this study.
Once the factors were selected, the fuzzy Delphi technique was used to rate the importance of the factors, with a group of five experts in urban planning. Each member rated the importance independently and confidentially using a questionnaire (Figure 2) and the valuation ratings provided in Table 1. Then, the interval average of the importance of each index was calculated. Finally, the average of these numbers was diffused. Any index with a score above 0.5 was used as the final index.

3.2. Ranking and Importance of Street Design Factors with Interval-Fuzzy DANP

The subsequent step involves the application of the fuzzy DANP. The ANP expands on the Analytic Hierarchy Process (AHP) by accommodating network structures instead of only hierarchical ones [74,76]. DEMATEL is an MCDM technique that uses a communication link matrix to analyze interdependencies and causal linkages within a system [77]. It computes an ANP super-matrix to determine criterion and sub-criterion weights by using the same total effect numbers, which are then balanced to achieve unlimited power for the weights [74]. This is crucial to methodologically evaluate interrelationships and interdependencies between criteria, i.e., street design factors. In order to achieve reliable results in our study, this combined method offered a thorough framework for prioritizing factors based on their global relevance.
Various integration approaches between ANP and DEMATEL exist, each suited to specific goals or structural issues. Typically, DEMATEL identifies critical aspects and their relationships, while ANP assigns weights to factors and prioritizes alternatives. Another approach involves constructing interdependent matrices for ANP using DEMATEL, illustrating how each cluster and node influences others. In this study, we applied the combined DEMATEL and ANP algorithms described by Nematkhan et al. [78].

3.2.1. Fuzzy ANP

The fuzzy ANP is a method used for decision making, where criteria weights are provided as intervals, as in the present study. This process involves multiple steps, including the normalization of intervals and their aggregation to determine final weights, which help in handling the inherent uncertainties in the data.
An Interval Fuzzy Element (IVFE) is an advanced concept in fuzzy set theory that combines the principles of fuzzy sets with interval numbers to better handle uncertainty and imprecision. In traditional fuzzy sets, each element has a membership degree between 0 and 1, indicating its degree of belonging to the set. IVFE extends this by allowing the membership degree itself to be an interval, denoted as [µmin, µmax], thus capturing a range of possible membership values. This is particularly useful in scenarios where the exact degree of membership is uncertain or varies within a range. Additionally, the factor’s value can also be represented as an interval, [a, b], reflecting the inherent uncertainty in the data. This dual interval representation—one for the membership degree and one for the factor’s value—provides a more flexible and robust framework for modeling and analyzing uncertain information.
The steps in this algorithm are as follows [74,79,80,81]:
  • Initial Computation: Experts’ assessment on the mutual influence of the n factors selected is derived from IVFE according to Equation (1).
    G ˜ = g ˜ 11 g ˜ 1 j g ˜ 1 n g ˜ i 1 g ˜ i j g ˜ i n g ˜ n 1 g ˜ n j g ˜ n n
    where g ˜ i j = γ ˜ 1 i j , , γ ˜ t i j , , γ ˜ s i j such that γ ˜ t i j = γ ˜ t i j L , γ ˜ t i j R .
The decision matrix G represents pairwise relationships among criteria (factors).
g ˜ : this represents the elements of the decision matrix, which were provided by the s experts and then converted into the decision matrix.
γ ˜ : this refers to the assessment of the t-th expert and is expressed as fuzzy numbers, as denoted by the tilde sign, with the upper and lower bounds denoted by the letters R and L, respectively.
2.
Standardization and Aggregation: The direct impact matrix D is standardized and then used to obtain the comprehensive impact matrix T ˜ using Equation (2), which provides an absorbing state of a Markov chain process as the limit of matrices D1, D2, … Dm [82]:
T ˜ = lim m ( D ˜ + D ˜ 2 + D ˜ 3 + + D ˜ m ) = D ˜ ( I ˜ D ˜ ) 1
where T ˜ denotes the comprehensive impact matrix and the I is the identity matrix, corresponding to Equations (3) and (4).
I D ˜ = 1 0 0 1 0 1 0 1 0 0 1 0 d ˜ 1 j d ˜ 1 n d ˜ i 1 d ˜ i j d ˜ i n d ˜ n 1 d ˜ n j d ˜ n n = 1 0 0 1 0 1 0 1 0 0 1
Also:
D ˜ ( I D ) ˜ 1 = D ˜ I = 0 d ˜ 1 j d ˜ 1 n d ˜ i 1 d ˜ i j d ˜ i n d ˜ n 1 d ˜ n j d ˜ n n · 1 0 0 1 0 1 0 1 0 0 1
3.
Computation Using Coefficient of Variation: In order to compute the normalized effect matrix, we used the Variable Homogeneity Factor of the Coefficient of Variation (VHFCV), a measure of the relative variability. To achieve this objective, we first apply the VHFCV operator to the direct effect matrix Φ in Equations (5) and (6).
Φ = φ 11 φ 1 j φ 1 n φ i 1 φ i j φ i n φ n 1 φ n j φ n n
φ i j = V H F C V g ˜ i j
4.
Normalization: The direct impact matrix Φ is then normalized by using the following Equations (7) and (8):
H = Φ s
s = max m a x 1 i n j = 1 n φ i j , m a x 1 j n i = 1 n φ i j
5.
Total Effect Determination: The last step is to determine the total influential matrix by using the relation in Equation (9):
Z = l i m m ( H + H 2 + H 3 + + H m ) = H ( I H ) 1
6.
Calculation of r and c: Values r and c are typically the row and column sums of the relation matrix, used to determine the prominence and relation of each factor in the decision-making process. These values are calculated based on Equation (10):
r = j = 1 n t i j n × 1 , c = j = 1 n t i j n × 1
The row sums (r) represent the total influence exerted by each factor, indicating its prominence as a driver within the network. The column sums (c) reflect the total influence received by each factor, showcasing its dependency. The difference (rc) identifies whether a criterion is a net influencer or influenced, while the sum (r + c) indicates the overall significance of the criterion within the system.
Once the Delphi method was completed, we considered interval-based elements and applied normalization to the decision matrix. Using a decision matrix, which is a methodical instrument for analyzing and contrasting possibilities according to particular standards, decision-makers can appraise options in an organized way. The options are represented by rows, the criteria by columns, and the matrix values show how well each choice fits with each condition. This procedure allows for the optimal choice to be made by considering both quantitative and qualitative information, usually from reliable sources or experts. Crucially, this is not an isolated action, rather, it is a stage in a series of related processes, each of which builds on the one before it.
  • Normalization: Normalize each interval weight by the sum of all interval weights. For an interval [ai, bj], the normalized interval is given as follows:
    α i α i , b i b i
  • Summing the Intervals: Compute the sum of the lower bounds and the upper bounds of all interval weights.
  • Normalization Calculation: Normalize each interval weight by dividing each lower and upper bound by the corresponding sums computed in the previous step.

3.2.2. DEMATEL

To depict the internal relationships among the main factors, the interval fuzzy-DEMATEL technique was employed. This technique allows experts to articulate their opinions on the factors, including their direction and intensity with greater precision.
In this part, the threshold value was not used in the calculation of the total communication matrix (allowing for the preservation of all internal connections). After obtaining the r and c, to evaluate the influence and interdependence among factors, we used the combined DEMATEL and ANP algorithms to compute the super-matrix and the weighted super-matrix based on Equation (11):
D 1 D j D m c 11 c 1 n 1 c j 1 c j n j c m 1 c m n m T C = D i D i D m c 11 c 12 c 1 n 1 c i 1 c i 2 c 1 n 1 c m 1 c m 2 c m n m g c 11 g c 1 j g c 1 n g c i 1 g c i j g c i n g c n 1 g c n j g c n n
Subsequently, the normalization of matrix Tc was performed as per Equation (12):
T C n o r = T C n o r 11 T C n o r 1 j T C n o r 1 n T C n o r i 1 T C n o r i j T C n o r i n T C n o r n 1 T C n o r n j T C n o r n n
To derive the un-weighted super-matrix, we transformed the comprehensive impact matrix T based on the interdependence of dimension relations and associated clusters, guided by Equation (13):
D 1 D j D m c 11 c 1 n 1 c m 1 c m n m c j 1 c j n j W C = T C n o r = D 1 D i D m c 11 c 12 c i 1 c i 2 c i n 1 c m 1 c m 2 c m n m W c 11 W c i 1 W c m 1 W c 1 j W c i j W c m j W c 1 m W c i m W c m m
The weighted super-matrix W c * was derived based on Equation (14)
W C * = T D n o r W C = t D n o r 11 W c 11 t D n o r i 1 W c i 1 t D n o r m 1 W c m 1 t D n o r 1 j W c 1 j t D n o r i j W c i j t D n o r m j W c m j t D n o r 1 m W c 1 m t D n o r i m W c i m t D n o r m m W c m m
Finally, the weighted super-matrix was raised to the power Φ until convergence, resulting in a stable super-matrix term. This allows for acquiring the global priority vector, which specifies the weights that are influential w = w 1 , w e , , w o n from lim φ W c * φ for the factors. The symbol Φ represents the converged power of the weighted super-matrix, stabilizing to indicate the global priorities of the factors. In Equation (14), Φ is computed iteratively until the matrix converges, ensuring all factors’ weights are normalized. Equation (14) uses the Hadamard product (⨀) to denote element-wise multiplication, differentiating it from standard matrix multiplication (×).
The weights (W) derived from DANP indicate the relative importance of each factor in the context of smart city street design for AVs and cyclists. Additionally, DANP allowed us to assess the influence each factor exerts on others (influence) and the extent to which it is affected by them (influence received). This dual analysis helps us to identify not only which factors are most critical but also how they interact within the decision-making framework, guiding more effective urban design strategies.

3.3. Identifying Strategies with Fuzzy Game Theory

The third step in designing street spaces for cyclists and AVs is to apply Game theory to determine the optimal strategy, considering the interaction between cyclists and AVs. To apply Game theory, the factors can be framed as the first player and the strategies as the second player. The objective is to establish an optimal model where the second player, representing the strategies in the context of AV integration, emerges victorious.
Game theory can help us understand how rational or irrational agents behave in strategic situations, and how to design mechanisms or algorithms that achieve desirable objectives [67,77,83]. When all players keep their current tactics and there is no way for any of them to gain an advantage over the others, this condition is called a Nash equilibrium, and it is a key idea in Game theory [69,84], given that all finite games include a Nash equilibrium. Using the minimax algorithm, which is a recursive method that determines the best course of action for a player in a zero-sum game and suppose that the other player likewise plays optimally, is one approach to locating a Nash equilibrium. In a zero-sum game, one player’s success is another’s failure, and no player’s gain is more than zero [77,81,84] (Table 2).

3.3.1. Identification of Strategies

The first player in this framework stands for the factors that must be reduced, i.e., the weights derived from DANP, normalized using a [0, 1] interval to ensure compatibility; the second player is made up of the approaches meant to deal with these factors, which must be maximized in order to produce the best possible results. This methodology entails giving these players precise definitions and evaluating how well different mitigation techniques work for the concerns that were discovered.
Four primary strategies were chosen for evaluation: climate-responsive design strategies, green infrastructure integration, advanced structural design and engineering, and smart technology integration. These selections were based on a thorough assessment of the literature. These tactics were selected because they have a major effect on passing the stated factors. Their proven efficacy and applicability served as a basis for selection, guaranteeing that the tactics selected offered a comprehensive and doable method for accomplishing the goals of the research. The approach may be reviewed to improve the study’s depth and applicability if different strategies—or a different number of strategies—are determined to be required.

3.3.2. Game Theory with Fuzzy Matrix

Within the field of evolutionary Game theory, scholars examine diverse behavioral patterns displayed by game agents with the goal of identifying behaviors that are most likely to become dominant over time [84]. Central to this investigation are enduring players’ behavioral trends described by Equation (15):
d x i d t = x i f i x φ x t h a t   φ ( x ) = i = 1 n x i f i ( x )
where x i stands for the percentage of the ith strategy type in the players’ population and the vector x = x 1 , x 2 , , x n reflects the distribution of n kinds. As for the fitness of the i type and the average population fitness, they are represented by f i ( x ) and φ ( x ) , respectively [69]. The equation is defined on the n-dimensional simplex because each component xi represents a proportion, and the sum of all components of the vector x equals one. In mathematical terms, this means that the vector x lies within a space where each element xi is a non-negative number, and the total sum of these elements is constrained to be exactly one. This condition ensures that x adheres to the properties of a simplex, a geometric concept that generalizes the idea of a triangle or tetrahedron to n dimensions. The simplex constraint is often used in optimization problems and probability distributions to represent feasible solutions or probabilities that must sum to a whole. It is assumed in the replicator equation that the population is distributed uniformly. The same idea can be applied to choose among different strategies to face the factors identified and assessed as explained in the previous subsections. By substituting A for the evolutionary game’s reward matrix, we obtain Equation (16) from (15):
d x i d t = x i ( A x ) i x T A x ,  
The term ( A x ) i represents the anticipated outcome, whereas x T A x stands for the population’s average fitness. The current proportions of each population use dictate the state of the evolutionary game. The current state of the population at time t may be described by the probabilities of employing the first mode, which is p, and the second mode, which is 1 − p [77,83].
The input pay-off matrix of the evolutionary game viewpoint of the decision-making issue represents the evolvi6ng strategies for street design, denoted as component x i x i X . Consider M as the pay-off matrix that represents the anticipated result of the MCDM issue. Let x i represent the expected benefit of the ith strategy of the street design and y j represent the probability of the jth strategies to deal with barriers and facilitators [69] (Table 3). The super-matrix derived from the DEMATEL process feeds into the Game theory model by influencing the structure of the pay-off matrix (M). Specifically, the weighted relationships in the super-matrix guide the prioritization of strategies in the game-theoretic framework, ensuring alignment with the factors’ causal influences.
The replicator dynamics of the evolutionary game may be described as Equation (17). The replicator dynamics, which govern the evolution of strategies in a population, are represented by differential equations, where M i j × x i indicates the rate of change in strategies over time. In the context of this model, Equation (17) refers to the pay-off functions of a street design. Street design strategies are implemented as a player from zero- and one-sum Game theory. The symbol Z represents the value of the objective function in the optimization problem. Minimizing Z = x 1 + x 2 + x 3 + x 4 reflects the goal of optimizing the allocation of resources or strategies under a set of linear constraints, i.e., to achieve the optimal distribution of strategies addressing the identified factors. These constraints represent the limitations or interactions within the system, ensuring that the strategies adhere to the evolutionary dynamics described by the replicator equations. Thus, the linear optimization problem is a specific case of the broader evolutionary game framework, aiming to find the optimal strategy distribution that minimizes the total resource allocation while satisfying the dynamic constraints.
Minimize   Z   d x i d t d x i d t = x i G i F 1 d y j d t = y j H j F > 1 ,
where G i = i = 1 n M i j × y j ; H j = i = 1 m M i j × x i and F = i = 1 m j = 1 n M i j × x i × y j .
The replicator dynamics of the evolutionary game may be solved numerically, leading to the evolutionarily stable and mixed stable strategy or Nash equilibrium stable fixed points. The linear profile of the plots showing the evolution of strategies over time and the confirmation of their stability by local stability analysis provide support for these fixed points [66,67,77,83,84].

4. Results

4.1. Identification and Ranking of Final Factors

As mentioned previously, we identified seven categories of factors that may be encountered in the smart city street design for AVs and cyclists from the literature review: Structure, Sustainability, Atmospheric environmental conditions, Visual aspect, Safety, Slope, and Accessibility. The fuzzy Delphi method confirmed that all identified factors are relevant and have an impact on the main problem. The factors were evaluated based on their importance, with scores indicating how critical each factor is in the context of urban planning and design.
Safety (C5) emerged as the most relevant factor, with a score of 0.970, suggesting that it is critical for ensuring the success of smart city street designs (Table 4). This high relevance is likely because safety is a fundamental requirement for the adoption and operation of AVs and the protection of cyclists. Any design that compromises safety could lead to serious consequences, hence its high weight and influence. Visual aspect (C4) and Accessibility (C7) both shared a significant level of importance, with scores of 0.857. These factors are crucial because they directly affect user experience and inclusivity. Visual appeal can greatly influence public acceptance, while accessibility ensures that the design meets the needs of all citizens, including those with disabilities. Structure (C1) and Slope (C6) both had moderate importance, each with a score of 0.685. These factors are vital for the physical feasibility and functionality of the street design. The structure determines how well the infrastructure can accommodate traffic flows, while the slope impacts vehicle control and cyclist safety. Sustainability (C2) had a slightly lower relevance with a score of 0.634, reflecting its importance in addressing long-term environmental impacts. Although crucial, it may be seen as less immediate compared to safety or accessibility in the context of day-to-day operations. Atmospheric environmental conditions (C3) was the least relevant factor with a score of 0.500. This lower relevance could be due to the perception that, while environmental factors are important, they may not directly impact the operational efficiency or safety of AVs and cyclists as immediately as the other factors.
In conclusion, and in line with other studies [85,86], Safety (C5) was the most critical factor due to its fundamental role in protecting lives and ensuring the smooth operation of autonomous systems, while Atmospheric environmental conditions (C3) was less critical, reflecting its more indirect impact on the immediate functionality of the system.

4.2. Relevance of Street Design Factors

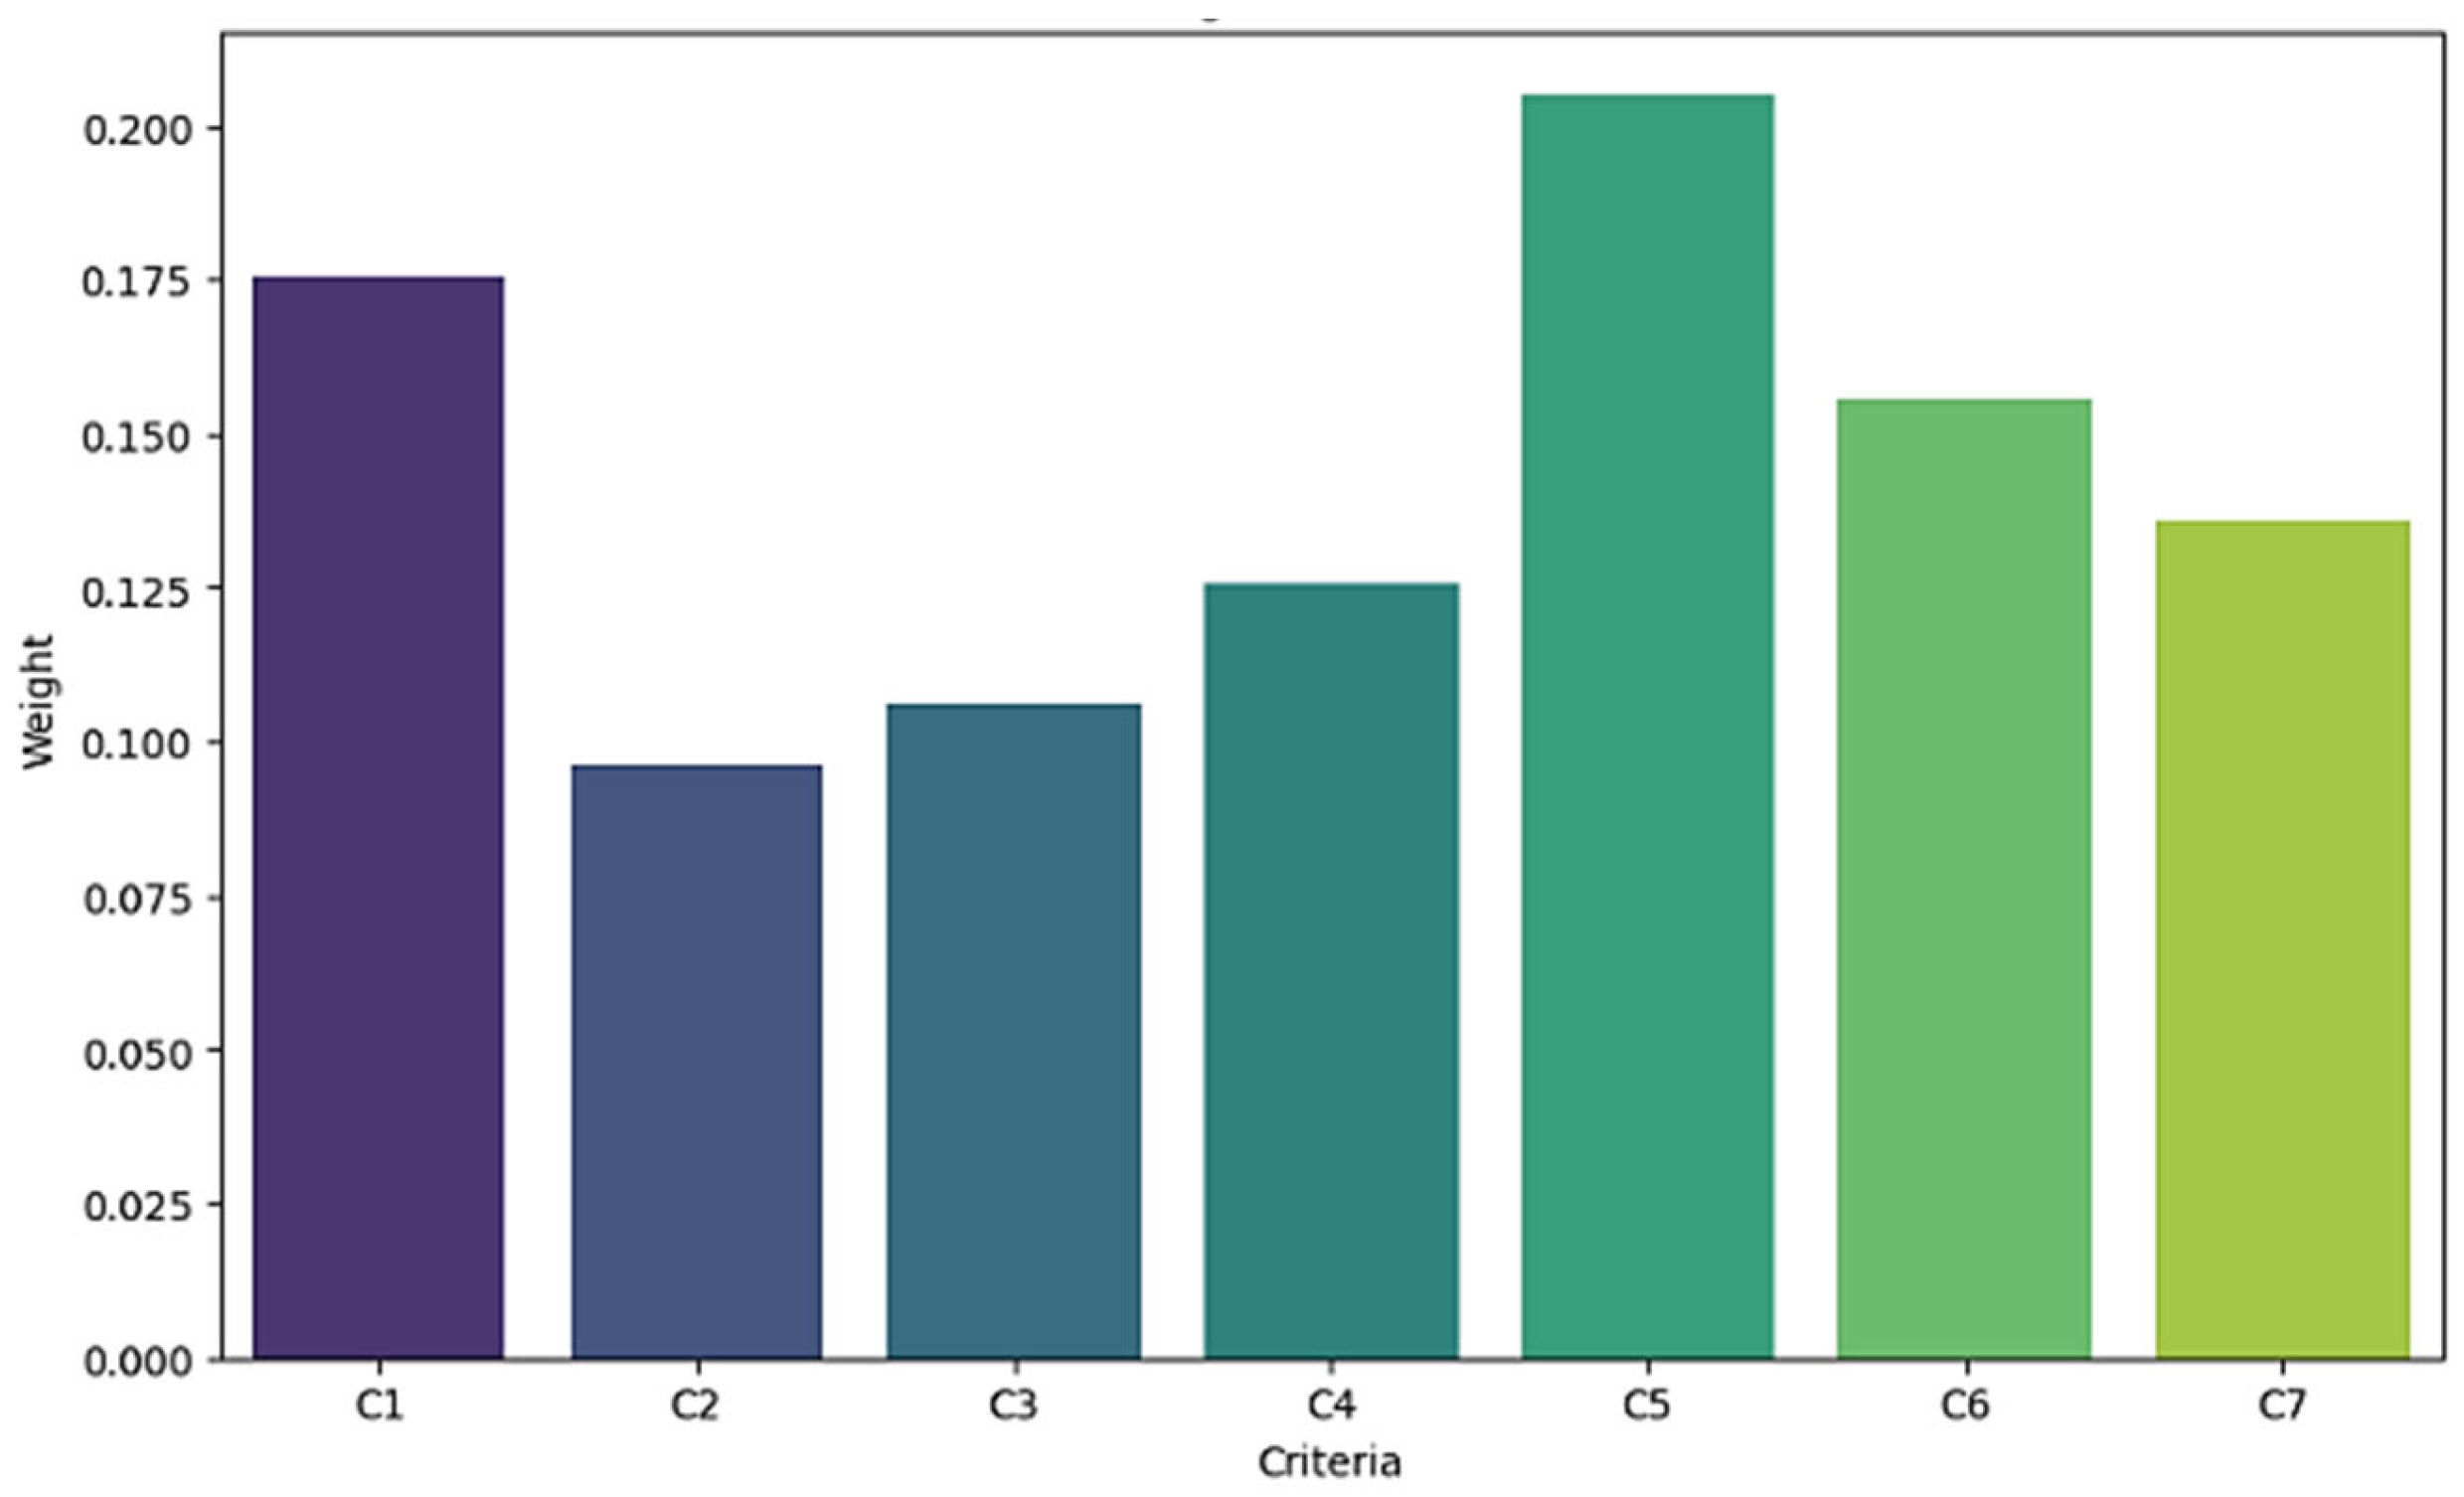
The relative importance of the factors was estimated by means of the DANP approach using a Python/PuLP solver. The sum of the weights values is equal to 1, indicating the correctness of the weighting operation. The analysis of the factors’ weights reveals that ‘C5: Safety’, with a weight of 0.205 (Figure 3), is the most crucial for optimizing smart city street design for AVs and cyclists. This underscores the paramount importance of ensuring the safety of both AVs and cyclists, likely driven by the need to minimize accidents and enhance public trust in autonomous transportation systems.
‘C1: Structure’ follows closely with a weight of 0.175, highlighting the necessity for robust and well-engineered street infrastructure that can support the technological requirements of smart city designs. The ‘C6: Slope’ factor, with a significant weight of 0.156, indicates that the gradient of streets is a vital consideration, likely affecting both vehicle performance and cyclist safety. ‘C4: Visual aspect’ also holds considerable importance with a weight of 0.126, reflecting the need for esthetically pleasing urban environments that can enhance the overall user experience and public acceptance of smart city initiatives. Conversely, ‘C2: Sustainability’ and ‘C3: Atmospheric environment conditions’ have lower weights of 0.096 and 0.106, respectively. While still important, their relatively lower significance suggests that, in this context, immediate functional and safety concerns take precedence over long-term environmental considerations. Notably, ‘C7: Accessibility’ with a weight of 0.136 may indicate a need for further clarity in distinguishing between the two structure-related criteria (C1 and C7) to avoid redundancy and improve the precision of the analysis.
Overall, the prioritization reflects a balanced approach where safety and structural integrity are deemed most critical, ensuring that smart city streets are both functional and secure for autonomous vehicles and cyclists.
In order to determine the threshold value for relationships, it sufficed to compute the mean values of matrix T according to the fuzzy DEMATEL technique. Once the threshold intensity was established, all values in the T matrix that were below the threshold were set to zero, indicating that the causal link was disregarded (Table 5).
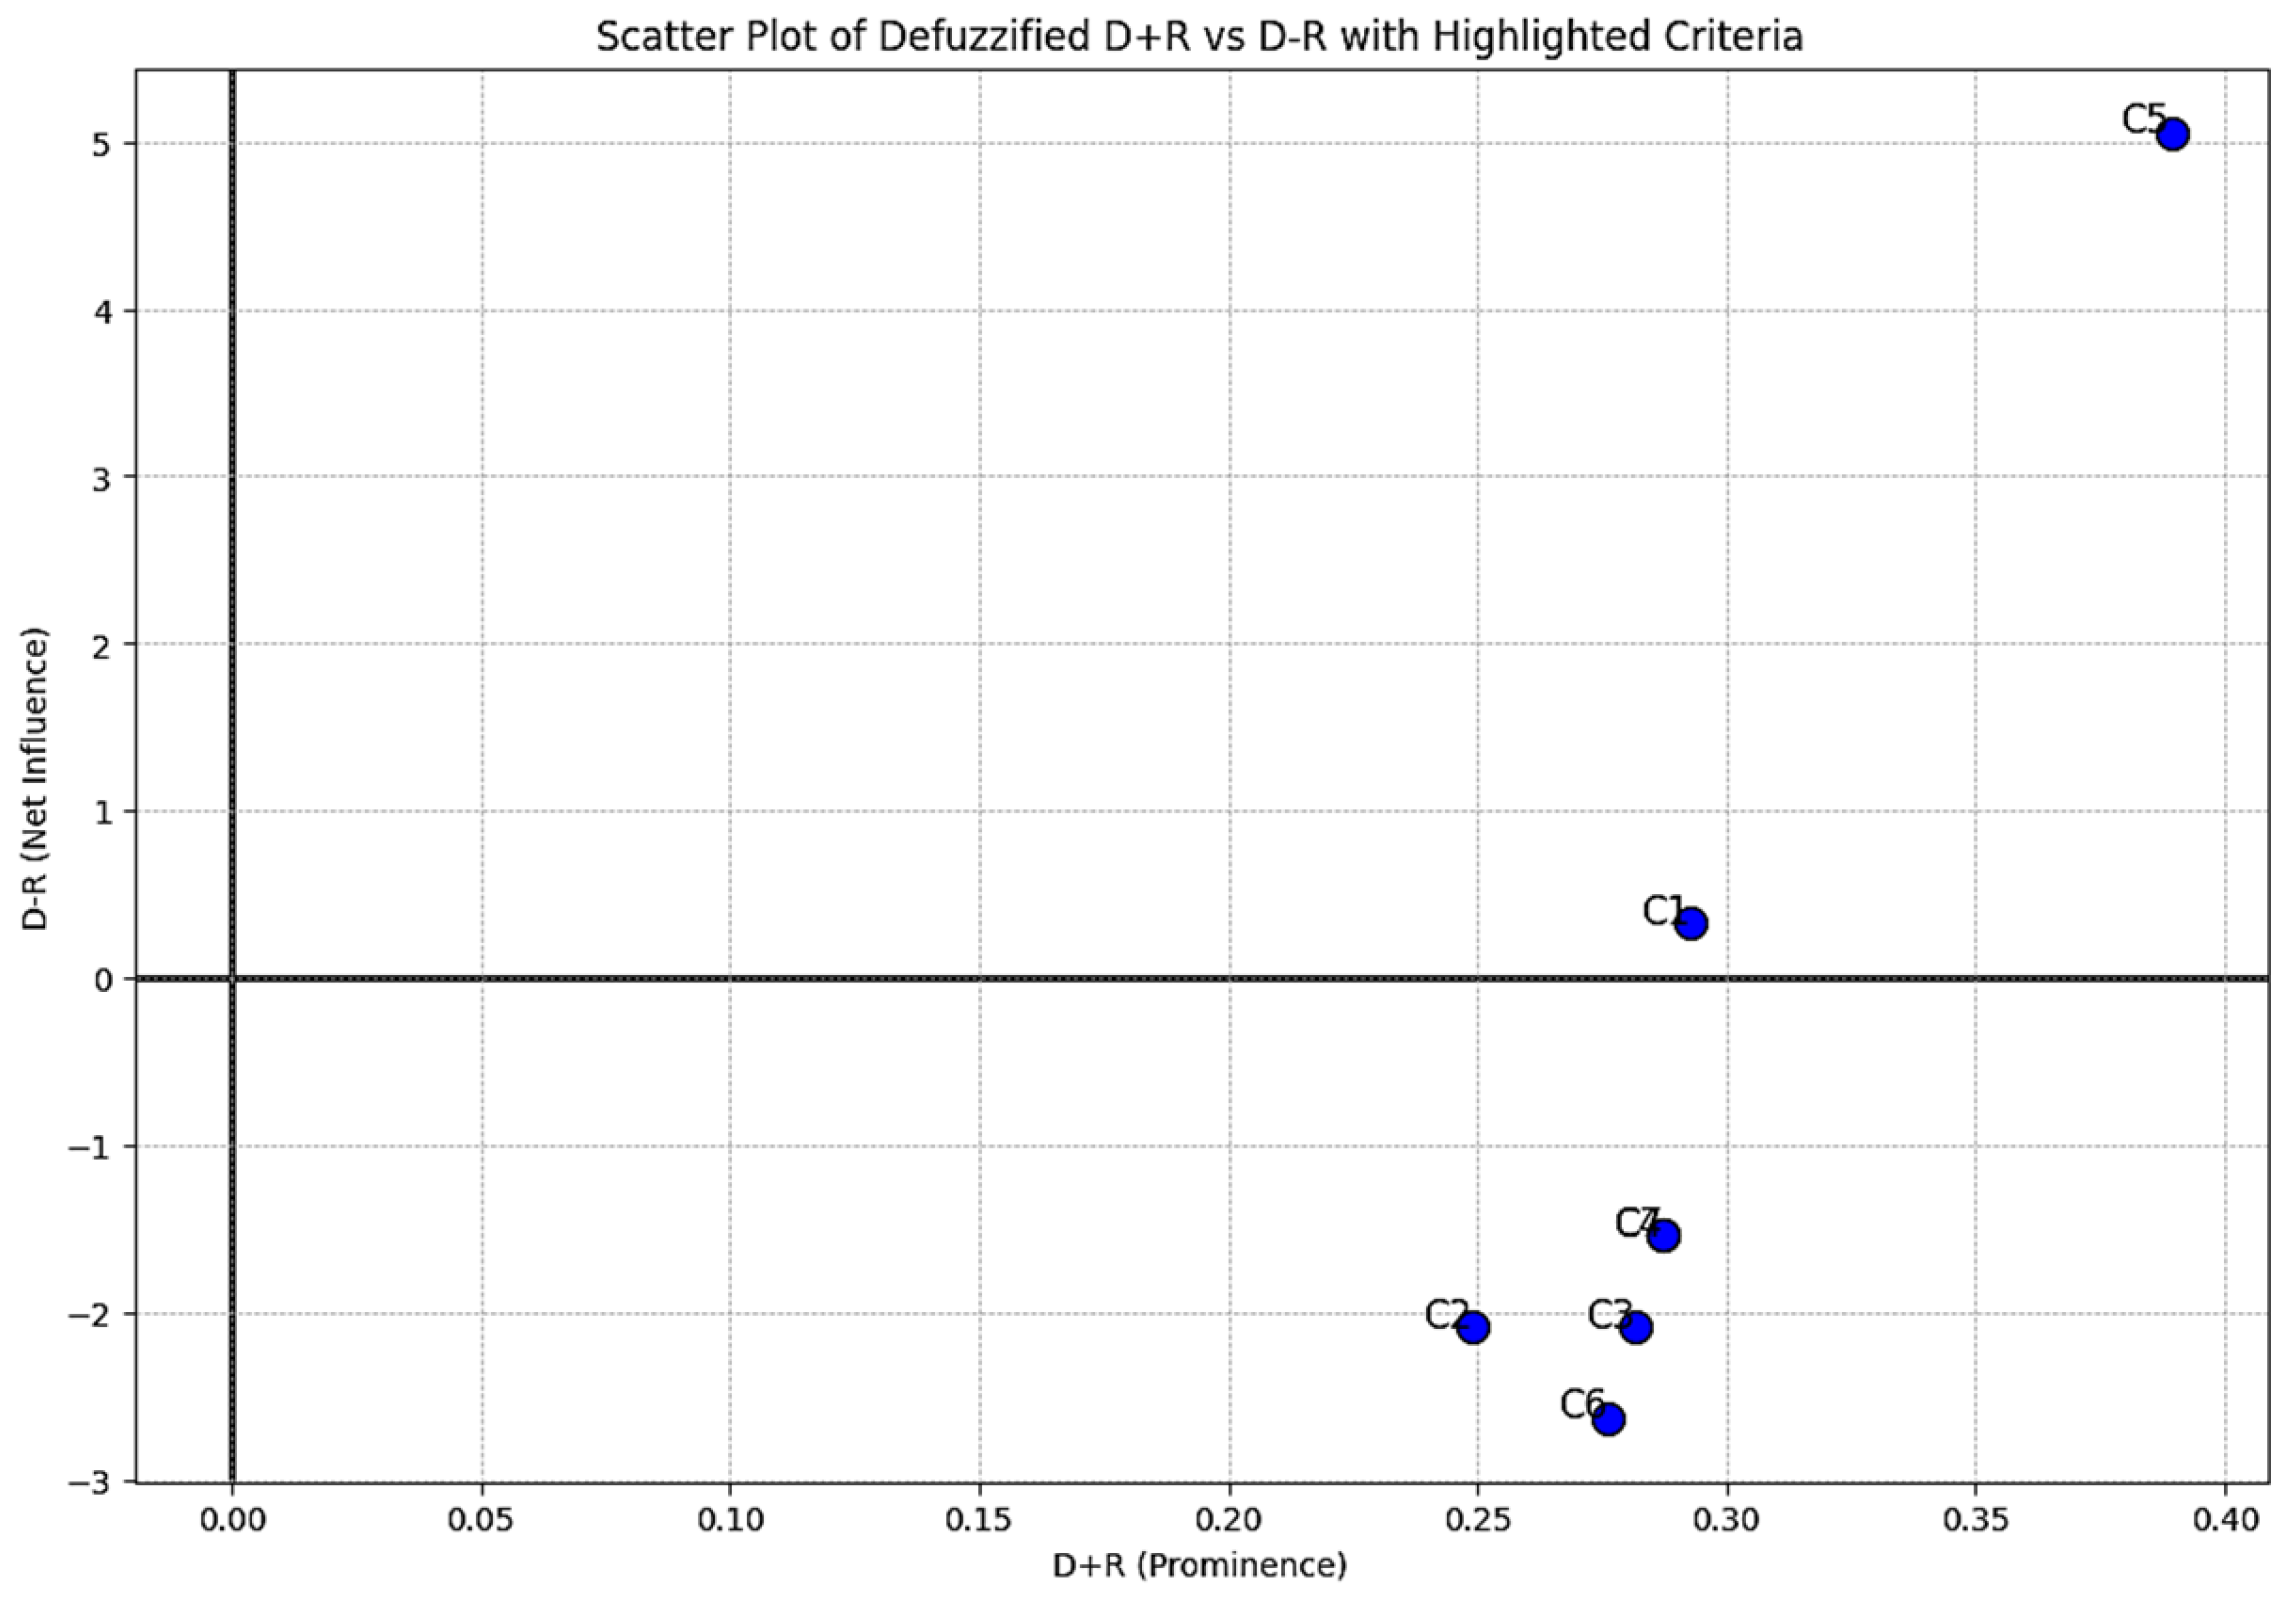
The summation of the components in each row in Table 6 represents the impact of a particular factor on the others within the system. ‘C1: Structure’ and ‘C5: Safety’ are the cause, and the rest represent the effect. Factors C1 and C5 positively influence the other variables, meaning they drive or cause changes in the rest of the variables. In contrast, the rest of the factors are described as the “effect” because they are negatively influenced or impacted on D − R by C1 and C5. Essentially, C1 and C5 are the driving forces (cause) that exert a positive impact in D − R, while the remaining factors are responsive or reactive (effect), experiencing a negative influence as a result.
The analysis shows that ‘Safety’ (C5) is the most influential cause, with the highest positive D − R value of 5.052 (Figure 4). This indicates that safety plays a critical role in impacting other factors, emphasizing its paramount importance in the overall design and functionality of smart city streets. Additionally, ‘Structure’ (C1) also emerges as a significant cause with a positive D − R value of 0.328, highlighting the necessity for robust infrastructure to support the technological requirements of smart city designs. On the other hand, factors such as ‘Sustainability’ (C2), ‘Atmospheric environment conditions’ (C3), ‘Visual aspect’ (C4), ‘Slope’ (C6), and ‘Accessibility’ (C7) are primarily effects, as indicated by their negative D − R values. This suggests that these factors are more influenced by others rather than being primary influencers themselves.

4.3. Strategies

In this step, we define the first and second players. The first player includes factors that should be minimized. The strategies to address these are the second player, which should be maximized, because the goal of our problem is the most optimal way to deal with these barriers and facilitators, so the solutions to our problem are as follows:
Advanced Structural Design and Engineering (S1): Employing innovative structural design techniques and engineering practices enhances the structural characteristics, accessibility, and safety of streets. Traffic signs and road marks ensure the provision of clear information and thus safe navigation for all road users; dedicated lanes can increase capacity and ensure safety but mixed lanes could reduce the number of carriageways, and smart parking lots could release on-street parking space to be reconverted to new cycling lanes [63,87]. Moreover, new pavements can improve the surface conditions, strength, and load-bearing capacity of streets, solving the most demanding problems related to structural performance (due to platooning and reduced wheel wander) [88].
Green Infrastructure Integration (S2): Integrating green infrastructure elements, such as rain gardens and permeable pavements, as well as tree strips, into street designs enhance sustainability and visual aspect. Flood-resistant design features mitigate risks posed by natural disasters and extreme weather events, ensuring the longevity and reliability of streets [89]. These solutions manage stormwater runoff, reduce urban heat island effects, improve air quality, and reduce noise. Additionally, the inclusion of vegetated surfaces and landscaping enhances the esthetic appeal, guides transit itineraries [19], creates wildlife habitats, and promotes biodiversity, fostering healthier and more vibrant urban environments.
Climate-Responsive Design Strategies (S3): Implementing climate-responsive design strategies adapts streets to changing environmental conditions and minimizes vulnerability to climate-related risks. Measures such as shade structures, wind barriers, and snowmelt systems address atmospheric environmental conditions, the visual aspect, and safety. The automation of transport systems can contribute to energy efficiency by optimizing routes and driving patterns [90].
Smart Technology Integration (S4): Integrating smart technology solutions such as sensors, monitoring systems, and predictive analytics enhances the safety, structure efficiency, and sustainability of streets. Real-time monitoring of environmental conditions, traffic flow, and infrastructure performance enables proactive management and optimization [69]. Intelligent traffic management systems optimize signal timing and speed limits, reducing congestion and improving safety [89]. Furthermore, data-driven decision-making informs proactive maintenance strategies and evidence-based policy-making, facilitating sustainable urban development and enhancing the overall quality of life for residents and visitors alike [91].
According to Table 7, the saddle point is MIN MAX = 5 and MAX MIN = 3. The objective function was transformed into a classical form. The problem model was solved twice, once using the normal method and once with uncertainty weights.
The problem model presented was derived from the replicator dynamics equation of the evolutionary game, described in Equation (17). The classical objective function for four strategies is as follows:
minimize   Z = x 1 + x 2 + x 3 + x 4
The limitations of the problem are as follows:
6 x 1 + 8 x 2 + 7 x 3 + 9 x 4 1 7 x 1 + 8 x 2 + 8 x 3 + 6 x 4 1 3 x 1 + 2 x 2 + 2 x 3 + 5 x 4 1 6 x 1 + 5 x 2 + 3 x 3 + 5 x 4 1 8 x 1 + 5 x 2 + 8 x 3 + 8 x 4 1 8 x 1 + 3 x 2 + 8 x 3 + 5 x 4 1 6 x 1 + 2 x 2 + 2 x 3 + x 4 1 That   x i 0
After solving the problem for the strategies in Python/PuLP solver, their importance is obtained as follows:
Optimal   Solution   ( x 1 ,   x 2 , x 3 ,   x 4 ) : [ 0 , 0.058 , 0 , 0.088 ]
Optimal Value of the Objective Function: 0.147
Therefore, the optimal solution is to use the solutions x1 = S2 = 0.058 and x4 = S4 = 0.088, leading to an optimal value of the objective function at 0.147. In the context of optimizing smart city street design for AVs and cyclists using Game theory, the analysis reveals that the optimal strategies are ‘Green Infrastructure Integration’ (S2) and ‘Smart Technology Integration’ (S4). This indicates that these strategies are the most suitable for overcoming the identified factors in the smart city street design process.
‘Green Infrastructure Integration’ (S2) is highlighted as a key strategy, likely due to its ability to enhance sustainability and environmental friendliness, addressing the factors related to sustainability, atmospheric environment conditions, and visual aspect. ‘Smart Technology Integration’ (S4) also emerges as a critical strategy, emphasizing the importance of incorporating advanced technologies to improve the safety, efficiency, and overall functionality of the smart city streets. Together, these strategies provide a balanced approach, combining environmental considerations with technological advancements to create a comprehensive and effective solution for optimizing smart city street design for autonomous vehicles and cyclists.
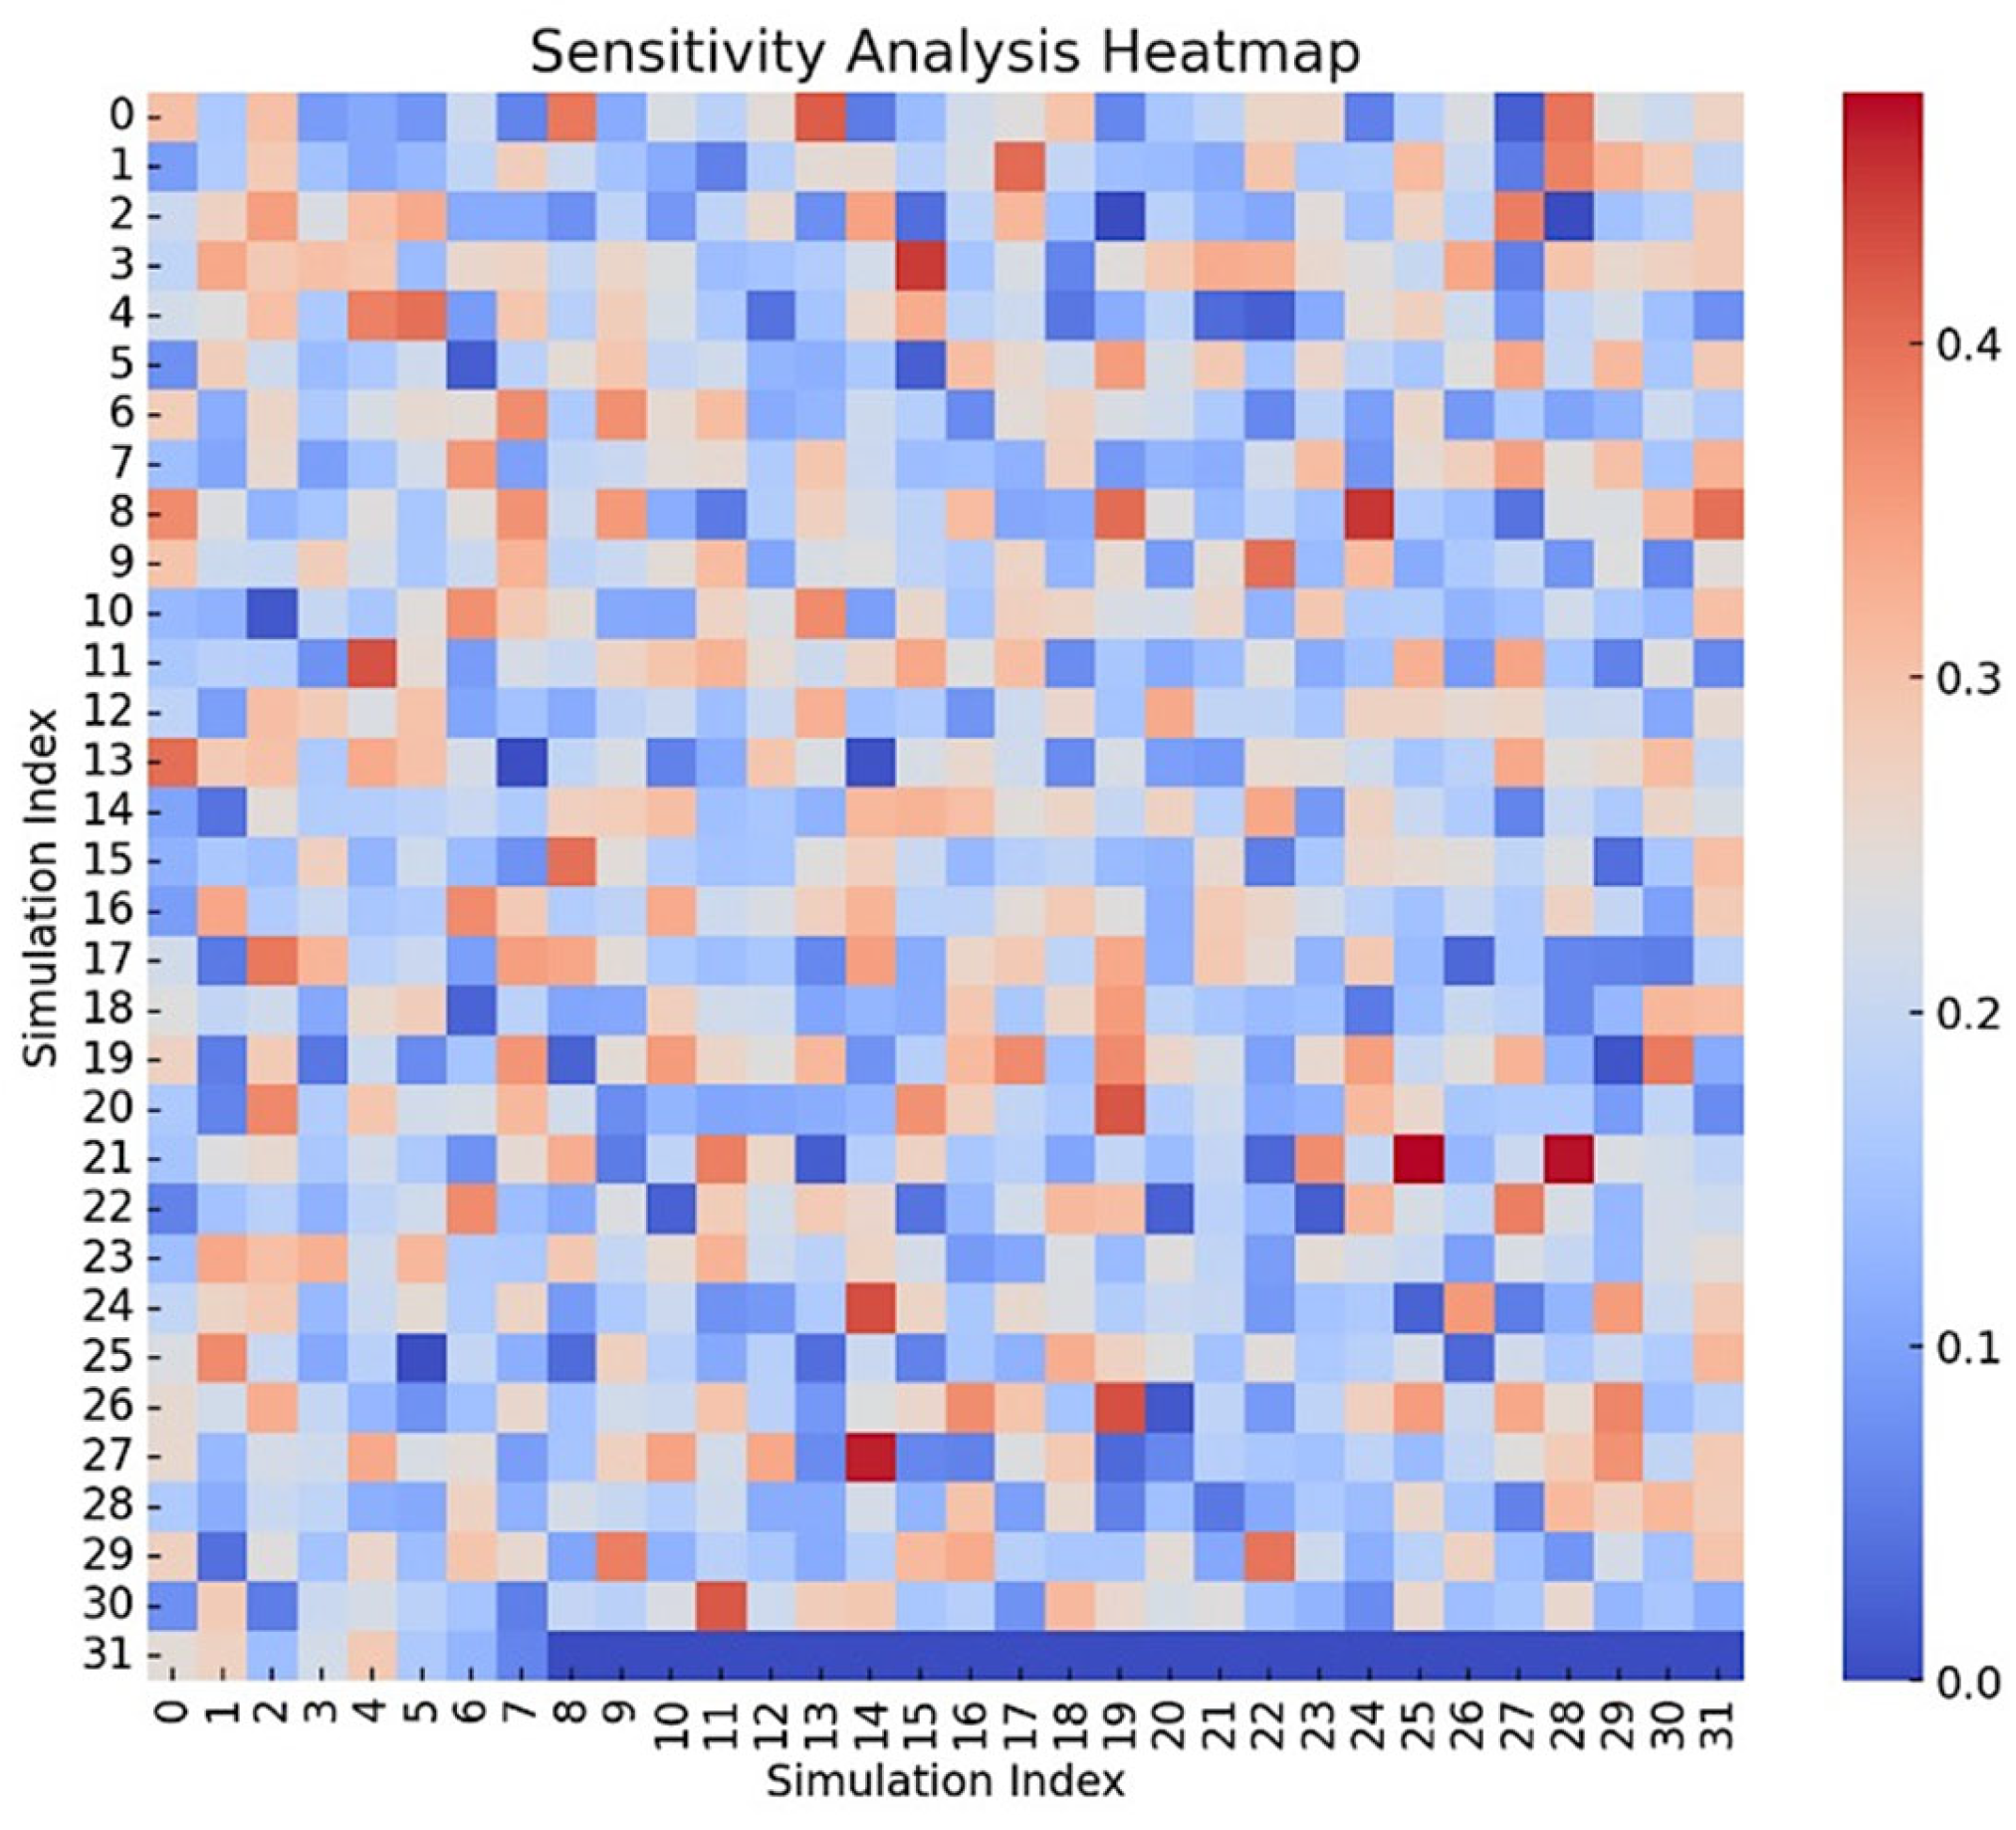
The sensitivity analysis (Figure 5) demonstrates that changing the objective function for optimal solution values ensures the results are robust. The heat map visualizes the variations in the objective function’s value due to these perturbations, showing a consistent range without significant deviations from the optimal value of 0.147. This indicates that the optimization strategy is not highly sensitive to small changes in the values of the strategies, affirming the correctness and stability of the results.
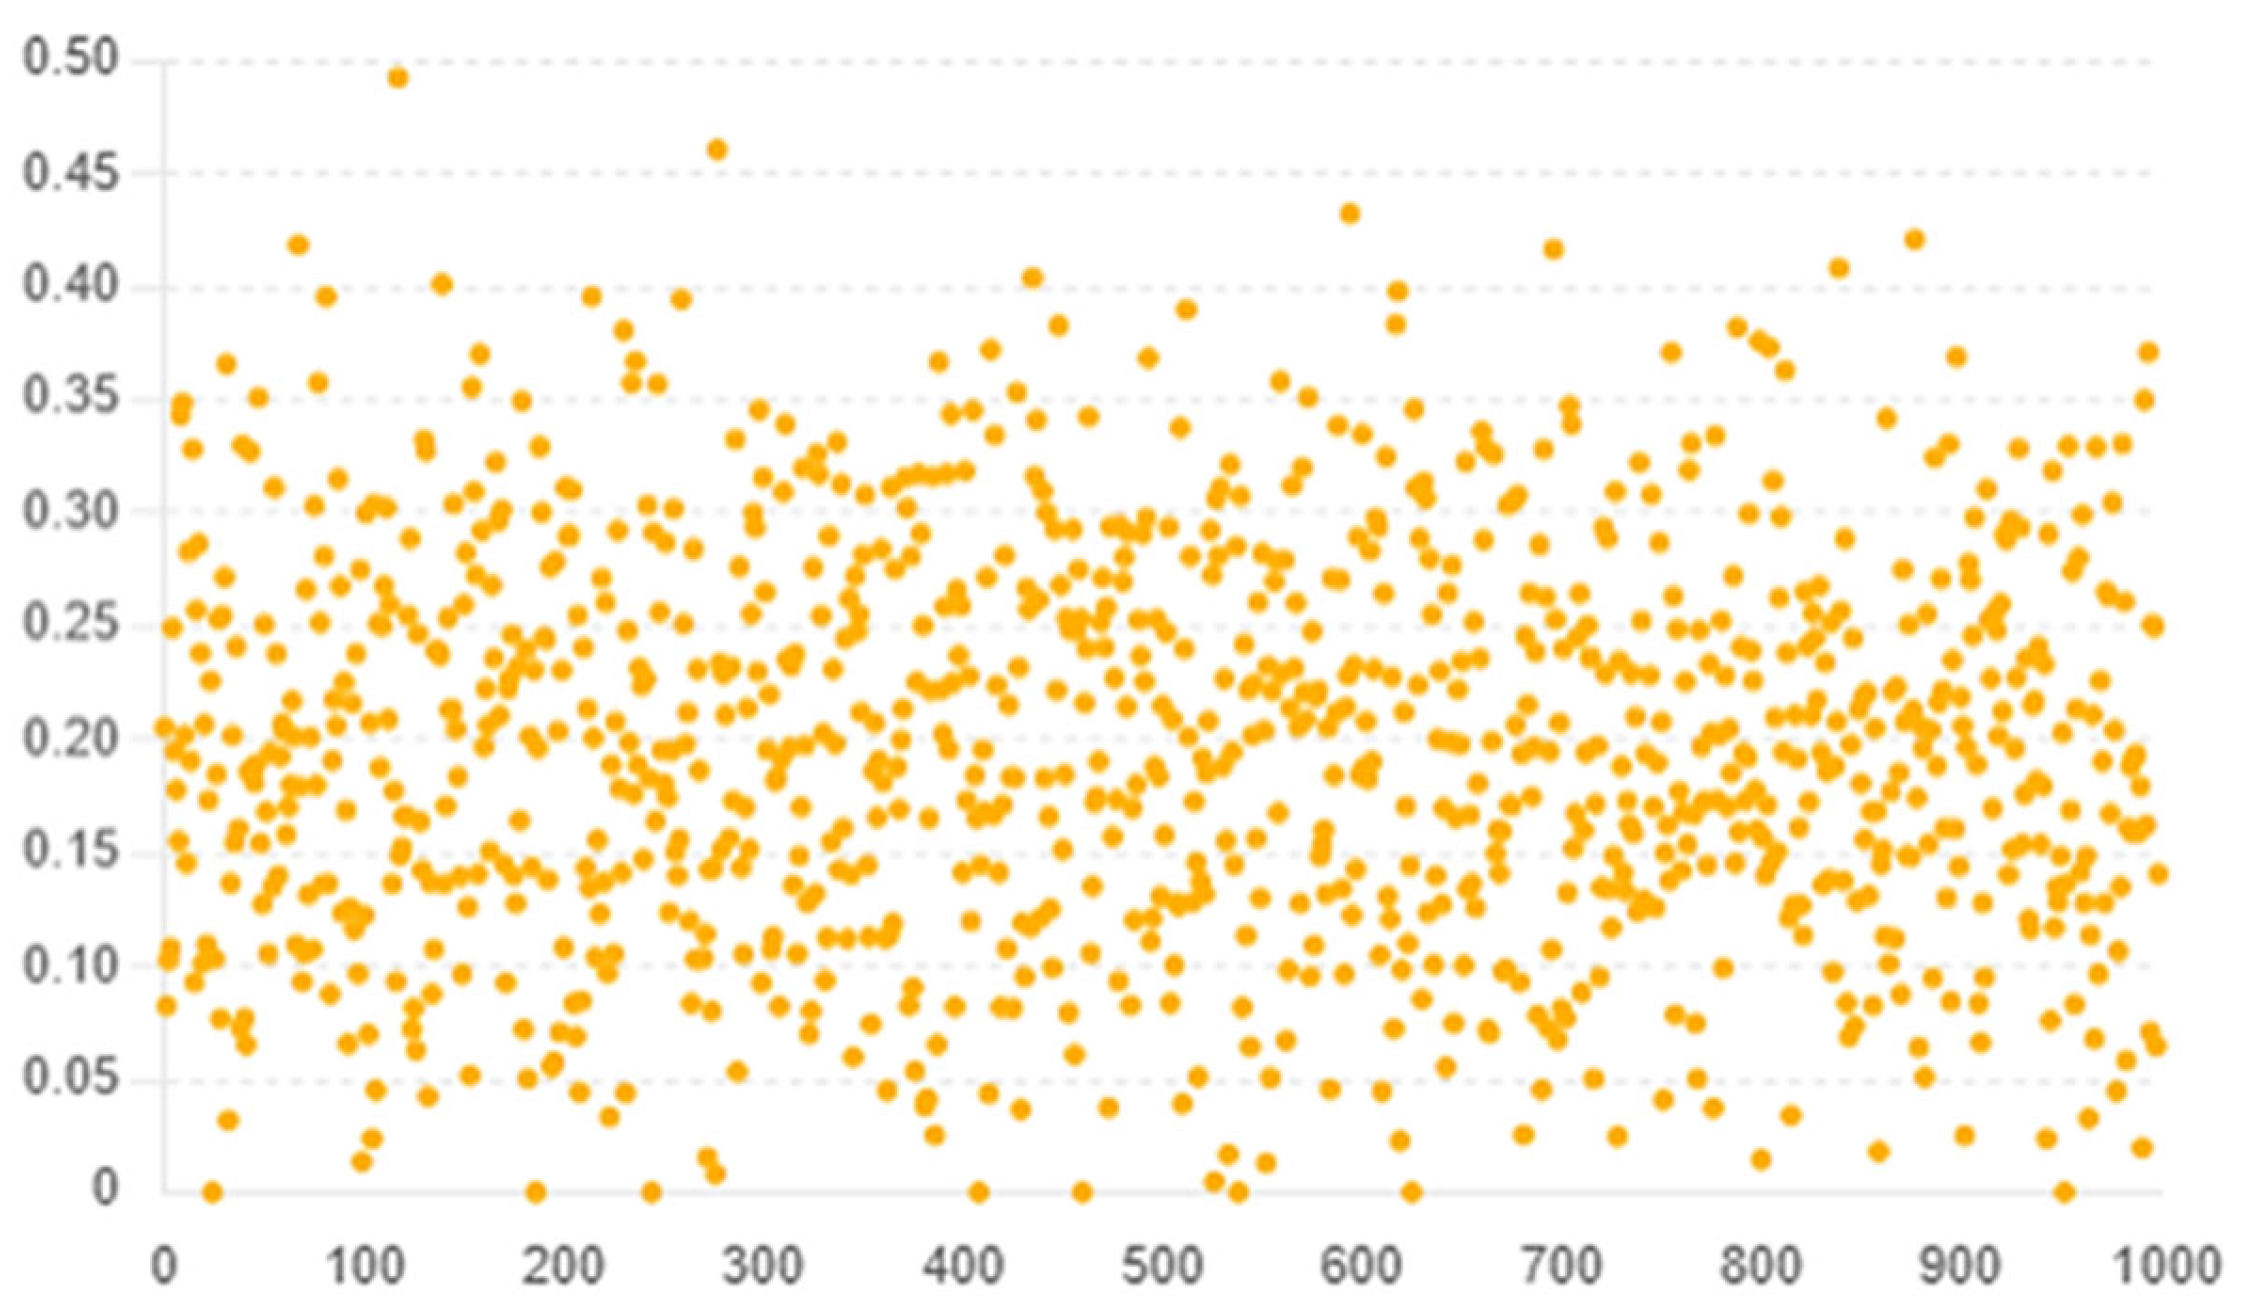
According to Figure 6 and Figure 7, the majority of the resulting values cluster around the optimal value line, indicating that small perturbations in the strategies (S2: Green Infrastructure Integration and S4: Smart Technology Integration) do not significantly deviate the objective function from its optimal value. This suggests that the chosen optimal strategies are robust and reliable. While there are some resulting values above and below the optimal value, they are relatively close, mostly within the range of 0.1 to 0.3. This further reinforces the stability of the optimal solution. Given the scatter plot, it can be inferred that Green Infrastructure Integration and Smart Technology Integration as part of the smart city street design will yield consistent and reliable results. Even if there are slight changes or uncertainties in their implementation, the overall performance (objective function value) remains stable.
The scatter plot also highlights that there are a few outliers where the resulting value deviates more significantly from the optimal value. These outliers can be investigated to understand specific conditions or variations that might cause a decrease in the performance. Addressing these could further enhance the robustness of the smart city street design.

5. Conclusions and Discussion

Designing streets for cyclists and self-driving vehicles in today’s world is a vital and unavoidable urban necessity. With the increase in population and urban traffic, the need for transportation systems that can guarantee, safety, efficiency, and environmental sustainability is becoming increasingly evident. One of the main reasons for this demand is the increasing use of bicycles and the imminent need for the integration of autonomous vehicles. As a clean and economical vehicle, bicycles play an important role in reducing air pollution and traffic. On the other hand, by using advanced technologies, self-driving vehicles have the ability to reduce accidents, improve traffic flow, and increase transportation efficiency. Designing streets that can simultaneously meet the needs of cyclists and self-driving vehicles can help improve the quality of urban life. This type of design not only provides greater safety and comfort for cyclists, but also allows self-driving vehicles to move through cities with higher efficiency and fewer accidents. The harmonization of urban transport to accommodate both bicyclists and AVs presents a transformative opportunity to enhance urban mobility, making city streets safer, cleaner and more efficient environments.
Our research employed a comprehensive methodology, combining Multi-Criteria Decision Making and Game theory, to systematically identify and address the primary challenges to this integration. Through the value-interval FDM, we confirmed the basic factors, which were then weighted and analyzed for cause-and-effect interactions using the interval-fuzzy DANP. Game theory was instrumental in determining the optimal strategies to overcome these factors, in line with the studies by Dabiri et al. [92] and Guo et al. [93], which further support the effectiveness of Game-theory-based approaches in optimizing transportation systems and street design in smart cities.
Our findings highlight safety as the most crucial factor in smart city street design for autonomous vehicles and cyclists. These findings align with other studies published in recent years. For example, in their survey to evaluate the relative importance of potential motivators and deterrents to cycling among current and potential cyclists, Winters et al. [25] reported that safety was the factor that most influenced the likelihood of cycling. Similar results were obtained by Fishman et al. [22], who found that safety was a major concern for all focus group participants, whether they were regular cyclists or not. This was due to a perceived lack of adequate cycling infrastructure, in addition to the negative attitudes of some car drivers described by regular cyclists. Additionally, more recent research by Chen and Liu [85] also highlighted safety as the most critical factor in smart city transportation designs, emphasizing its non-negotiable role in successful implementation. This study also supported the significance of accessibility and sustainability in ensuring inclusive and long-term viable urban solutions. The lower importance assigned to atmospheric environmental conditions also aligns with findings from Zhou et al. [86], who noted that environmental considerations, while essential, are often secondary to more immediate operational concerns in the context of AVs.
To effectively address this and other challenges, the integration of ‘Green Infrastructure’ and ‘Smart Technology’ emerged as the most viable solutions, underscoring the importance of a balanced approach that combines environmental sustainability with technological innovation. The emphasis on ‘Green Infrastructure Integration’ highlights the need to address sustainability, atmospheric environment conditions, and the visual aspect, leading to the incorporation of green elements in streets through permeable pavements, rain gardens, vegetative curb areas, and sidewalk trees [19,38,94]. ‘Smart Technology Integration’, through technologies such as intelligent traffic management systems and smart street lightening or personal beacons [37,44,48], is crucial for enhancing safety, efficiency, and functionality within smart city street designs. Furthermore, Chen et al. [85] and Radakovic et al. [95] explored the integration of smart technologies in shared autonomous vehicle systems, highlighting the efficiency gains and sustainability benefits that parallel the findings related to ‘Smart Technology Integration’.
To strengthen the applicability of this methodology some additional validation steps can be performed. The proposed model could be applied to a real-world urban setting, such as redesigning a street to integrate autonomous vehicles (AVs) and cyclists. Collecting real-world data on safety improvements, traffic flow, and public satisfaction, and then comparing these metrics before and after implementation, could also be very useful. In addition, the impacts of strategies like “smart technology integration” or “green infrastructure” could be tested by using simulations or field experiments. Finally, engaging stakeholders (e.g., urban planners, cyclists, AV manufacturers) to assess the feasibility and practicality of the proposed solutions would be very relevant in real-world urban design challenges.
This research provides valuable guidance for urban planners and decision-makers to identify key design factors and implement strategic policies that not only facilitate the coexistence of cyclists and AVs, making interaction easier and safer, but also contribute to the broader goals of reducing traffic congestion and improving urban mobility. The implementation of these strategies promises to create a more harmonious and efficient urban transport system, ultimately benefiting all road users.

Author Contributions

Conceptualization, M.F.; methodology, M.F.; validation, M.F., G.F. and C.C.; formal analysis, M.F. and G.F.; investigation, M.F., S.N. and E.G.-G.; writing—original draft preparation, M.F.; writing—review and editing, M.F., S.N., E.G.-G. and G.F.; software, M.F.; visualization, M.F. and E.G.-G.; supervision, S.N. and E.G.-G.; project administration, S.N.; funding acquisition, S.N and E.G-G. All authors have read and agreed to the published version of the manuscript.

Funding

This publication is part of the research project entitled “Planning and design recommendations to guide new Autonomous Vehicles in Cities”—AV Cities (2023–2026), under Grant PID2022-140649OB-I00 funded by MCIN/AEI/10.13039/501100011033/FEDER, UE.

Data Availability Statement

The raw data supporting the conclusions of this articles will be made available by the authors on request.

Conflicts of Interest

The authors declare no conflicts of interest.

Nomenclature

AVsAutonomous vehicles
AHPAnalytical Hierarchical Process
ANPAnalytic Network Process
CAVsConnected and autonomous vehicles
DANPDecision-Making Trial and Evaluation Laboratory ANP
DEMATELDecision-Making Trial and Evaluation Laboratory
FDMFuzzy Delphi method
HVsHuman-driven vehicles
IVFEInterval-Fuzzy Element
MCDMMulti-Criteria Decision Making

References

  1. Larsen, J. The Making of a Pro-Cycling City: Social Practices and Bicycle Mobilities. Environ. Plan. A Econ. Space 2017, 49, 876–892. [Google Scholar] [CrossRef]
  2. Liu, S.; Shen, Z.-J.M.; Ji, X. Urban Bike Lane Planning with Bike Trajectories: Models, Algorithms, and a Real-World Case Study. Manuf. Serv. Oper. Manag. 2022, 24, 2500–2515. [Google Scholar] [CrossRef]
  3. Ferretto, L.; Bruzzone, F.; Nocera, S. Pathways to Active Mobility Planning. Res. Transp. Econ. 2021, 86, 101027. [Google Scholar] [CrossRef]
  4. Khreis, H.; May, A.D.; Nieuwenhuijsen, M.J. Health Impacts of Urban Transport Policy Measures: A Guidance Note for Practice. J. Transp. Health 2017, 6, 209–227. [Google Scholar] [CrossRef]
  5. Rojas-Rueda, D.; Nieuwenhuijsen, M.J.; Khreis, H.; Frumkin, H. Autonomous Vehicles and Public Health. Annu. Rev. Public Health 2020, 41, 329–345. [Google Scholar] [CrossRef]
  6. Freudendal-Pedersen, M. Cyclists as Part of the City’s Organism: Structural Stories on Cycling in Copenhagen. City Soc. 2015, 27, 30–50. [Google Scholar] [CrossRef]
  7. Freemark, Y.; Hudson, A.; Zhao, J. Are Cities Prepared for Autonomous Vehicles? J. Am. Plan. Assoc. 2019, 85, 133–151. [Google Scholar] [CrossRef]
  8. Khayyam, H.; Javadi, B.; Jalili, M.; Jazar, R.N. Artificial Intelligence and Internet of Things for Autonomous Vehicles. In Nonlinear Approaches in Engineering Applications; Springer International Publishing: Cham, Switzerland, 2020; pp. 39–68. [Google Scholar] [CrossRef]
  9. Yoganandhan, A.; Subhash, S.D.; Hebinson Jothi, J.; Mohanavel, V. Fundamentals and Development of Self-Driving Cars. Mater. Today Proc. 2020, 33, 3303–3310. [Google Scholar] [CrossRef]
  10. Rahman, M.M.; Thill, J.-C. Impacts of Connected and Autonomous Vehicles on Urban Transportation and Environment: A Comprehensive Review. Sustain. Cities Soc. 2023, 96, 104649. [Google Scholar] [CrossRef]
  11. Shafiei, S.; Gu, Z.; Grzybowska, H.; Cai, C. Impact of Self-Parking Autonomous Vehicles on Urban Traffic Congestion. Transportation 2023, 50, 183–203. [Google Scholar] [CrossRef]
  12. Deng, Q.; Sun, H.; Chen, F.; Shu, Y.; Wang, H.; Ha, Y. An Optimized FPGA-Based Real-Time NDT for 3D-LiDAR Localization in Smart Vehicles. IEEE Trans. Circuits Syst. II Express Briefs 2021, 68, 3167–3171. [Google Scholar] [CrossRef]
  13. Terzi, S.; Savvaidis, C.; Votis, K.; Tzovaras, D.; Stamelos, I. Securing Emission Data of Smart Vehicles with Blockchain and Self-Sovereign Identities. In Proceedings of the 2020 IEEE International Conference on Blockchain (Blockchain), Virtual, 2–6 November 2020; IEEE: Piscataway, NJ, USA, 2020; pp. 462–469. [Google Scholar] [CrossRef]
  14. Chougule, A.; Chamola, V.; Sam, A.; Yu, F.R.; Sikdar, B. A Comprehensive Review on Limitations of Autonomous Driving and Its Impact on Accidents and Collisions. IEEE Open J. Veh. Technol. 2024, 5, 142–161. [Google Scholar] [CrossRef]
  15. Nascimento, A.M.; Vismari, L.F.; Molina, C.B.S.T.; Cugnasca, P.S.; Camargo, J.B.; de Almeida, J.R.; Inam, R.; Fersman, E.; Marquezini, M.V.; Hata, A.Y. A Systematic Literature Review About the Impact of Artificial Intelligence on Autonomous Vehicle Safety. IEEE Trans. Intell. Transp. Syst. 2020, 21, 4928–4946. [Google Scholar] [CrossRef]
  16. Pyrialakou, V.D.; Gkartzonikas, C.; Gatlin, J.D.; Gkritza, K. Perceptions of Safety on a Shared Road: Driving, Cycling, or Walking near an Autonomous Vehicle. J. Saf. Res. 2020, 72, 249–258. [Google Scholar] [CrossRef]
  17. Duarte, F.; Ratti, C. The Impact of Autonomous Vehicles on Cities: A Review. J. Urban Technol. 2018, 25, 3–18. [Google Scholar] [CrossRef]
  18. Barnett, J.; Gizinski, N.; Mondragon-Parra, E.; Siegel, J.; Morris, D.; Gates, T.; Kassens-Noor, E.; Savolainen, P. Automated Vehicles Sharing the Road: Surveying Detection and Localization of Pedalcyclists. IEEE Trans. Intell. Veh. 2021, 6, 649–664. [Google Scholar] [CrossRef]
  19. Wang, Y.; Chau, C.K.; Ng, W.Y.; Leung, T.M. A Review on the Effects of Physical Built Environment Attributes on Enhancing Walking and Cycling Activity Levels within Residential Neighborhoods. Cities 2016, 50, 1–15. [Google Scholar] [CrossRef]
  20. Hull, A.; O’Holleran, C. Bicycle Infrastructure: Can Good Design Encourage Cycling? Urban Plan. Transp. Res. 2014, 2, 369–406. [Google Scholar] [CrossRef]
  21. Lee, C.; Moudon, A.V. Neighbourhood Design and Physical Activity. Build. Res. Inf. 2008, 36, 395–411. [Google Scholar] [CrossRef]
  22. Fishman, E.; Washington, S.; Haworth, N. Barriers and Facilitators to Public Bicycle Scheme Use: A Qualitative Approach. Transp. Res. Part F Traffic Psychol. Behav. 2012, 15, 686–698. [Google Scholar] [CrossRef]
  23. Lee, C.; Moudon, A.V. Physical Activity and Environment Research in the Health Field: Implications for Urban and Transportation Planning Practice and Research. J. Plan. Lit. 2004, 19, 147–181. [Google Scholar] [CrossRef]
  24. Fraser, S.D.S.; Lock, K. Cycling for Transport and Public Health: A Systematic Review of the Effect of the Environment on Cycling. Eur. J. Public Health 2011, 21, 738–743. [Google Scholar] [CrossRef]
  25. Winters, M.; Davidson, G.; Kao, D.; Teschke, K. Motivators and Deterrents of Bicycling: Comparing Influences on Decisions to Ride. Transportation 2011, 38, 153–168. [Google Scholar] [CrossRef]
  26. Garrard, J.H.S.D.J. Women and Cycling. In City Cycling; Pucher, J., Buehler, R., Eds.; The MIT Press: Cambridge, MA, USA, 2012; pp. 211–233. [Google Scholar]
  27. Parkin, J.; Wardman, M.; Page, M. Models of Perceived Cycling Risk and Route Acceptability. Accid. Anal. Prev. 2007, 39, 364–371. [Google Scholar] [CrossRef] [PubMed]
  28. Li, Z.; Wang, W.; Liu, P.; Ragland, D.R. Physical Environments Influencing Bicyclists’ Perception of Comfort on Separated and on-Street Bicycle Facilities. Transp. Res. D Transp. Environ. 2012, 17, 256–261. [Google Scholar] [CrossRef]
  29. Clayton, W.; Parkin, J.; Billington, C. Cycling and Disability: A Call for Further Research. J. Transp. Health 2017, 6, 452–462. [Google Scholar] [CrossRef]
  30. Clayton, W.; Musselwhite, C. Exploring Changes to Cycle Infrastructure to Improve the Experience of Cycling for Families. J. Transp. Geogr. 2013, 33, 54–61. [Google Scholar] [CrossRef]
  31. Krizek, K.J.; Roland, R.W. What Is at the End of the Road? Understanding Discontinuities of on-Street Bicycle Lanes in Urban Settings. Transp. Res. D Transp. Environ. 2005, 10, 55–68. [Google Scholar] [CrossRef]
  32. Daniels, S.; Brijs, T.; Nuyts, E.; Wets, G. Injury Crashes with Bicyclists at Roundabouts: Influence of Some Location Characteristics and the Design of Cycle Facilities. J. Saf. Res. 2009, 40, 141–148. [Google Scholar] [CrossRef] [PubMed]
  33. Wang, K.; Akar, G. Street Intersection Characteristics and Their Impacts on Perceived Bicycling Safety. Transp. Res. Rec. J. Transp. Res. Board 2018, 2672, 41–54. [Google Scholar] [CrossRef]
  34. Parkin, J.; Clark, B.; Clayton, W.; Ricci, M.; Parkhurst, G. Understanding Interactions Between Autonomous Vehicles and Other Road Users: A Literature Review; UWE Bristol Research Repository: Bristol, UK, 2016. [Google Scholar]
  35. Wood, J.M. Nighttime Driving: Visual, Lighting and Visibility Challenges. Ophthalmic Physiol. Opt. 2020, 40, 187–201. [Google Scholar] [CrossRef] [PubMed]
  36. Wood, J.M.; Lacherez, P.F.; Marszalek, R.P.; King, M.J. Drivers’ and Cyclists’ Experiences of Sharing the Road: Incidents, Attitudes and Perceptions of Visibility. Accid. Anal. Prev. 2009, 41, 772–776. [Google Scholar] [CrossRef] [PubMed]
  37. Gagliardi, G.; Lupia, M.; Cario, G.; Tedesco, F.; Cicchello Gaccio, F.; Lo Scudo, F.; Casavola, A. Advanced Adaptive Street Lighting Systems for Smart Cities. Smart Cities 2020, 3, 1495–1512. [Google Scholar] [CrossRef]
  38. Li, H.; Harvey, J.T.; Holland, T.J.; Kayhanian, M. The Use of Reflective and Permeable Pavements as a Potential Practice for Heat Island Mitigation and Stormwater Management. Environ. Res. Lett. 2013, 8, 015023. [Google Scholar] [CrossRef]
  39. Titze, S.; Stronegger, W.J.; Janschitz, S.; Oja, P. Association of Built-Environment, Social-Environment and Personal Factors with Bicycling as a Mode of Transportation among Austrian City Dwellers. Prev. Med. 2008, 47, 252–259. [Google Scholar] [CrossRef]
  40. Rodríguez, D.A.; Joo, J. The Relationship between Non-Motorized Mode Choice and the Local Physical Environment. Transp. Res. D Transp. Environ. 2004, 9, 151–173. [Google Scholar] [CrossRef]
  41. Helbich, M.; Böcker, L.; Dijst, M. Geographic Heterogeneity in Cycling under Various Weather Conditions: Evidence from Greater Rotterdam. J. Transp. Geogr. 2014, 38, 38–47. [Google Scholar] [CrossRef]
  42. Blau, M.; Akar, G.; Nasar, J. Driverless Vehicles’ Potential Influence on Bicyclist Facility Preferences. Int. J. Sustain. Transp. 2018, 12, 665–674. [Google Scholar] [CrossRef]
  43. Eichholz, L.; Mellinger, N.; Manz, W. Urban Cycling and Automated Vehicles (Rad-Auto-Nom Project). In Proceedings of the 28th Annual European Real Estate Society Conference, Milan, Italy, 22–25 June 2022; European Real Estate Society: Amsterdam, The Netherlands, 2021. [Google Scholar] [CrossRef]
  44. Berge, S.H.; Hagenzieker, M.; Farah, H.; de Winter, J. Do Cyclists Need HMIs in Future Automated Traffic? An Interview Study. Transp. Res. Part F Traffic Psychol. Behav. 2022, 84, 33–52. [Google Scholar] [CrossRef]
  45. Elliott, D.; Keen, W.; Miao, L. Recent Advances in Connected and Automated Vehicles. J. Traffic Transp. Eng. (Engl. Ed.) 2019, 6, 109–131. [Google Scholar] [CrossRef]
  46. Hagenzieker, M.P.; van der Kint, S.; Vissers, L.; van Schagen, I.N.L.G.; de Bruin, J.; van Gent, P.; Commandeur, J.J.F. Interactions between Cyclists and Automated Vehicles: Results of a Photo Experiment *. J. Transp. Saf. Secur. 2020, 12, 94–115. [Google Scholar] [CrossRef]
  47. Vlakveld, W.; van der Kint, S.; Hagenzieker, M.P. Cyclists’ Intentions to Yield for Automated Cars at Intersections When They Have Right of Way: Results of an Experiment Using High-Quality Video Animations. Transp. Res. Part F Traffic Psychol. Behav. 2020, 71, 288–307. [Google Scholar] [CrossRef]
  48. Hou, M.; Mahadevan, K.; Somanath, S.; Sharlin, E.; Oehlberg, L. Autonomous Vehicle-Cyclist Interaction: Peril and Promise. In Proceedings of the 2020 CHI Conference on Human Factors in Computing Systems, Honolulu, HI, USA, 25–30 April 2020; ACM: New York, NY, USA, 2020; pp. 1–12. [Google Scholar] [CrossRef]
  49. Gwak, J.; Jung, J.; Oh, R.; Park, M.; Rakhimov, M.A.K.; Ahn, J. A Review of Intelligent Self-Driving Vehicle Software Research. KSII Trans. Internet Inf. Syst. 2019, 13, 5299–5320. [Google Scholar] [CrossRef]
  50. Carrese, S.; Nigro, M.; Patella, S.M.; Toniolo, E. A Preliminary Study of the Potential Impact of Autonomous Vehicles on Residential Location in Rome. Res. Transp. Econ. 2019, 75, 55–61. [Google Scholar] [CrossRef]
  51. Ngwu, O.L.; Rimu, A.; Deb, S. How to Design Traffic Infrastructure to Support Cyclists’ Interaction with Autonomous Vehicles: Teenage Cyclists’ Perceptions. Hum. Factors Syst. Interact. 2022, 52. [Google Scholar] [CrossRef]
  52. Botello, B.; Buehler, R.; Hankey, S.; Mondschein, A.; Jiang, Z. Planning for Walking and Cycling in an Autonomous-Vehicle Future. Transp. Res. Interdiscip. Perspect. 2019, 1, 100012. [Google Scholar] [CrossRef]
  53. Soteropoulos, A.; Berger, M.; Mitteregger, M. Compatibility of Automated Vehicles in Street Spaces: Considerations for a Sustainable Implementation. Sustainability 2021, 13, 2732. [Google Scholar] [CrossRef]
  54. Alves, G.V.; Schwammberger, M. Towards a Digital Highway Code Using Formal Modelling and Verification of Timed Automata. Electron. Proc. Theor. Comput. Sci. 2022, 371, 77–85. [Google Scholar] [CrossRef]
  55. Seilabi, S.E.; Pourgholamali, M.; Homem de Almeida Correia, G.; Labi, S. Robust Design of CAV-Dedicated Lanes Considering CAV Demand Uncertainty and Lane Reallocation Policy. Transp. Res. D Transp. Environ. 2023, 121, 103827. [Google Scholar] [CrossRef]
  56. Park, C.; Sohn, S.Y. An Optimization Approach for the Placement of Bicycle-Sharing Stations to Reduce Short Car Trips: An Application to the City of Seoul. Transp. Res. Part A Policy Pract. 2017, 105, 154–166. [Google Scholar] [CrossRef]
  57. Shunmuga Perumal, P.; Wang, Y.; Sujasree, M.; Tulshain, S.; Bhutani, S.; Suriyah, M.K.; Kumar Raju, V.U. LaneScanNET: A Deep-Learning Approach for Simultaneous Detection of Obstacle-Lane States for Autonomous Driving Systems. Expert. Syst. Appl. 2023, 233, 120970. [Google Scholar] [CrossRef]
  58. Roy, K.; Hoang, N.H.; Vu, H.L. Modeling Autonomous Vehicles Deployment in a Multilane AV Zone With Mixed Traffic. IEEE Trans. Intell. Transp. Syst. 2022, 23, 23708–23720. [Google Scholar] [CrossRef]
  59. Wang, S.; Li, Z.; Wang, Y.; Zhao, W.; Liu, T. Evidence of Automated Vehicle Safety’s Influence on People’s Acceptance of the Automated Driving Technology. Accid. Anal. Prev. 2024, 195, 107381. [Google Scholar] [CrossRef] [PubMed]
  60. Sahoo, S.K.; Goswami, S.S. A Comprehensive Review of Multiple Criteria Decision-Making (MCDM) Methods: Advancements, Applications, and Future Directions. Decis. Mak. Adv. 2023, 1, 25–48. [Google Scholar] [CrossRef]
  61. Rejeb, A.; Rejeb, K.; Keogh, J.G.; Zailani, S. Barriers to Blockchain Adoption in the Circular Economy: A Fuzzy Delphi and Best-Worst Approach. Sustainability 2022, 14, 3611. [Google Scholar] [CrossRef]
  62. Liu, M.; Wan, Y.; Lewis, F.L.; Nageshrao, S.; Filev, D. A Three-Level Game-Theoretic Decision-Making Framework for Autonomous Vehicles. IEEE Trans. Intell. Transp. Syst. 2022, 23, 20298–20308. [Google Scholar] [CrossRef]
  63. Liu, H.; Yang, M.; Guan, C.; Chen, Y.S.; Keith, M.; You, M.; Menendez, M. Urban Infrastructure Design Principles for Connected and Autonomous Vehicles: A Case Study of Oxford, UK. Comput. Urban Sci. 2023, 3, 34. [Google Scholar] [CrossRef]
  64. Kiciński, M.; Solecka, K. Application of MCDA/MCDM Methods for an Integrated Urban Public Transportation System—Case Study, City of Cracow. Arch. Transp. 2018, 46, 71–84. [Google Scholar] [CrossRef]
  65. Ashofteh, P.-S.; Far, S.M.; Golfam, P. Application of Multi-Criteria Decision-Making of CODAS and SWARA in Reservoir Optimal Operation Using Marine Predator Algorithm Based on Game Theory. Water Resour. Manag. 2023, 37, 4385–4412. [Google Scholar] [CrossRef]
  66. Collins, B.C.; Kumral, M. Examining Impact and Benefit Agreements in Mineral Extraction Using Game Theory and Multiple-Criteria Decision Making. Extr. Ind. Soc. 2022, 10, 101094. [Google Scholar] [CrossRef]
  67. Punetha, N.; Jain, G. Game Theory and MCDM-Based Unsupervised Sentiment Analysis of Restaurant Reviews. Appl. Intell. 2023, 53, 20152–20173. [Google Scholar] [CrossRef] [PubMed]
  68. Kaviari, F.; Mesgari, M.S.; Seidi, E.; Motieyan, H. Simulation of Urban Growth Using Agent-Based Modeling and Game Theory with Different Temporal Resolutions. Cities 2019, 95, 102387. [Google Scholar] [CrossRef]
  69. Ibrahim, M.A.R.; Jaini, N.I.; Khalif, K.M.N.K. A Comprehensive Review of Hybrid Game Theory Techniques and Multi-Criteria Decision-Making Methods. J. Phys. Conf. Ser. 2021, 1988, 012056. [Google Scholar] [CrossRef]
  70. Cortés-Berrueco, L.E.; Gershenson, C.; Stephens, C.R. Traffic Games: Modeling Freeway Traffic with Game Theory. PLoS ONE 2016, 11, e0165381. [Google Scholar] [CrossRef]
  71. Zhu, L.; Yang, D.; Cheng, Z.; Yu, X.; Zheng, B. A Model to Manage the Lane-Changing Conflict for Automated Vehicles Based on Game Theory. Sustainability 2023, 15, 3063. [Google Scholar] [CrossRef]
  72. Chellappa, V.; Ginda, G. Application of Multiple-Criteria Decision Making Methods for Construction Safety Research. Proc. Inst. Civ. Eng.-Manag. Procure. Law 2024, 177, 127–136. [Google Scholar] [CrossRef]
  73. Alimohammadlou, M.; Alinejad, S. Challenges of Blockchain Implementation in SMEs’ Supply Chains: An Integrated IT2F-BWM and IT2F-DEMATEL Method. Electron. Commer. Res. 2023. [Google Scholar] [CrossRef]
  74. Mubarik, M.S.; Kazmi, S.H.A.; Zaman, S.I. Application of Gray DEMATEL-ANP in Green-Strategic Sourcing. Technol. Soc. 2021, 64, 101524. [Google Scholar] [CrossRef]
  75. Wu, H.; Zhong, W.; Zhong, B.; Li, H.; Guo, J.; Mehmood, I. Barrier Identification, Analysis and Solutions of Blockchain Adoption in Construction: A Fuzzy DEMATEL and TOE Integrated Method. Eng. Constr. Archit. Manag. 2023. [Google Scholar] [CrossRef]
  76. Li, Y.; Zhao, G.; Wu, P.; Qiu, J. An Integrated Gray DEMATEL and ANP Method for Evaluating the Green Mining Performance of Underground Gold Mines. Sustainability 2022, 14, 6812. [Google Scholar] [CrossRef]
  77. Liu, T.; Deng, Y.; Chan, F. Evidential Supplier Selection Based on DEMATEL and Game Theory. Int. J. Fuzzy Syst. 2018, 20, 1321–1333. [Google Scholar] [CrossRef]
  78. Nematkhah, F.; Raissi, S.; Ghezavati, V. An Integrated Fuzzy DEMATEL-Fuzzy ANP Approach to Nominate Diagnostic Method and Measuring Total Predictive Performance Score. Saf. Reliab. 2017, 37, 48–72. [Google Scholar] [CrossRef]
  79. Chatterjee, K.; Kar, S. Multi-Criteria Analysis of Supply Chain Risk Management Using Interval Valued Fuzzy TOPSIS. OPSEARCH 2016, 53, 474–499. [Google Scholar] [CrossRef]
  80. Mohammadzadeh, A.; Sabzalian, M.H.; Zhang, C.; Castillo, O.; Sakthivel, R.; El-Sousy, F.F.M. Training Interval Type-2 Fuzzy Systems Based on Error Backpropagation. In Modern Adaptive Fuzzy Control Systems; Springer: Cham, Switerland, 2023; pp. 49–93. [Google Scholar] [CrossRef]
  81. Chaqooshi, A.F.; Rajabani, N.; Khalili Esbuei, S.; Hakimi, N. Identifying and Ranking Appropriate Resilience Supply Chain Strategies, Hybrid Approach of Game Theory and Fuzzy MCDM. J. Ind. Manag. Perspect. 2019, 9, 9–31. [Google Scholar] [CrossRef]
  82. Zhou, X.; Hu, Y.; Deng, Y.; Chan, F.T.S.; Ishizaka, A. A DEMATEL-Based Completion Method for Incomplete Pairwise Comparison Matrix in AHP. Ann. Oper. Res. 2018, 271, 1045–1066. [Google Scholar] [CrossRef]
  83. Debnath, A.; Bandyopadhyay, A.; Roy, J.; Kar, S. Game Theory Based Multi Criteria Decision Making Problem under Uncertainty: A Case Study on Indian Tea Industry. J. Bus. Econ. Manag. 2018, 19, 154–175. [Google Scholar] [CrossRef]
  84. Almutairi, K.; Hosseini Dehshiri, S.J.; Hosseini Dehshiri, S.S.; Mostafaeipour, A.; Hoa, A.X.; Techato, K. Determination of optimal renewable energy growth strategies using SWOT analysis, hybrid MCDM methods, and game theory: A case study. Int. J. Energy Res. 2022, 46, 6766–6789. [Google Scholar] [CrossRef]
  85. Chen, Y.; Liu, Y. Integrated Optimization of Planning and Operations for Shared Autonomous Electric Vehicle Systems. Transp. Sci. 2023, 57, 106–134. [Google Scholar] [CrossRef]
  86. Zhou, P.; Wang, C.; Yang, Y. Design and Optimization of Solar-Powered Shared Electric Autonomous Vehicle System for Smart Cities. IEEE Trans. Mob. Comput. 2023, 22, 2053–2068. [Google Scholar] [CrossRef]
  87. Othman, K. Impact of Autonomous Vehicles on the Physical Infrastructure: Changes and Challenges. Designs 2021, 5, 40. [Google Scholar] [CrossRef]
  88. Rana, M.M.; Hossain, K. Connected and Autonomous Vehicles and Infrastructures: A Literature Review. Int. J. Pavement Res. Technol. 2023, 16, 264–284. [Google Scholar] [CrossRef]
  89. Vo, H.V.; Chae, B.; Olson, D.L. Dynamic MCDM: The Case of Urban Infrastructure Decision Making. Int. J. Inf. Technol. Decis. Mak. 2002, 1, 269–292. [Google Scholar] [CrossRef]
  90. Elassy, M.; Al-Hattab, M.; Takruri, M.; Badawi, S. Intelligent Transportation Systems for Sustainable Smart Cities. Transp. Eng. 2024, 16, 100252. [Google Scholar] [CrossRef]
  91. Liu, J.; Zhao, H.; Ogata, Y. Game Based Multi-Agent Equilibrium in Intelligent City Transportation System Design. DEStech Trans. Comput. Sci. Eng. 2018, 1–5. [Google Scholar] [CrossRef]
  92. Dabiri, A.; Hegyi, A.; Hoogendoorn, S. Optimized Speed Trajectories for Cyclists, Based on Personal Preferences and Traffic Light Information-A Stochastic Dynamic Programming Approach. IEEE Trans. Intell. Transp. Syst. 2022, 23, 777–793. [Google Scholar] [CrossRef]
  93. Guo, Z.; Sun, D.; Zhou, L. Game Algorithm of Intelligent Driving Vehicle Based on Left-Turn Scene of Crossroad Traffic Flow. Comput. Intell. Neurosci. 2022, 2022, 9318475. [Google Scholar] [CrossRef]
  94. Schlossberg, M.; Riggs, W.; Adam Millard-Ball, L.A.; Shay, E. Rethinking the Street in an Era of Driverless Cars. 2018. Available online: www.urbanismnext.com (accessed on 30 September 2024).
  95. Radakovic, D.; Singh, A.; Varde, A.S.; Lal, P. Enriching Smart Cities by Optimizing Electric Vehicle Ride-Sharing through Game Theory. In Proceedings of the 2022 IEEE 34th International Conference on Tools with Artificial Intelligence (ICTAI), Macao, China, 30 October–2 November 2022; IEEE: Piscataway, NJ, USA, 2022; pp. 755–759. [Google Scholar] [CrossRef]
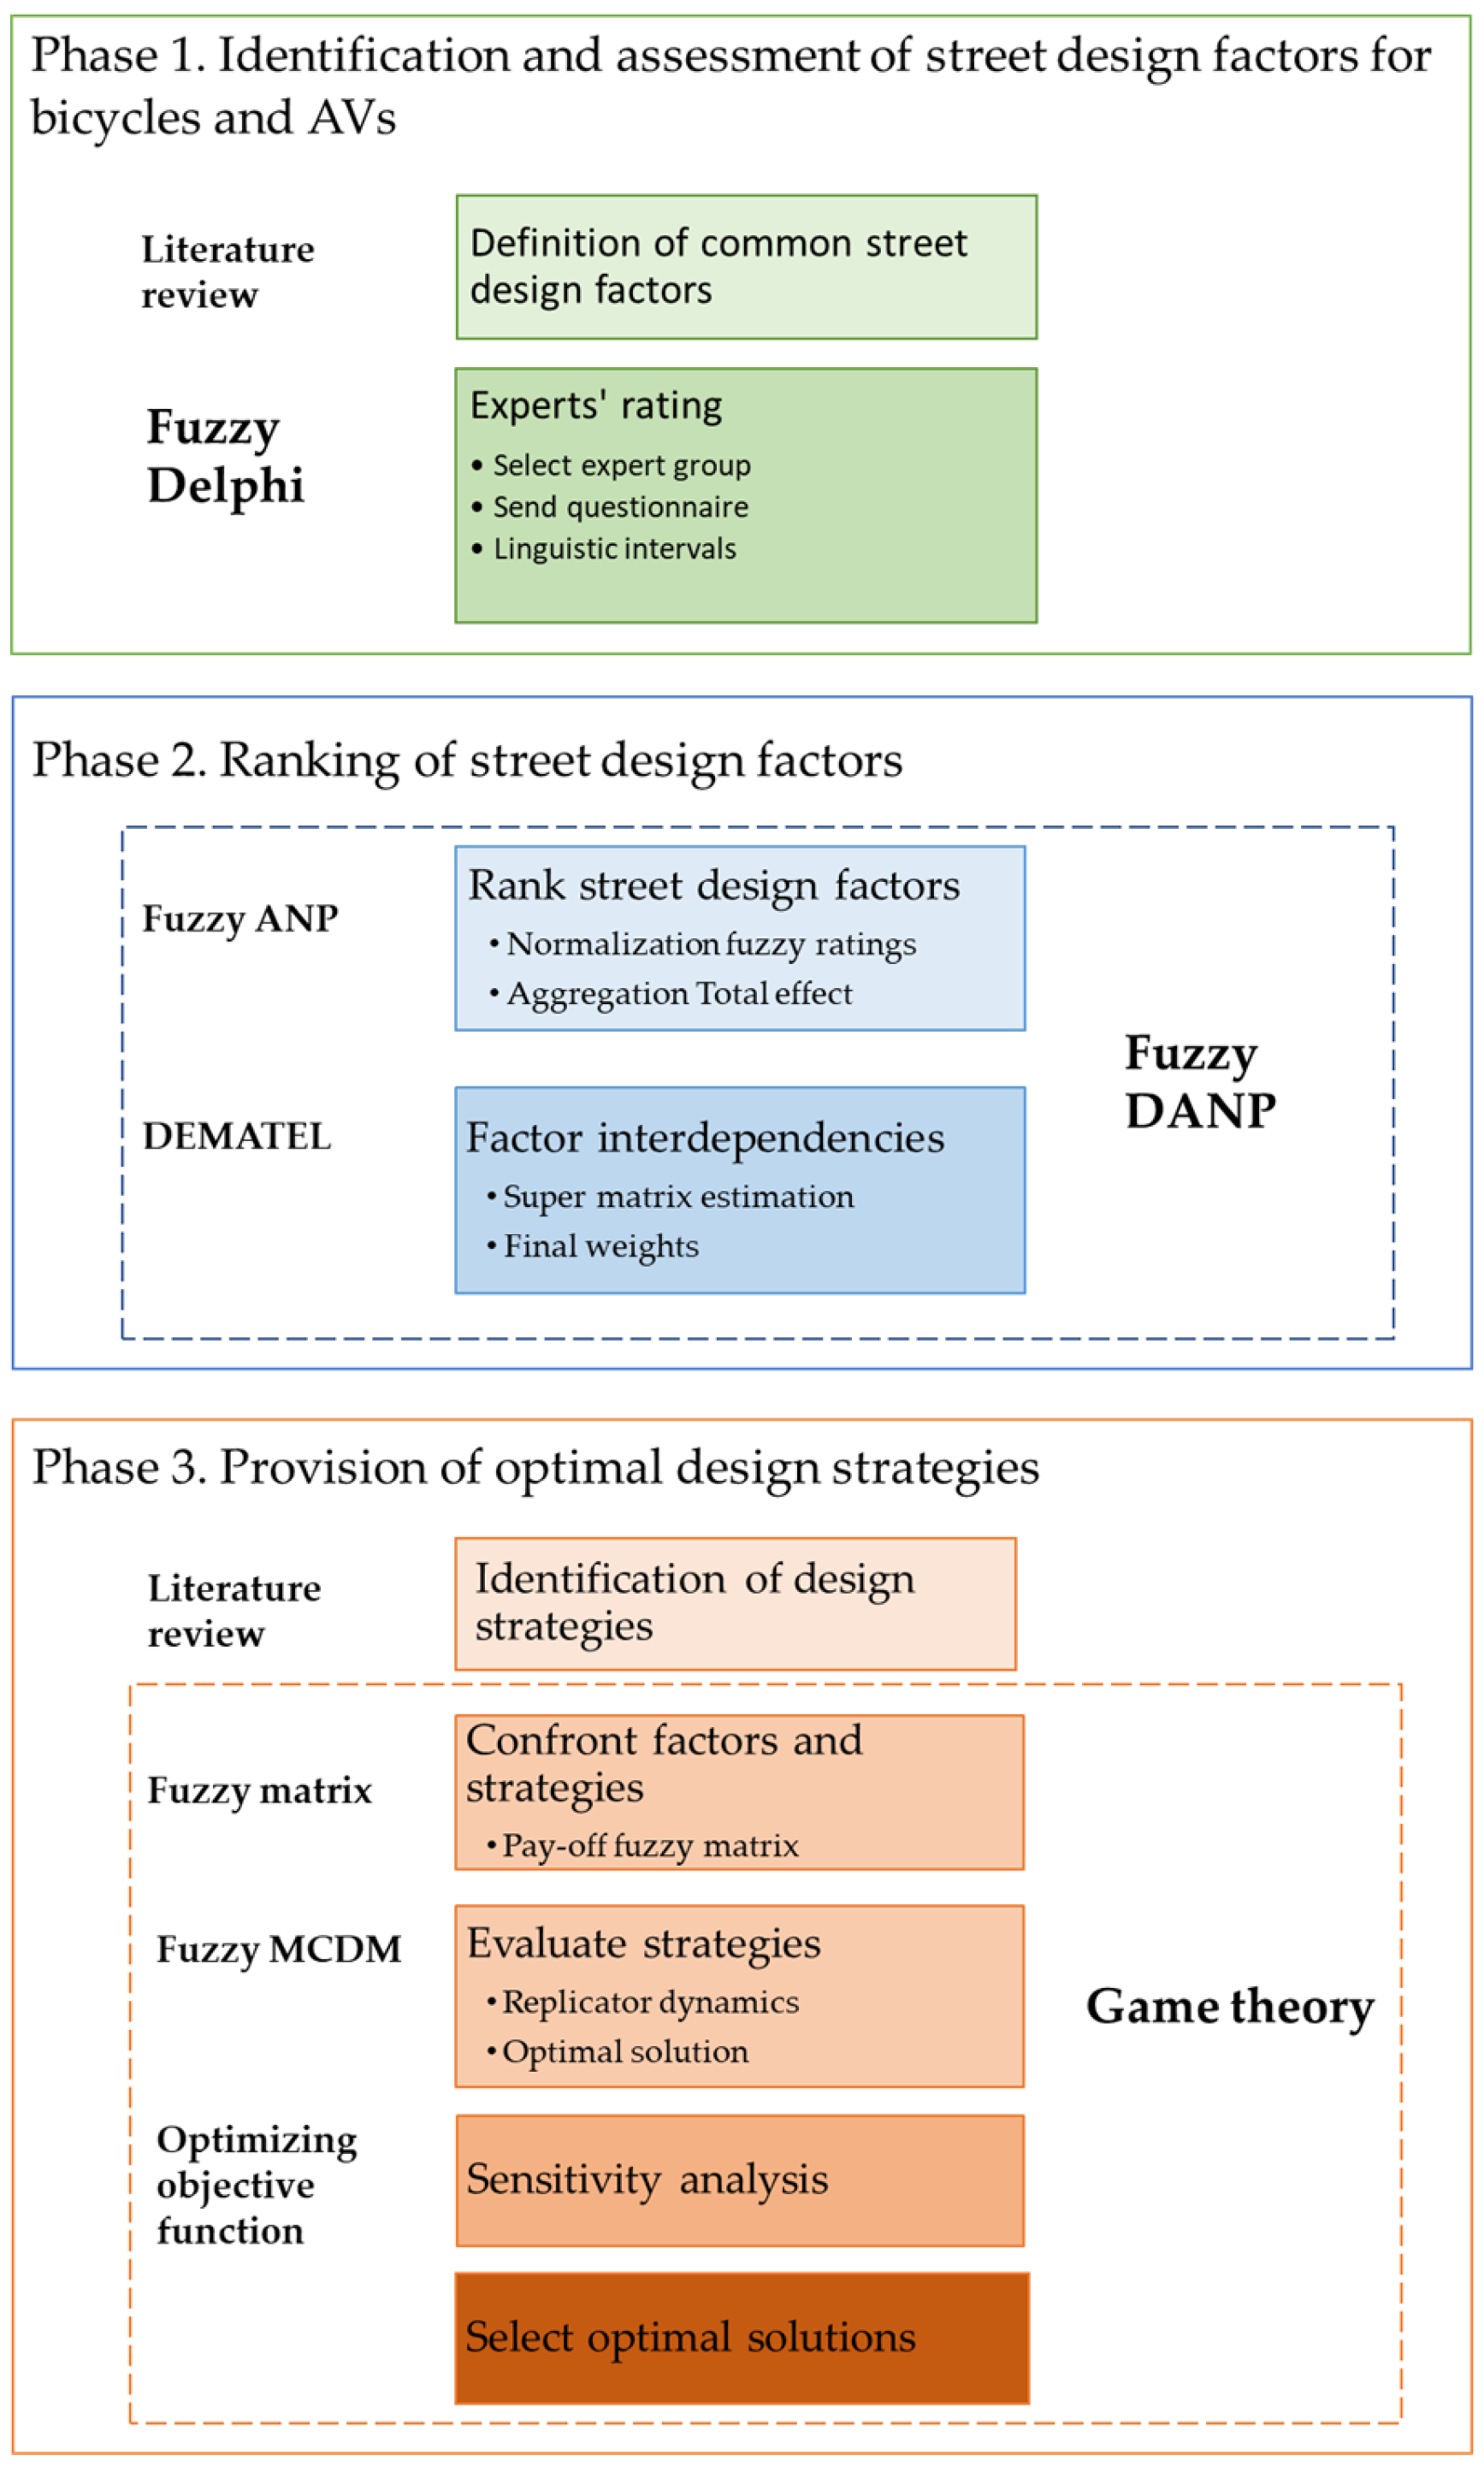
Figure 1. Proposed methodology for street design for bicycle AV interaction.
Smartcities 07 00152 g001
Figure 2. Expert’s Delphi questionnaire.
Smartcities 07 00152 g002
Figure 3. Weights of the street design factors obtained using interval-fuzzy ANP.
Smartcities 07 00152 g003
Figure 4. Cartesian co-ordinate diagram of interval fuzzy DEMATEL output for main factors.
Smartcities 07 00152 g004
Figure 5. Sensitivity analysis with change in objective function z.
Smartcities 07 00152 g005
Figure 6. Sensitivity analysis with change in decision matrix.
Smartcities 07 00152 g006
Figure 7. Sensitivity analysis with change in limitations.
Smartcities 07 00152 g007
Table 1. Interval fuzzy Likert ratings normalized.
Linguistic VariablesVery LowLowMedium LowMediumMedium HighHighVery High
Equivalent interval numbers[0.0–0.15][0.15–0.3][0.3–0.45][0.45–0.6][0.6–0.75][0.75–0.9][0.9–1.0]
Table 2. Pay-off matrix.
Player 2
Strategy 1Strategy 2Strategy n
Player 1Challenge 1(a11, b11)(a12, b12)(a1n, b1n)
Challenge 2(a21, b21)(a22, b22)(a31, b31)
Challenge n(an1, bn1)(an2, bn2)(ann, bnn)
Table 3. Linguistic variables to the fuzzy scale value.
Linguistic Variables *Likert ScaleFuzzy Scale
EH9(7, 9, 9)
VH7(5, 7, 9)
M5(3, 5, 7)
VL3(1, 3, 5)
EL1(1, 1, 3)
* EH (Extremely High), VH (Very High), M (Medium), VL (Very Low), EL (Extremely Low).
Table 4. Final intervals for each street design factor from Delphi technique.
Factors in Smart City Street Design for Autonomous Vehicles and CyclistsCodeInterval AverageScoreResult
StructureC1[2.3, 2.9]0.685Acceptable
SustainabilityC2[2.2, 2.8]0.634 Acceptable
Atmospheric environmental conditionsC3[1.8, 2.6]0.500Acceptable
Visual aspectC4[2.5, 3.3]0.857Acceptable
SafetyC5[2.8, 3.4]0.970Acceptable
SlopeC6[2.3, 2.9]0.685Acceptable
AccessibilityC7[2.5, 3.3]0.857Acceptable
Table 5. The pattern of causal relationships of the main factors.
RDD − RD + R
C1[0.109 0.182][0.109 0.184][−1.387 2.044][0.219 0.366]
C2[0.100 0.169][0.081 0.147][−1.907 −2.249][0.181 0.316]
C3[0.114 0.188][0.095 0.165][−1.907 −2.249][0.209 0.353]
C4[0.114 0.188][0.100 0.171][−1.430 −1.635][0.214 0.359]
C5[0.109 0.182][0.200 0.286][9.062 1.042][0.310 0.468]
C6[0.114 0.188][0.090 0.159][−2.384 −2.862][0.205 0.347]
C7[0.114 0.188][0.100 0.171][−1.430 −1.635][0.214 0.359]
Table 6. The pattern of causal relationships of the main factors.
D − R (Cause)D + R (Effect)
C10.3280.292
C2−2.0780.249
C3−2.0780.281
C4−1.5330.287
C55.0520.389
C6−2.6230.276
C7−1.5330.287
Table 7. The pattern of causal relationships of the main factors and strategies.
Second Player
S1S2S3S4MAX
First PlayerC16 8 7 9 9
C26 8 8 7 8
C35 2 2 3 5
C45 3 5 6 6
C58 8 5 8 8
C65 8 3 8 8
C71 2 2 6 6
MIN1223
Disclaimer/Publisher’s Note: The statements, opinions and data contained in all publications are solely those of the individual author(s) and contributor(s) and not of MDPI and/or the editor(s). MDPI and/or the editor(s) disclaim responsibility for any injury to people or property resulting from any ideas, methods, instructions or products referred to in the content.