Highlights
- In Japan, it was found that older adults and those living alone are willing to walk longer to waste disposal sites.
- To cope with worker scarcity, waste collection can be redesigned by making it more collective or by introducing automation technologies.
- Low-tech solutions may require consensus from residents due to their diverse needs and preferences.
- High-tech solutions may entail significant costs associated with acquiring the new technology, energy supply, and necessary periodical reinvestments, such as energy storage replacements.
Abstract
Due to aging and depopulation, cities in Japan struggle to maintain their municipal waste collection services. These challenges were exacerbated by the pandemic. To overcome these challenges, a prototype of collective and contactless waste collection technology has been developed. However, its acceptance by society is unknown. In this study, we surveyed Japanese people’s preferences regarding household waste disposal. The results showed that older adults (older than 60) are willing to walk longer (more than 2 min) to carry their waste to the disposal site than younger adults. They are also less concerned about the risk of disease infection from touching other people’s garbage than younger respondents (at a 0.24 count ratio). Other significant findings are that people who live alone prefer the temporary disposal site to be placed more than one minute away from their house (at a 0.19 count ratio). People living alone also produce less plastic and packaging waste than larger households. With more Japanese older adults living alone because of the scarcity of older-adult care facilities, we proposed two waste collection strategies that can allow for the implementation of more collective and automatized contactless waste pickup technology. Each design poses different challenges, such as the need for residents’ cooperation and a higher energy supply. However, they also open new opportunities, such as encouraging active aging and using renewable energy.
1. Introduction
Demographic shifts such as population aging and shrinking cities have significant implications for sustainability in rapidly urbanizing contexts [1]. While they pose challenges, they also present opportunities; the growing population of skilled, healthy, and active older adults can engage in sustainability initiatives at the local level, contributing to sustainable development. The rate of demographic aging in Japan is faster and more intense than that in many other countries around the world [2]. In 2021, the Japanese population aged 65 and older reached 30% of its total population [3]. This percentage is much greater than that of the world’s other largest economies, such as the US at 16.8% [4] and China at 18.1% [5]. Strategies that Japan adopts to address issues arising from demographic time bombs could become a reference for other countries [6]. It is projected that, eventually, the world will face a similar aging demographic transition [7,8]. Although an aging demographic has been referred to as a time bomb [6], Ref. [9] saw the positive side of it; the trend of the aging demographic has opened up opportunities to take action to reap the benefits of longevity.
The use of digital technologies in smart cities can support the livelihood of an aging society. Japan’s know-how in developing urban city infrastructures with digital technologies has been obtained not only through its domestic experiences; Japan has also performed a significant number of international urban development projects. Some major active international examples are Vietnam, Thailand, Indonesia, the United States, Central and South America, and Australia [10]. A new term for smart cities was created to distinguish the shift made in the Japanese smart city paradigm: Society 5.0. Fundamentally, the concept of Society 5.0 is similar to other terminologies used by various scholars and institutions, such as the “super city” [10], “super smart society” [11], “smart city 2.0” [12], and “responsive city” [13,14]. Society 5.0 aims to balance economic advancement with the resolution of social problems through Artificial Intelligence adoption, which can help identify the short-term and long-term effects of different services [15].
Waste management services are an important aspect of Society 5.0. The sector has been determined to improve recycling efficiency and energy use through technological intervention [10]. Recycling efficiency and energy use depend largely on the quality of the source-separated waste [16]. Therefore, waste collection plays a significant role in ensuring the achievement of waste management in Society 5.0. This study explored the social problems Japanese cities face in the municipal waste collection sector and developed the technology intervention needed.
Over the past several decades, many Japanese cities have experienced shrinkage. A total of 81.6% of the municipalities in Japan are shrinking in population. This phenomenon has been experienced in rural cities and the suburbs of metropolitan areas in Japan [17]. A case study in Kitakyushu, Japan, showed that the shrinking phenomenon is correlated with the duration of residence, underage population ratio, and aging population ratio [18].
The phenomenon of shrinking cities is occurring in all municipalities in Japan, with Central Tokyo serving as the only exception [19]. In 2022, very few municipalities in Japan had a density of more than 2800 people/km2 (Figure 1), which is the average density of cities in high-income countries [20]. This phenomenon has led to the deflation of housing assets and has become a new barrier to promoting compact cities [19], let alone smart cities, which are often associated with high initial costs [21]. During the latter half of the 1980s, asset price inflation in Japan, specifically for high-rise condominiums, was caused by the myth that the price would rise [22]. Because the expectations were unmet, the number of deserted dwellings is increasing yearly. Previous studies have reported that the ratio of desertified houses to dwelling houses is greater than 10% for all municipalities in Japan [23]. By 2018, the number of desertified dwellings had reached 8.5 million units, or approximately 14% of Japan’s total housing stock [24].
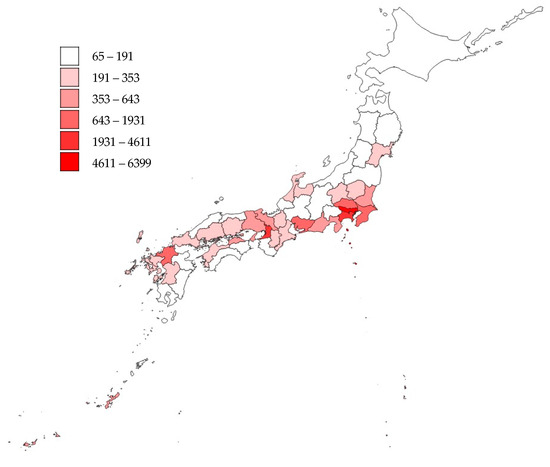
Figure 1.
Population density in Japanese prefectures (people/km2) (adapted by the authors from [25] data).
By adjusting to the current situation in aging and shrinking communities, this study sought to redesign a municipal waste collection system that is more appropriate and maintainable. To achieve these objectives, this study is organized as follows: (1) we collected and analyzed survey data from 1000 Japanese people to understand their perspectives on contactless and more collective waste collection technology through the use of exploratory statistical tools; based on the findings, (2) we proposed two new design alternatives for smart waste collection systems that are more appropriate from the perspectives of waste collection workers and civil society in the current situation.
2. Literature Review
2.1. Municipal Waste Collection in Japanese Aging and Declining Communities
The waste collection rate in Japan is currently greater than 90% [26], and it is managed by municipal governments. Such a near-universal collection rate is expected in high-income countries [27]. However, as the country struggles to maintain city infrastructure related to shrinkage [23], the waste management sector also faces several problems. Japan is currently facing severe labor shortages. The most severe shortage occurs in the face-to-face service sector but is expected to spread to a wide range of industries in the country [28]. The pandemic has triggered worsening conditions where strict immigration measures were imposed during the pandemic and reduced immigrant intake [28,29], preventing sufficient labor intake from abroad. The workforce potential of women is also limited because they are still commonly expected to handle the job of caregiving for both children [30] and elderly family members [31].
A previous study thoroughly discussed how the pandemic changed the dynamics of waste management in Japanese smart cities [32]. Given the speed of depopulation and aging, the need for smart waste management technologies is inevitable and urgent. To seek a concrete solution, we performed participant observation in a previous study by riding a city’s waste collection truck with a waste collection worker on their normal operating day. This observation resulted in an understanding of the demand for smart contactless waste collection technology from the worker’s perspective [33].
Thus, there is a need to design a smart waste collection technology that responds not only to the challenges faced by collection workers but also to the characteristics and preferences of aging Japanese civil society.
2.2. Development of Contactless Waste Collection Technology in Japan
In a previous participant observation study in a Japanese city, we revealed daily waste management activities and identified the need for smart technology from the perspective of waste collection workers. The study resulted in a pilot development project of a contactless and automated waste collection technology [33]. The study also called for a survey to reveal whether such a technology can be implemented in Japanese society. The developed technology allowed for (1) the reduction of physical human workers; and (2) a contactless manner of lifting, transporting, and dumping waste containers. Due to the more collective nature of waste pickup using this technology, large waste containers must be placed slightly farther than the currently used house-front temporary disposal locations. The experts consulted in the previous study raised a concern about whether the technology would be acceptable considering that aging Japanese people are presumably less fit than younger people. Additionally, detached houses represented approximately 80% of the surveyed case area, and many were small alleys [33]. This situation would mean that a significant number of people could carry their waste bags to the prepared waste containers that are likely to be placed on larger roads for waste packer trucks to have better access (Figure 2). To ensure that the technology is suitable for implementation, clarification is required to determine whether the developed technology needs to be equipped with smaller autonomous mobility devices to pick up waste from house fronts if people are unwilling or unable to carry it to temporary disposal sites.
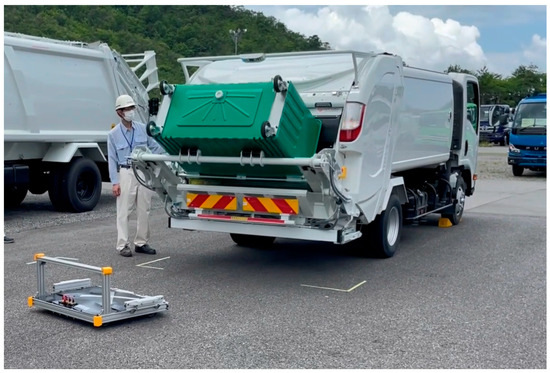
Figure 2.
Contactless collection device that requires residents to dispose of waste in collective (green) waste containers. source: [33].
3. Materials and Methods
3.1. Data Collection
We prepared questionnaires to gather information on Japanese people’s perspectives. For the questionnaire distribution, we commissioned Rakuten Insight, who programmed it into a digital survey and sent them online to its panel respondents between 2 and 7 August 2023.
Rakuten Insight was chosen to support the survey collection because of the wide reach of the panel, particularly for the Japanese people. As of July 2022, Rakuten Insight had 15.1 million global panel members, 2.2 million of whom are from the Japanese population [34]. Rakuten Insight performed an annual survey of its panels using survey content similar to that used in the Japanese national census to ensure that the quality of the sample panel was consistent [35]. In this study, Rakuten Insight sent a stratified random sampling survey on our behalf to its Japanese panel. We requested equal proportions of (1) gender, (2) age, and (3) location in Japan (Northern, Central, and Southern Japan) to ensure that we avoid bias and to allow us to derive meaningful insights from those respondent attributes. Furthermore, the particular interest of this research was to observe the inclusivity of the aging society and shrinking cities in Japan. Therefore, we considered stratified random sampling to be the most appropriate method to ensure impartial and equal opportunity in the sample selection process [36]. Rakuten Insight contacted 16,000 individuals and received approximately 1300 responses, resulting in an 8.13% response rate. One thousand responses were received after incomprehensible and ineligible responses were eliminated. Figure 3 shows the locations of the respondents on Japan’s map. Table 1 presents the descriptive statistics of the basic social attributes of the respondents. The largest share of respondents is living in a household of 2 people (33%). This group is largely made up of adults older than 60 years old. Very few people are living in households of 5 people and above. It is also very rare to see older adults living in a large household. This may indicate that multi-generational living is no longer practiced. Meanwhile, those in their 60s, 70s, 80s and older also make up a large share of those unemployed.
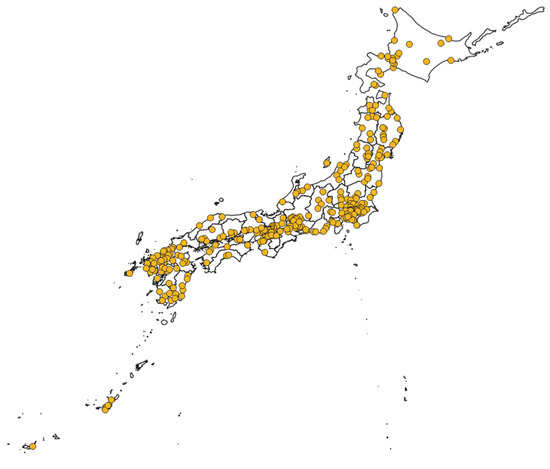
Figure 3.
Location of survey respondents.

Table 1.
Summary of respondents’ basic social attributes.
Table 2 summarizes the respondents’ responses to the following characteristics: (1) acceptable time to carry waste to the temporary disposal site, (2) weekly household plastic and packaging waste volume, and (3) need to avoid touching other people’s waste to reduce the risk of disease infection. The actual questions and the close-ended answer options are presented in Appendix A. For reference, 45 L trash bags are commonly used in Japanese municipalities, along with other smaller trash bags, such as 20 L trash bags [33].

Table 2.
Summary of respondents’ responses on their household waste disposal.
3.2. Methodological Framework
The methodological framework of this study is summarized in Figure 4. The formulas employed in this study follows those that were elaborated in [37,38]. The detailed statistical tools employed are described in Appendix B.
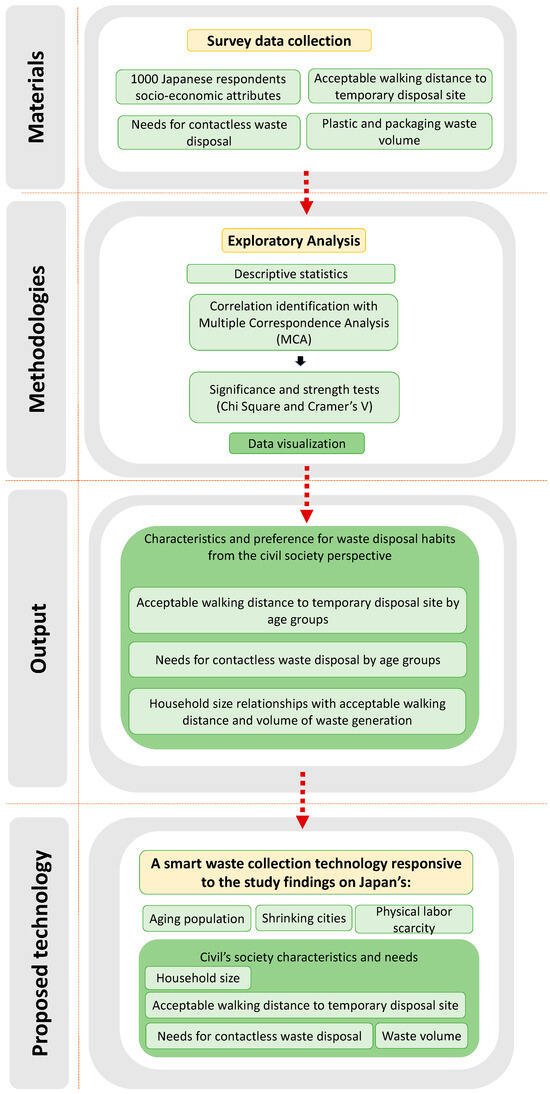
Figure 4.
Methodological framework. This study analyzed the literature, collected survey data, and identified respondents’ characteristics and needs to develop an appropriate smart waste collection technology through statistical approaches.
3.3. Multiple Correspondence Analysis (MCA) Preparation
Although the multiple correspondence analysis (MCA) does not require model construction, the data must be prepared into groups of classifications for easier interpretation. The collected data are organized into the categories presented in Table 3. Data categorization was guided by the frequency quartiles of the data, where applicable. The detailed walkthrough of the MCA employed in this study was described previously [38]. The functions and packages employed are from the R programming language FactoMineR. We followed the guidelines and principles of MCA from [39,40]. The codes for the graphics were adapted from [41,42].

Table 3.
Response categories.
4. Results
4.1. Relationships Identified by the MCA
The graphical output of the MCA is shown in Figure 5. The lighter areas indicate a stronger relationship between the attributes. The black dots represent observations. Two clusters of light-colored clouds were identified. The first cluster centers on the lower acceptable time to carry waste to the temporary disposal site (AT_Lo), and the second cluster centers on the lower need for contactless technology to reduce the risk of disease infection (NC_Lo).
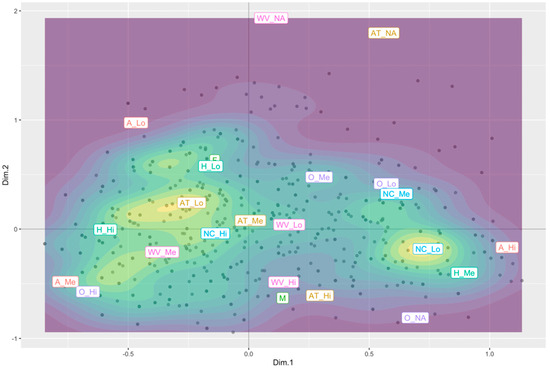
Figure 5.
MCA plot. A, age; G, gender; O, occupation; H, household size; F, female; M, male; AT, acceptable time (walking distance to temporary disposal site); WV, waste volume (plastic and packaging waste volume generated by the household); NC, need for contactless technology (necessity of a technology to prevent the chance of touching other people’s waste to prevent risk of disease infection); Hi, high; Me, medium; Lo, low.
4.2. Significant Relationships Identified by Nonparametric Tests
Chi-square and Cramer’s V tests were performed to (1) test which respondent’s attributes or variables were related to the identified clusters, (2) determine the significance and strength of the relationships, and (3) identify the direction of the relationships. The identified variables and attributes of the significant relationships (as indicated by the value p < 0.001) are summarized in Appendix C.
Four pairs of variables showed significant relationships (Appendix C): (1) the younger group of respondents (younger than 30 years) was the most hesitant to walk longer (more than 1 min) to carry waste to the temporary disposal sites; (2) the oldest group of respondents (older than 60 years) tended to express the unnecessity of a technology to reduce the possibility of touching other people’s waste to minimize the risk of disease infection; (3) the smallest group of households (people who live alone) tended to be more willing to walk a medium distance to the waste disposal site (more than 1 min but less than 2 min); and (4) household size was positively related to waste volume, as larger households produced more waste than smaller households.
Although the four pairs of relationships are only weakly significant (Cramer’s V lower than 0.25) [43], they are all deemed significantly correlated (p < 0.001). The four pairs of correlated attributes are further detailed in Figure 6, Figure 7, Figure 8, Figure 9 and Figure 10. As age groups are evenly distributed, meaningful insights can be derived from observing the frequency of age-related responses (Figure 6 and Figure 7). On the other hand, as household size is not evenly distributed among respondents, Figure 8, Figure 9 and Figure 10 present the relationships related to counts and expected count ratios. The following implications can be made from observing the figures: (1) older people are more willing to walk longer distances to temporary disposal sites (up to 5 min) than younger people are, (2) older people are less concerned about touching other people’s waste than younger people are (at a 0.24 count ratio), (3) the smallest household (consisting of just one person) tends to be willing to walk more than the minimum distance (1 to 2 min) but not longer distances (at a 0.19 count ratio), and (4) larger households produce more waste than smaller households.
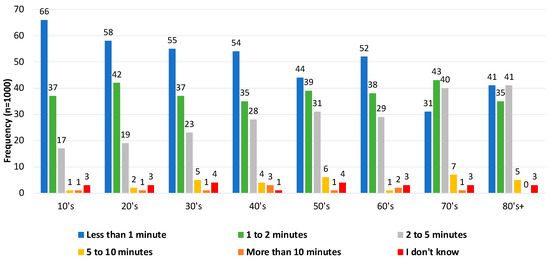
Figure 6.
Responses to acceptable time to carry waste to the disposal site by age.
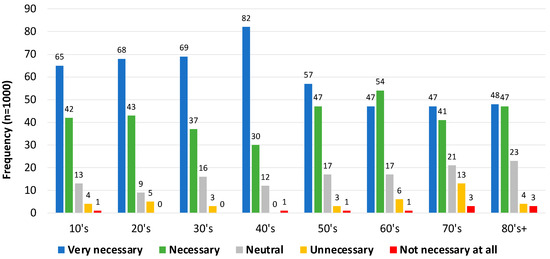
Figure 7.
Responses to the need for a technology that reduces the possibility of touching other people’s waste to lower the risk of disease infection by age.
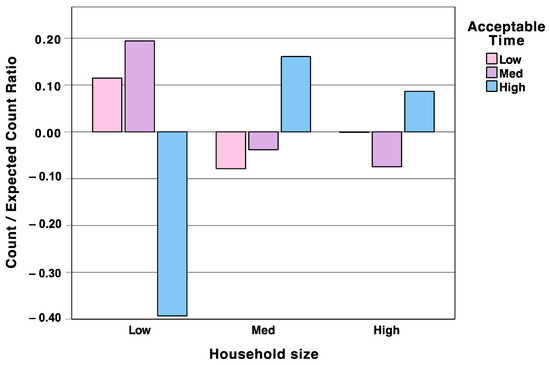
Figure 8.
The count and expected count ratio of responses on acceptable time to carry waste to the temporary disposal site by household size.
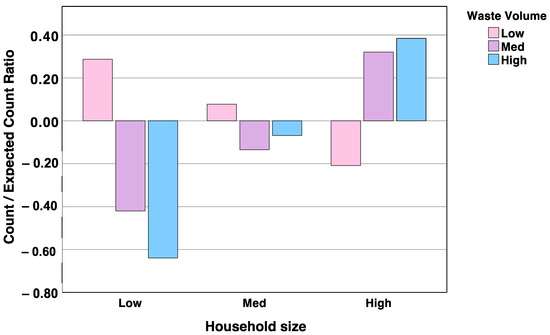
Figure 9.
Count and expected count ratios of the responses to waste volume by household size.
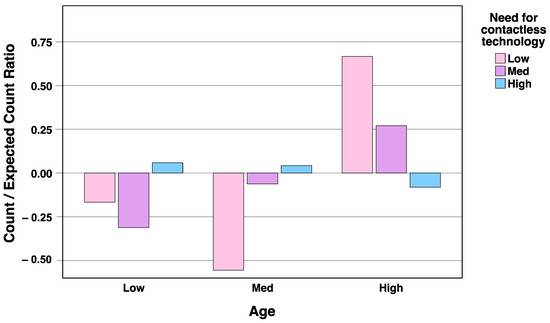
Figure 10.
Count and expected count ratios of the response on need for contactless technology by age.
5. Discussions
Aging is often associated with a decline in physical fitness. However, the findings of this study revealed that older people are willing to walk longer distances when carrying their waste to temporary disposal sites than younger people. Although Japan faces the challenge of maintaining the availability of physical workers [28], including the workforce carrying and lifting waste containers that weigh hundreds of kilograms [33], this does not mean that older adult residents are unwilling to walk a certain distance. This study revealed that the oldest group (in their 70s and 80 s) showed greater willingness to walk longer distances (up to 5 min) than did the younger age group (Figure 6). Conversely, the youngest groups of respondents (those in their 10s, 20s, 30s, 40s, and 50s) showed the lowest tolerance for the duration of walking to carry waste, with a nearly negative linear relationship. This finding is surprising because strength and physical perseverance are often expected of young people. On the other hand, it is reassuring that Japan’s older adults are willing to walk longer because walking is associated with mental health and active living maintenance [44,45].
The Japanese older adults are known for their longevity [46]. The Japanese society also encourages active aging as a way to extend healthy life expectancy and quality of life in older persons [47]. Perhaps, these are the reasons behind the older adults’ greater willingness to walk longer distances than the younger group. However, this result should not discourage the development of autonomous and micro-mobility technologies for waste collection. It is also known that the very advanced age population (75 years old and above) have challenges in their mobility, such as when using public transportation [38]. Therefore, the results of this study should be used to consider the most cost-effective and sustainable technological solution where necessary, including possible acceptance of all age groups.
Another surprising finding is that, although there is a popular belief that older people are at greater risk of contracting diseases, the analysis results of this study revealed that this group of people is less concerned about the risk of disease infection from unintended contact with other people (Figure 7). Conversely, the youngest group of respondents (in their 40s and below) were the most worried and showed a strong need for a technology that could allow for contactless waste disposal. The COVID-19 pandemic has triggered various concerns regarding disease infection possibilities from household waste. These concerns are particularly related to handling single-use masks, testing kits, and other products used by an infected person. Studies have highlighted the need for proper disposal methods, such as incineration to kill pathogens [48], appropriate resting time to decrease the risk of spread of the disease [49], and the possibility of contactless waste pickup [33]. The present study is the first to highlight what the general public thought about this matter, especially among people of various age groups and after the vaccine was widely implemented in society. By the time the survey in this study was taken, most Japanese people were already in their fifth or sixth round of COVID-19 shots. While the virus is currently seen at a similar level of threat as influenza in Japan, there are, of course, future possibilities of a pandemic occurrence similar to that of COVID-19.
In terms of household size, those who live alone are willing to walk more than respondents with larger households (Figure 8). There are many possible reasons why more people who live alone choose the medium walking distance (1 to 2 min) rather than the shortest distance (<1 min). Several possibilities are (1) because no one is expecting them at home to return soon, (2) because of a preference to have their waste disposed farther from their living place to prevent unpleasant smells or other hygiene issues, or (3) because the weight to carry is lighter than that of larger households. However, many Japanese older adults are living alone, and the prevalence of this condition is increasing due to the insufficient capacity of older-adult care facilities [50]. Therefore, to anticipate rapid demographic and social changes in Japan, responses from older age groups and the responses of the single-person households in this study should be seriously considered by waste collection service providers when redesigning waste collection strategies.
Proposed New Designs Based on Findings
In a previous study, the opinions and concerns of city waste collection service operators were incorporated into a pilot demonstration project of a smart waste collection device [33]. This study collected information on the characteristics and preferences of the aging society of Japan for waste disposal activities to determine whether such devices are socially acceptable. The results of both studies, supported by the literature review, provided insights into redesigning Japan’s waste collection strategy.
Japan’s waste collection practice is facing maintenance difficulties due to labor shortages and aging. We propose two designs to solve this problem, as presented in Figure 11a,b. In the old strategy, people who live in detached houses typically place their waste bags in front of their houses, on sidewalks and corners. The manual collection of these waste bags has physically strained scarce and aging waste collection workers [33]. Since the present study revealed that most older residents are willing to walk up to 5 min to carry their waste to a temporary disposal site, we suggest design (a), which involves placing larger waste containers (the one in Figure 11a is 700 L in capacity) between 1- and 5-min walking distances to allow for a more collective waste collection strategy using the developed contactless waste container dumping device. This new strategy responds to (1) waste collection worker scarcity and physical strains, (2) truck access to containers that can be placed only in larger areas, (3) aging residents’ willingness to walk slightly farther, and (4) single-person households’ preference for having waste bins placed farther from their living place (more than a 1-min walk). To anticipate the declining physical strength of very advanced age population and to accommodate the needs of people with limited mobility, we also propose design (b), which involves developing autonomous pickup, dumping, and returning of waste bins to the house fronts and corners of residential blocks.
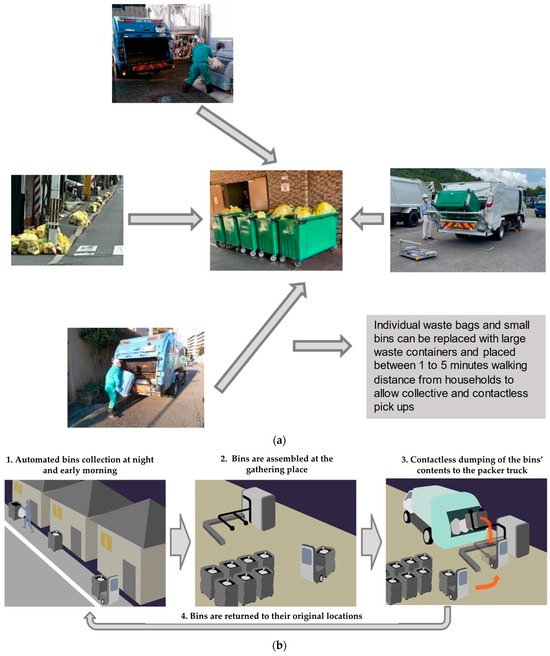
Figure 11.
Redesigned household waste collection to reduce collection workers with (a) increased walking distance and (b) the use of automatization technologies [51].
Both strategies may be faced with various challenges, opportunities, and policy implications. Table 4 provides a summary of these factors to be considered by decision makers and practitioners. While design (a) may bring opportunities of encouraging active lifestyle and communal monitoring, it may be faced with resistance by those unwilling to walk longer to the temporary disposal site. Furthermore, people’s cooperation and understanding should be gained through a possibly lengthy process of socialization. Meanwhile, design (b) may be quicker in terms of implementation due to changes that are mainly required at the management levels, but it may imply a higher demand for energy supply. Ensuring that the energy supply comes from renewable resources may improve the sustainability of the strategy.

Table 4.
Challenges, opportunities, and policy implications of the proposed waste collection designs.
6. Conclusions
Japan’s cities are shrinking due to population aging, low birth rates, and the outflow of residents. The smart city strategy has recently been renamed Society 5.0 to highlight its ability to respond to social problems. Society 5.0 has been adopted to rejuvenate and accommodate the changing demography of the Japanese population and improve the maintainability of the city’s services and infrastructures.
In the waste collection sector, the scarcity and aging of the physical workforce have put a strain on maintaining current practices. However, the proposed smart technology for replacing human workers in this area has raised questions about its acceptability by civil society. These concerns were raised because of (1) the characteristics of the new technology, which requires people to walk farther to carry their waste to the waste container for collective pickup; and (2) the aging general population, which is presumably less physically fit to carry their waste.
The present study collected surveys of 1000 Japanese people who were equally distributed in terms of location (Northern, Central, and Southern Japan), age (10s, 20s, 30s, 40s, 50s, 70s, 80s, and older), and gender. We analyzed the survey data using an exploratory statistical method, MCA, and nonparametric tests (Chi-square and Cramer’s V) to identify the relationships, significance, and strength of the relationships. Four significant relationships were found: (1) older adults are willing to walk longer when carrying their waste to the temporary disposal site, (2) older adults are less concerned about disease infection from unintentional contact with other people’s household waste, (3) single-person households prefer temporary waste disposal sites to be placed farther from their living place, and (4) plastic and packaging waste volume are positively related to household size. While these findings are significant, Cramer’s V results indicated that they are only weakly significant. Interpreting such findings, the relationship may not be used to push for a certain strong policy or action. However, it might mediate a dispute about a solution or social-issue technological intervention. The present study uses this information to determine the appropriateness of a new smart waste collection technology that responds to the needs and challenges faced by waste collection workers.
The proposed new strategies in this study will reduce the number of workers and the contactless waste pickup desired by the workers. However, “design (a)”, which is a more collective strategy, requires larger containers that must be placed farther than the currently practiced residents’ house fronts and sidewalks. Since older respondents in this study are willing to walk farther to carry their waste bags, and those who live alone actually prefer a disposal site, replacing individual waste bags and small containers with larger waste containers placed between 1 and 5 min, the walking distance would be ideal. In this way, a more collective waste pickup by the smart contactless waste collection device can be realized. On the other hand, this strategy may be faced with challenges such as opposition by those unwilling to walk longer the disposal sites and by people who live near the temporary disposal sites. Meanwhile, “design (b)”, which is the use of automatization technologies, may be faced with the challenge of increased energy demand to run the technologies. Ensuring that the power supply comes from renewable resources will improve the sustainability of this strategy.
For actual implementation, pilot studies in Japanese cities are required to test the acceptability of the new designs. This study’s limitation is that it is specific to the Japanese population. However, Japan is leading globally in terms of the speed and magnitude of aging, population decline, city shrinkage, and technological advancement. Therefore, it can be used as a reference for other aging countries that face similar problems in terms of securing physical workers and maintaining waste collection services.
Future research in this field should be dedicated to the “soft” and “hard” needs of new waste collection designs to accommodate the challenges faced by aging and declining communities. The “soft” needs include ensuring active aging, community acceptance, and gaining residents’ cooperation if the low-tech alternative is adopted. The “hard” needs include a more aggressive introduction of renewable energy to supply the expected increased energy needs and ensure enough financial resources for investment and reinvestment for the devices required and the energy storage replacement if the high-tech alternative is adopted.
Author Contributions
Conceptualization, A.H.P.; methodology, A.H.P.; software, A.H.P. and C.S.; validation, A.H.P. and C.S.; formal analysis, A.H.P. and C.S.; investigation, A.H.P. and R.T.; resources, A.H.P. and H.O.; data curation, A.H.P., C.S. and A.O.; writing—original draft preparation, A.H.P.; writing—review and editing, A.H.P.; visualization, A.H.P., C.S. and A.O.; supervision, A.H.P. and H.O.; project administration, A.H.P., R.T. and H.O.; funding acquisition, A.H.P. and H.O. All authors have read and agreed to the published version of the manuscript.
Funding
This study was funded by (1) The Environmental Restoration and Conservation Agency under project number JPMEERF20213G01, titled “Development of Contactless Garbage Collection Systems and Scenarios Construction for Social Implementation” project; and (2) The Japan Society for the Promotion of Science under project number 23K11548, titled “Improving the social acceptance of smart technologies: A people-centric approach for sustainable smart waste management and smart mobility technologies”.
Data Availability Statement
Data will be made available upon request.
Acknowledgments
We thank the people at Rakuten Insight, who were commissioned to collect the survey on our behalf. We also thank the reviewers, who have tremendously helped us improve the quality of this manuscript.
Conflicts of Interest
Author Ryota Tsubouchi was employed by the company Daiei Kankyo Research Institute Co., Ltd. The remaining authors declare that the research was conducted in the absence of any commercial or financial relationships that could be construed as a potential conflict of interest.
Appendix A
Actual questions asked to the respondents (English translated from Japanese language):
| In your best estimation, how many 45 L trash bags of plastic and packaging waste does your household dispose of in a week? |
|
|
|
|
|
| How long are you willing to walk carrying your trash from your residence or place of employment to the temporary disposal site? |
|
|
|
|
|
|
|
| What do you think about the necessity of a technology that can help you avoid the chance of touching other people’s waste (to reduce the risk of diseases infection)? |
|
|
|
|
|
Appendix B
This study employed MCA and nonparametric test methods, namely Chi-square (Equation (A1)) and Cramer’s V (Equation (A2)), to analyze the collected data, where is Chi-squared, is observed value, is expected value, V is Cramer’s V coefficient, n is the total number of observations, r is the number of rows in the contingency table, and c is the number of columns in the contingency table.
And then, we measured the count/expected count ratio (Equation (A3)) to test the direction of relationships between the observed and the expected data counts (positive relationship if more than 0, and negative if less than 0) [37].
The detailed procedures of the methodologies were elaborated in [38,52]. MCA has several strength points, which is why it was selected for this study. Its first strength is its exploratory ability to provide insights out of a large set of data [53]. This is an important point, especially because this study deals with a new technology for which the acceptance in the society is still largely unknown. The second strength is its interpretation-friendliness. One can discover the relationships among respondents’ attributes and responses simply by observing the distance proximity of variables presented in the MCA graphical output. Other aesthetical indicators, such as a change in colors, can also indicate the relationships’ intensity. The drawback of MCA is its inability to indicate either the significance or high accuracy of strengths of the identified relationships among variables. To compensate for this drawback, we performed nonparametric tests following the MCA. The Chi-square test was used in this study to prove or disprove the significance, and Cramer’s V was performed to tell the strength of the identified significant relationships [43].
Appendix C
Identified significant relationships based on Chi-square and Cramer’s V.
| Cross Table Parameters with Significant Chi-Square Test p-Value | Test Results | Largest Count/Expected Count Ratio | ||
| Chi-Square | Cramer’s V | (RowVariable_Category/ ColVariable_Category: Count) | Expected Count | |
| Age with Acceptable time to carry waste to temporary disposal site | <0.001 | 0.118 | A_Lo/AT_Hi:67.3 | 41 |
| Age with Need for a technology to reduce the possibility of touching other people’s waste to reduce the risk of disease infection | <0.001 | 0.110 | A_Hi/NC_Lo:18 | 30 |
| Household size with Acceptable time to carry waste to temporary disposal site | <0.001 | 0.097 | H_Lo/AT_Me:71.2 | 85 |
| Household size with Weekly waste volume | <0.001 | 0.179 | H_Lo/WV_Hi:13.9 | 5 |
References
- Jarzebski, M.P.; Elmqvist, T.; Gasparatos, A.; Fukushi, K.; Eckersten, S.; Haase, D.; Goodness, J.; Khoshkar, S.; Saito, O.; Takeuchi, K.; et al. Ageing and Population Shrinking: Implications for Sustainability in the Urban Century. Npj Urban Sustain. 2021, 1, 17. [Google Scholar] [CrossRef]
- OECD Demography—Elderly Population—OECD Data. Available online: https://data.oecd.org/pop/elderly-population.htm (accessed on 22 July 2022).
- The World Bank. Population Ages 65 and above (% of Total Population)—Japan|Data. Available online: https://data.worldbank.org/indicator/SP.POP.65UP.TO.ZS?locations=JP (accessed on 16 June 2023).
- United Health Foundation. Explore Population—Adults Ages 65+ in the United States|AHR. Available online: https://www.americashealthrankings.org/explore/measures/pct_65plus (accessed on 16 June 2023).
- Hao, M.; Wang, X.; Hou, S.; Zhang, Q.; Xue, T. The Elderly Acceptance of Autonomous Vehicle Services in Beijing, China. Int. Rev. Spat. Plan. Sustain. Dev. 2023, 11, 64–84. [Google Scholar] [CrossRef]
- McCurry, J. Japan Will Be Model for Future Super-Ageing Societies. The Lancet 2015, 386, 1523. [Google Scholar] [CrossRef]
- UN DESA. World Population Prospects—Population Division—United Nations. Available online: https://population.un.org/wpp/ (accessed on 6 October 2022).
- UNESCAP. Asia-Pacific Report on Population Ageing 2022; UNESCAP: Bangkok, Thailand, 2022. [Google Scholar]
- Scott, A.J. The Longevity Society. Lancet Healthy Longev. 2021, 2, e820–e827. [Google Scholar] [CrossRef]
- Prime Minister’s Office Japan. Japan’s Smart Cities; Prime Minister’s Office Japan: Tokyo, Japan, 2019. [Google Scholar]
- Japan Science and Technology Agency. “Super Smart Society (Society 5.0)” Mission Area 2017; Japan Science and Technology Agency: Saitama, Japan, 2017. [Google Scholar]
- Trencher, G. Towards the Smart City 2.0: Empirical Evidence of Using Smartness as a Tool for Tackling Social Challenges. Technol. Forecast. Soc. Chang. 2019, 142, 117–128. [Google Scholar] [CrossRef]
- Damianou, A.; Vayona, A.; Demetriou, G.; Katos, V. An Actionable Maturity Planning Model for Smart, Circular Cities. Cities 2023, 140, 104403. [Google Scholar] [CrossRef]
- Miaoudakis, A. Ideal Cities: Intelligence-Driven Urban Internet-of-Things Ecosystems for Circular, Safe and Inclusive Smart Cities; European Comissions: Brussels, Belgium, 2018. [Google Scholar]
- Hitachi-UTokyo Laboratory(H-UTokyo Lab.). Society 5.0: A People-Centric Super-Smart Society; Springer: Singapore, 2020; ISBN 9789811529894. [Google Scholar]
- Shan, C.; Pandyaswargo, A.H.; Onoda, H. Environmental Impact of Plastic Recycling in Terms of Energy Consumption: A Comparison of Japan’s Mechanical and Chemical Recycling Technologies. Energies 2023, 16, 2199. [Google Scholar] [CrossRef]
- Peng, W.; Wu, Z.; Duan, J.; Gao, W.; Wang, R.; Fan, Z.; Liu, N. Identifying and Quantizing the Non-Linear Correlates of City Shrinkage in Japan. Cities 2023, 137, 104292. [Google Scholar] [CrossRef]
- Peng, W.; Fan, Z.; Duan, J.; Gao, W.; Wang, R.; Liu, N.; Li, Y.; Hua, S. Assessment of Interactions between Influencing Factors on City Shrinkage Based on Geographical Detector: A Case Study in Kitakyushu, Japan. Cities 2022, 131, 103958. [Google Scholar] [CrossRef]
- Uto, M.; Nakagawa, M.; Buhnik, S. Effects of Housing Asset Deflation on Shrinking Cities: A Case of the Tokyo Metropolitan Area. Cities 2023, 132, 104062. [Google Scholar] [CrossRef]
- OECD Library. The Changing Shape of Cities: Density and Suburbanisation. 2023. Available online: https://www.oecd-ilibrary.org/docserver/252899a3-en.pdf?expires=1715652875&id=id&accname=guest&checksum=418EBD147E25DF13123D32F911CF993D (accessed on 24 January 2024).
- Macomber, J. Smart Cities Are Complicated and Costly: Here’s How to Build Them. 2018. Available online: https://hbswk.hbs.edu/item/smart-cities-are-complicated-and-expensive-here-s-how-to-build-them (accessed on 14 January 2024).
- Hino, K.; Amemiya, M. Spatiotemporal Analysis of Burglary in Multifamily Housing in Fukuoka City, Japan. Cities 2019, 90, 15–23. [Google Scholar] [CrossRef]
- MLIT. Promotion of Urban Renovation and Compact Cities; MLIT: Tokyo, Japan, 2012. [Google Scholar]
- The Japan Times. Reimagining Japan’s Growing Glut of Empty Homes. 2022. Available online: https://www.japantimes.co.jp/news/2022/04/04/business/japan-abandoned-houses-solutions/ (accessed on 23 January 2024).
- Higashide, M. Japan’s 27 Prefectures’ Population, Area, and Density Ranking 2023. Available online: https://uub.jp/rnk/iwate/p_j.html (accessed on 10 January 2024).
- Plastic Atlas Asia Edition: Facts and Figures about the World of Synthetic Polymers. Available online: https://www.iges.or.jp/en/pub/plastic-atlas-asia-edition-2021/en (accessed on 12 May 2023).
- World Bank. What a Waste 2.0; The World Bank: Washington, DC, USA, 2018; ISBN 978-1-4648-1329-0. [Google Scholar]
- Nishioka, S. Severe Labor Shortage Puts Upward Pressure on Wages in Japan. JRI Res. J. 2023, 6, 1–8. [Google Scholar]
- Okamoto, A. Immigration Policy and Demographic Dynamics: Welfare Analysis of an Aging Japan. J. Jpn. Int. Econ. 2021, 62, 101168. [Google Scholar] [CrossRef]
- Iijima, S.; Yokoyama, K. Socioeconomic Factors and Policies Regarding Declining Birth Rates in Japan. Nihon Eiseigaku Zasshi. Jpn. J. Hyg. 2018, 73, 305–312. [Google Scholar] [CrossRef]
- Aronsson, A. Professional Women and Elder Care in Contemporary Japan: Anxiety and the Move toward Technocare. Anthropol. Aging 2022, 43, 17–34. [Google Scholar] [CrossRef]
- Onoda, H. Smart Approaches to Waste Management for Post-COVID-19 Smart Cities in Japan. IET Smart Cities 2020, 2, 89–94. [Google Scholar] [CrossRef]
- Ogawa, A.; Pandyaswargo, A.H.; Tsubouchi, R.; Onoda, H. Demonstration of a Contactless Waste Collection System: A Japanese Case Study. IET Smart Cities 2023, 5, 303–316. [Google Scholar] [CrossRef]
- Rakuten Insight. Rakuten Insight Rakuten Insight Panel Book; Rakuten Insight: Tokyo, Japan, 2022. [Google Scholar]
- Nakamura, H.; Abe, N.; Mizunoya, T. Factors Inhibiting the Use of Sharing Economy Services in Japan. J. Clean. Prod. 2021, 278, 123981. [Google Scholar] [CrossRef]
- Singh, A.S.; Masuku, M.B. Sampling Techniques & Determination of Sample Size in Applied Statistics Research: An Overview. Int. J. Commer. Manag. 2014, 2, 1–22. [Google Scholar]
- Shan, C.; Pandyaswargo, A.H.; Ogawa, A.; Tsubouchi, R.; Onoda, H. Japanese Public Perceptions on Smart Bin Potential to Support PAYT Systems. Waste Manag. 2024, 177, 278–288. [Google Scholar] [CrossRef]
- Pandyaswargo, A.H.; Siregar, T.H.; Onoda, H. Exploring Japan’s Older Adults Mobility Challenges and the Potential Role of Autonomous Vehicles. Transp. Res. Part A Policy Pract. 2023, 176, 103818. [Google Scholar] [CrossRef]
- Abdi, H.; Valetin, D. Multiple Correspondence Analysis. In Encyclopedia of Measurement and Statistics; SAGE Publications: Thousand Oaks, CA, USA, 2007. [Google Scholar]
- Roux, B.L.; Rouanet, H. Multiple Correspondence Analysis; SAGE Publications Inc.: Thousand Oaks, CA, USA, 2010. [Google Scholar]
- Kassambara MCA—Multiple Correspondence Analysis in R: Essentials—Articles—STHDA. Available online: http://www.sthda.com/english/articles/31-principal-component-methods-in-r-practical-guide/114-mca-multiple-correspondence-analysis-in-r-essentials/ (accessed on 23 January 2023).
- Sanchez, G. RPubs—Multiple Correspondence Analysis in R. Available online: https://rpubs.com/gaston/MCA (accessed on 20 January 2023).
- IBM Cramér’s V—IBM Documentation. Available online: https://www.ibm.com/docs/en/cognos-analytics/11.1.0?topic=terms-cramrs-v (accessed on 8 February 2022).
- Koohsari, M.J.; Sugiyama, T.; Shibata, A.; Ishii, K.; Hanibuchi, T.; Liao, Y.; Owen, N.; Oka, K. Walk Score® and Japanese Adults’ Physically-Active and Sedentary Behaviors. Cities 2018, 74, 151–155. [Google Scholar] [CrossRef]
- Koohsari, M.J.; McCormack, G.R.; Nakaya, T.; Shibata, A.; Ishii, K.; Yasunaga, A.; Hanibuchi, T.; Oka, K. Urban Design and Japanese Older Adults’ Depressive Symptoms. Cities 2019, 87, 166–173. [Google Scholar] [CrossRef]
- Miura, K. Epidemiology and Prevention of Hypertension in Japanese: How Could Japan Get Longevity? EPMA J. 2011, 2, 59–64. [Google Scholar] [CrossRef]
- Hirai, H.; Kondo, K.; Kawachi, I. Social Determinants of Active Aging: Differences in Mortality and the Loss of Healthy Life between Different Income Levels among Older Japanese in the AGES Cohort Study. Curr. Gerontol. Geriatr. Res. 2012, 2012, 701583. [Google Scholar] [CrossRef]
- Haque, M.d.S.; Uddin, S.; Sayem, S.M.d.; Mohib, K.M. Coronavirus Disease 2019 (COVID-19) Induced Waste Scenario: A Short Overview. J. Environ. Chem. Eng. 2021, 9, 104660. [Google Scholar] [CrossRef]
- Tripathi, A.; Tyagi, V.K.; Vivekanand, V.; Bose, P.; Suthar, S. Challenges, Opportunities and Progress in Solid Waste Management during COVID-19 Pandemic. Case Stud. Chem. Environ. Eng. 2020, 2, 100060. [Google Scholar] [CrossRef]
- Kumagai, N. Care Preferences of Elderly People Living Alone in Japan. Health Educ. Public Health 2018, 1, 2. [Google Scholar]
- Onoda, H. An Attempt to Implement Multi-Benefit Mobility in Society in Conjunction with Urban Development. Inf. Process. 2024, 65. Available online: https://www.ipsj.or.jp/dp/contents/publication/58/DP6505-S01.html (accessed on 13 May 2024).
- Pandyaswargo, A.H.; Wibowo, A.D.; Onoda, H. Socio-Techno-Economic Assessment to Design an Appropriate Renewable Energy System for Remote Agricultural Communities in Developing Countries. Sustain. Prod. Consum. 2022, 31, 492–511. [Google Scholar] [CrossRef]
- IBM. Multiple Correspondence Analysis—IBM Documentation. Available online: https://www.ibm.com/docs/en/spss-statistics/28.0.0?topic=categories-multiple-correspondence-analysis (accessed on 29 July 2022).
Disclaimer/Publisher’s Note: The statements, opinions and data contained in all publications are solely those of the individual author(s) and contributor(s) and not of MDPI and/or the editor(s). MDPI and/or the editor(s) disclaim responsibility for any injury to people or property resulting from any ideas, methods, instructions or products referred to in the content. |
© 2024 by the authors. Licensee MDPI, Basel, Switzerland. This article is an open access article distributed under the terms and conditions of the Creative Commons Attribution (CC BY) license (https://creativecommons.org/licenses/by/4.0/).