
The Intersection of the Green and the Smart City: A Data Platform for Health and Well-Being through Nature-Based Solutions

 , ,
, ,  ,
, 
Abstract
:1. Introduction and State of the Art
2. Materials and Methods
- I.
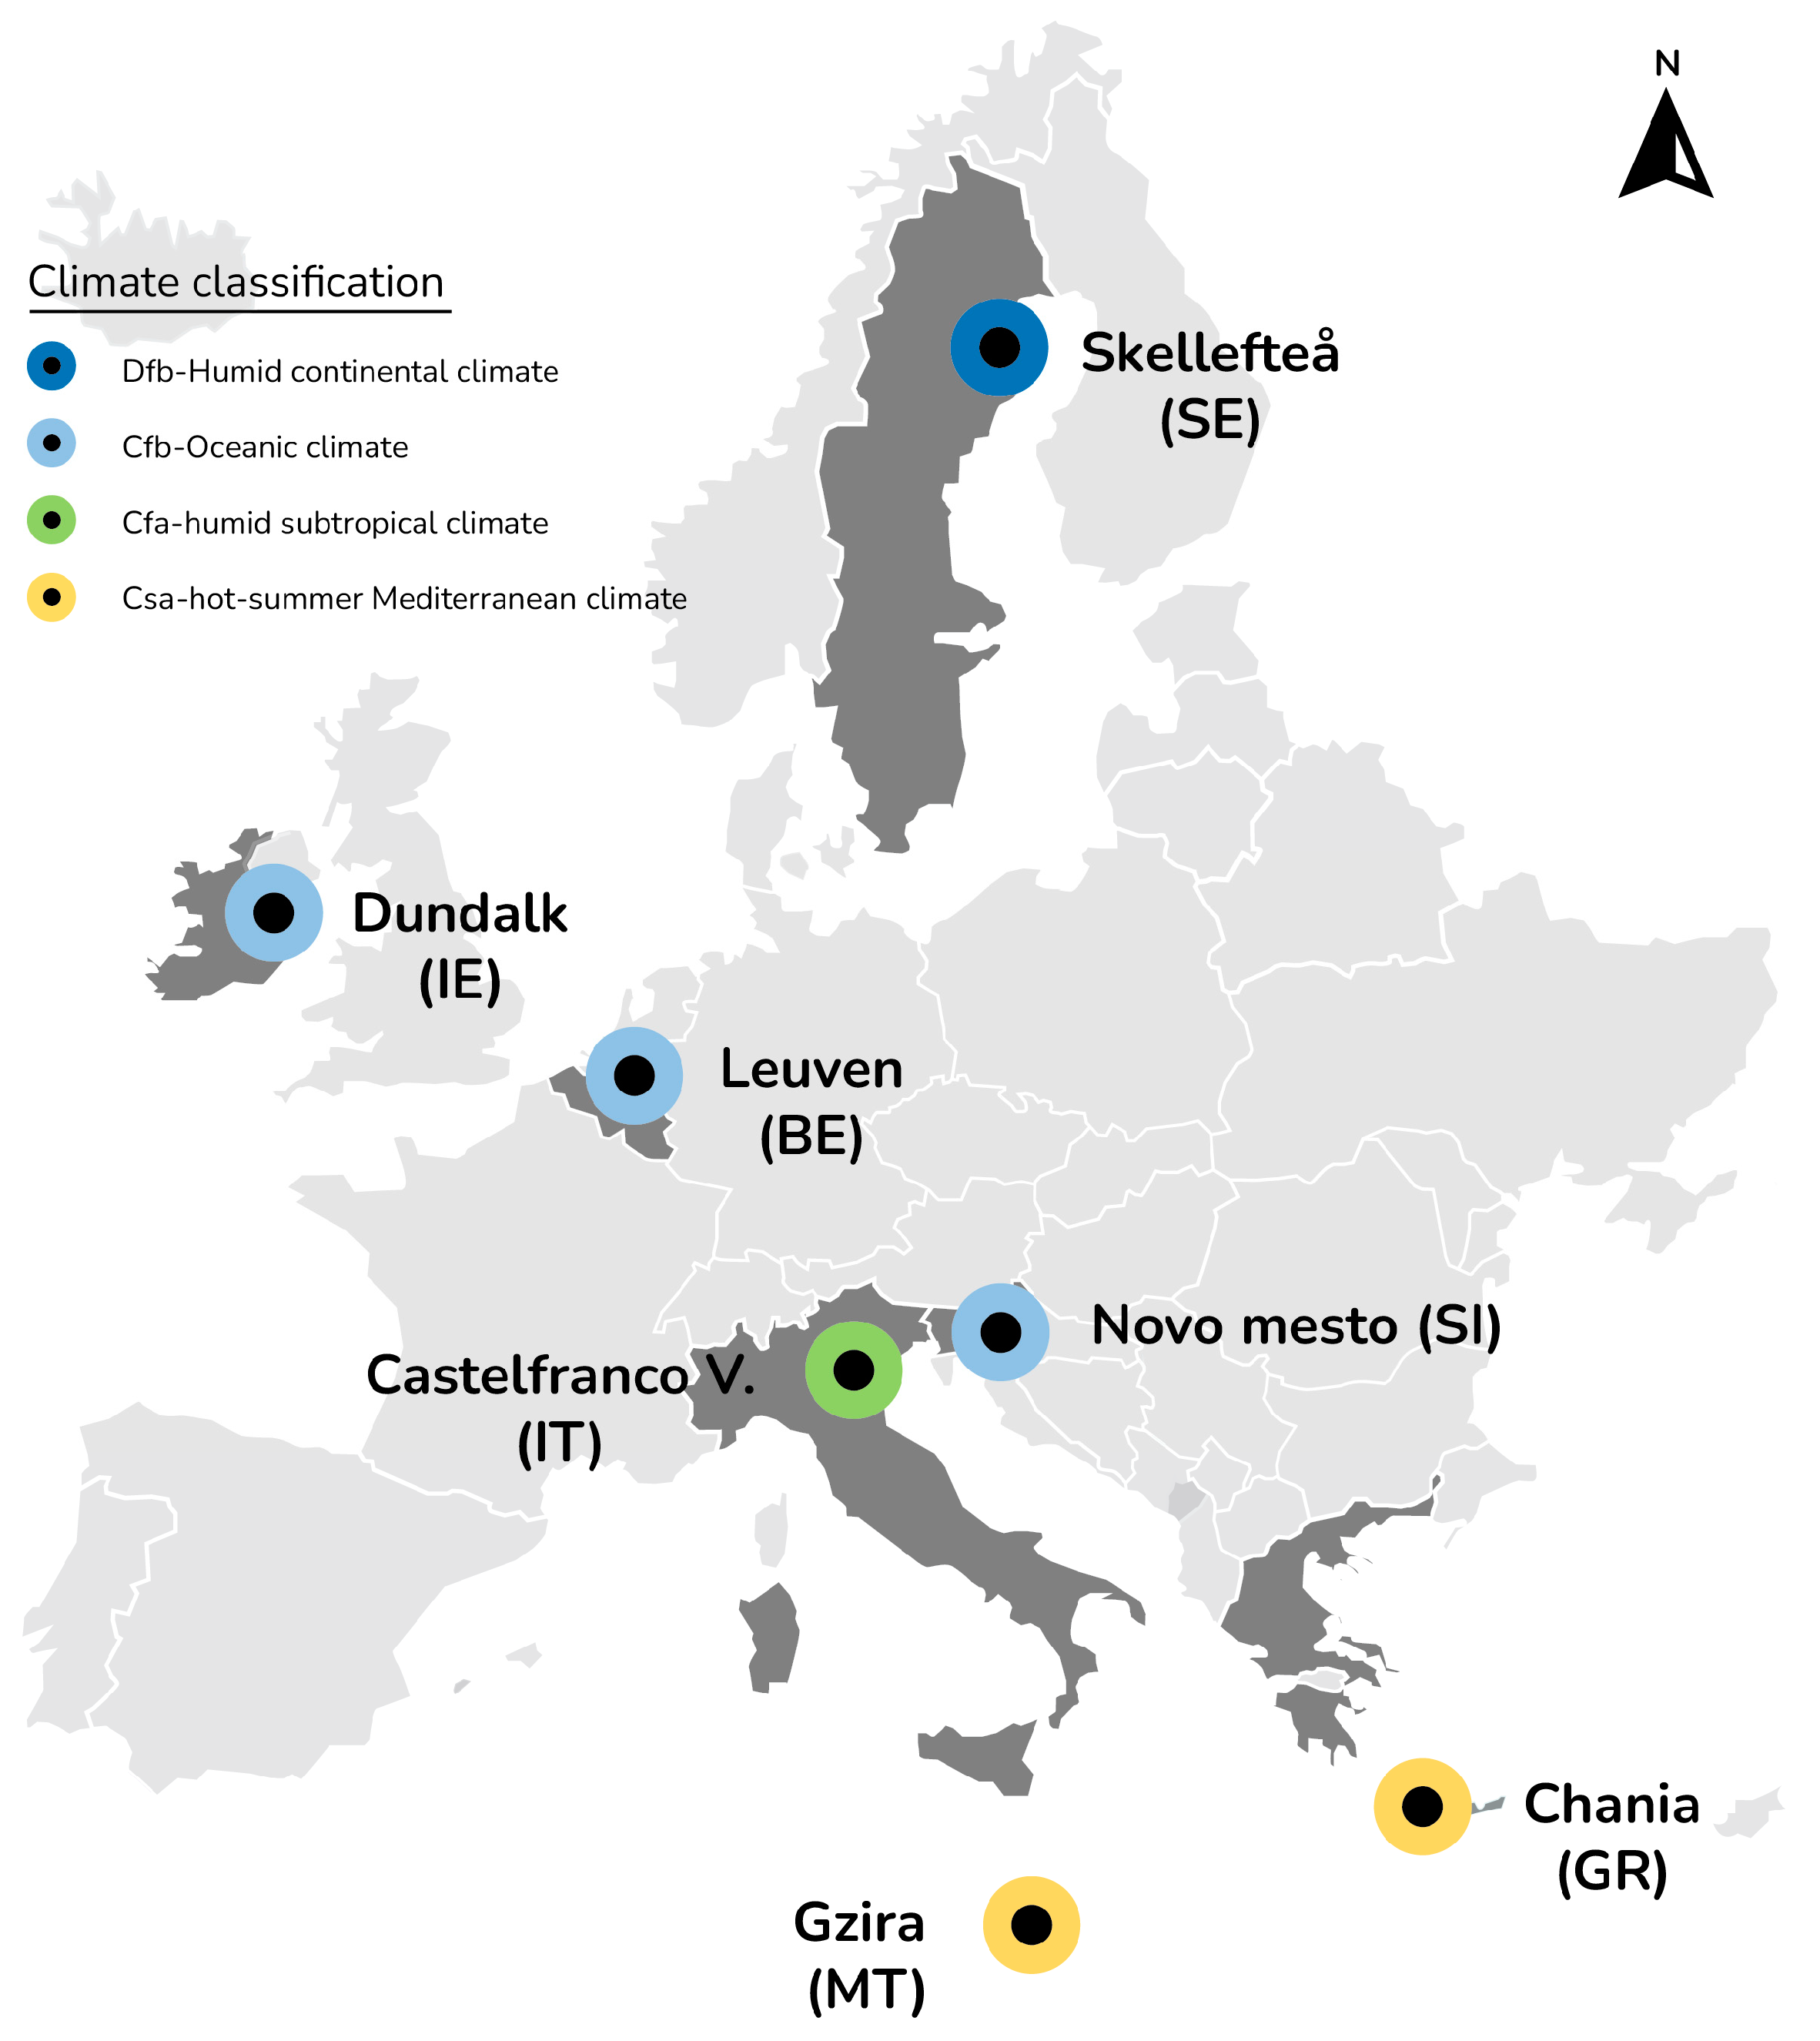
- Selection of pilot citiesThe selection criteria were:
- Coverage of diverse climatic conditions and regions within Europe (see Figure 1).
- Coverage of different urban scales ranging from street level to neighborhood and city or regional scale.
- Tackling different challenges with nature-based solutions.
- II.
- Analysis of the pilot cities’ requirements and data collection needsFocusing on the state of the art and available information at the urban scale, 14 sections corresponding to several relevant domains of knowledge for the intersection of the smart with the green city, have been defined:
- General information for each pilot;
- Climate and energy;
- Environmental issues;
- Urban green spaces and nature-based solutions;
- Social and economic aspects;
- Participatory planning and governance;
- Health and well-being of citizens;
- Innovation and smart city aspects;
- Vision and objectives;
- Stakeholders;
- Installed sensors;
- Local governance system;
- Major needs and challenges, barriers, and drivers;
- Potential multiple impacts.
These domains of knowledge are utilized for the development of the web-based data platform specifications.
- III.
- Creation of a baseline for the seven pilot cities by collecting data and creating a local database (see Section 7)
- IV.
- Development of a smart nature-based solutions web-based data platform.
- V.
- Extraction of key performance indicators
- VI.
- Visualization of data and key performance indicators
3. Description of the Pilot Cities and Smart Nature-Based Solutions Architecture
- The physical layer includes the sensors and the sensor network. The sensor network is required for the data connectivity, i.e., the IP connectivity and the LoRaWAN communication protocol. The physical layer also includes the GoNature game ecosystem, which digests the sensors’ data to dynamically adapt the game/app environment in real-time and achieve interaction with citizens.
- The sensor management platform functionality ensures high-quality data by monitoring the sensors’ battery level, signal-to-noise ratio, and signal strength indicator of the channel. The specific platform ensures proper maintenance of the connected devices. The platform sends notifications about possible device failures and executes predictive maintenance, e.g., changing the device’s battery before it fails.
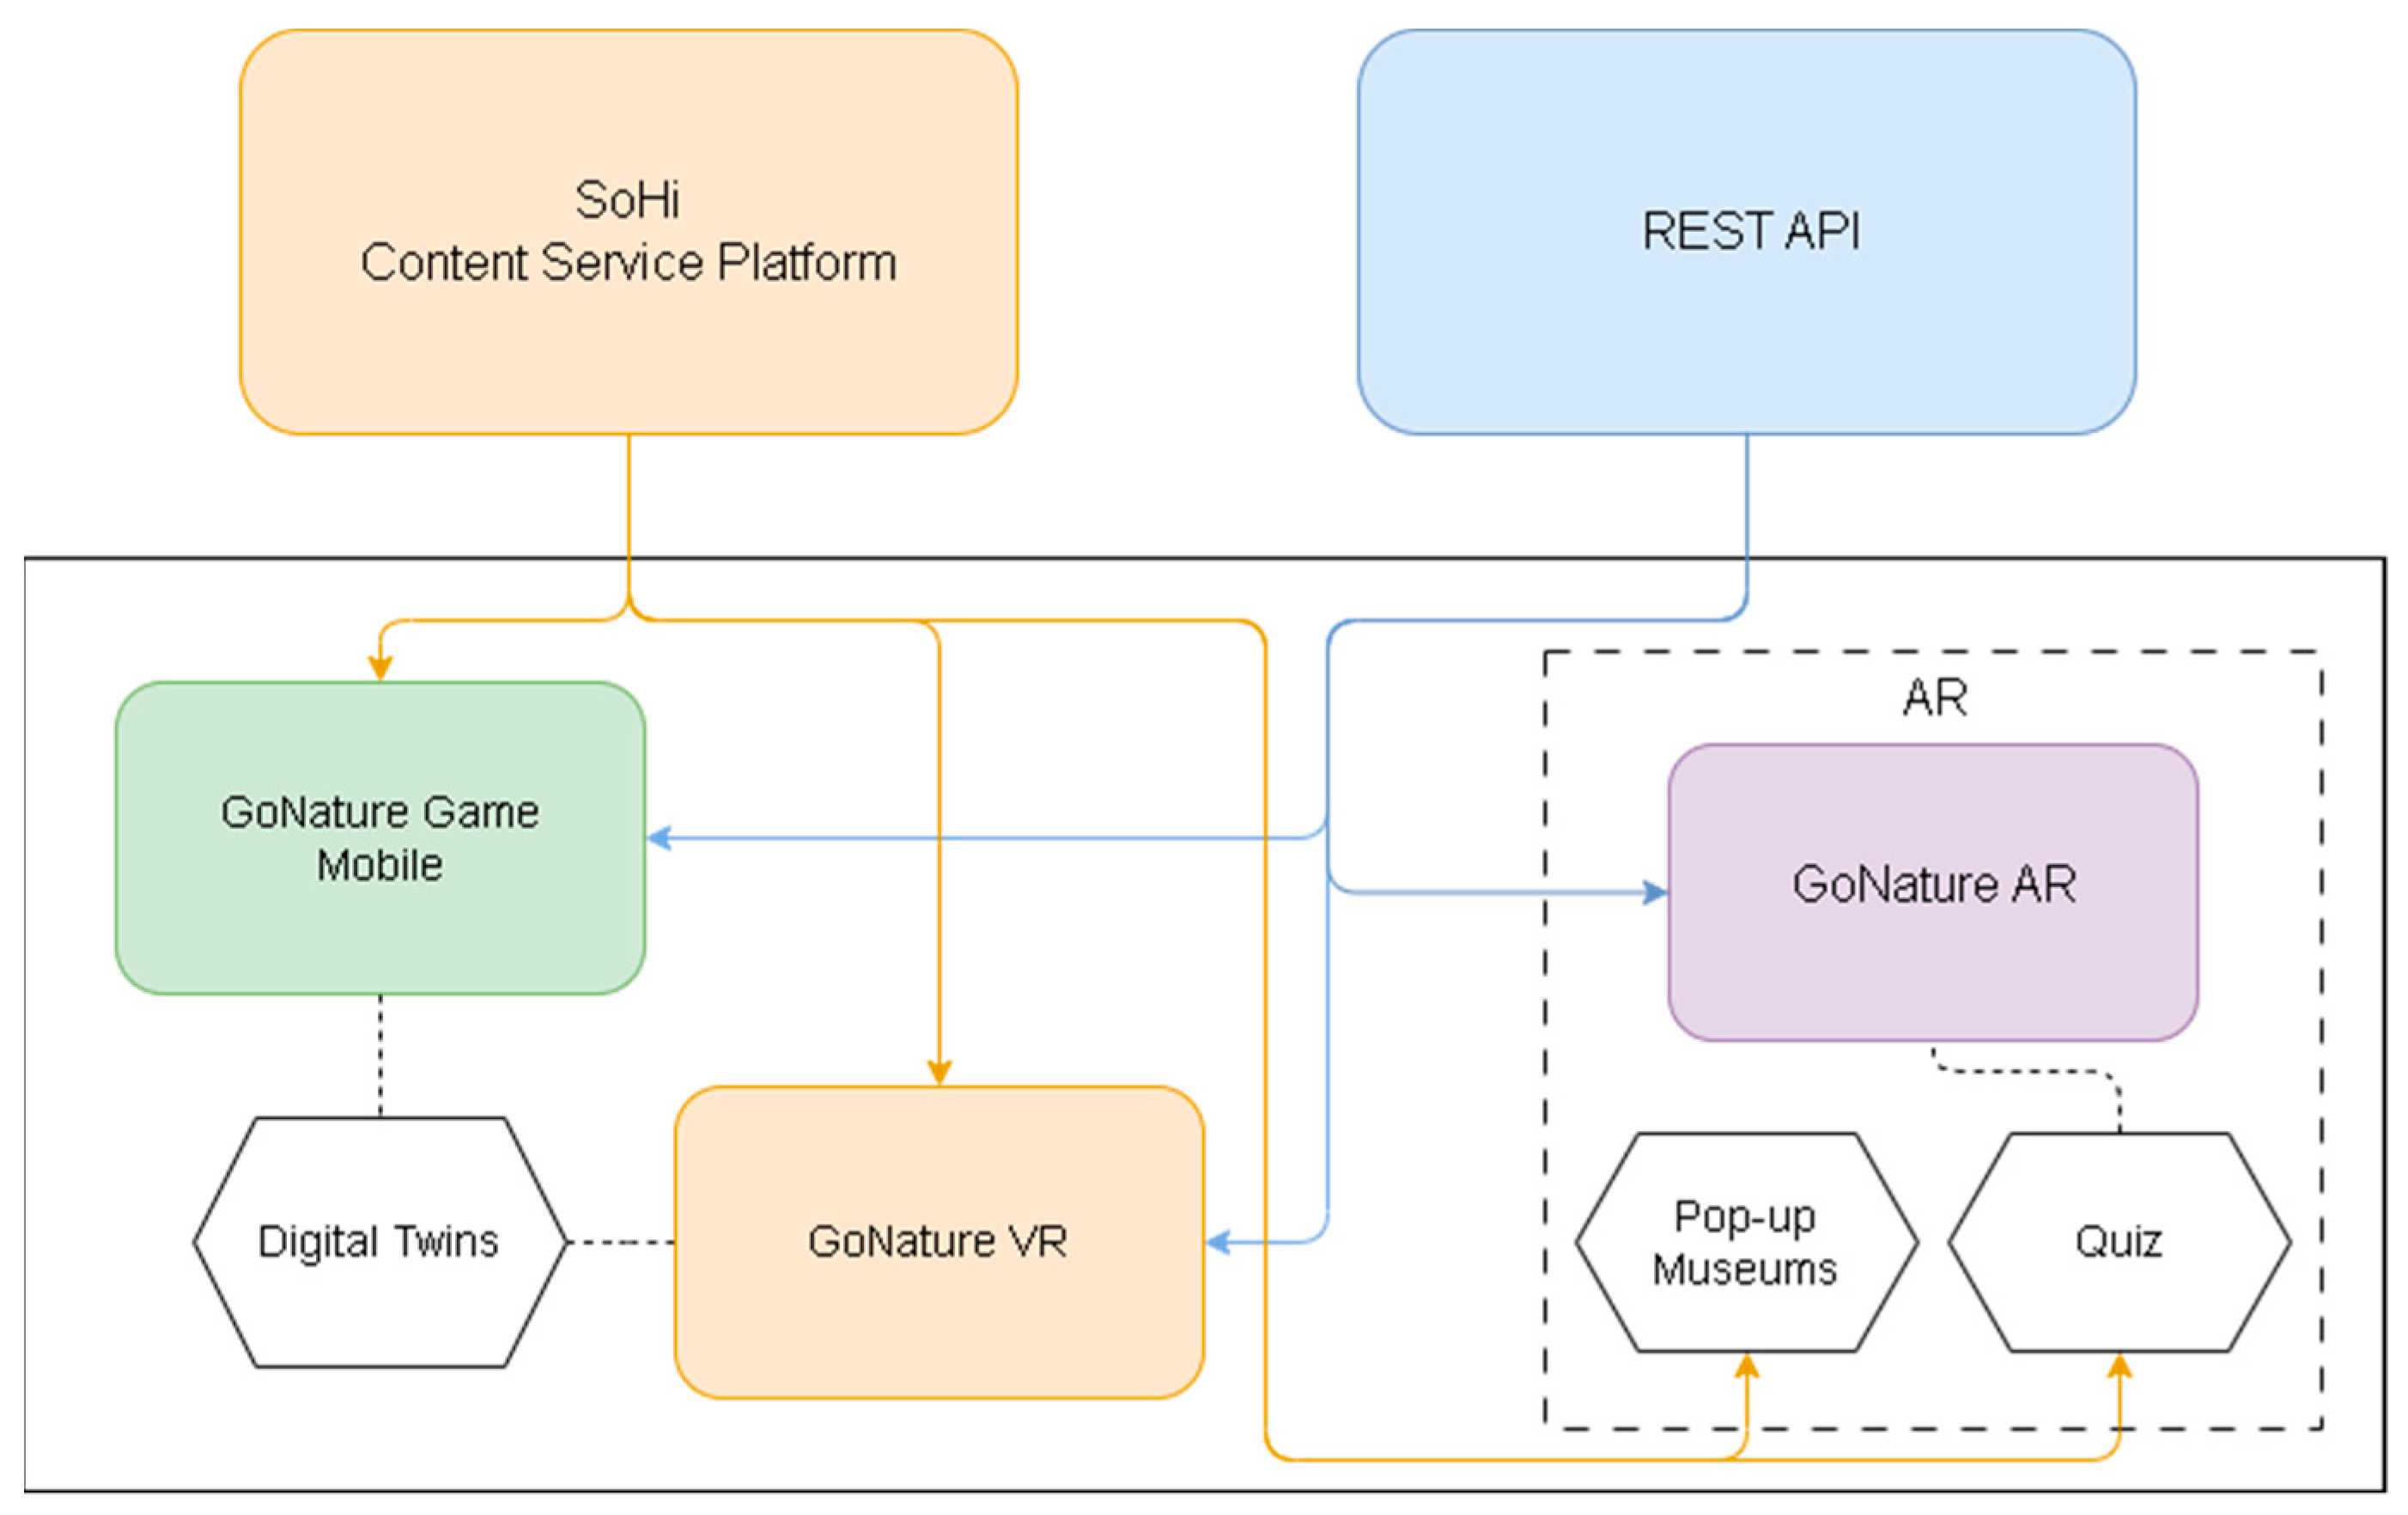
- The central REST-API is a critical component for the interaction of the various items and is described in detail in the next sections.
- The local databases where all data from the seven pilot cities are stored. These local databases provide non-real-time access to the data through an open data platform. The open data platform provides a mechanism to share the collected data with citizens and enables the publication of collected data on the GEOSS portal and the regional and national open data platforms. Through the REST-API real-time data access is also anticipated.
- The health and well-being platform enables the visualization of the collected data.
4. The Physical Layer—Sensors and Apps
4.1. The Sensors’ Specifications
4.2. Apps and Interaction with Citizens
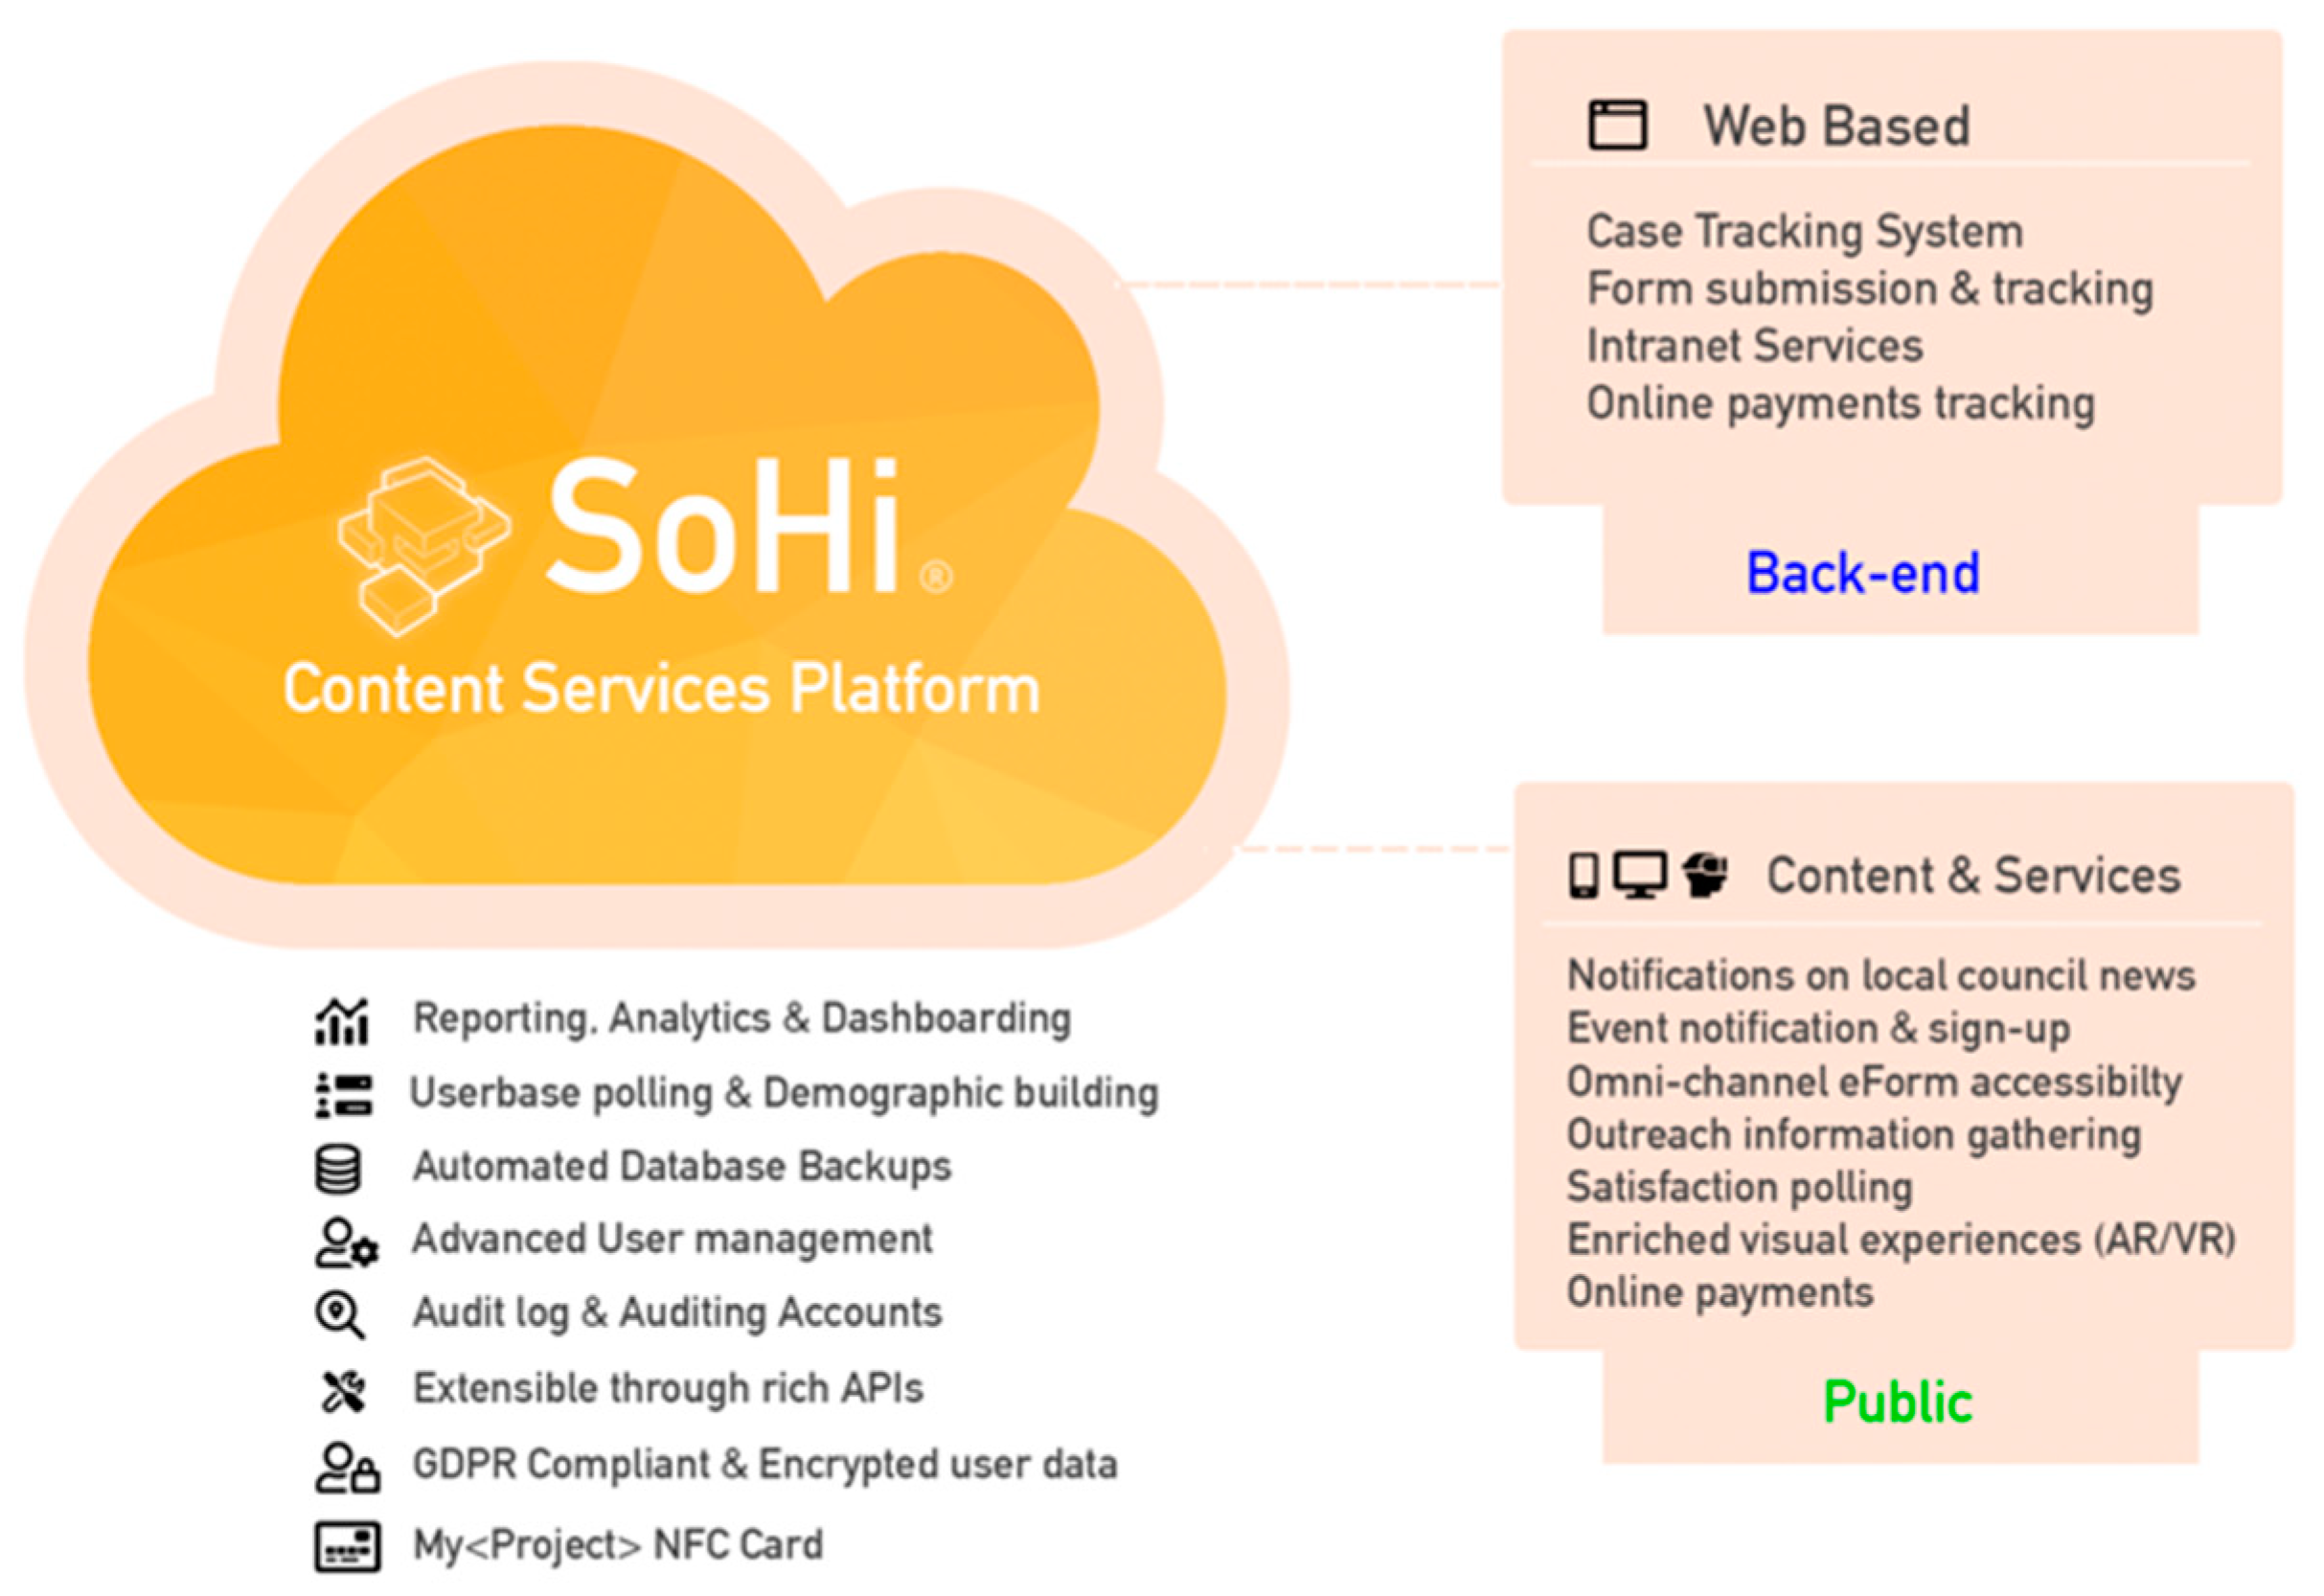
- SoHi platform (Figure 4), which is a content services platform specially designed for specific research that provides a set of tools that allow users to create and publish multimedia content, such as text, images, video, and 3D models as well as mixed reality (MR/VR/AR) experiences. Additionally, this platform also includes tools for content management, allowing users to organize and manage their content easily. The platform also allows for easy publishing, making it simple for users to share their content with a wide audience. The platform is also highly customizable, allowing users to personalize their content and make it truly their own. SoHi offers a unique and dynamic way for users to express themselves and share their ideas with the world.
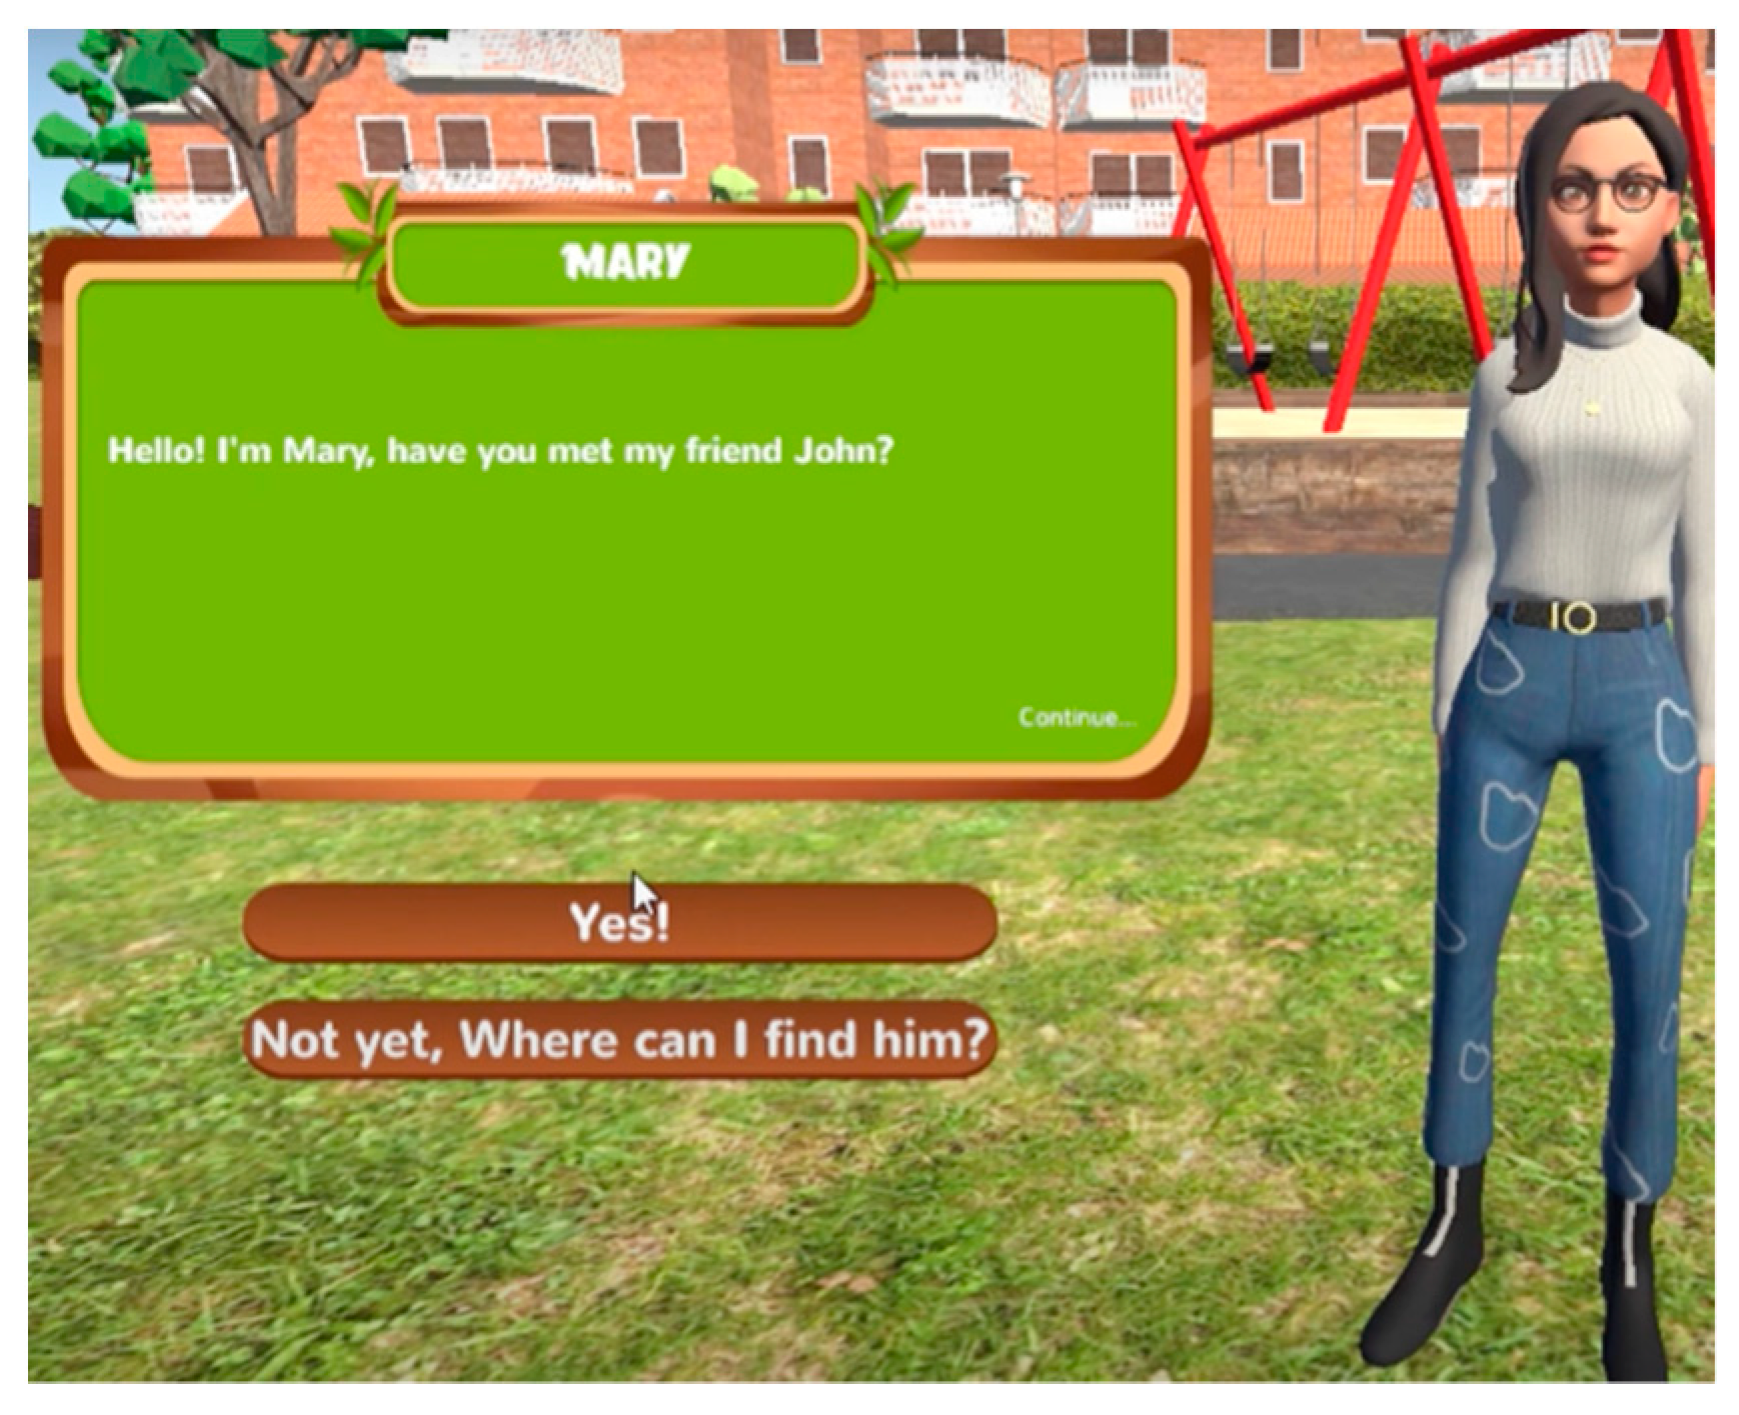
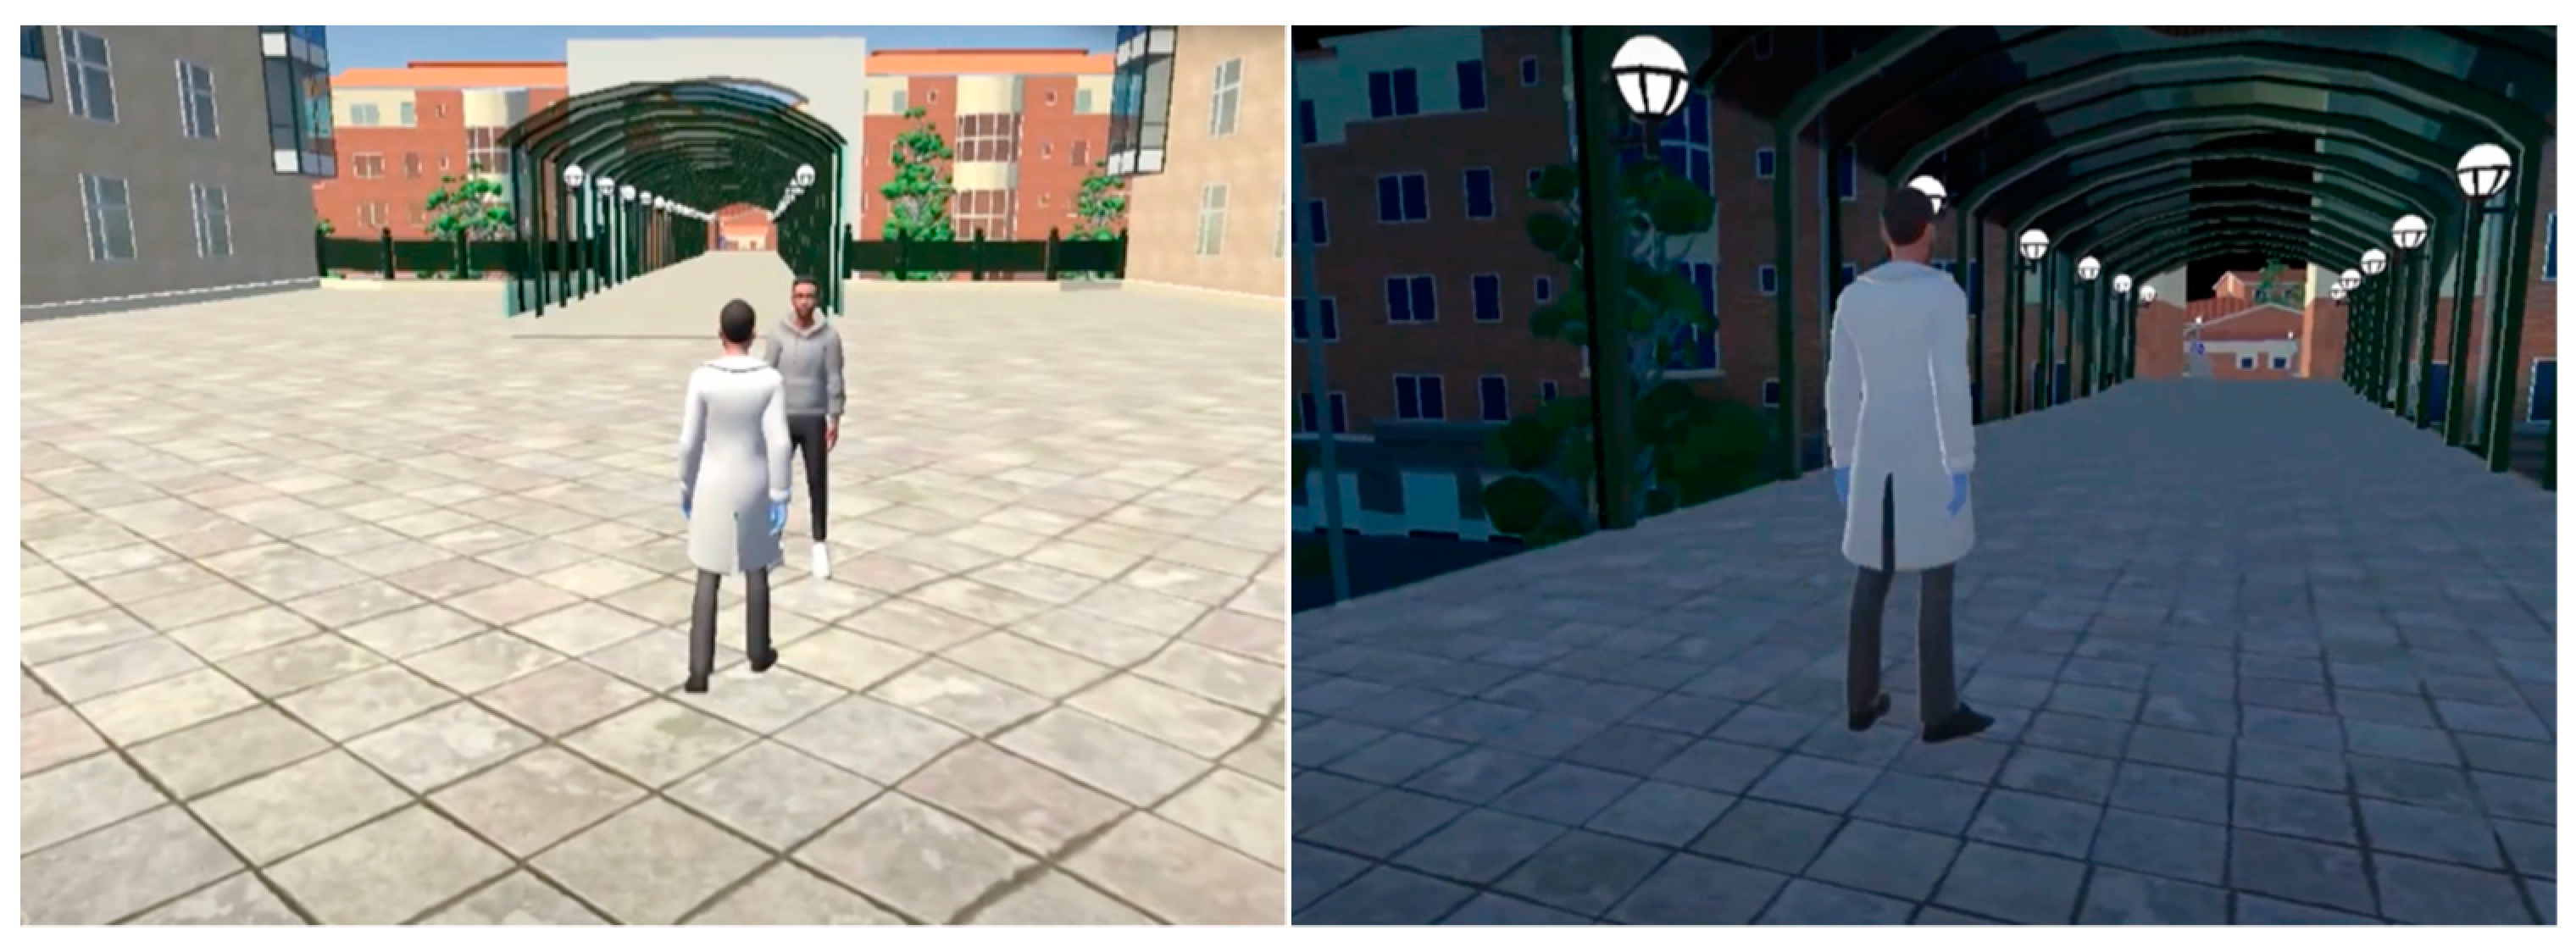
- The GoNature game: The mobile version of the game runs on Android and iOS. Each pilot site has several identified key points of interest (POIs) strategically selected to promote the benefits of public green spaces and their positive effects on health and well-being. These POIs encourage citizens to explore each pilot site physically and virtually through the game. At each POI, citizens interact with non-playable characters (NPCs) using a dialogue system that provides citizens with essential information about environmental phenomena and the advantages of green spaces. The dialogues are both in English and the local language (see Figure 5). Treasure hunts via geocaching are also included. Geocaches are placed in various locations on the pilot sites as points of interest. Apart from being shown informational and educational facts, the players can interact with a virtual representation of the geocache. The idea is to earn reward points for each geocache visited. To gamify the interaction further, interacting with the geocaches grants an item to the player, with each geocache having a unique in-game virtual item. The player’s aim would be to collect all virtual items and take them to a specific location to promote physical activity and pilot site exploration. In doing so, the player would gain bonus points to qualify for a physical gift.
- GoNature VR: The virtual reality version of the game running on a mobile device using Cardboard. To further increase the dissemination power of the application, a VR version is also being worked on, and to lower the entry barrier as much as possible, an affordable platform is chosen, namely Google Cardboard. Google Cardboard is a simple and economical way for users to dive in and explore the immersive experience of virtual reality using their smartphone [42].
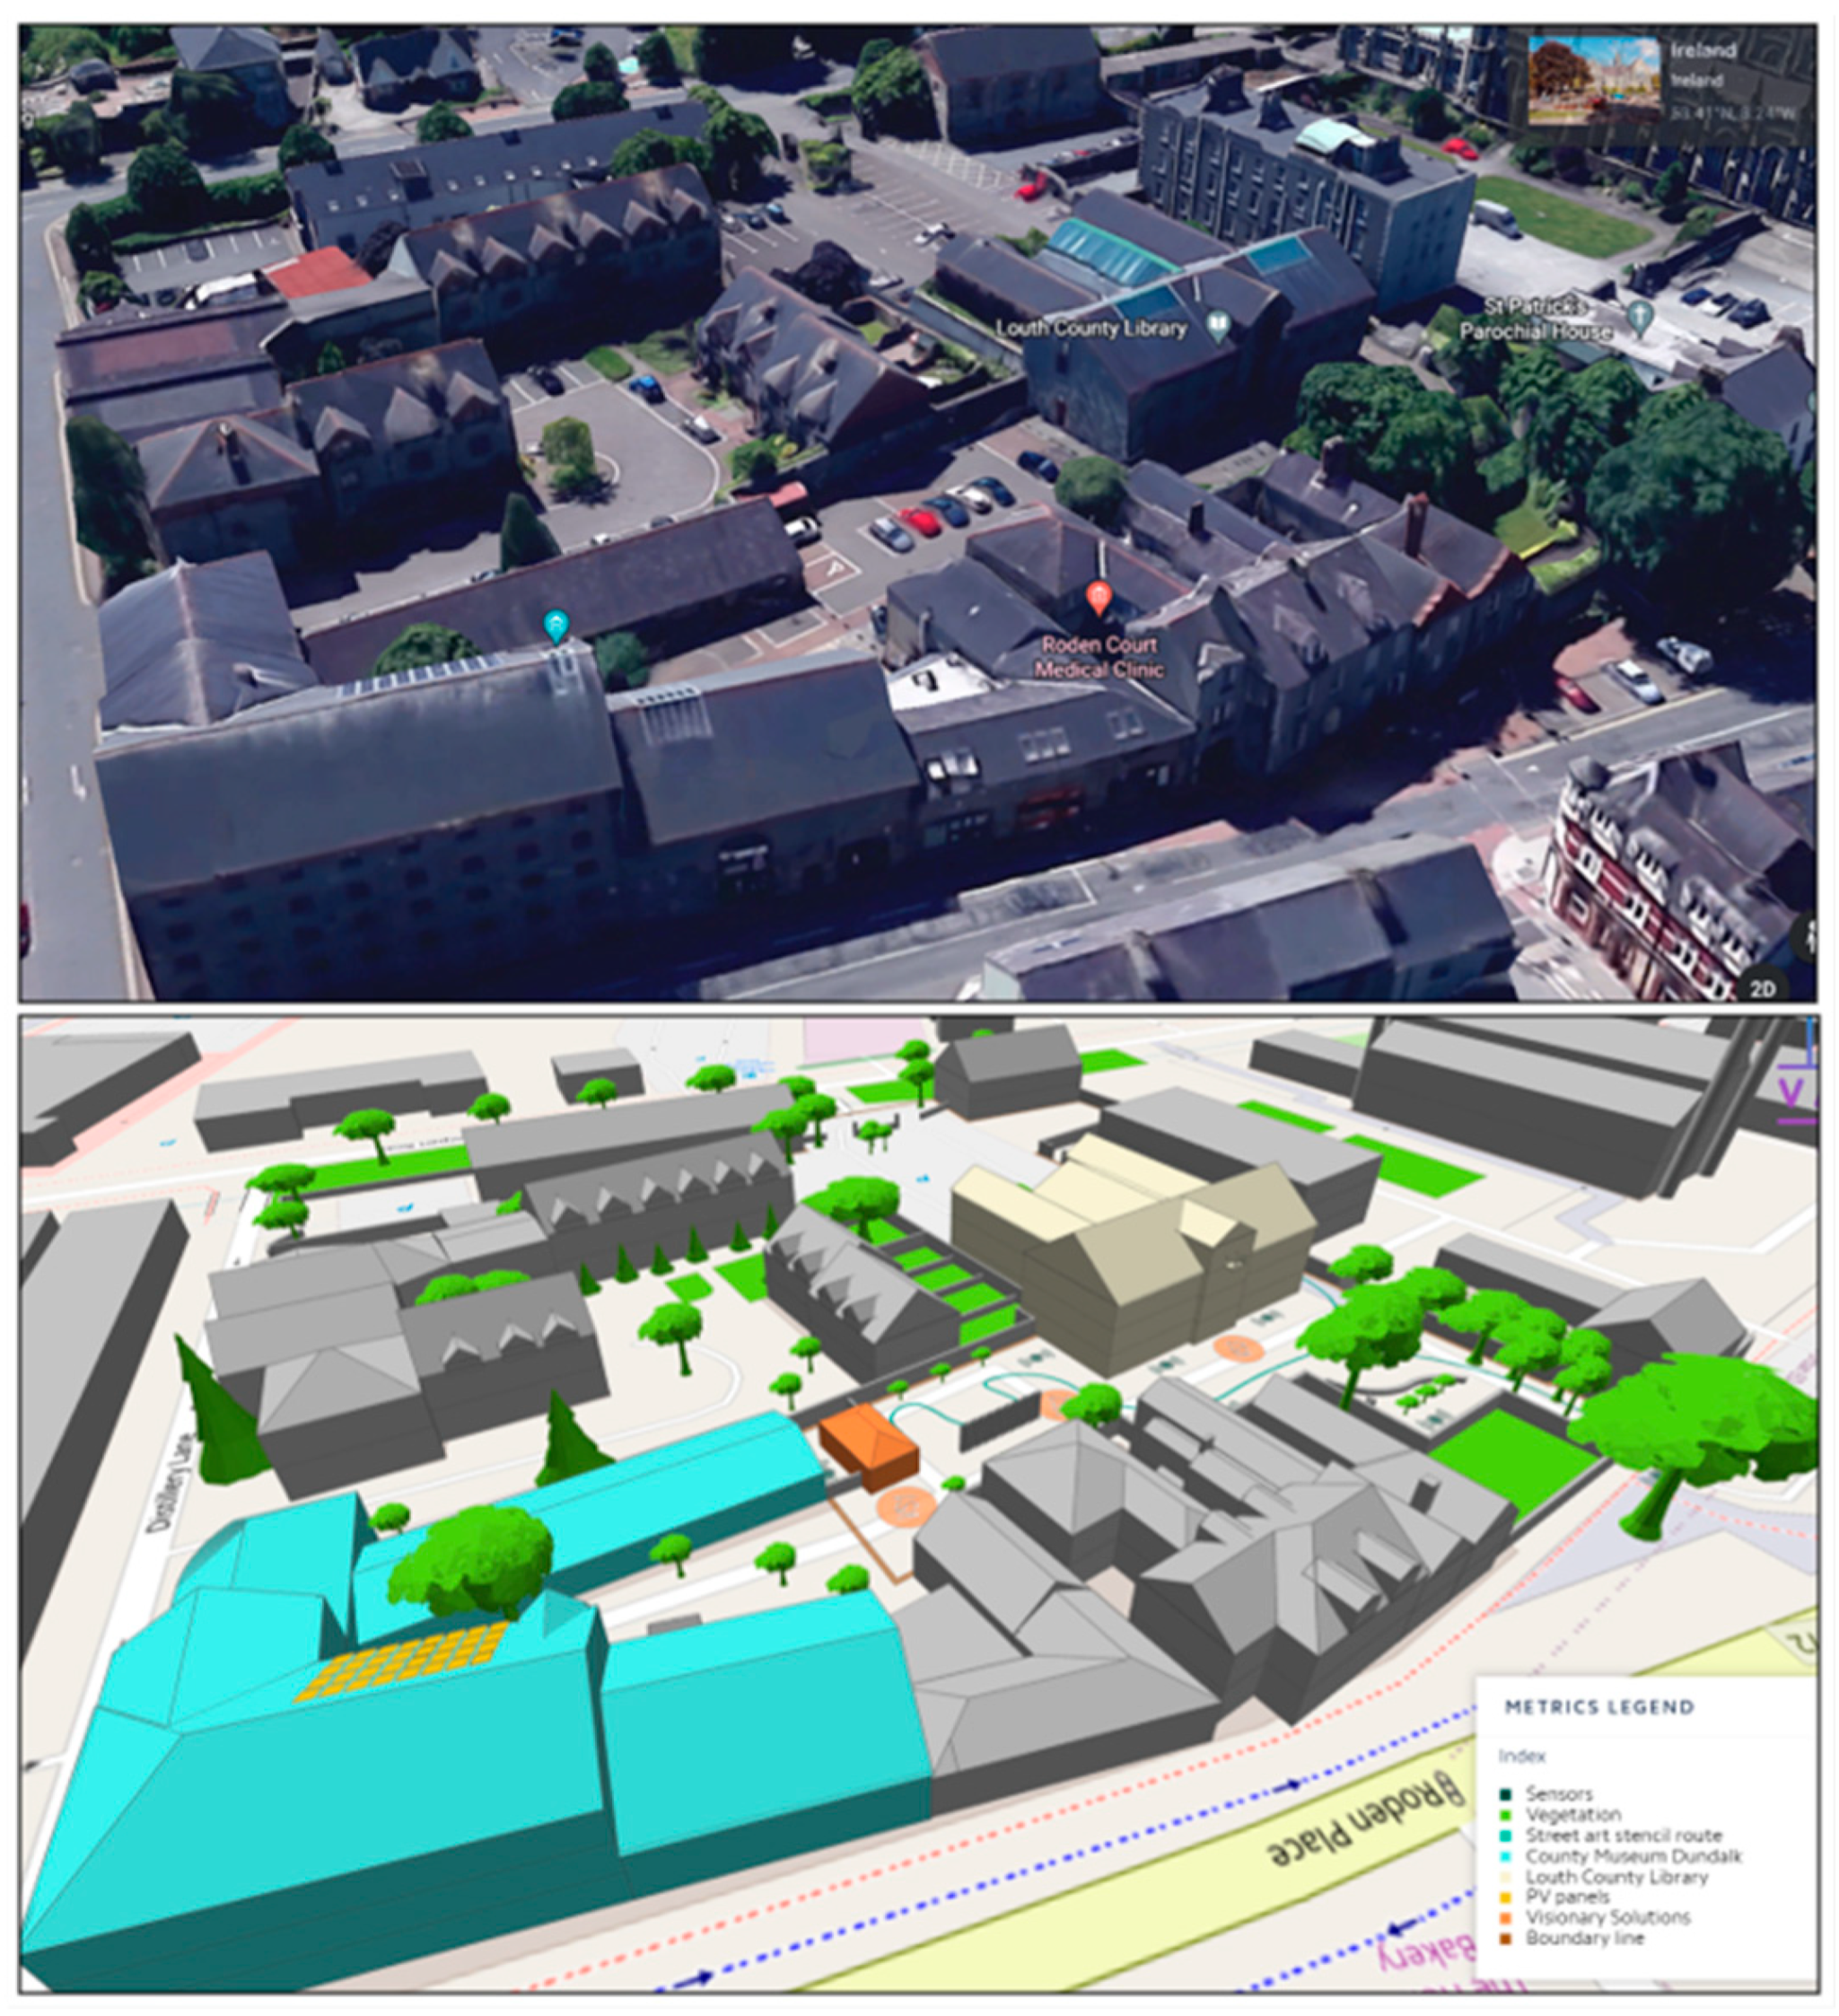
- Digital twins: Digitalization of the pilot sites in a 3D environment that is exploited for both the mobile and VR versions of the game. Digital twins of the pilot sites are created to fulfill the interaction with citizens. Various methods are used to gather reference material, such as online mapping tools and satellite imagery. GIS and LiDAR data were also exploited and used to further enhance models by providing a high degree of accuracy and realism. Digital twins, apart from the 3D digitization of the pilot areas, provide a layer on top of the 3D geometry, which is the real-time status of the area, and their respective metrics regarding air, noise, and temperature conditions. These data received through REST API affect both the Mobile and VR experience. Indicative images from the sites and their digital twins are depicted in Table 3. The daytime and nighttime cycle of the VR game is illustrated in Figure 6.
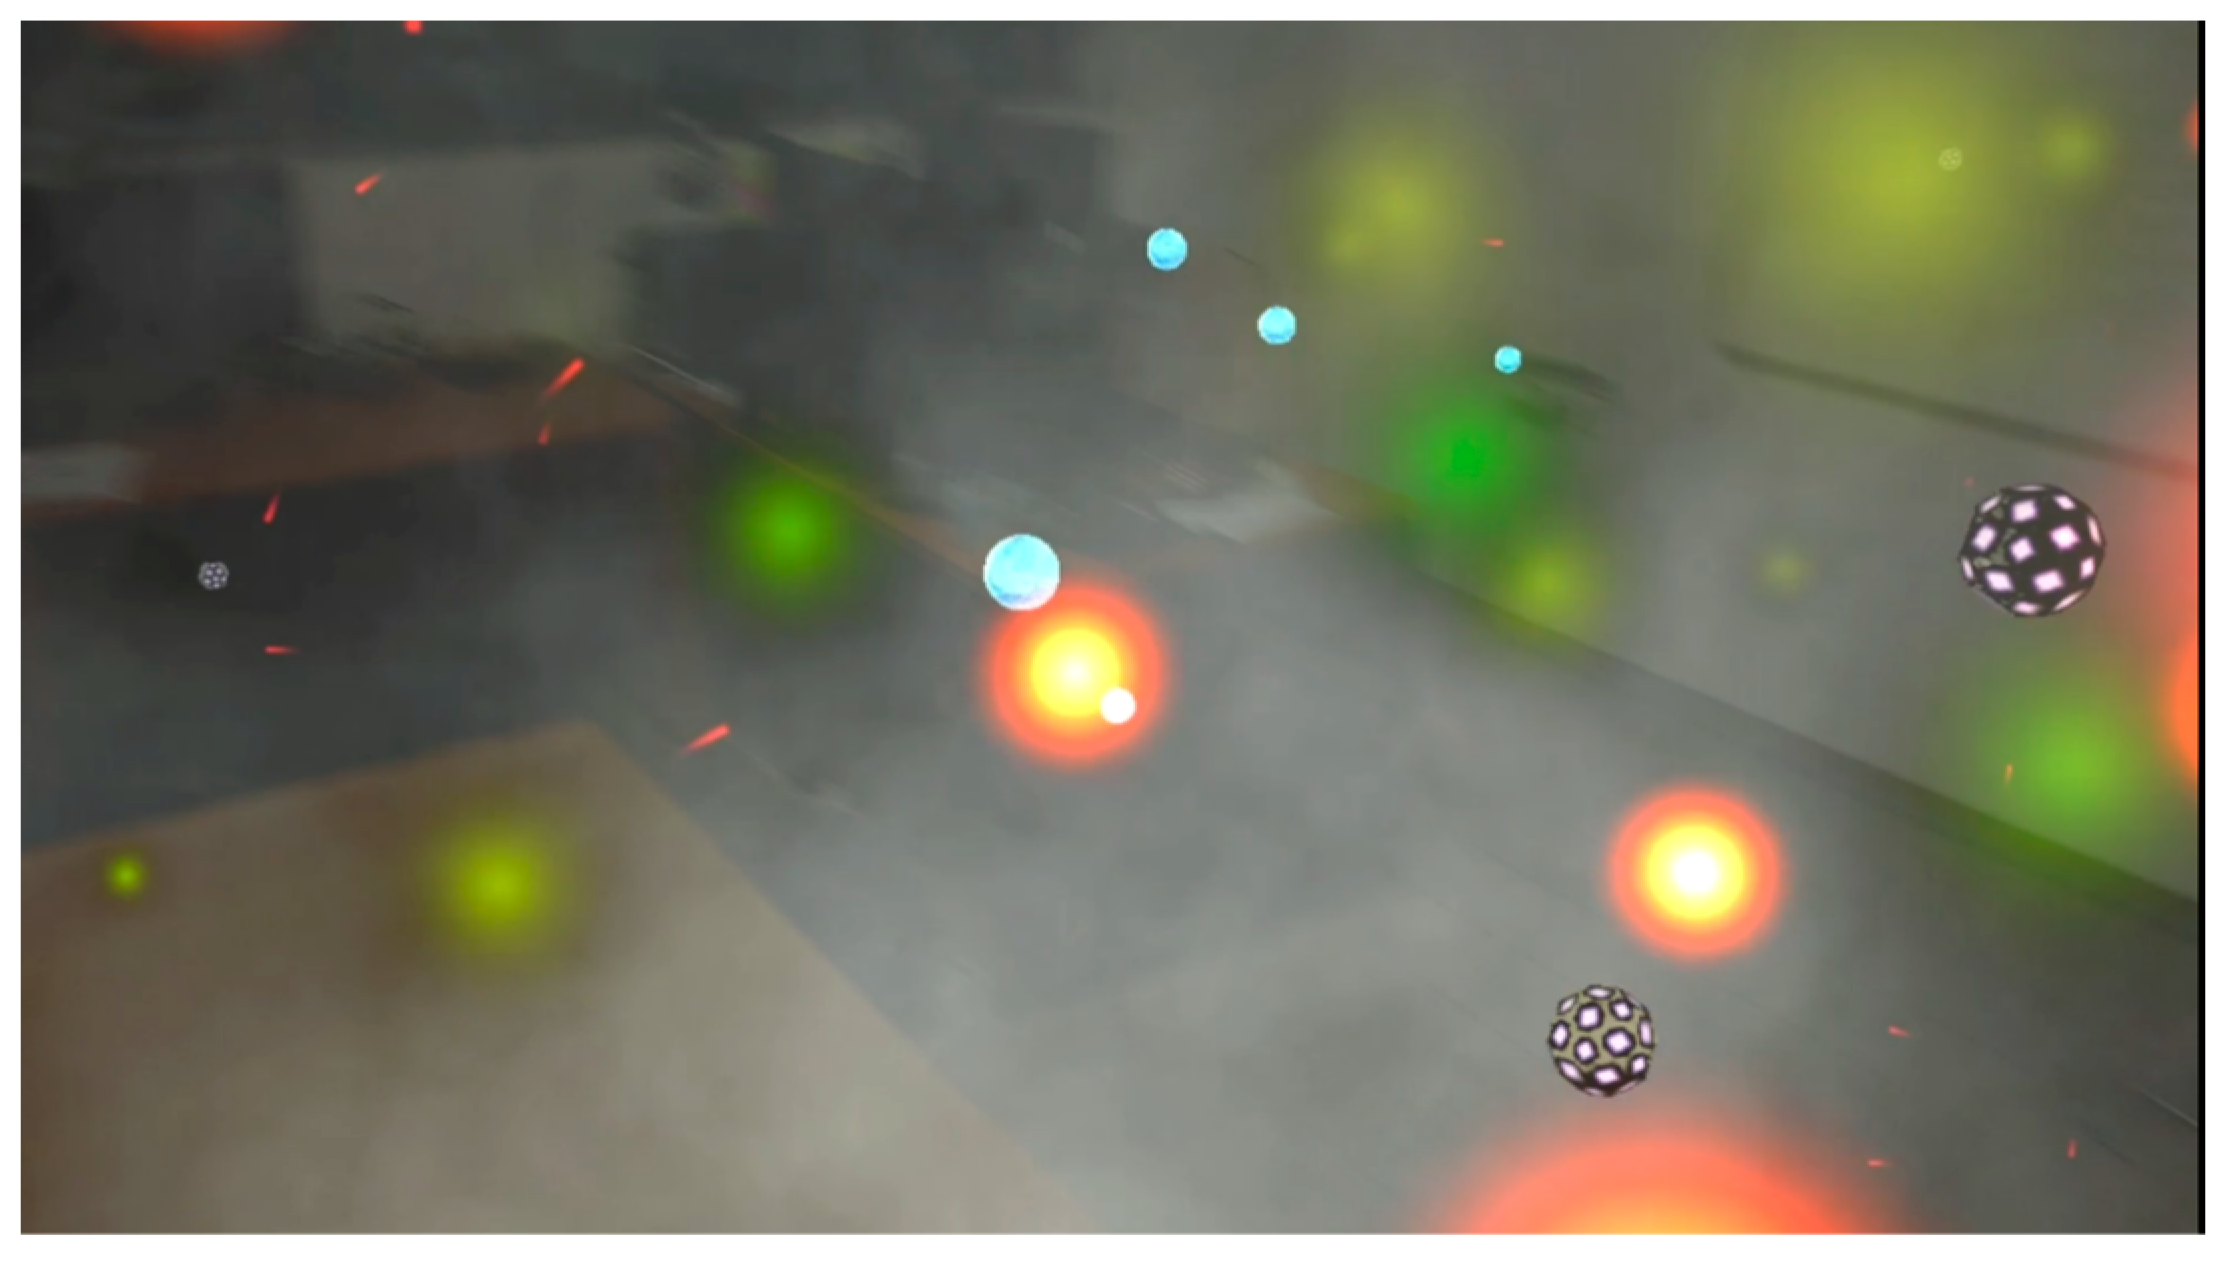
- GoNature AR: An augmented reality gamified experience running on Hololens2 headsets (57). The AR version allows the game to interface with the physical world and provides an immersive, emotion-provoking experience. HoloLens 2 is selected to deliver the augmented reality experience. HoloLens 2 provides a hands-free experience, including multimodal interactions such as eye-gaze, voice, and hands or gestures, enhancing immersion and allowing for further research on interactions in a mixed reality environment [43]. GoNature AR is a multimodal augmented reality narration story that guides the user through an immersive audio-visual experience in which the user becomes aware of environmental phenomena and their consequences for human health and well-being. In this narration, the user follows a virtual companion through three different visualization scenarios (air pollution, noise exposure, and thermal comfort). The visualization scenarios are dynamically affected by the sensor metrics the app receives through REST API for the specific location.
- AR Quiz: A quiz system for fast implementation of AR-enabled quizzes.
- Pop-up museums: An AR system for fast virtual museum/gallery implementation using 3D virtual objects and video or text annotations. The specific functionality is connected with the SoHi platform and is designed to bring virtual objects of various categories into the real world and provide immersive visualization. It can be used both for cultural promotion and education for all pilots.
5. The Sensor Management Platform
6. The Representational State Transfer Applications Interface (REST API)
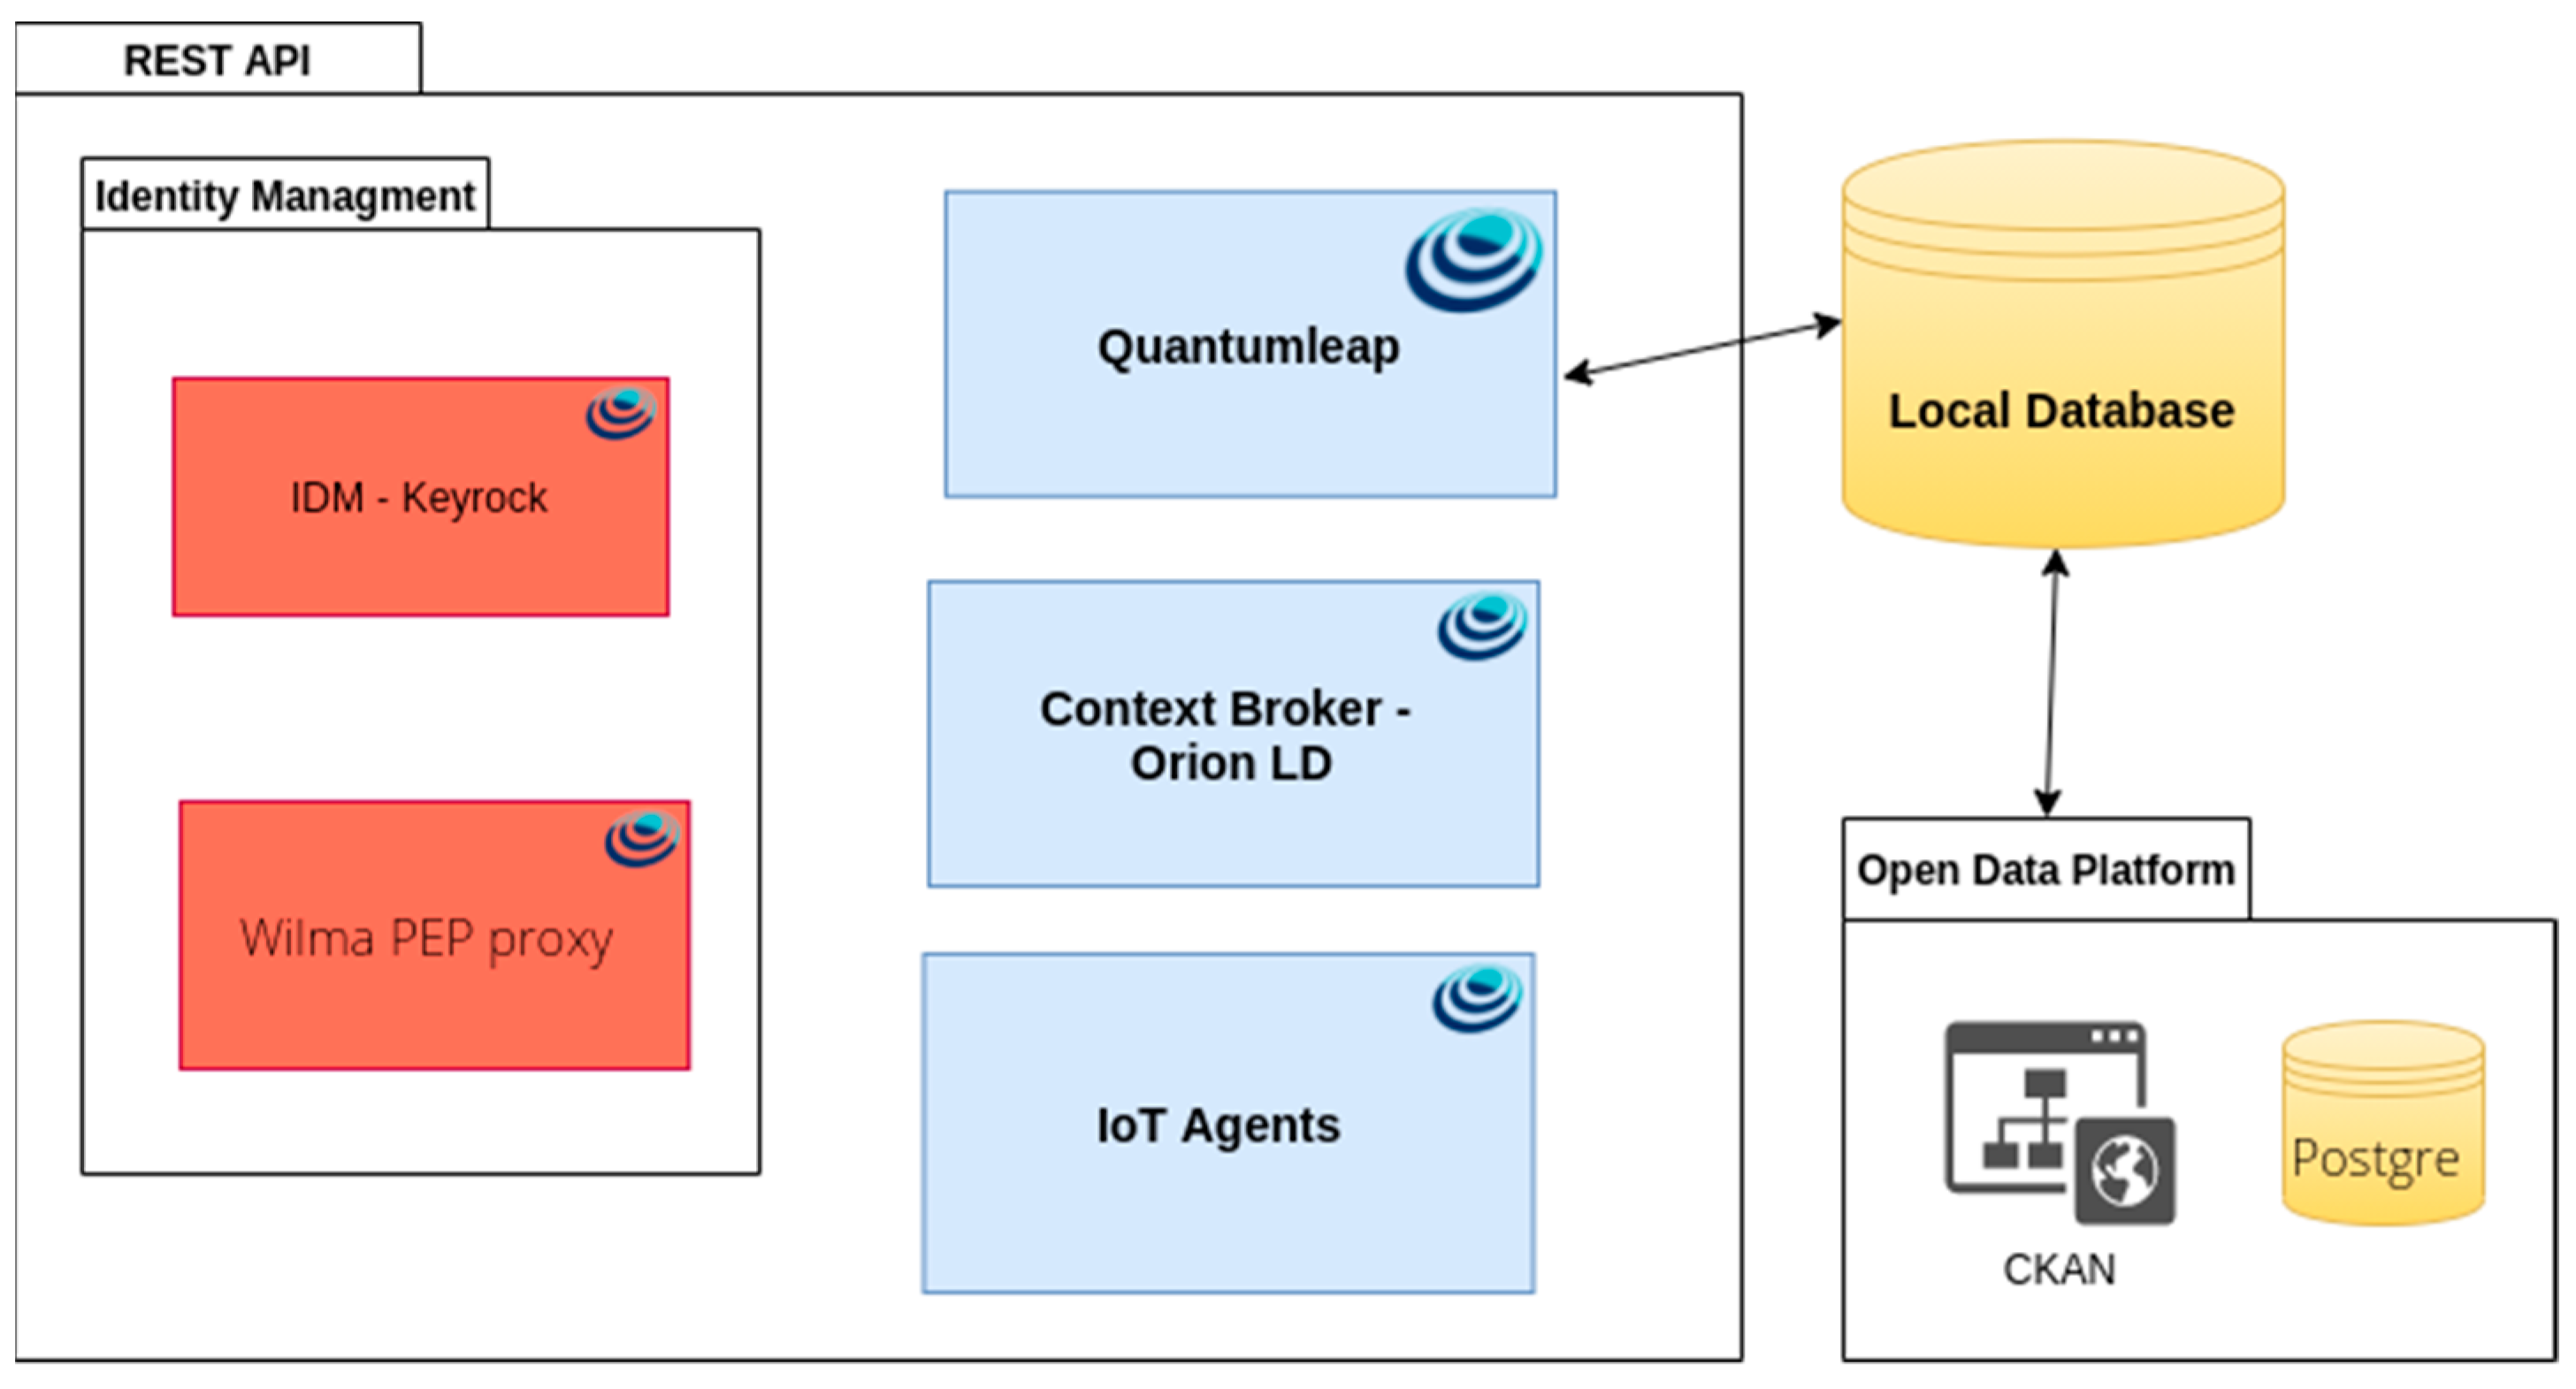
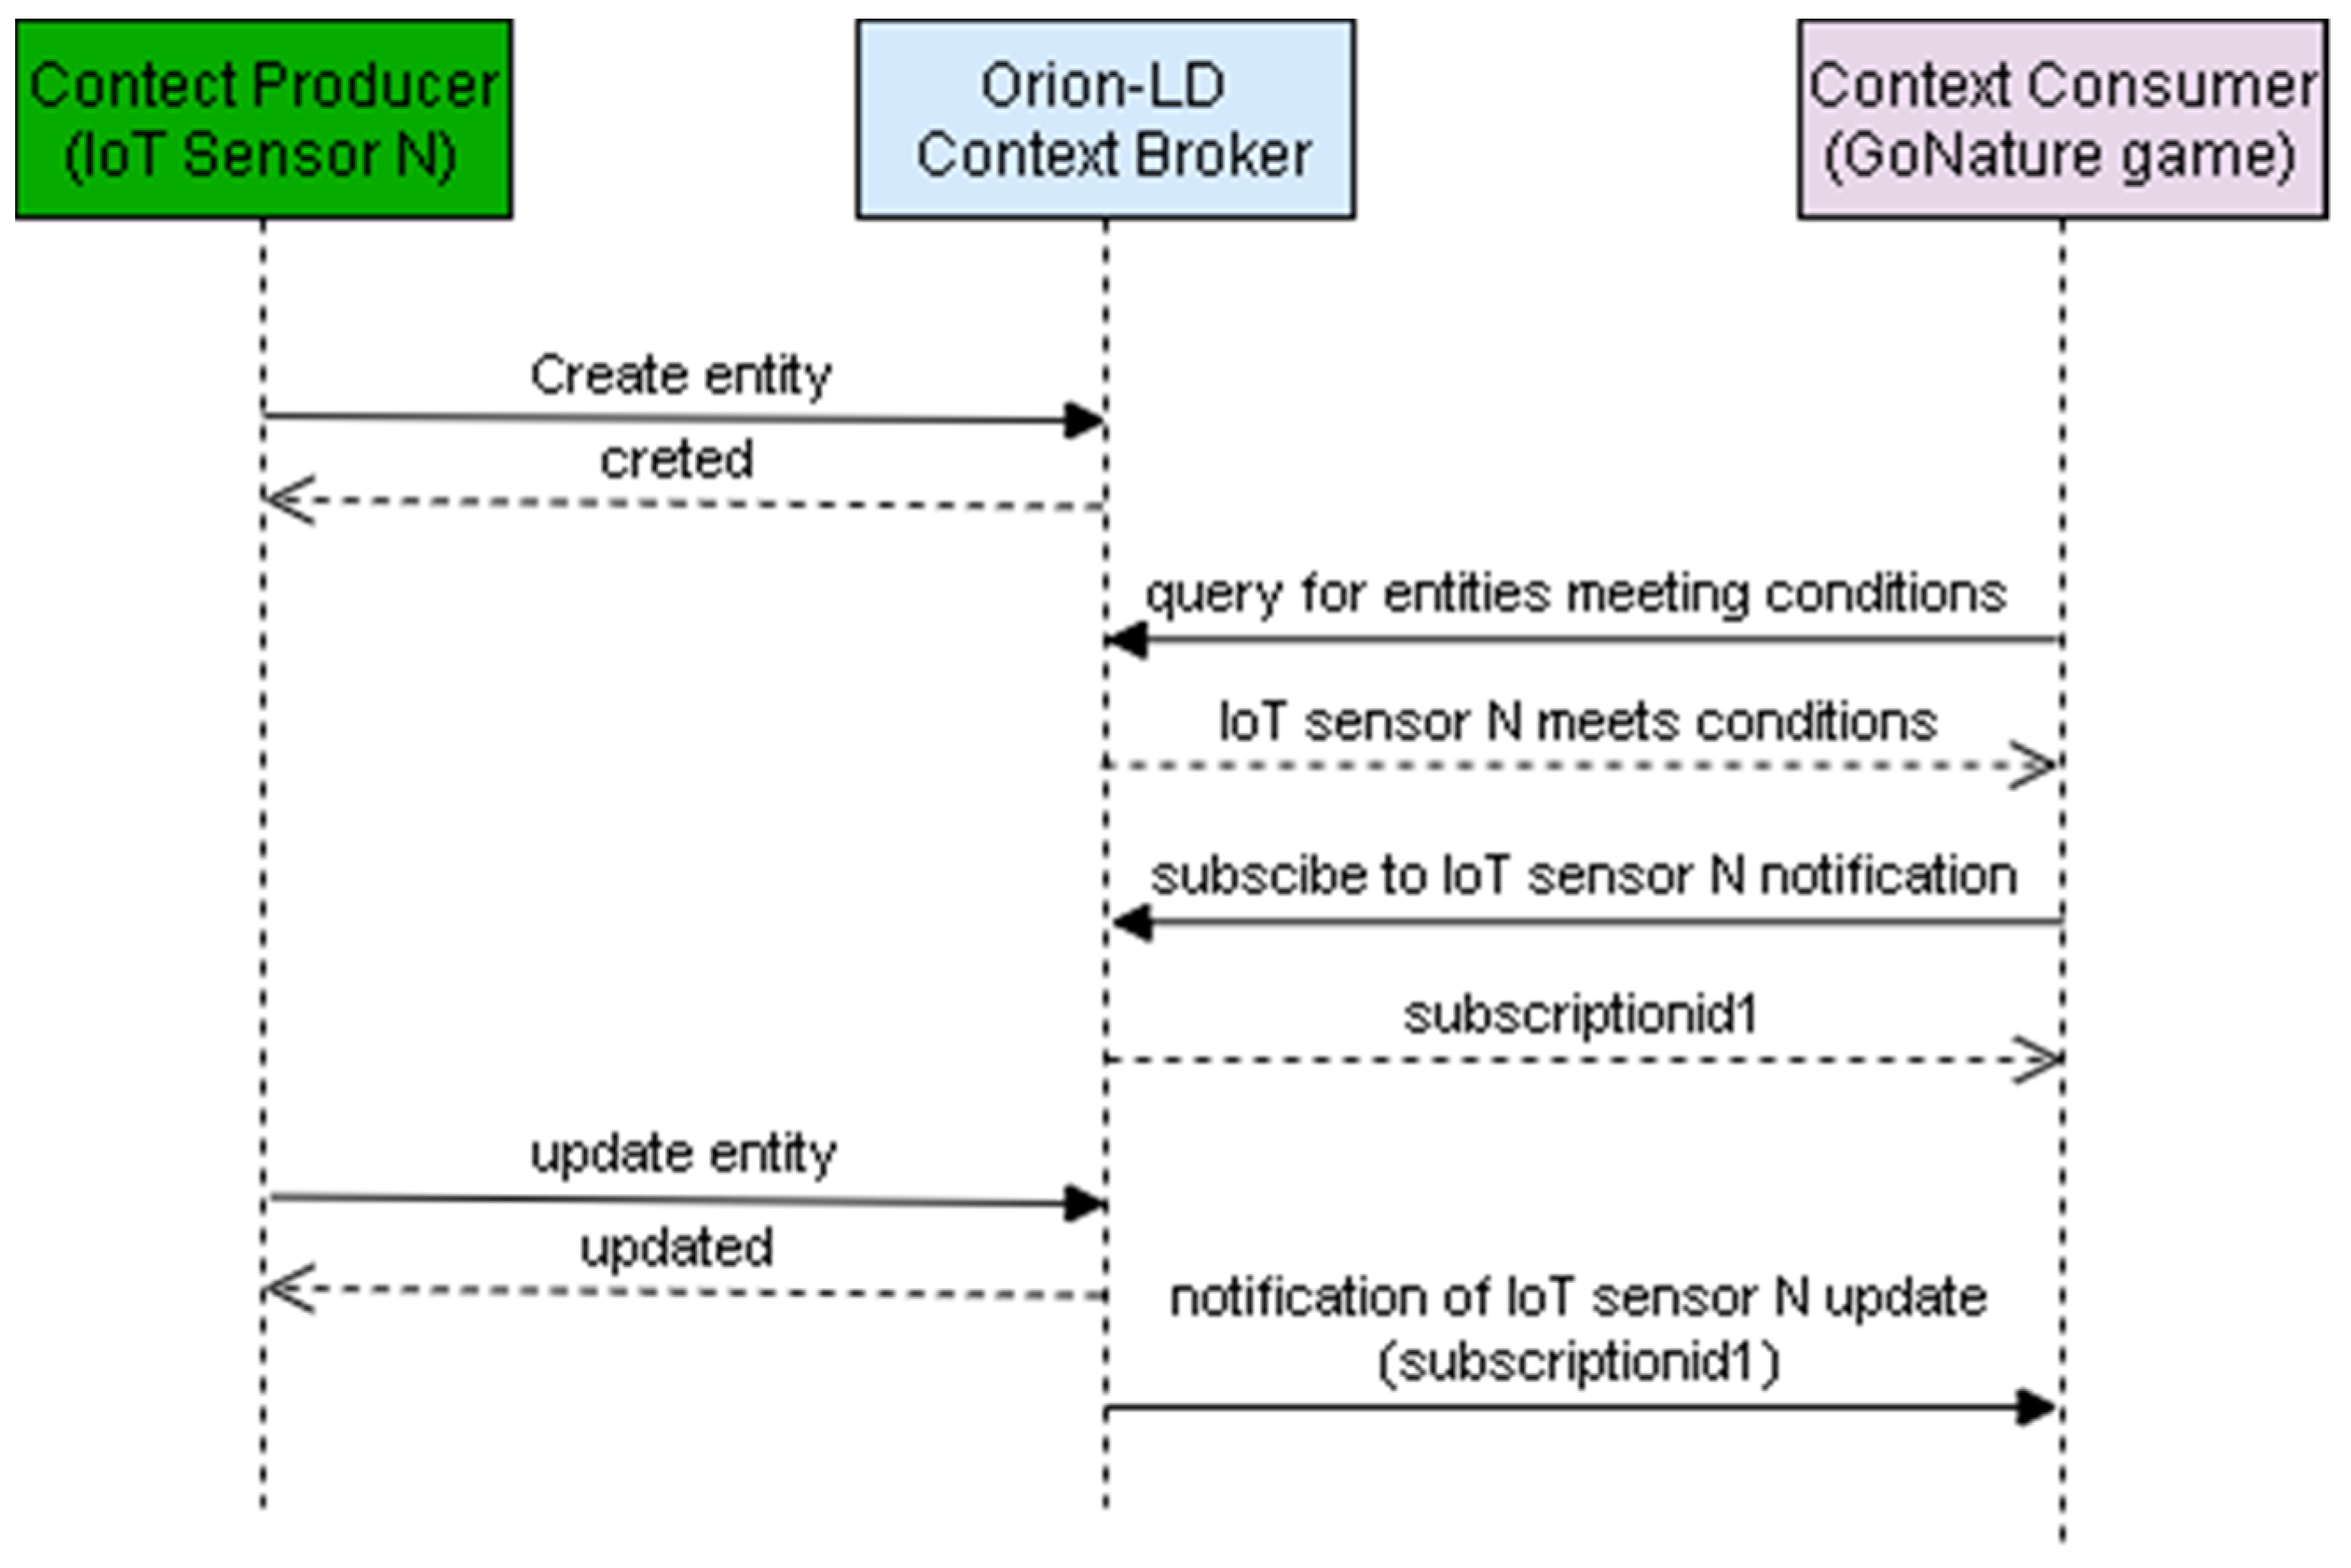
- Context broker—Orion LD
- Identity management
- IoT agents connected to sensor network (IP, TTN). (see Figure 2)
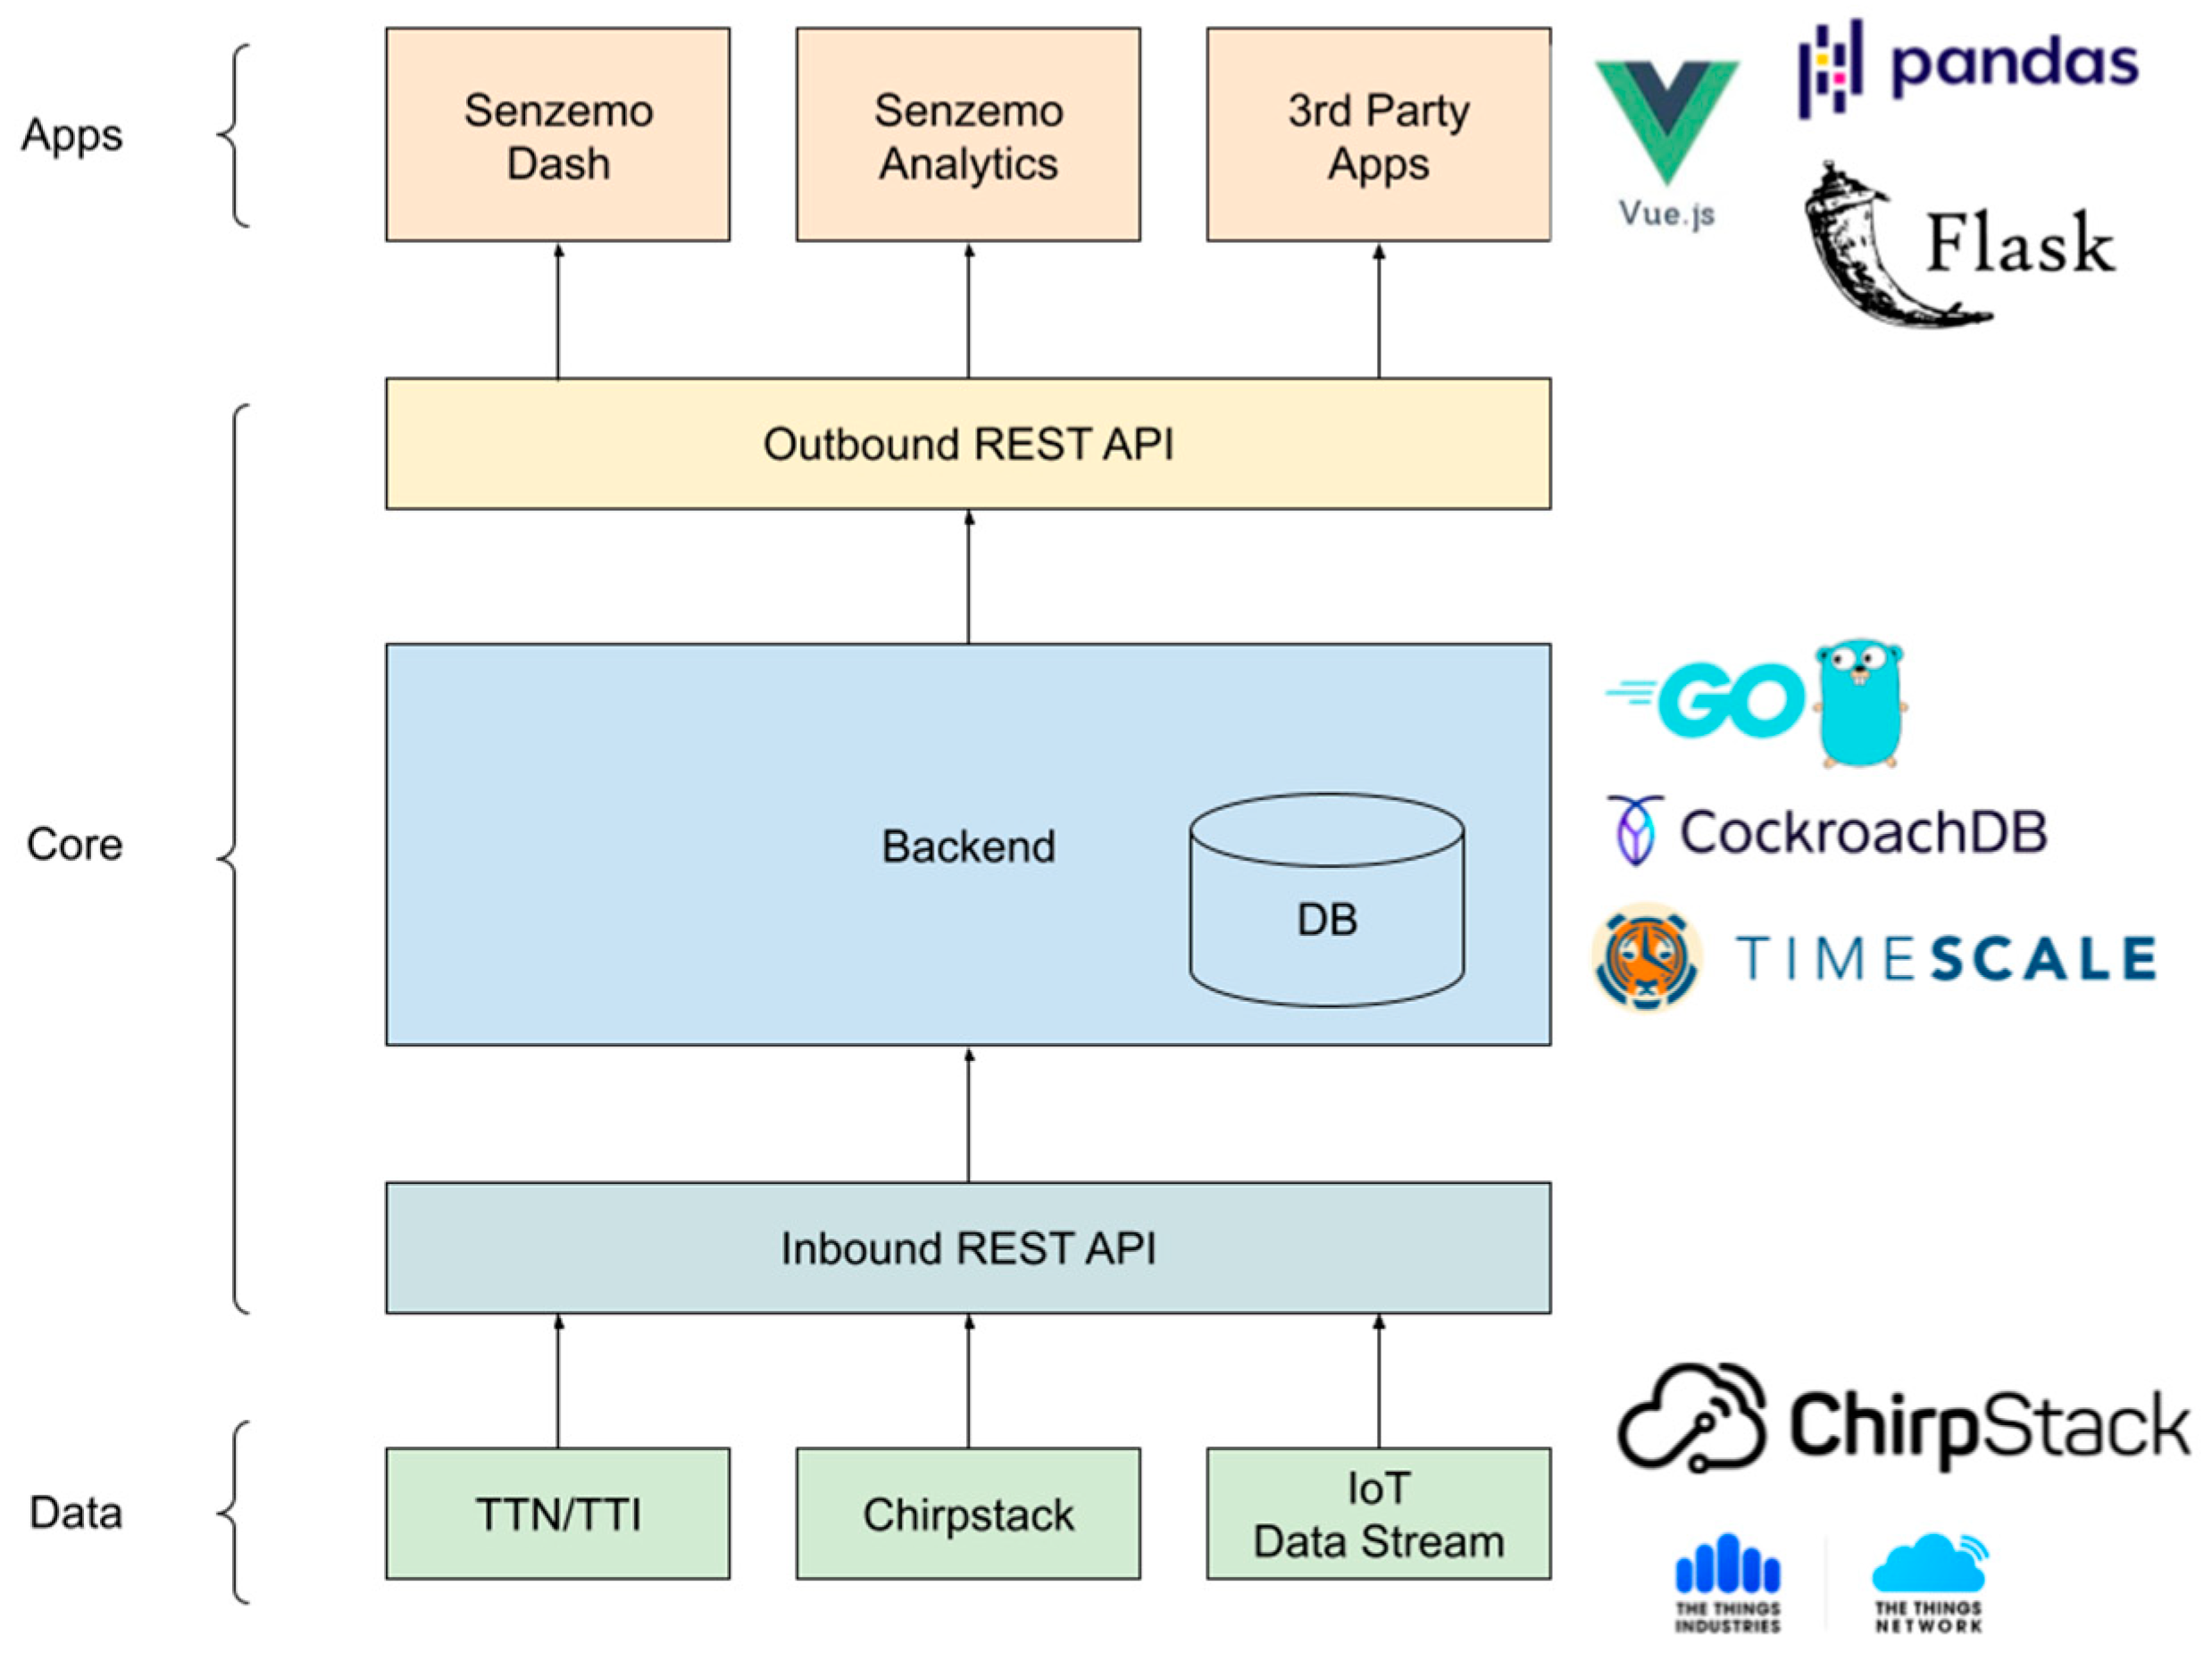
- QuantumLeap which is connected to the local databases.
7. The Local Databases
- Many data and information originally required by the pilot characterization templates are unavailable at the city or pilot area scales, nor are they disaggregated according to gender and other diversity criteria (e.g., age, ethnicity).
- The monitoring of the impacts of the prospected solutions on the regulation of the micro-climate will be of particular interest in pilots presenting extreme weather/thermal conditions (e.g., Castelfranco Veneto, Gzira, and Chania are characterized by the hottest temperatures, intense urban heat islands, and long periods of strong thermal stress during summertime).
- The previous experiences of pilot cities in the implementation of NBSs are rather diverse: Leuven had the most extensive experience with many different types of NBSs, while Gzira reported no past experiences. Novo Mesto indicated only planting trees (the most elementary and often implemented NBS). Skellefteå and Castelfranco had a limited number of experiences, while Dundalk and Chania had moderate experience.
- Skellefteå, Dundalk, Novo Mesto, Chania, and Leuven are strongly experienced in smart city solutions in many fields (energy, mobility, and information and communication technology—ICT). Castelfranco Veneto and Gzira are the pilot cities with the least experience in smart city innovations.
- Among the major socio-economic challenges cited by the pilots, the most recurrent ones are improving dedicated services and social engagement for elderly people due to a rapidly aging population, increasing the attractiveness and inclusiveness of the cities, and addressing gentrification processes or the segregation of unfavored groups (such as immigrants and low-income residents). Despite the quite different socio-economic conditions, the pilots could work together towards similar goals and possibly share methods and solutions.
8. The Health and Well-Being Platform and Key Performance Indicators
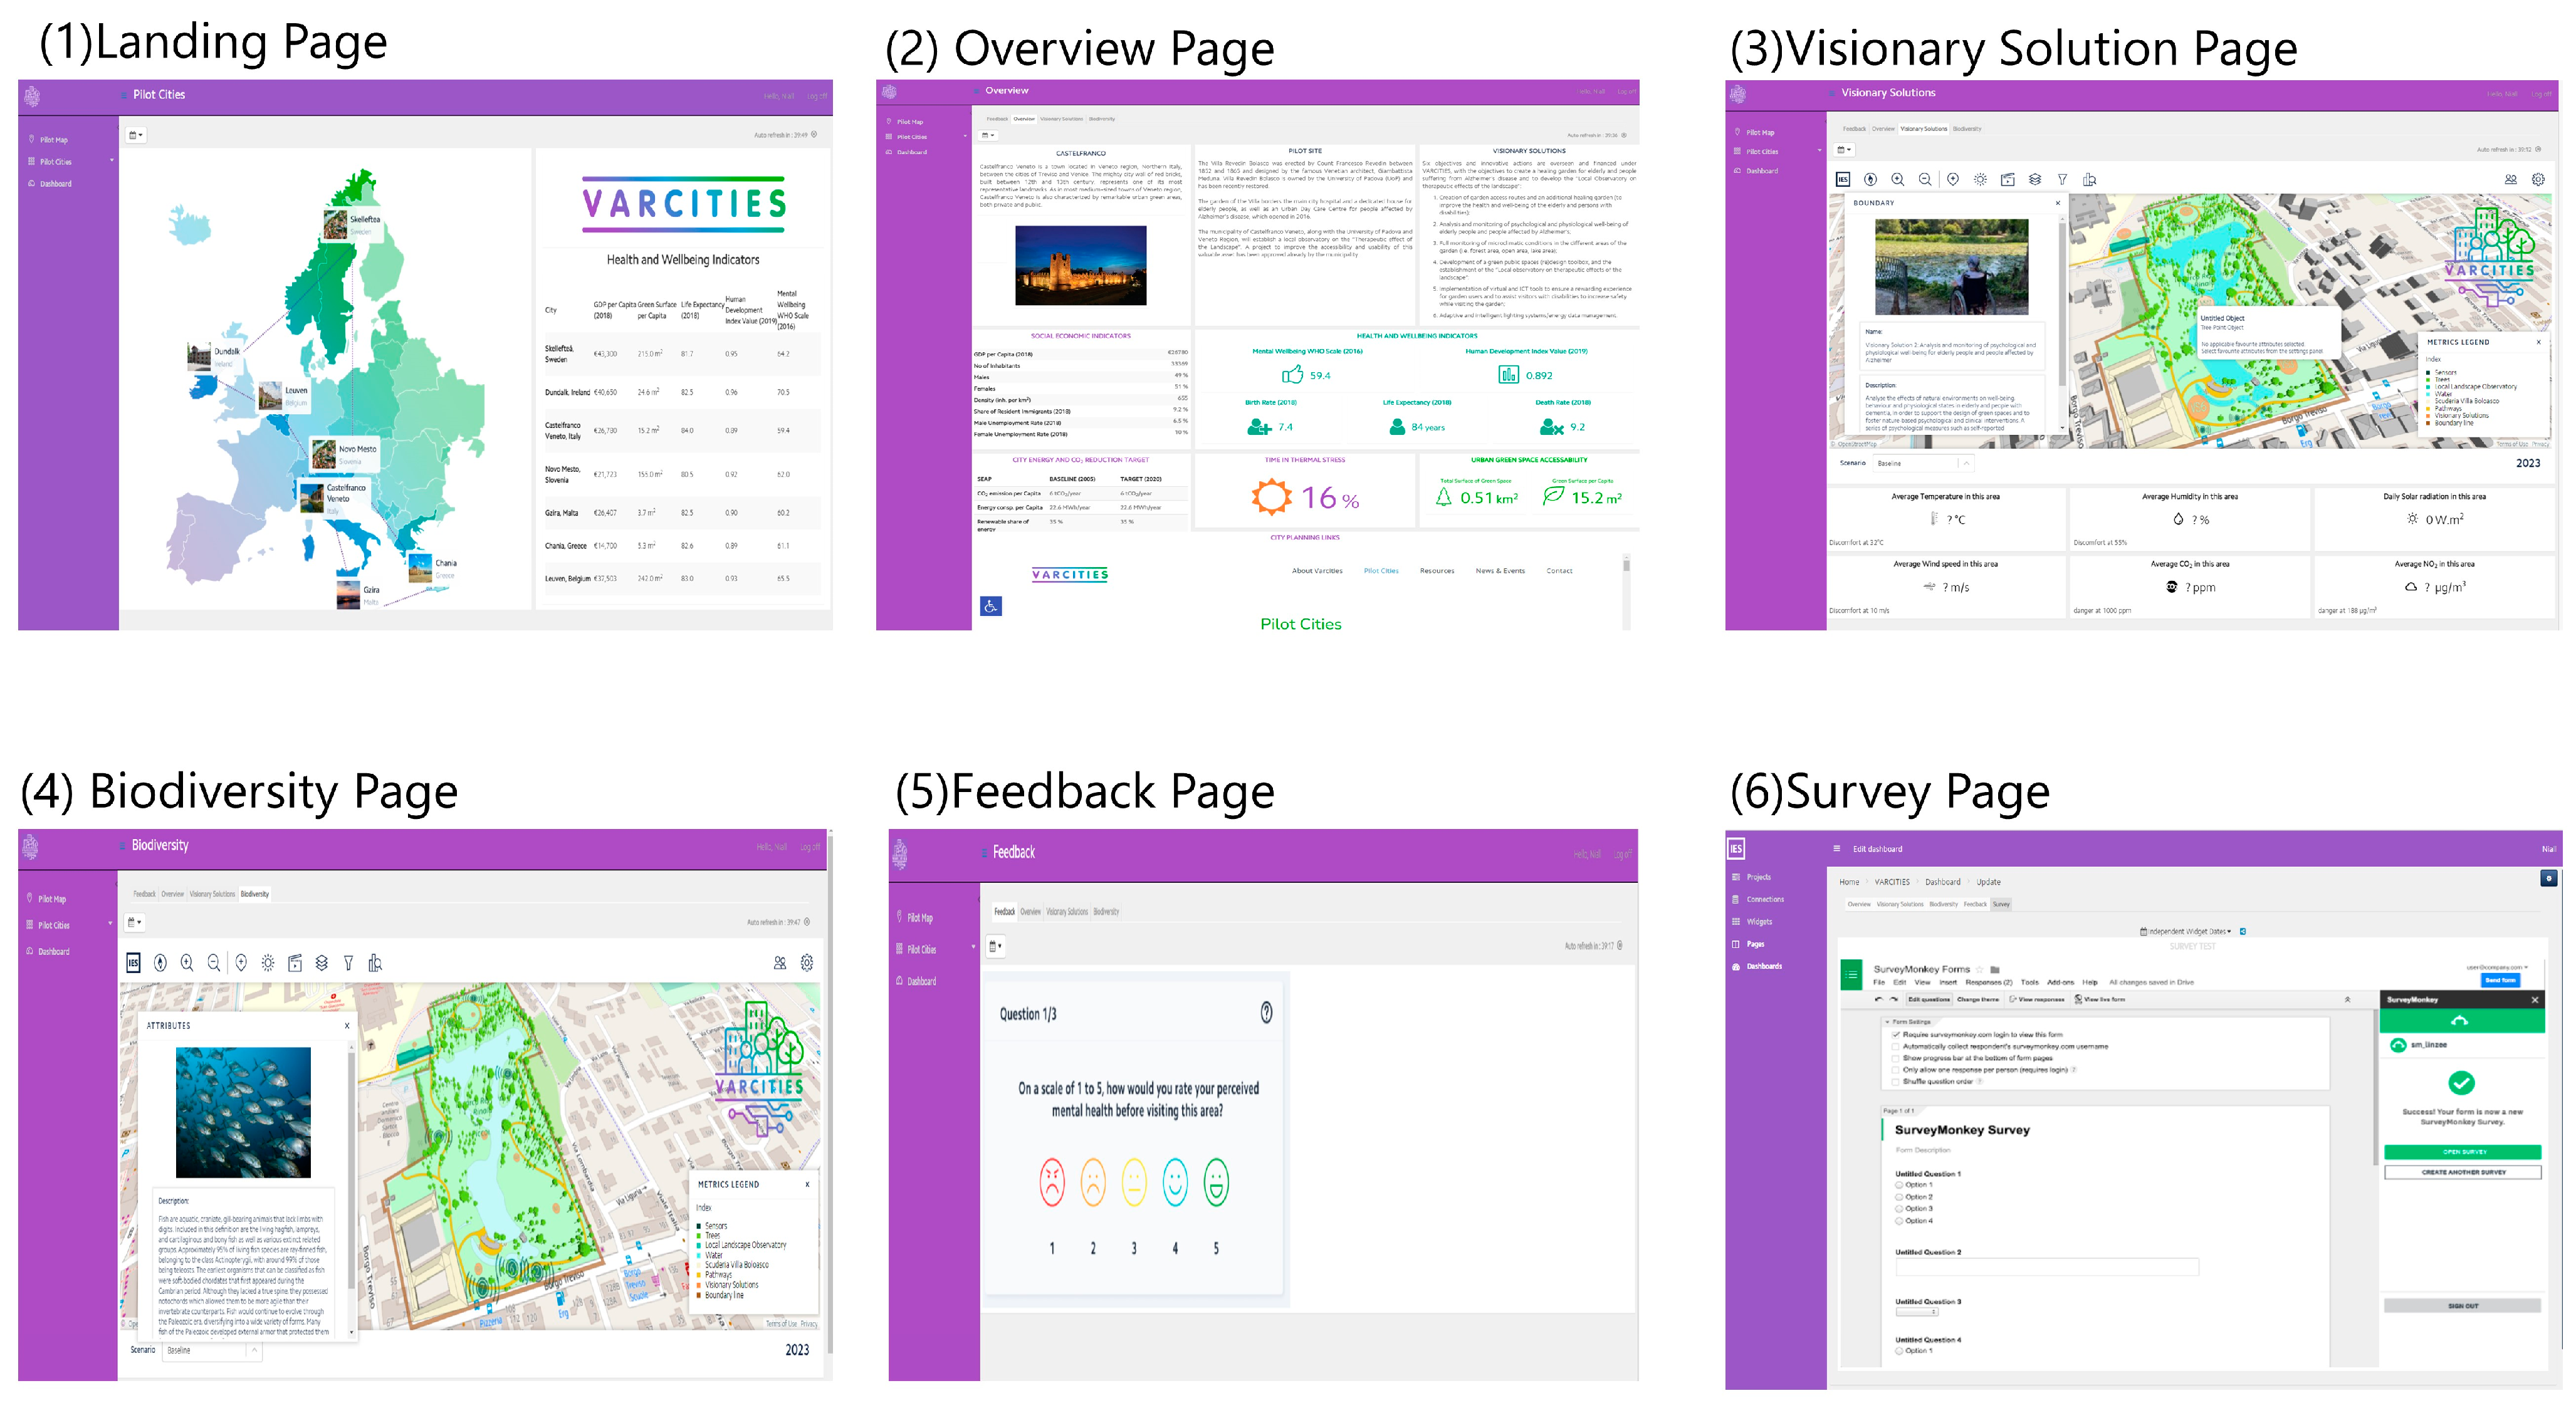
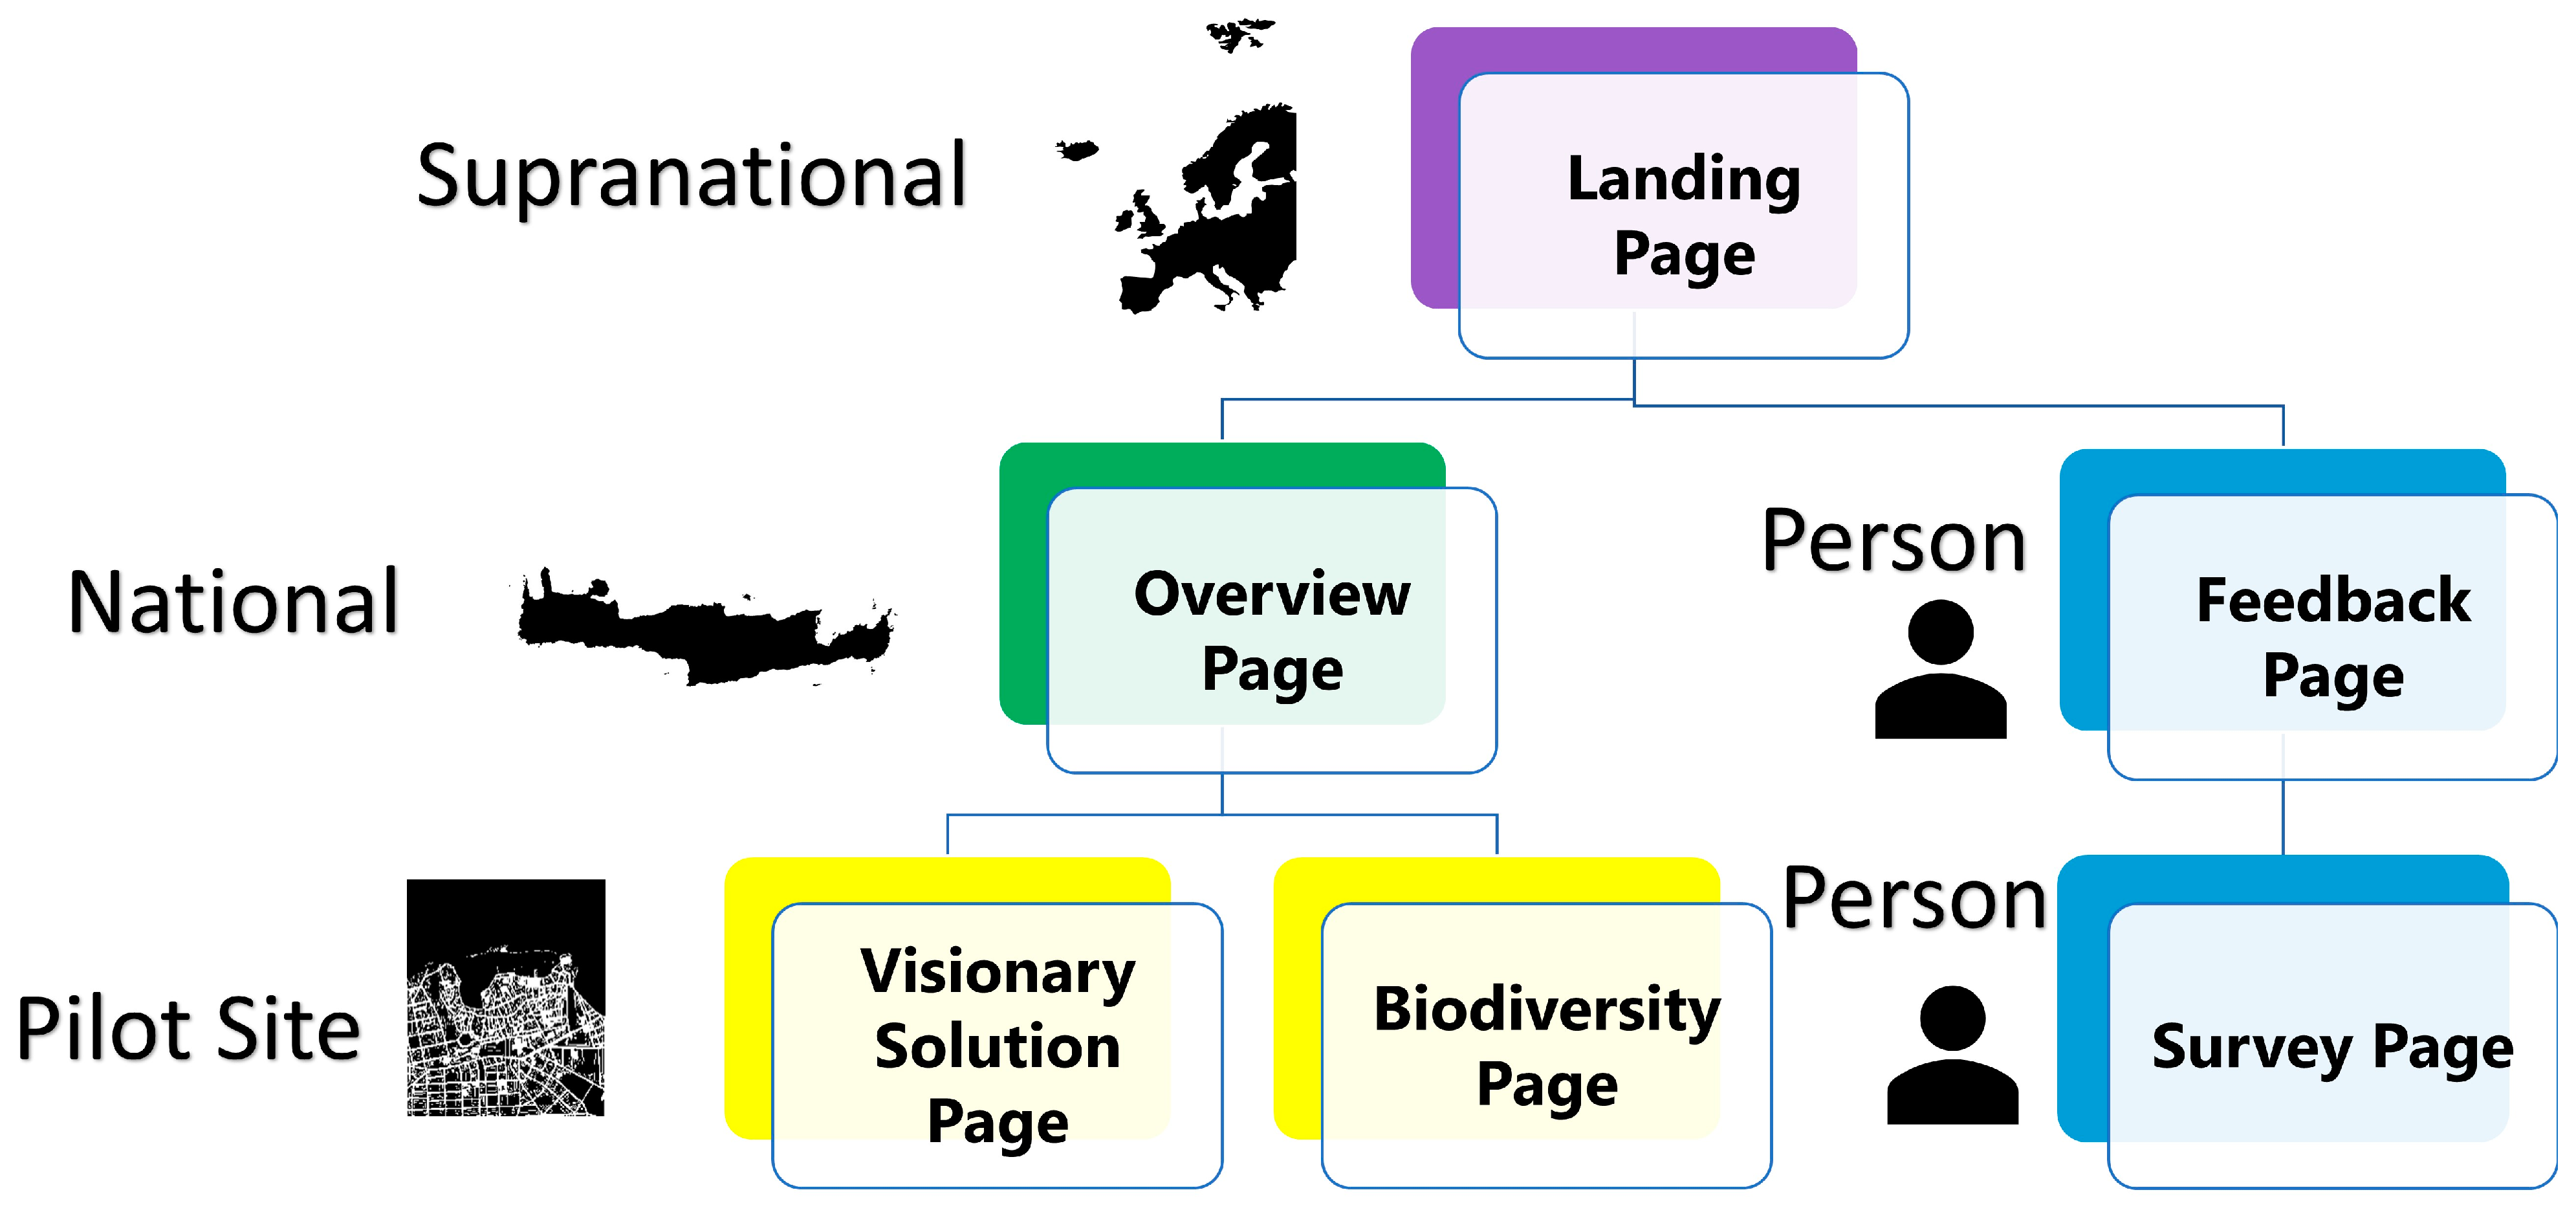
8.1. The Health and Well-Being Platform
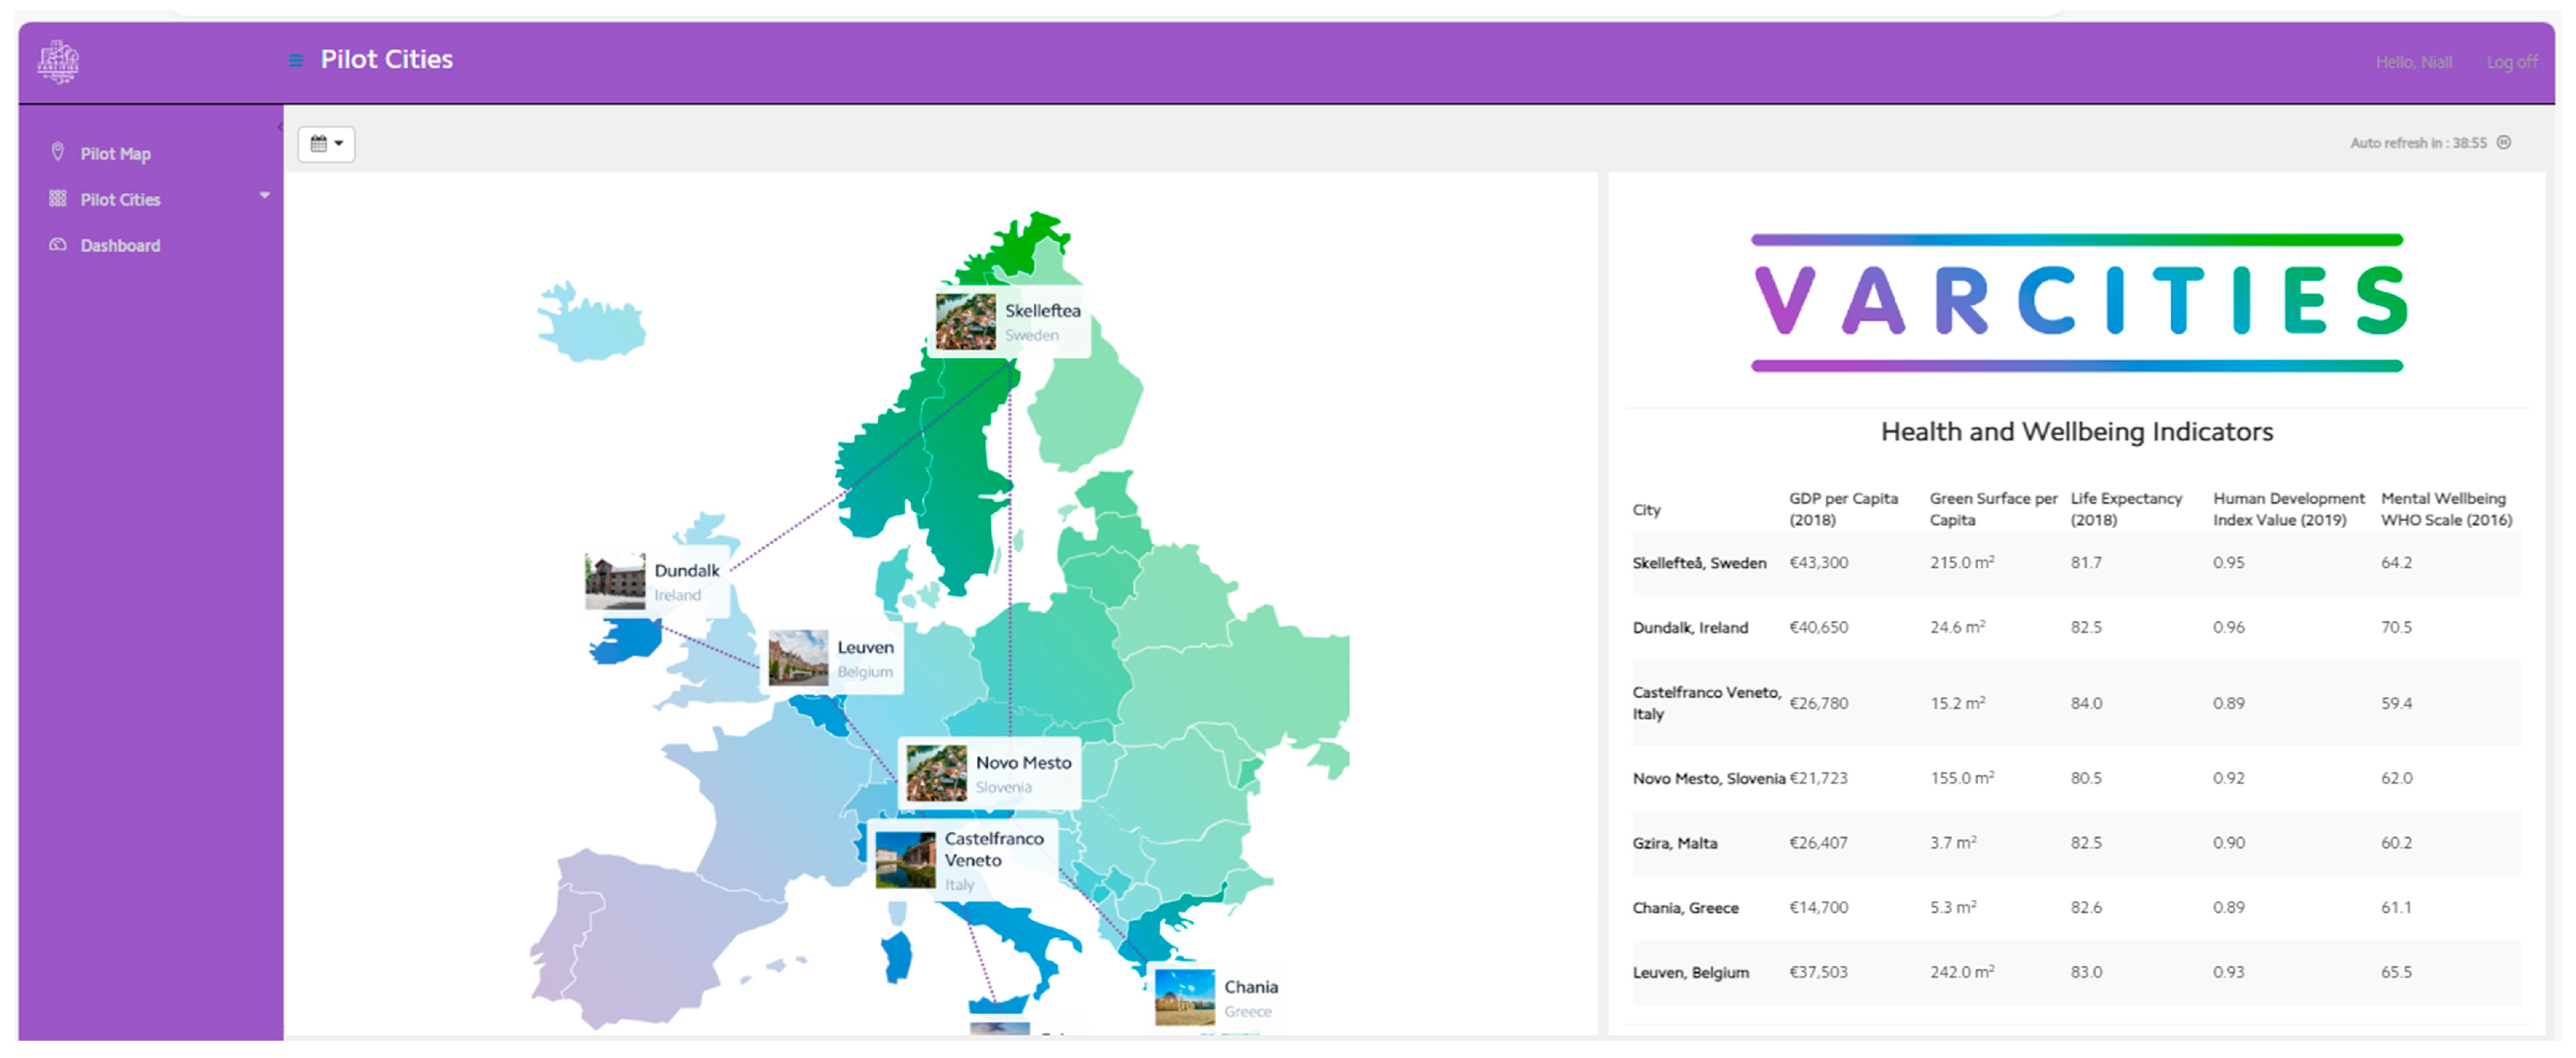
- Landing page map of all pilot sites with information describing each site.
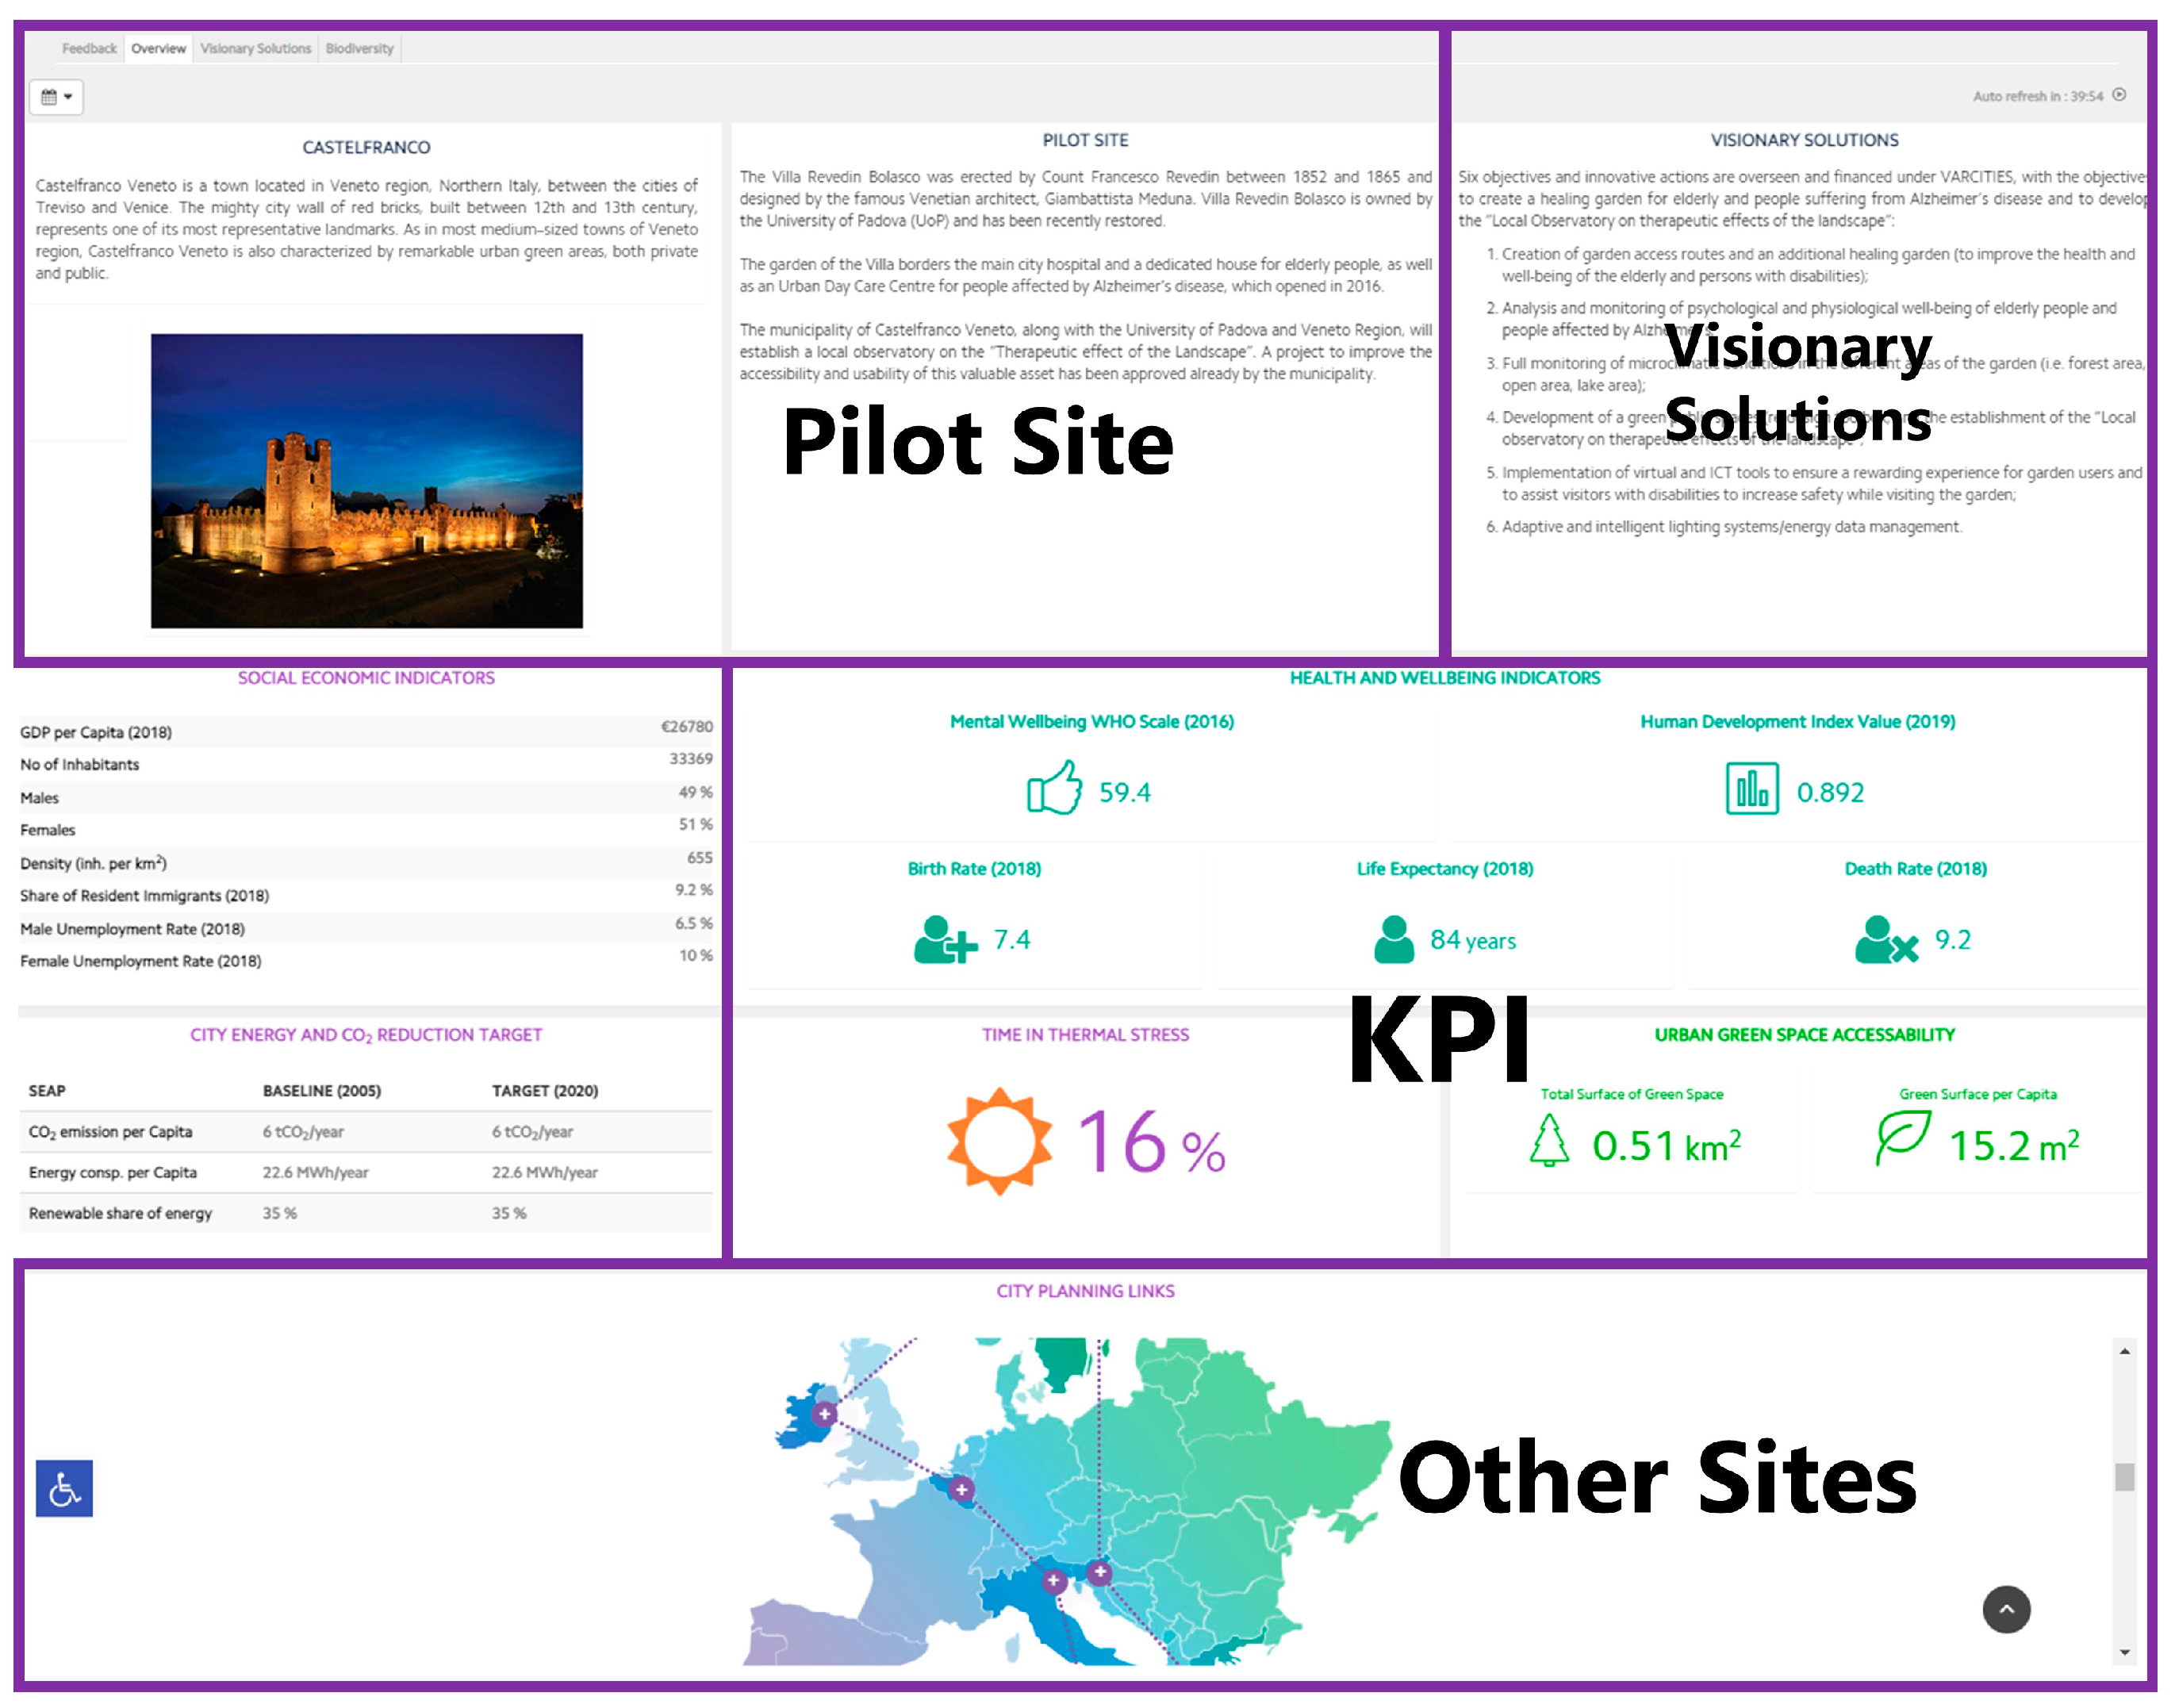
- Pilot overview page describing the context of the site as well as its local environment.
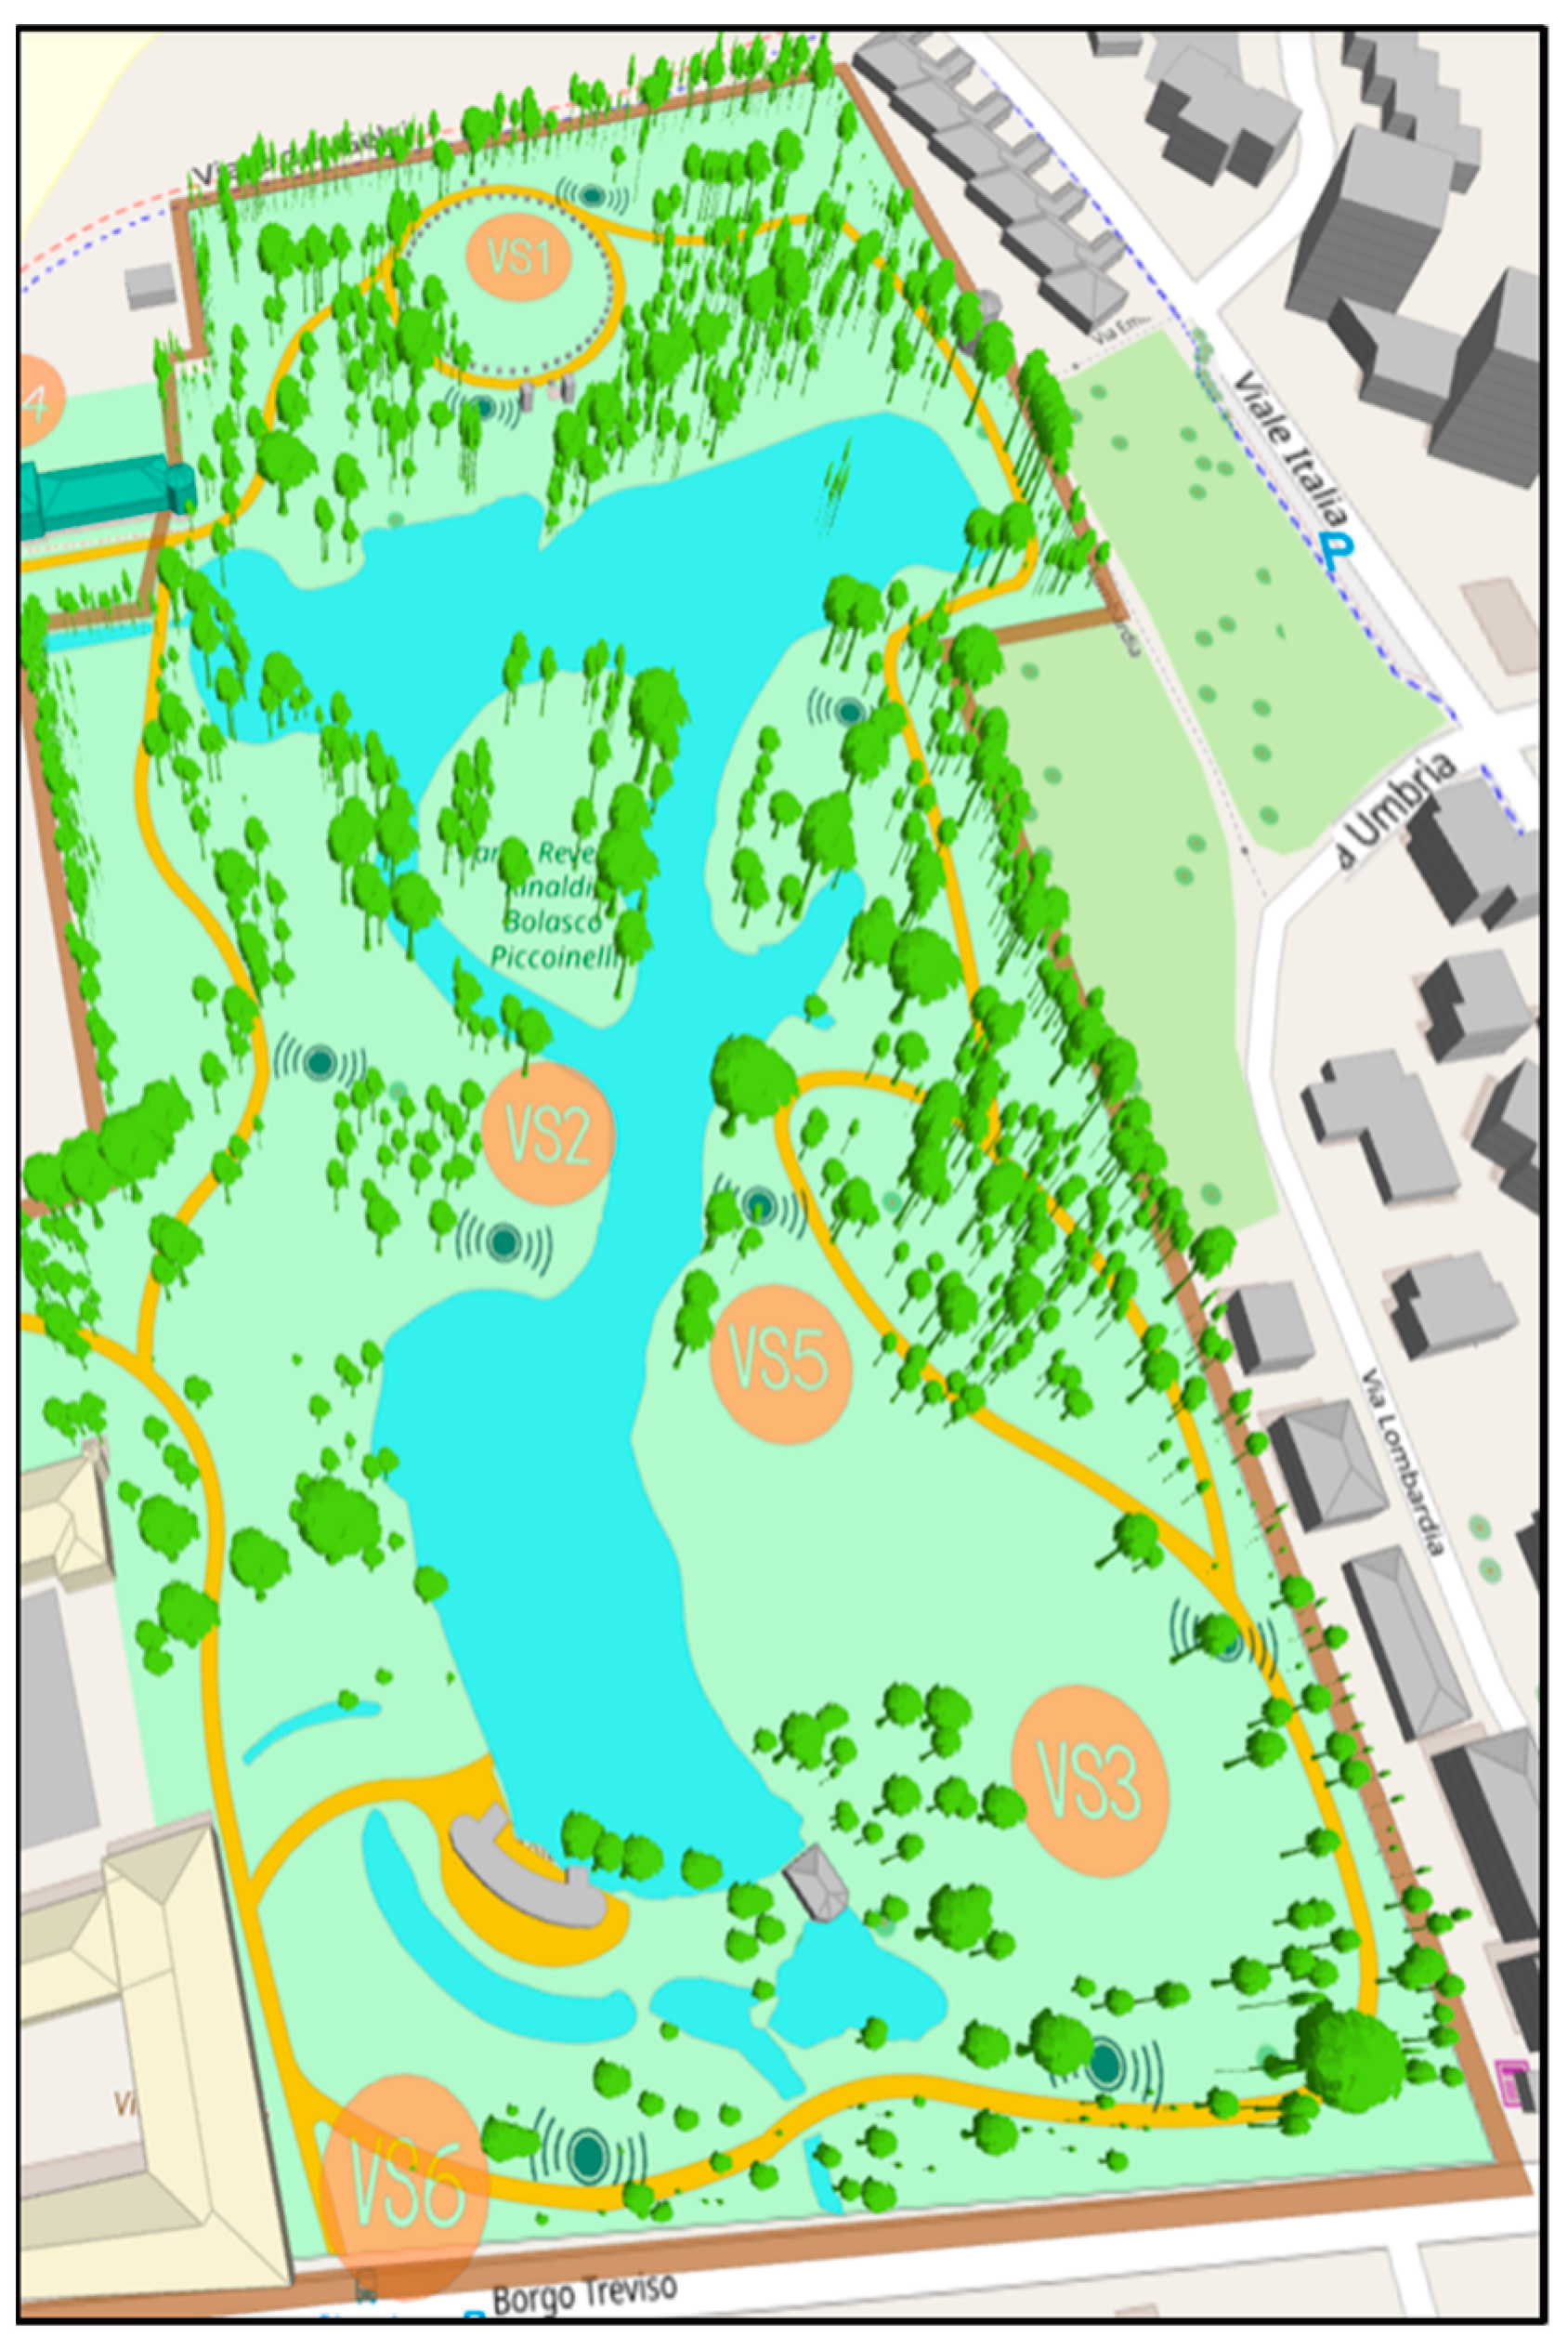
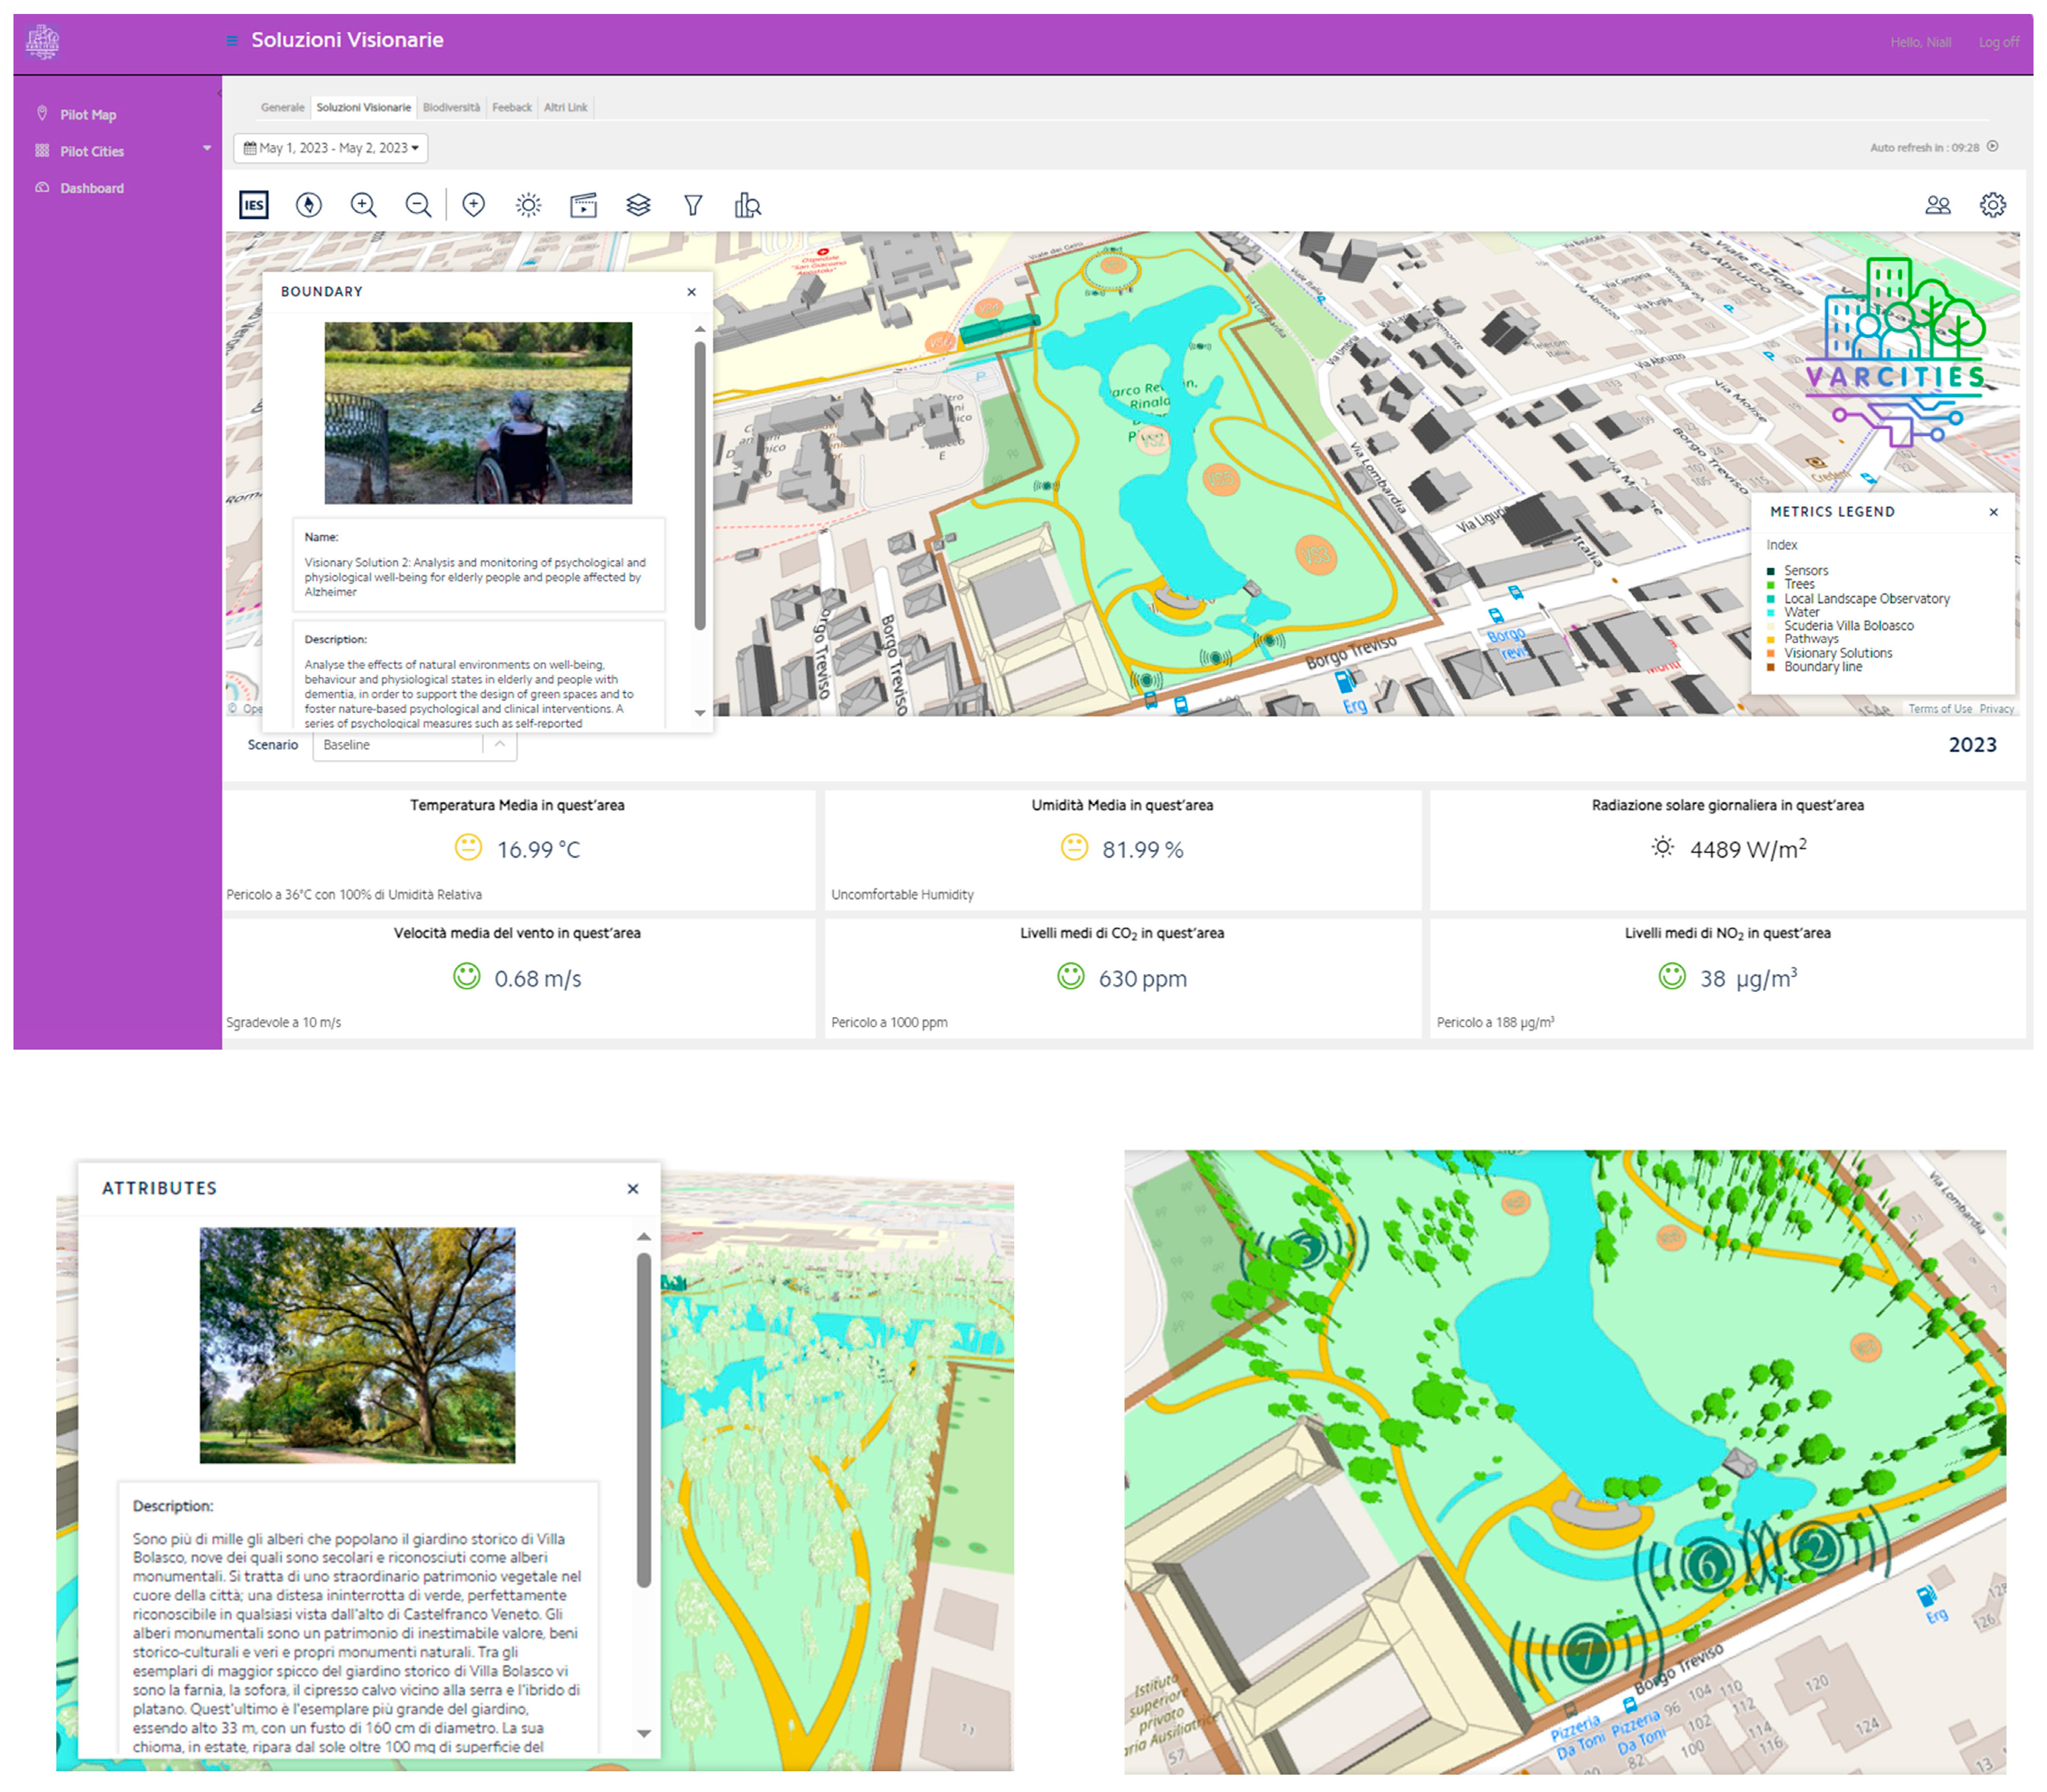
- The smart nature-based solutions page, named visionary solutions page, describes all the solutions tabulated in Table 1 in text, images, and 3D renders (where applicable).
- Biodiversity page, which includes the natural characteristics of each site.
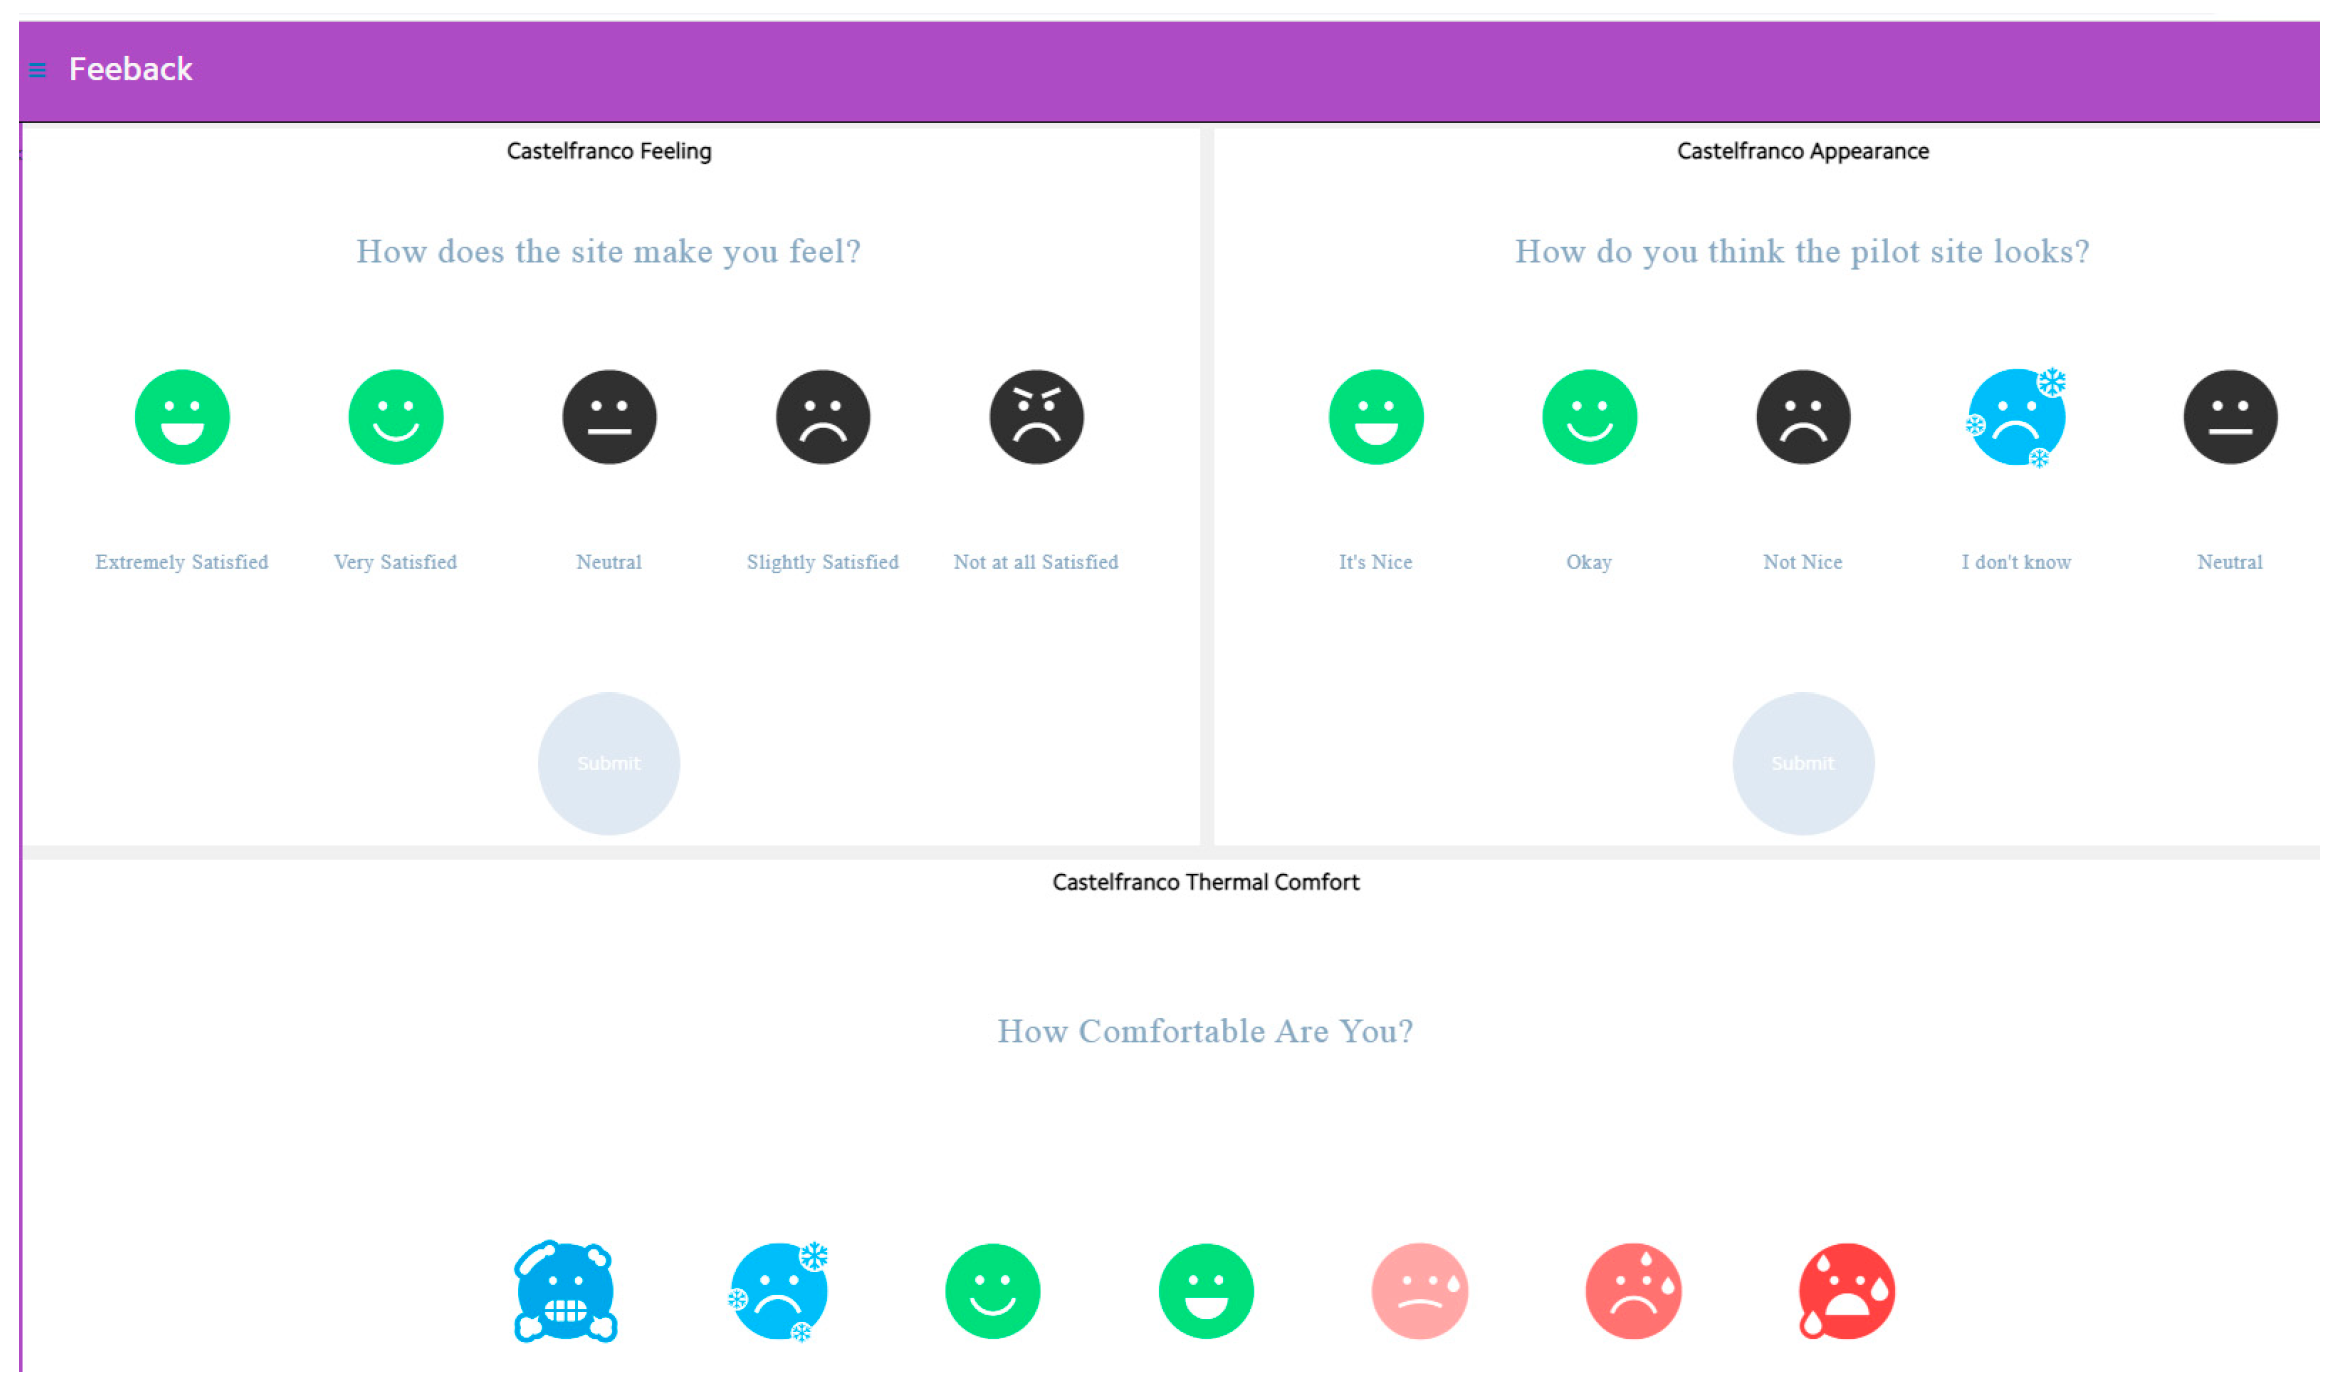
- Feedback page for user feedback on their health and well-being.
- Survey page for more specific data collection from the users.
8.1.1. Landing Page—Pilot Map
8.1.2. Overview Page
8.1.3. The Visualization of Smart Nature-Based Solutions
8.1.4. Biodiversity Page
8.1.5. Feedback and Survey Page
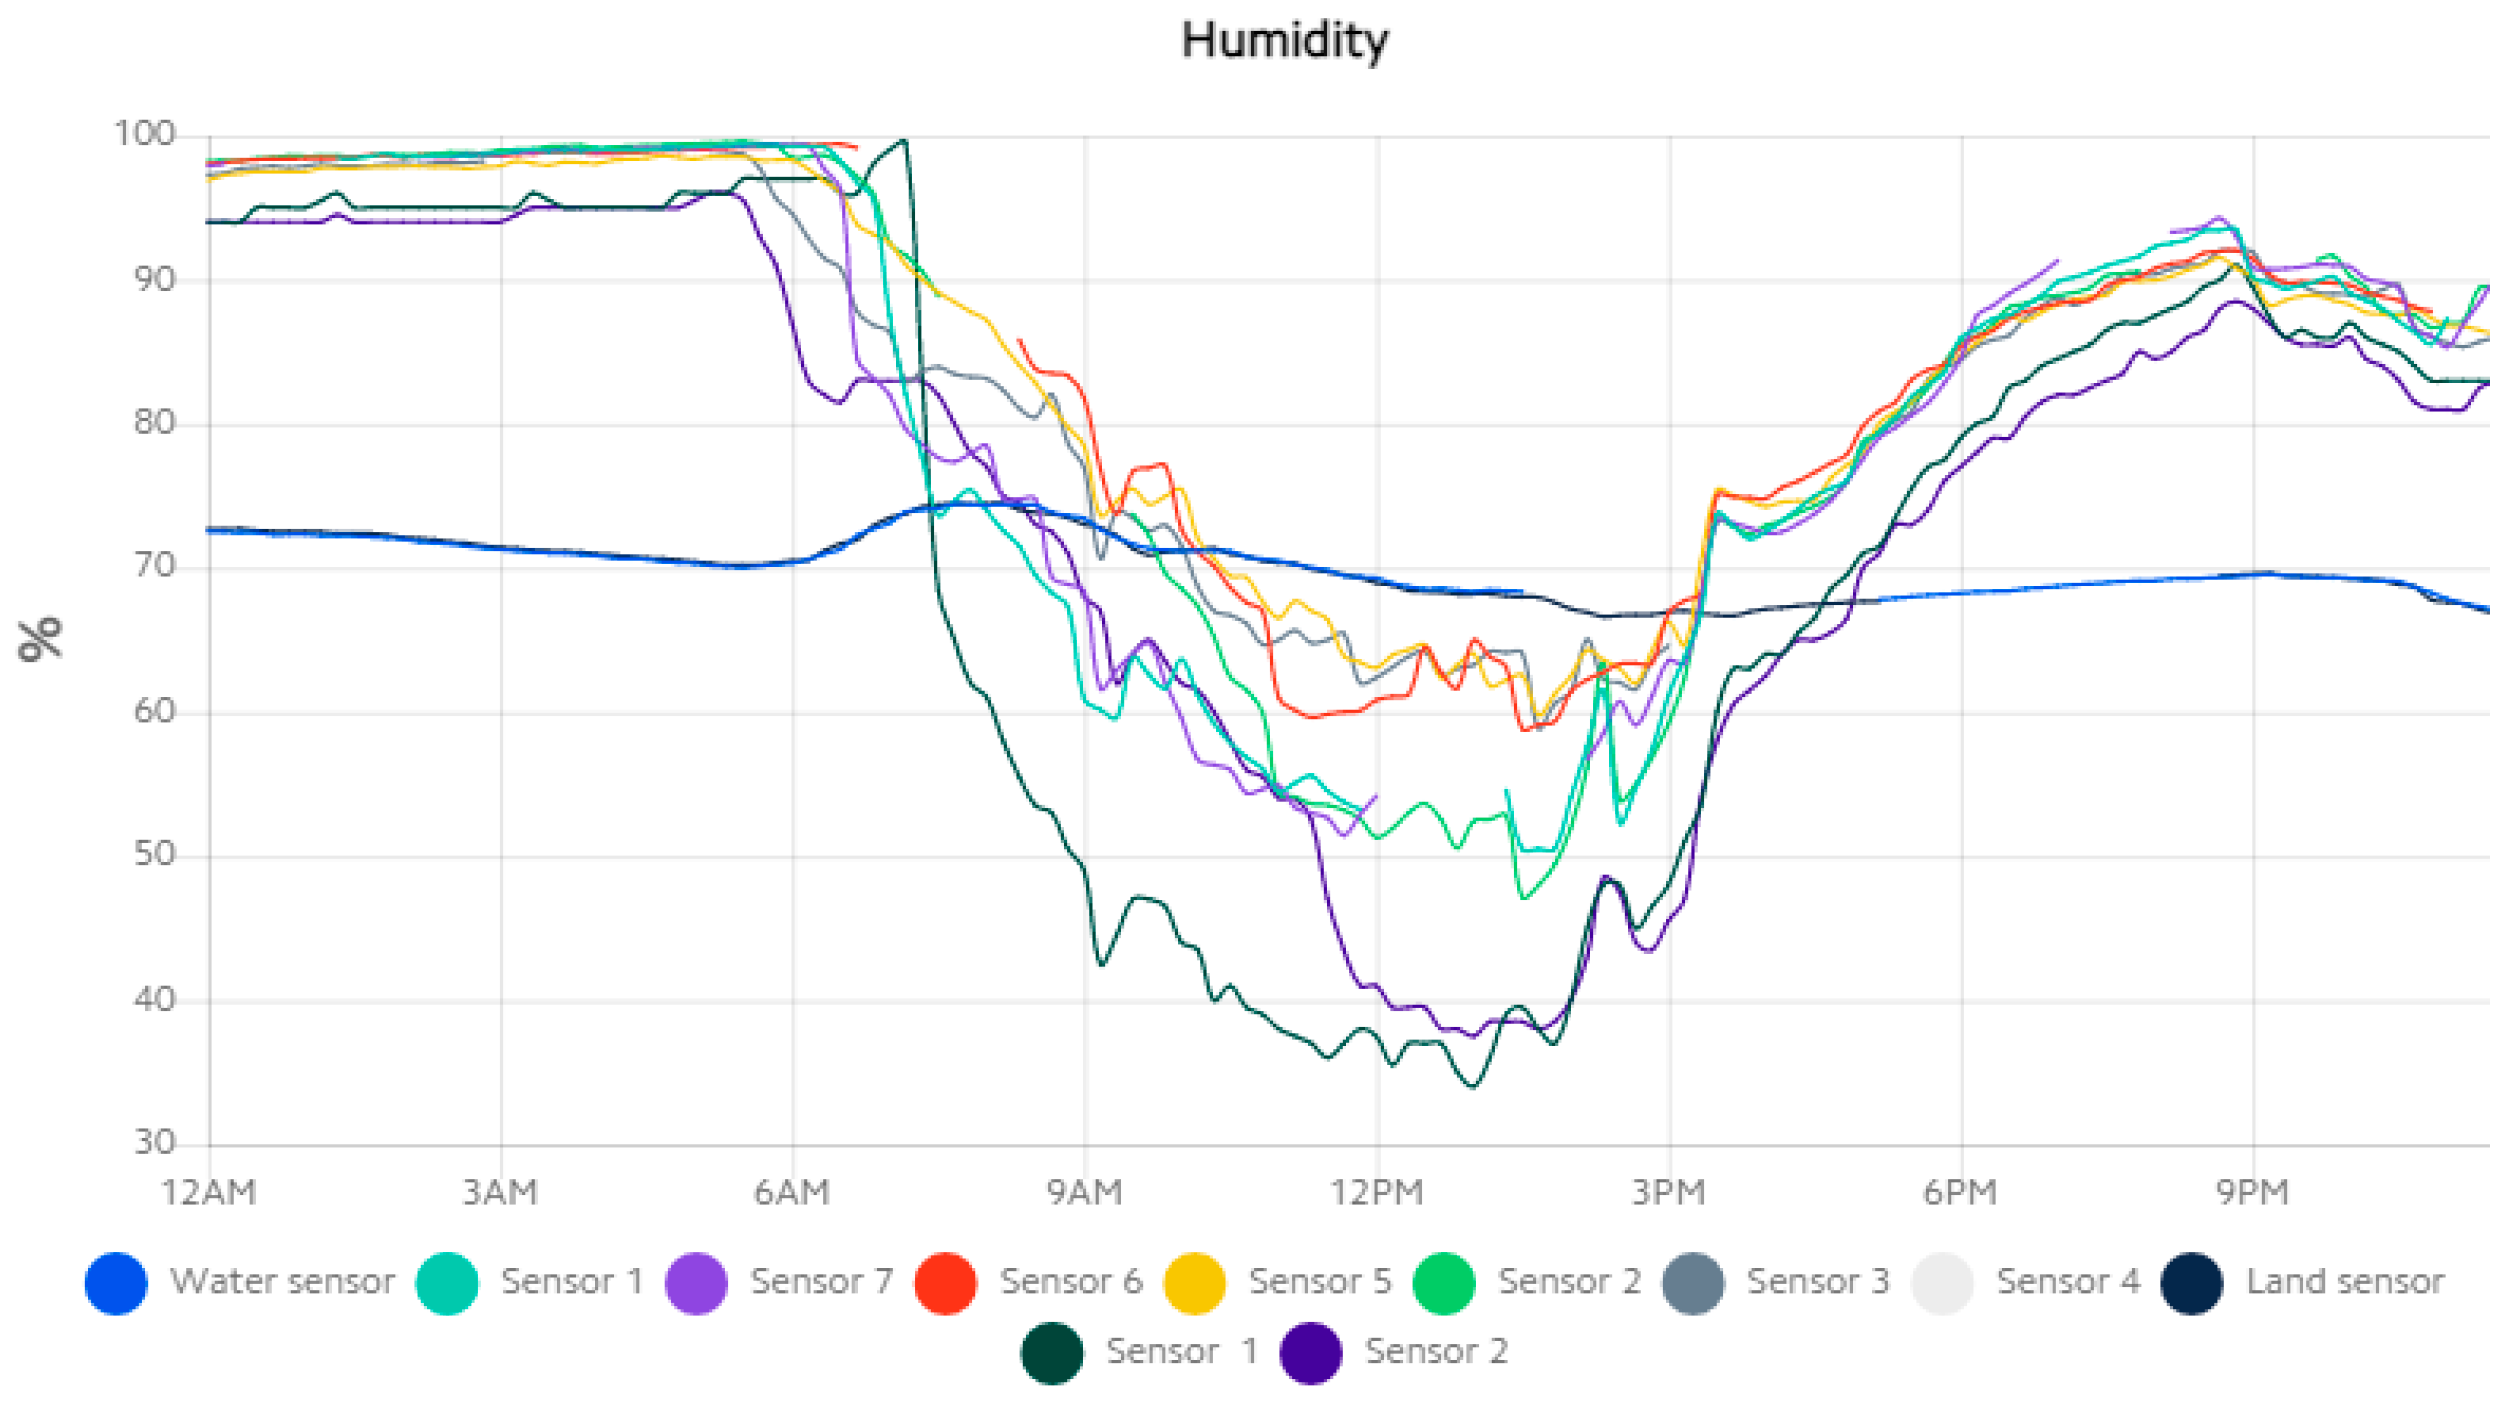
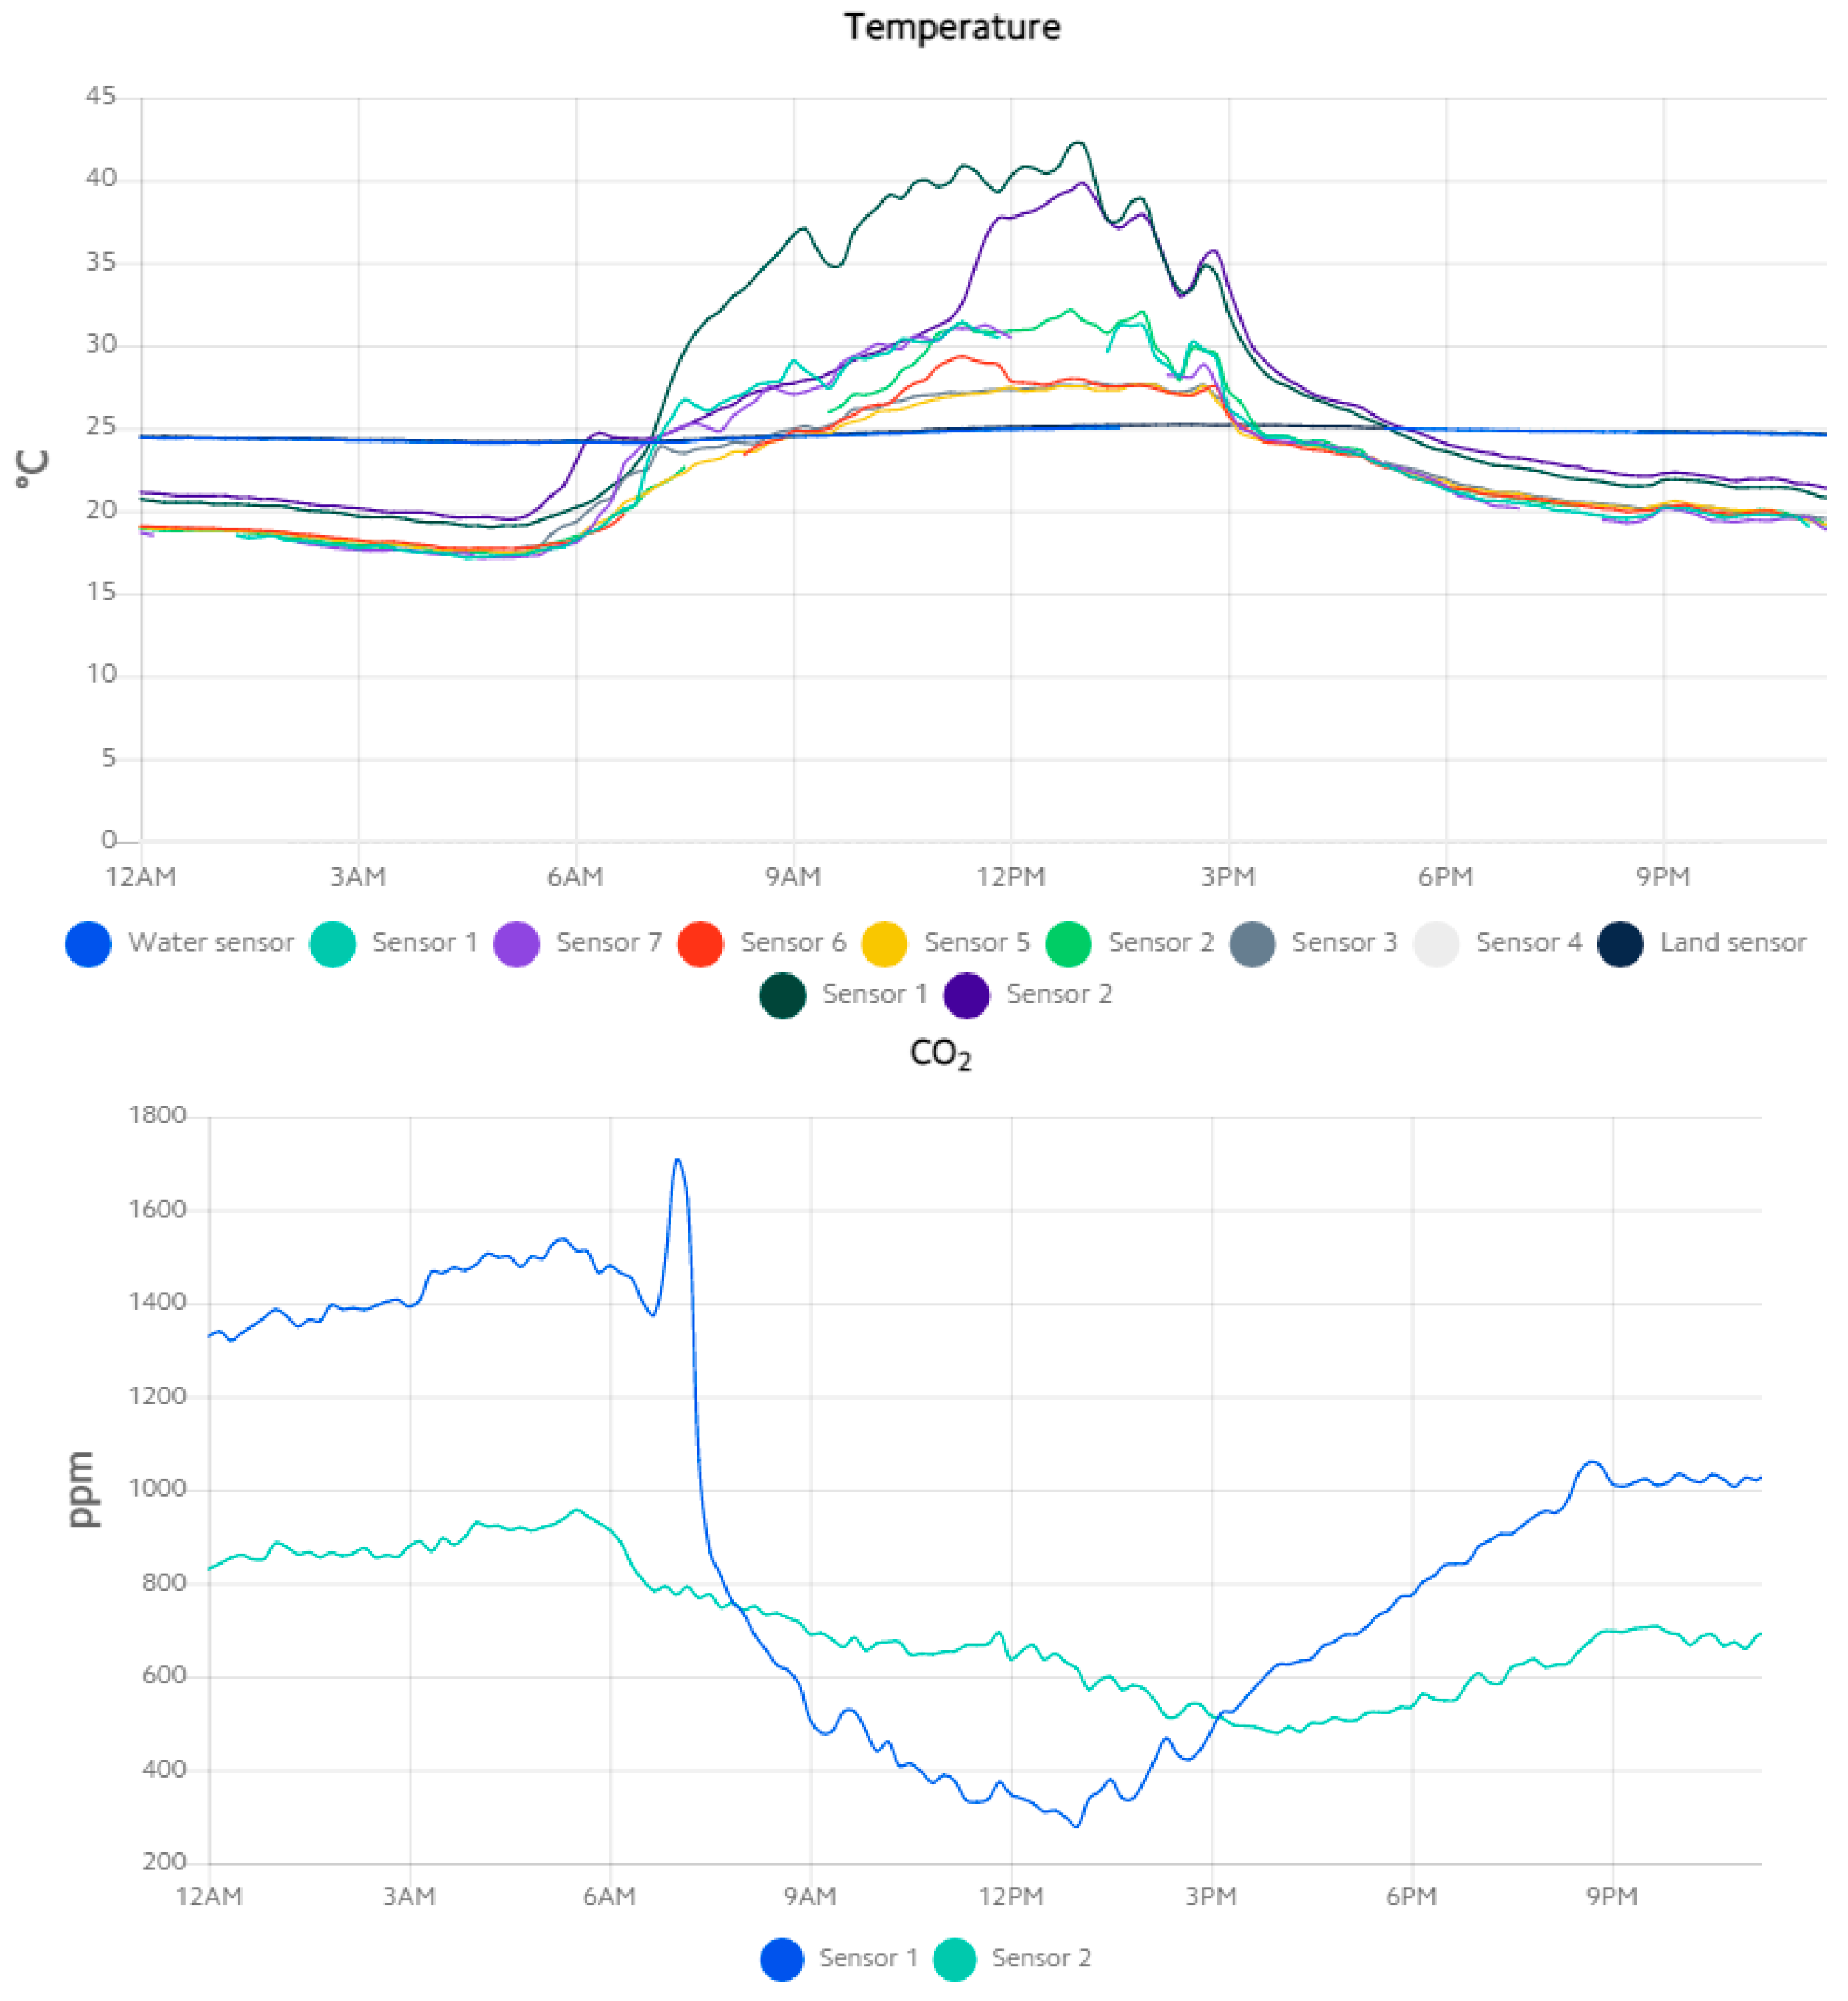
8.2. Key Performance Indicators and Data
9. Discussion
10. Conclusions and Future Prospects
Author Contributions
Funding
Data Availability Statement
Conflicts of Interest
Abbreviations
| H&WB | Health and well-being |
| VS | Visionary solutions |
| KPI | Key performance indicator |
| GPS | Global positioning system |
| LIDAR | Light detection and ranging |
| ICT | Information and communication technology |
| iSCAN | Intelligent control and analysis |
| NBS | Nature-based solutions |
| GIS | Geographic information system |
| 3D | Three-dimensional |
| API | Application programming interface |
| GDPR | General data protection regulation |
| iCD | Intelligent community design |
| iCIM | Intelligent community information model |
| IoT | Internet of Things |
| PCB | Printed circuit board |
| PCBA | Printed circuit board assembled |
| HW | Hardware |
| FW | Firmware |
| JSON | JavaScript object notation |
| REST | Representational state transfer |
| PDP | Policy decision point |
| PM | Particulate matter |
| dB | Decibel, measurement of noise |
| Pa | Pascal, measurement of pressure |
| TN | Things Network |
| AR&VR | Augmented and virtual Reality |
| POI | Points of interest |
| NGSI-LD | Next Generation Service Interfaces–Linked Data |
| PEP | Policy enforcement point |
| STK | Stakeholder |
| TLS | Transport layer security |
Appendix A

| Sensors | Measuring | Quantity | Communication Protocol | Link as Reference | Access Date |
|---|---|---|---|---|---|
| Skellefteå-SE | |||||
| Sensedge Senstick | Tair (°C), relative humidity (%), air pressure | 5 | LoRaWAN | https://senzemo.com/ | 11 October 2023 |
| Elsys ELT-2 | Tair (°C), relative humidity (%) | LoRaWAN | https://www.elsys.se/ | ||
| Decentlab DL-ATM22 | Tair (°C), relative humidity (%), wind speed, wind direction | 1 | LoRaWAN | https://cdn.decentlab.com/download/datasheets/Decentlab-DL-ATM22-datasheet.pdf | 11 October 2023 |
| Milesight-iotEM500-UDL or Elsys ELT Ultrasonic | Distance | 2 | LoRaWAN | https://www.elsys.se/ | 11 October 2023 |
| Milesight 5G AIOT Pro | Counting people | 2 | LoRaWAN | https://www.milesight.com/product/5g-aiot-pro-bullet-plus | 11 October 2023 |
| Sensedge Traffic Counter | Number of visitors | 3 | LoRaWAN | https://senzemo.com/ | 11 October 2023 |
| Dundalk-IE | |||||
| Imbuildings People Counter | Number of visitors | 4 | LoRaWAN | https://www.imbuildings.com/lorawan-people-counter/ | 9 October 2023 |
| Enginko LoRaWAN Single-Phase Energy Meter | Solar panel energy production | 1 | LoRaWAN | https://enginko.com/en/solutions/mono-phase-metering-mcf-lw12met/ | 9 October 2023 |
| ENL-AIR-X Outdoor Air Quality Monitor | Outdoor Air Quality Sensor | 1 | LoRaWAN | https://www.alliot.co.uk/product/enlink-air-x/ | 9 October 2023 |
| Polysense WXS8800-362021 | Noise | 1 | LoRaWAN | https://www.polysense.net/page180?product_id=235 | 9 October 2023 |
| Milesight EM310-UDL | Number of bicycles | 4 | LoRaWAN | https://www.kerlink.com/product/wanesy-wave/ | 9 October 2023 |
| LDDS75 LoRaWAN | Water level | 1 | LoRaWAN | https://www.dragino.com/products/distance-level-sensor/item/161-ldds75.html | 9 October 2023 |
| Sensedge Senstick | Tair (°C), relative humidity (%), Air pressure | 5 | LoRaWAN | https://senzemo.com/ | 9 October 2023 |
| Sensedge Traffic Counter | Number of visitors | 3 | LoRaWAN | https://senzemo.com/ | 9 October 2023 |
| Leuven-BE | |||||
| Renkforce WH2600 | Tair (°C), relative humidity (%), wind, air pressure, rain, solar radiation, UV index | 1 | Wi-Fi | https://www.conrad.com/p/renkforce-renkforce-wh2600-wireless-digital-weather-station-forecasts-for-12-to-24-h-1267654 | 2 September 2023 |
| Noise | dB | 2 | LTE-M (4G) | https://munisense.com/measuring-noise | 2 September 2023 |
| Traffic sensor | Number of cyclists in the area, pedestrians | 1 | - | ||
| Air quality sensor | CO2 Nitrogen oxide, NOx PM2.5 PM10 | 1 | - | ||
| Sensedge Senstick | Tair (°C), relative humidity (%), air pressure | 1 | LoRaWAN | https://senzemo.com/ | 2 September 2023 |
| Sensedge Traffic Counter | Number of visitors | 3 | LoRaWAN | https://senzemo.com/ | 2 September 2023 |
| Novo mesto-SI | |||||
| Sensedge Senstick | Tair (°C), relative humidity (%), Air pressure | 10 | LoRaWAN | https://senzemo.com/ | 13 October 2023 |
| LoRa people counter | No. of visitors | 4 | LoRaWAN | https://lora-alliance.org/lora_products/people-counter/ | 13 October 2023 |
| Air quality/microclimatic conditions | Tair (°C), Barometric pressure, Relative Humidity (%), PM1, PM2.5, PM10, O3, CO, NO2, SO | 2 | LoRaWAN | https://www.uradmonitor.com/products/ | 13 October 2023 |
| FitBit5 | Optical heart rate monitor, accelerometer, GPS, Oxygen saturation, light sensor | 20 | BT, Wi-Fi | https://www.fitbit.com/global/us/products/trackers/charge5 | 13 October 2023 |
| Sensedge Traffic Counter | number of visitors | 3 | LoRaWAN | https://senzemo.com/ | 13 October 2023 |
| Castelfranco-IT | |||||
| ENL-AIR-X Outdoor Air Quality Monitor | Outdoor Air Quality Sensor | 2 | LoRaWAN | https://www.alliot.co.uk/product/enlink-air-x/ | 26 September 2023 |
| Sensedge Senstick | Tair (°C), relative humidity (%), Air pressure | 10 | LoRaWAN | SENSEDGE: SENSTICK Microclimate SMC30 | 26 September 2023 |
| Decentlab DL_PYR | Total Solar Radiation Sensor | 7 | LoRaWAN | https://www.decentlab.com/products/total-solar-radiation-sensor-for-lorawan | 26 September 2023 |
| Decentlab DL-ATM22 | Wind speed, wind direction, and temperature sensor | 3 | LoRaWAN | https://www.decentlab.com/products/wind-speed-wind-direction-and-temperature-sensor-for-lorawan | 26 September 2023 |
| IOTSENS Sound Monitor | dB, noise levels | 2 | LoRaWAN | https://www.iotsens.com/en/product/sound-monitor/ | 26 September 2023 |
| Sensedge Traffic Counter | Number of visitors | 3 | LoRaWAN | https://senzemo.com/ | 26 September 2023 |
| Chania-GR | |||||
| Bike sensor kits | Tair (°C), relative humidity (%), PM, Sound, GPS, Smart Grip (heart rate) | 45 | WiFi/LoRaWAN —API/JSON | http://www.cyclopolis.gr/index.php/en | 15 October 2023 |
| Fixed station sensor kits | Tair (°C), relative humidity (%), Sound, NO, NO2, O3, SO2, NH3, CO, CO2, TVOC, CL2 | 4 | Cloud—API/JSON | http://www.cyclopolis.gr/index.php/en | 15 October 2023 |
| Sensedge Traffic Counter | Number of visitors | 3 | LoRaWAN | https://senzemo.com/ | 15 October 2023 |
| Sensedge Senstick | Tair (°C), relative humidity (%), air pressure | LoRaWAN | https://senzemo.com/ | 15 October 2023 | |
| Power management system of Mobile Urban Living Room | Energy produced, energy stored, energy consumed | 1 | Wi-Fi | http://www.cyclopolis.gr/index.php/en | 15 October 2023 |
| Malta-MT | |||||
| IoT Sensors | |||||
| Sensedge Senstick | Tair (°C), relative humidity (%), air pressure | 5 | LoRaWAN | https://senzemo.com/ | 12 September 2023 |
| Senstate Urban air quality monitor | PM1.0, PM2.5, PM4.0, PM10, AQI | 10 | LoRaWAN | https://senstate.com/products/senstate-urban-air-quality-station/ | 12 September 2023 |
| Sensedge Traffic Counter | Number of visitors | 3 | LoRaWAN | https://senzemo.com/ | 12 September 2023 |
| Data Logger | |||||
| Thiesclima Ultrasonic Anemometer | Wind speed and direction | 2 | N/A | https://www.thiesclima.com/pdf/en/Products/Wind-Ultrasonic-Anemometer/?art=809 | 12 September 2023 |
| Vaisala AQT400, (Datalogger, handheld device) | NO2 (ppm) SO2 (ppm) CO (ppm) O3 (ppm) PM2.5 (µg/m3) PM10 (µg/m3) Tair (°C) Relative air humidity (%)) Air Pressure (mbar) | 10 | N/A | https://www.vaisala.com/sites/default/files/documents/AQT400_Series_Datasheet_B211581EN_0.pdf | 12 September 2023 |
| Svantek SV 977 Class 1 Sound & Vibration Level Meter | dB | 1 | N/A | https://svantek.com/products/svan-977-class-1-sound-vibration-level-meter/ | 12 September 2023 |
| Metrocount RoadPod VT | Car count | 6 | N/A | https://metrocount.com/products/roadpod-vehicle-tube-classifier/ | |
References
- Caprotti, F.; Cowley, R.; Datta, A.; Broto, V.C.; Gao, E.; Georgeson, L.; Herrick, C.; Odendaal, N.; Joss, S. The New Urban Agenda: Key opportunities and challenges for policy and practice. Urban Res. Pr. 2017, 10, 367–378. [Google Scholar] [CrossRef]
- Vukovic, N.; Koriugina, U.; Illarionova, D.; Pankratova, D.; Kiseleva, P.; Gontareva, A. Towards Smart Green Cities: Analysis of Integrated Renewable Energy Use in Smart Cities. Strat. Plan. Energy Environ. 2021, 40, 75–94. [Google Scholar] [CrossRef]
- Ward, H.; Kotthaus, S.; Järvi, L.; Grimmond, C. Surface Urban Energy and Water Balance Scheme (SUEWS): Development and evaluation at two UK sites. Urban Clim. 2016, 18, 1–32. [Google Scholar] [CrossRef]
- Chrysoulakis, N.; de Castro, E.A.; Moors, E.J. (Eds.) Understanding Urban Metabolism: A Tool for Urban Planning; Routledge: London, UK, 2014; Volume 3. [Google Scholar] [CrossRef]
- Rafael, S.; Martins, H.; Sá, E.; Carvalho, D.; Borrego, C.; Lopes, M. Influence of urban resilience measures in the magnitude and behaviour of energy fluxes in the city of Porto (Portugal) under a climate change scenario. Sci. Total. Environ. 2016, 566–567, 1500–1510. [Google Scholar] [CrossRef] [PubMed]
- Rafael, S.; Martins, H.; Marta-Almeida, M.; Sá, E.; Coelho, S.; Rocha, A.; Borrego, C.; Lopes, M. Quantification and mapping of urban fluxes under climate change: Application of WRF-SUEWS model to Greater Porto area (Portugal). Environ. Res. 2017, 155, 321–334. [Google Scholar] [CrossRef] [PubMed]
- Faivre, N.; Fritz, M.; Freitas, T.; de Boissezon, B.; Vandewoestijne, S. Nature-Based Solutions in the EU: Innovating with nature to address social, economic and environmental challenges. Environ. Res. 2017, 159, 509–518. [Google Scholar] [CrossRef]
- Raymond, C.M.; Frantzeskaki, N.; Kabisch, N.; Berry, P.; Breil, M.; Nita, M.R.; Geneletti, D.; Calfapietra, C. A framework for assessing and implementing the co-benefits of nature-based solutions in urban areas. Environ. Sci. Policy 2017, 77, 15–24. [Google Scholar] [CrossRef]
- Versini, P.-A.; Kotelnikova, N.; Poulhes, A.; Tchiguirinskaia, I.; Schertzer, D.; Leurent, F. A distributed modelling approach to assess the use of Blue and Green Infrastructures to fulfil stormwater management requirements. Landsc. Urban Plan. 2018, 173, 60–63. [Google Scholar] [CrossRef]
- Tsatsou, A.; Frantzeskaki, N.; Malamis, S. Nature-based solutions for circular urban water systems: A scoping literature review and a proposal for urban design and planning. J. Clean. Prod. 2023, 394, 136325. [Google Scholar] [CrossRef]
- La Roche, P.; Berardi, U. Comfort and energy savings with active green roofs. Energy Build. 2014, 82, 492–504. [Google Scholar] [CrossRef]
- Santamouris, M.; Ding, L.; Fiorito, F.; Oldfield, P.; Osmond, P.; Paolini, R.; Prasad, D.; Synnefa, A. Passive and active cooling for the outdoor built environment—Analysis and assessment of the cooling potential of mitigation technologies using performance data from 220 large scale projects. Sol. Energy 2017, 154, 14–33. [Google Scholar] [CrossRef]
- Tsilini, V.; Papantoniou, S.; Kolokotsa, D.-D.; Maria, E.-A. Urban gardens as a solution to energy poverty and urban heat island. Sustain. Cities Soc. 2015, 14, 323–333. [Google Scholar] [CrossRef]
- Ferreira, V.; Barreira, A.P.; Loures, L.; Antunes, D.; Panagopoulos, T. Stakeholders’ Engagement on Nature-Based Solutions: A Systematic Literature Review. Sustainability 2020, 12, 640. [Google Scholar] [CrossRef]
- Randrup, T.B.; Buijs, A.; Konijnendijk, C.C.; Wild, T. Moving beyond the nature-based solutions discourse: Introducing nature-based thinking. Urban Ecosyst. 2020, 23, 919–926. [Google Scholar] [CrossRef]
- Kolokotsa, D.D.; Giannariakis, G.; Gobakis, K.; Giannarakis, G.; Synnefa, A.; Santamouris, M. Cool roofs and cool pavements application in Acharnes, Greece. Sustain. Cities Soc. 2018, 37, 466–474. [Google Scholar] [CrossRef]
- Wong, N.H.; Tan, C.L.; Kolokotsa, D.D.; Takebayashi, H. Greenery as a mitigation and adaptation strategy to urban heat. Nat. Rev. Earth Environ. 2021, 2, 166–181. [Google Scholar] [CrossRef]
- Wong, P.P.-Y.; Lai, P.-C.; Low, C.-T.; Chen, S.; Hart, M. The impact of environmental and human factors on urban heat and microclimate variability. Build. Environ. 2016, 95, 199–208. [Google Scholar] [CrossRef]
- Andreucci, M.B.; Loder, A.; Brown, M.; Brajković, J. Exploring challenges and opportunities of biophilic urban design: Evidence from research and experimentation. Sustainability 2021, 13, 4323. [Google Scholar] [CrossRef]
- Kolokotsa, D.; Lilli, A.; Lilli, M.A.; Nikolaidis, N.P. On the impact of nature-based solutions on citizens’ health & well being. Energy Build. 2020, 229, 110527. [Google Scholar] [CrossRef]
- Apostu, S.A.; Vasile, V.; Vasile, R.; Rosak-Szyrocka, J. Do Smart Cities Represent the Key to Urban Resilience? Rethinking Urban Resilience. Int. J. Environ. Res. Public Health 2022, 19, 15410. [Google Scholar] [CrossRef]
- Alahakoon, D.; Nawaratne, R.; Xu, Y.; De Silva, D.; Sivarajah, U.; Gupta, B. Self-Building Artificial Intelligence and Machine Learning to Empower Big Data Analytics in Smart Cities. Inf. Syst. Front. 2020, 25, 221–240. [Google Scholar] [CrossRef]
- Jeong, S.; Kim, S.; Kim, J. City data hub: Implementation of standard-based smart city data platform for interoperability. Sensors 2020, 20, 7000. [Google Scholar] [CrossRef] [PubMed]
- Basmi, W.; Boulmakoul, A.; Karim, L.; Lbath, A. Distributed and scalable platform architecture for smart cities complex events data collection: Covid19 pandemic use case. J. Ambient. Intell. Humaniz. Comput. 2021, 12, 75–83. [Google Scholar] [CrossRef] [PubMed]
- Li, B.; Kisacikoglu, M.C.; Liu, C.; Singh, N.; Erol-Kantarci, M. Big Data Analytics for Electric Vehicle Integration in Green Smart Cities. IEEE Commun. Mag. 2017, 55, 19–25. [Google Scholar] [CrossRef]
- Mingaleva, Z.; Vukovic, N.; Volkova, I.; Salimova, T. Waste Management in Green and Smart Cities: A Case Study of Russia. Sustainability 2019, 12, 94. [Google Scholar] [CrossRef]
- Borsboom-van Beurden, J.; Bisello, A.; Vettorato, D.; Vacha, T. Systemic Changes in Governance Equipping local governments for realising climate-neutral and smart cities; European Climate, Infrastructure and Environment Executive Agency (CINEA), January 2023. Available online: https://build-up.ec.europa.eu/sites/default/files/content/hz-04-23-005-en-c.pdf (accessed on 1 December 2023).
- Bonab, A.B.; Bellini, F.; Rudko, I. Theoretical and analytical assessment of smart green cities. J. Clean. Prod. 2023, 410, 137315. [Google Scholar] [CrossRef]
- Restemeyer, B.; Boogaard, F.C. Potentials and Pitfalls of Mapping Nature-Based Solutions with the Online Citizen Science Platform ClimateScan. Land 2021, 10, 5. [Google Scholar] [CrossRef]
- Colarusso, C.; De Iasio, A.; Furno, A.; Goglia, L.; Merzoug, M.A.; Zimeo, E. PROMENADE: A big data platform for handling city complex networks with dynamic graphs. Futur. Gener. Comput. Syst. 2022, 137, 129–145. [Google Scholar] [CrossRef]
- Shen, C.; Wang, Y. Citizen-initiated interactions in urban water governance: How public authorities respond to micro-level opinions related to nature-based solutions. J. Clean. Prod. 2023, 405, 137015. [Google Scholar] [CrossRef]
- Gašparović, M.; Medak, D.; Miler, M. Geospatial monitoring of green infrastructure—Case study Zagreb, Croatia. In Proceedings of the 17th International Multidisciplinary Scientific GeoConference SGEM 2017, Albena, Bulgaria, 29 June–5 July 2017; Volume 17, pp. 569–576. [Google Scholar] [CrossRef]
- Moroni, M.; Porti, M.; Piro, P. Design of a remote-controlled platform for green roof plants monitoring via hyperspectral sensors. Water 2019, 11, 1368. [Google Scholar] [CrossRef]
- Kikon, N.; Singh, P.; Singh, S.K.; Vyas, A. Assessment of urban heat islands (UHI) of Noida City, India using multi-temporal satellite data. Sustain. Cities Soc. 2016, 22, 19–28. [Google Scholar] [CrossRef]
- Son, N.-T.; Chen, C.-F.; Chen, C.-R.; Thanh, B.-X.; Vuong, T.-H. Assessment of urbanization and urban heat islands in Ho Chi Minh City, Vietnam using Landsat data. Sustain. Cities Soc. 2017, 30, 150–161. [Google Scholar] [CrossRef]
- Bernard, J.; Musy, M.; Calmet, I.; Bocher, E.; Keravec, P. Urban heat island temporal and spatial variations: Empirical modeling from geographical and meteorological data. Build Environ. 2017, 125, 423–438. [Google Scholar] [CrossRef]
- Liaqat, R.M.; Branch, P.; But, J. LoRa Based Linear Network Applications, Design Considerations and Open Challenges: A Review. In Proceedings of the 20th ACM Conference on Embedded Networked Sensor Systems, Boston, MA, USA, 6–9 November 2022; pp. 913–917. [Google Scholar] [CrossRef]
- Pasandi, H.B.; Haqiqat, A.; Moradbeikie, A.; Keshavarz, A.; Rostami, H.; Paiva, S.; Lopes, S.I. Low-cost traffic sensing system based on LoRaWAN for urban areas. In Proceedings of the 1st International Workshop on Emerging Topics in Wireless, Part of CoNEXT 2022 (EmergingWireless 2022), Rome, Italy, 9 December 2022; pp. 6–11. [Google Scholar] [CrossRef]
- Yeganeh, S.H.; Hassanzadeh, O.; Miller, R.J. Linking Semistructured Data on the Web. In Proceedings of the Fourteenth International Workshop on theWeb and Databases (WebDB 2011), Athens, Greece, 12 June 2011. [Google Scholar]
- Green, C.S.; Pouget, A.; Bavelier, D. Improved probabilistic inference as a general learning mechanism with action video games. Curr. Biol. 2010, 20, 1573–1579. [Google Scholar] [CrossRef]
- Savage, N. Game changer. Commun. ACM 2012, 55, 22–23. [Google Scholar] [CrossRef]
- Kesselman, M. Current CITE-ings from the popular and trade computing literature: Google Cardboard—Virtual reality for everyone. Libr. Hi Tech News 2016, 33, 15–16. [Google Scholar] [CrossRef]
- Merino, L.; Schwarzl, M.; Kraus, M.; Sedlmair, M.; Schmalstieg, D.; Weiskopf, D. Evaluating Mixed and Augmented Reality: A Systematic Literature Review (2009–2019). In Proceedings of the 2020 IEEE International Symposium on Mixed and Augmented Reality, ISMAR 2020, Porto de Galinhas, Brazil, 9–13 November 2020; pp. 438–451. [Google Scholar] [CrossRef]
- Panduman, Y.Y.F.; Funabiki, N.; Puspitaningayu, P.; Kuribayashi, M.; Sukaridhoto, S.; Kao, W.-C. Design and Implementation of SEMAR IoT Server Platform with Applications. Sensors 2022, 22, 6436. [Google Scholar] [CrossRef]
- Tarkoma, S. Publish/Subscribe Systems: Design and Principles; Wiley: Hoboken, NJ, United States, 2012; ISBN 9781118354261. [Google Scholar] [CrossRef]
- Privat, G.; Medvedev, A. Guidelines for Modelling with NGSI-LD. ETSI White Paper. 2021. Available online: https://www.etsi.org/images/files/ETSIWhitePapers/etsi_wp_42_NGSI_LD.pdf (accessed on 21 June 2022).
- Razzaq, A.; Ghayyur, S.A.K. A systematic mapping study: The new age of software architecture from monolithic to microservice architecture—Awareness and challenges. Comput. Appl. Eng. Educ. 2023, 31, 421–451. [Google Scholar] [CrossRef]
- Home—Fiware-IdM. Available online: https://fiware-idm.readthedocs.io/en/latest/ (accessed on 16 December 2021).
- Policy Decision Point (PDP)—Glossary. CSRC. Available online: https://csrc.nist.gov/glossary/term/policy_decision_point (accessed on 30 December 2021).
- Crate.io. CrateDB (Version 5.5) [Database]. Crate.io. 2023. Available online: https://cratedb.com/ (accessed on 1 December 2023).
- PostgreSQL Global Development Group. PostgreSQL (Version 14.2) [Database Management System]. PostgreSQL. 2023. Available online: https://www.postgresql.org/ (accessed on 1 December 2023).
- Cohen-Shacham, E.; Walters, G.; Janzen, C.; Maginnis, S. (Eds.) Nature-Based Solutions to Address Global Societal Challenges; IUCN: Gland, Switzerland, 2016. [Google Scholar] [CrossRef]
- Tsekeri, E.; Lilli, A.; Katsiokalis, M.; Gobakis, K.; Mania, A.; Kolokotsa, D. On the integration of nature-based solutions with digital innovation for health and wellbeing in cities. In Proceedings of the 2022 7th International Conference on Smart and Sustainable Technologies, SpliTech 2022, Bol and Split, Croatia, 5–8 July 2022; pp. 1–6. [Google Scholar] [CrossRef]
- Gramberger, M.; Zellmer, K.; Kok, K.; Metzger, M.J. Stakeholder integrated research (STIR): A new approach tested in climate change adaptation research. Clim. Chang. 2015, 128, 201–214. [Google Scholar] [CrossRef]
- Ballina, F.J.; Valdes, L.; Del Valle, E. The Phygital experience in the smart tourism destination. Int. J. Tour. Cities 2019, 5, 656–671. [Google Scholar] [CrossRef]
- Lehner, M.; Mont, O.; Heiskanen, E. Nudging—A promising tool for sustainable consumption behaviour? J. Clean. Prod. 2016, 134, 166–177. [Google Scholar] [CrossRef]


| Skelleftea, SE. Transformation of an old landfill area into a residential and educational area using nature-based solutions. | |
| Pilot Site Description | The area was covered with industrial buildings, road works, a district heating facility, and a fueling station. A new residential area with family housing of different kinds is built on the landfill area, creating a green connection in the region. |
| Smart Nature-Based Solutions | SE1. Build natural infrastructure to create urban resilience with ditches and ponds—monitoring of water flow and quality. |
| SE2. Creation of a wetland bed. Existing flora is complemented by planting to increase biodiversity (including pollinators), attractiveness, and functionality of the area. | |
| SE3. Installation of smart lighting to contribute to an inviting environment and encourage activities in the park. | |
| SE4. Educating and engaging citizens to increase their awareness of climate change and the importance of biodiversity. Information signs are installed in the park to help engage and educate visitors about nature-based solutions. | |
| SE5. Creation of a space in the park with bee hotels/insect habitats and permanent school material. Open-air classrooms are designed and built. | |
| Dundalk, IE Creation of Dundalk Library and Museum Quarter. | |
| Pilot Site Description | Albeit the smallest in Ireland, County Louth is also one of the most densely populated. The regeneration of a neighborhood area and the removal of car parking spaces assist in the creation of an accessible and high-quality green space. |
| Smart Nature-Based Solutions | IE1. Creation of an outdoor learning pod between Dundalk Library and Museum Quarter to showcase the newest technologies and host shared functions. The sensors measure the number of visitors, monitoring improvements to the use of the space. |
| IE2. Outdoor urban green learning and sensory garden. Increased sense of safety, recreation, relaxation, and stress reduction for the visitors by incorporating new seating areas and public lighting. A rainwater harvesting system encourages visitors to be more sustainable in water use. A new touch screen displays green learning. | |
| IE3. Sensors on bike stations. New bike stations equipped with sensors are installed at the site to improve cycling infrastructure for visitors and encourage active travel. The data collected on the number of cyclists provides a better understanding of space use. | |
| Leuven, BE Regeneration of a former hospital site. | |
| Pilot Site Description | The pilot area is a former hospital site in the city’s medieval center. This fully built area is transformed into a green district, where the rivers, the Dyle and the Aa, are re-opened, and the connection between the city center and the river landscape is re-established. The area becomes a multifunctional neighborhood with different housing typologies and economic and cultural functions. |
| Smart Nature-Based Solutions | BE1. Riverside urban living room linked to culture and heritage. An urban living room along the opened upriver area, directly connected with the history of the site, is integrated as part of the restored fortification wall. |
| BE2. Sensors for health and water measurements. The microclimatic conditions are monitored and interrelated with the site characteristics. | |
| BE3. Health trail. A “health trail” is formed with elements that stimulate movement for different ages, helping people work on their physical condition. This health trail forms a “loop,” like a closed circuit, connecting different points of attraction in the park (nature, education, playing, sports, moving, enjoying, meeting, etc.) | |
| BE4. IoT infrastructure for smart lighting and noise measurements. Smart lighting poles are installed next to the main walking trail in the new park. In those poles, noise sensors are integrated as a noise sensor ring. They can be used as a nudging tool to regulate the lighting intensity of the light poles in case night noise occurs. | |
| Novo mesto, SI Sports and recreational park Češča vas | |
| Pilot Site Description | The area of the sport and recreation park in Češča vas is a somewhat degraded forest area, where military facilities remained abandoned after 1991. An open velodrome was built in the southeastern part of the area in the 1990s, which was renovated in 2018 into a covered multifunctional facility for cycling and athletics. A comprehensive sports and recreation complex, which is used to cover the citizens’ needs for active leisure, is under construction. |
| Smart Nature-Based Solutions | SI1. Brownfield remediation and greening. The military brownfield at the pilot site is regenerated with plant species indigenous to the nearby Natura 2000 areas. As part of this measure, sensors to monitor air quality and meteorological data are installed. |
| SI2. Creating sustainable forest trails. To connect the facilities, sustainable trails in the surrounding mixed forest are created. | |
| SI3. Interconnectedness of facilities. Development of integrated business and environmental programs, information equipment for connecting facilities, enabling access for disabled people in and around facilities, social and educational events, strategic placement of Wi-Fi points, etc. | |
| SI4. Integrated management of SRC facilities. Sports and recreational facilities at ŠRC Češča vas are managed through a common ICT platform. Visitors’ movement tracking and detection sensors are installed. Additionally, public screens are placed where the visitor flow data and statistics from the aggregated data collected from other IoT sensors are displayed. | |
| SI5. IoT solutions for health and well-being monitoring. Visitor tracking sensors are placed at the pilot site to track the movement of visitors more accurately. | |
| Castelfranco Veneto, IT Blue and green areas for citizens’ well-being and health | |
| Pilot Site Description | The pilot area is the famous historical garden of Villa Revedin Bolasco designed and created between 1852 and 1865. The garden of the Villa borders the oncology hospital and a dedicated house for elderly people, as well as an urban daycare center for people affected by Alzheimer’s disease. |
| Smart Nature-Based Solutions | IT1. Garden access routes to ensure improved access according to the needs of the garden users. Renovation of the already existing access route to the garden, enhancing the accessibility of pedestrians and cyclists, and facilitating access for people with special mobility needs. |
| IT2. Analysis and monitoring of the psychological and physiological well-being of the elderly and people with Alzheimer’s visiting the historic garden. Collection of evidence about the behavior, physiological state, psychological well-being, and quality of life of the elderly and people with Alzheimer’s visiting the historic garden. | |
| IT3. Monitoring the microclimatic and environmental conditions in the different areas of the garden (forest area, open area, lake area). Based on this, an assessment is carried out of the effect of green and blue areas on the health and well-being of visitors, elderly people, and people with Alzheimer’s over the medium-term period. | |
| IT4. Best practices manual and local landscape observatory. Development of a best practices manual for the replicability of the design of green public spaces with a special focus on human health and well-being, and establishing a local observatory focused on the therapeutic effects of the landscape. | |
| IT5. Implementation of ICT tools. These tools support a rewarding experience for garden users and assist visitors with disabilities to increase safety during their visits to the garden. | |
| IT6. Adaptive and intelligent information systems (the so-called “virtual window” on the garden). Establishment of digital screens that show images and videos of the garden, and share sounds, to stimulate the curiosity of prospective visitors and engage citizens. Monitoring data are interactively visualized. | |
| Chania, GR Green space revitalization by incorporating innovative infrastructure | |
| Pilot Site Description | The solutions are located in various green spaces, schoolyards, neighborhoods, and public squares in Chania, as the developed solutions are mobile. |
| Smart Nature-Based Solutions | GR1. Mobile urban living room (MULR). Development of a convertible construction that can create inviting points in various public spaces. Educational and social activities and pop-up cultural events are anticipated in and around the living room, addressing all ages, designed and implemented to be fully accessible. Sensors are installed in the MULR to monitor air pollution, noise exposure, microclimatic conditions, etc. Through hosting local events, the MULR encourages citizens to provide self-perceived health and well-being data. |
| GR2. Sensors on bikes and bike stations. Public bikes and bike stations equipped with sensors collect environmental and health data. Combining these data with predictions from computational models and data from weather stations, urban health and well-being maps are created. Citizens can distinguish polluted from healthier, environmentally friendly urban areas. This strategy is expected to raise citizens’ environmental awareness and encourage them to visit green spaces more often, improving their H&WB. | |
| Gzira, Mt Regeneration of a high-traffic road | |
| Pilot Site Description | The pilot site is a high-traffic road called Rue D’Argens. Flanked by residential and office buildings on both sides, the road sees constant traffic and has little to no greenery. |
| Smart Nature-Based Solutions | MT1. Micro-greening interventions. Supply of plant seeds to promote the greening of balconies, facades, and interiors of households to raise awareness about the benefits of green solutions to H&WB. Greening of a bus stop area to increase vegetation, improve the visual aesthetics of the streetscape, and attract biodiversity into our urban settings. Temporary “pop-up parks” with greening and educational activities as a placemaking exercise to promote inclusion and build community ties. |
| MT2. Citizen science on air/noise quality to increase H&WB awareness. Sensors installed at various locations, mostly within Gzira, collect and compare data at different geographical points to identify the various pollutants and the amount of noise and air pollution in the area. | |
| MT3. Urban biodiversity education and engagement through a co-created community garden project. NBS interventions and citizen engagement activities are designed with local schools and Gzira Gardens with the intention of embedding a greener perspective into the educational institutions and cultural context. | |
| Pilot/Monitoring | Skelleftea | Dundalk | Leuven | Novo Mesto | Castelfranco | Chania | Gzira |
|---|---|---|---|---|---|---|---|
| Microclimatic conditions | X | X | X | X | X | X | X |
| Air quality | - | X | X | X | X | X | X |
| Wind | - | - | X | - | X | - | X |
| Noise | - | - | X | - | X | X | X |
| Water/Snow level and quality | X | X (rainwater harvesting) | - | - | - | - | - |
| Visitor numbers | X | X | X | X | X | X | X |
| Wearables for citizens | - | - | - | X | - | X | - |
| Energy meters | - | X | - | - | - | X | - |
| Site | Aerial Images | Digital Twins |
|---|---|---|
| Skelleftea |  |  |
| Dundalk |  |  |
| Leuven |  |  |
| Novo mesto |  |  |
| Castelfranco |  |  |
| Chania, GR |  |  |
| Gzira, MT | 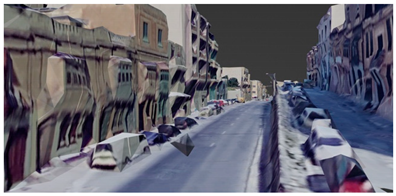 |  |
| Challenge | Expected impact | Indicator | SE | IE | IT | SI | MT | GR | BE |
|---|---|---|---|---|---|---|---|---|---|
| Climate mitigation and adaption | Reduced urban temperature | Decrease in mean or peak daytime local temperatures | x | x | |||||
| Improved human comfort | Measures of human comfort | x | x | x | |||||
| Water management | Improved surface water quality | Water quality indicators (physical) | x | ||||||
| Reduction in water routed to drainage network | Reduction in water routed to urban sewerage system | x | |||||||
| Improved surface water quality | Water quality indicators (chemical, biological) | x | x | ||||||
| Green space management | Increased public green space surface per capita | Surface of public green space per capita | x | ||||||
| Increased accessibility of urban green spaces | Accessibility of urban green spaces for the population | x | x | x | x | ||||
| Increased recreational or cultural value of green spaces | Recreational or cultural value of green spaces | x | x | x | x | x | x | x | |
| Increased weighted recreation opportunities | Weighted recreation opportunities | x | |||||||
| increased, green-related social services provided to the population | Green-related social services provided to the population | x | x | ||||||
| Increased use of green public space facilities | Effectiveness of seating locations | x | x | ||||||
| Increased urban biodiversity | Species richness and composition with respect to indigenous vegetation and local/national biodiversity targets | x | x | ||||||
| Increased urban biodiversity | Total area of designated sites of local biodiversity importance within the city | x | |||||||
| Increased connectivity to existing green infrastructure | Increased connectivity to existing green infrastructure | x | x | ||||||
| Increased urban biodiversity/increased pollinator species | Pollinator species increase | x | |||||||
| Increased urban biodiversity/improved environmental conditions/increase in bird presence | Increase in singing birds in green zones | x | |||||||
| Air/ambient quality | Improvement of local climatic conditions | Physical air quality indicators: temperature, humidity | x | x | x | x | |||
| Reduction of air pollution | Chemical air quality indicators | x | x | x | x | x | x | ||
| Reduction of air pollution | Air pollution episodes | x | |||||||
| Urban regeneration | Increased urban biodiversity/increased ecosystem services | Urban green: Index of biodiversity, provision and demand of ecosystem services | x | ||||||
| Increased accessibility of green spaces | Accessibility: distribution, configuration, and green space diversity and land use changes | x | |||||||
| Increased share of pedestrian areas | Road surface dedicated to pedestrians | x | |||||||
| Participatory planning and governance | Increased and improved participation | Openness of participatory processes | x | x | |||||
| Social justice and social cohesion | Greater inclusion of families with babies and individuals with restricted mobility | Accessibility of open public spaces and buildings for families with baby carriages and individuals with restricted mobility | x | x | x | ||||
| Public health and well-being | Reduced noise level | Noise reduction rates | x | x | x | x | x | ||
| Increased outdoor presence | No of hours spent outdoors, time people spend in the facility | x | x | x | |||||
| Increased health and well-being | Perceived well-being before and after the visit to green spaces | x | x | x | |||||
| Improved psychological well-being | Assessment of personal satisfaction with life, emotional competences | x | |||||||
| Improved quality of life | Feeling of improving quality of life | x | x | x | x | x | |||
| Reduced loneliness | Social and emotional loneliness perception | x | |||||||
| Improved cognitive abilities | Cognitive abilities | x | |||||||
| Improved restorativeness | Sense of place and received restorativeness | x | |||||||
| Increased residential attachment and satisfaction | Residential attachment and satisfaction | x | x | x | |||||
| Reduced behavioral and psychological symptoms in dementia | Behavioral and psychological symptoms of dementia | x | |||||||
| Increased outdoor physical activity | Number/share of people being physically active | x | x | x | |||||
| Increased outdoor physical activity | Increase in walking and cycling in and around areas of interventions | x | x | x | x | x | x | ||
| Reduced smoking | Smoke cessation due to sports activities in green areas | x | |||||||
| Increased outdoor physical activity | Level of physical activity in distances covered and average calories burned | x | |||||||
| Improved motor skills among the youth | Improved motor skills among the youth | x | |||||||
| Reduction in anxiety levels | Anxiety levels | x | x | ||||||
| Increased psychological well-being and/or quality of life: improved positive emotions; reduced negative emotions | Affective status | x | x | ||||||
| Potential for new economic opportunities and green jobs | Increased job opportunities | No. of jobs created | x | x | x | ||||
| Replication of solutions | Replication of solutions | x | x | x | x | x | x | x | |
| Savings in healthcare spending | Savings in healthcare spending | x | x | x | x | x |
| Skellefteå | Dundalk | Castelfranco | Novo Mesto | Gzira | Chania | Leuven | |
|---|---|---|---|---|---|---|---|
| Total surface of green spaces (km2) | 9588.0 | 3.2 | 500.0 | 3.4 | 1.8 | 0.3 | 24.6 |
| Per capita green surface (m2 per capita) | 215.0 | 24.6 * | 15.2 | 155.0 | 3.7 * | 5.3 | 242.0 * |
| Subjective Well-Being | Status | Gender | Age Group | Income | ||||||
|---|---|---|---|---|---|---|---|---|---|---|
| How Satisfied Are you with Your Life These Days? | Employed | Unemployed | Female | Male | 18–24 | Over 65 | 1-Quartile | 4-Quartile | ||
| SE | Skelleftea | 7.9 | 8 | 7.9 | 8 | 7.8 | 7 | 8.3 | 7.6 | 8.3 |
| IE | Dundalk | 7.7 | 7.9 | 7.5 | 7.7 | 7.7 | 7.8 | 7.7 | 7.1 | 8.2 |
| IT | Castelfranco | 6.6 | 6.8 | 6.4 | 6.6 | 6.6 | 7.1 | 6.4 | 5.7 | 7 |
| SI | Novo Mesto | 6.9 | 7.1 | 6.6 | 6.9 | 6.8 | 8 | 6.3 | 6.1 | 7.5 |
| MT | Gzira | 7.6 | 7.8 | 7.3 | 7.6 | 7.6 | 7.9 | 7.3 | 7.1 | 7.9 |
| EL | Chania | 5.3 | 5.6 | 5.1 | 5.3 | 5.2 | 6.7 | 4.9 | 4.5 | 5.8 |
| BE | Leuven | 7.3 | 7.5 | 7.1 | 7.3 | 7.3 | 7.6 | 7.4 | 6.8 | 7.6 |
Disclaimer/Publisher’s Note: The statements, opinions and data contained in all publications are solely those of the individual author(s) and contributor(s) and not of MDPI and/or the editor(s). MDPI and/or the editor(s) disclaim responsibility for any injury to people or property resulting from any ideas, methods, instructions or products referred to in the content. |
© 2023 by the authors. Licensee MDPI, Basel, Switzerland. This article is an open access article distributed under the terms and conditions of the Creative Commons Attribution (CC BY) license (https://creativecommons.org/licenses/by/4.0/).
Share and Cite
Kolokotsa, D.; Lilli, A.; Tsekeri, E.; Gobakis, K.; Katsiokalis, M.; Mania, A.; Baldacchino, N.; Polychronaki, S.; Buckley, N.; Micallef, D.; et al. The Intersection of the Green and the Smart City: A Data Platform for Health and Well-Being through Nature-Based Solutions. Smart Cities 2024, 7, 1-32. https://doi.org/10.3390/smartcities7010001
Kolokotsa D, Lilli A, Tsekeri E, Gobakis K, Katsiokalis M, Mania A, Baldacchino N, Polychronaki S, Buckley N, Micallef D, et al. The Intersection of the Green and the Smart City: A Data Platform for Health and Well-Being through Nature-Based Solutions. Smart Cities. 2024; 7(1):1-32. https://doi.org/10.3390/smartcities7010001
Chicago/Turabian StyleKolokotsa, Dionysia, Aikaterini Lilli, Elisavet Tsekeri, Kostas Gobakis, Minas Katsiokalis, Aikaterini Mania, Neil Baldacchino, Sevasti Polychronaki, Niall Buckley, Daniel Micallef, and et al. 2024. "The Intersection of the Green and the Smart City: A Data Platform for Health and Well-Being through Nature-Based Solutions" Smart Cities 7, no. 1: 1-32. https://doi.org/10.3390/smartcities7010001
APA StyleKolokotsa, D., Lilli, A., Tsekeri, E., Gobakis, K., Katsiokalis, M., Mania, A., Baldacchino, N., Polychronaki, S., Buckley, N., Micallef, D., Calleja, K., Clarke, E., Duca, E., Mali, L., & Bisello, A. (2024). The Intersection of the Green and the Smart City: A Data Platform for Health and Well-Being through Nature-Based Solutions. Smart Cities, 7(1), 1-32. https://doi.org/10.3390/smartcities7010001