
A Quantitative Model of Innovation Readiness in Urban Mobility: A Comparative Study of Smart Cities in the EU, Eastern Asia, and USA Regions


Abstract
:1. Introduction
- Identifying significant variables that address the maturity of a city to adopt innovative solutions through an extensive literature review process.
- Employing PCA to select the most vital indicators, thus defining the main innovation parameters for each urban environment.
- Assessing both random- and fixed-effects regression models to capture the impact of various unobserved variables, such as economic, cultural, and political factors, enables a precise calculation of the level of innovation readiness for each region.
2. Smart Cities and Innovation
3. Literature Review
- There seems to be a lack of research efforts focusing on how to effectively scale innovation readiness models across different urban settings, considering each city’s unique characteristics.
- There is a gap in research focused on the complex interplay between policy development, technology deployment, and stakeholder engagement in the context of smart city innovations.
- The impact of political and cultural variables on the uptake and efficacy of smart city innovations has not received enough attention in research.
- By examining different cities across three major regions, the study aims to provide insights into how diverse urban contexts influence innovation readiness and scalability.
- The study will consider governance structures and stakeholder participation as integral parts of the assessment of innovation readiness, addressing the dynamics between policy, technology, and stakeholders.
- Utilizing regression models to account for unobserved variables, and the PCA model for dimensionality reduction, the research will address specific cultural and political influences on innovation adoption, advocating for tailored strategies that reflect the unique contexts of each city.
4. Materials and Methods
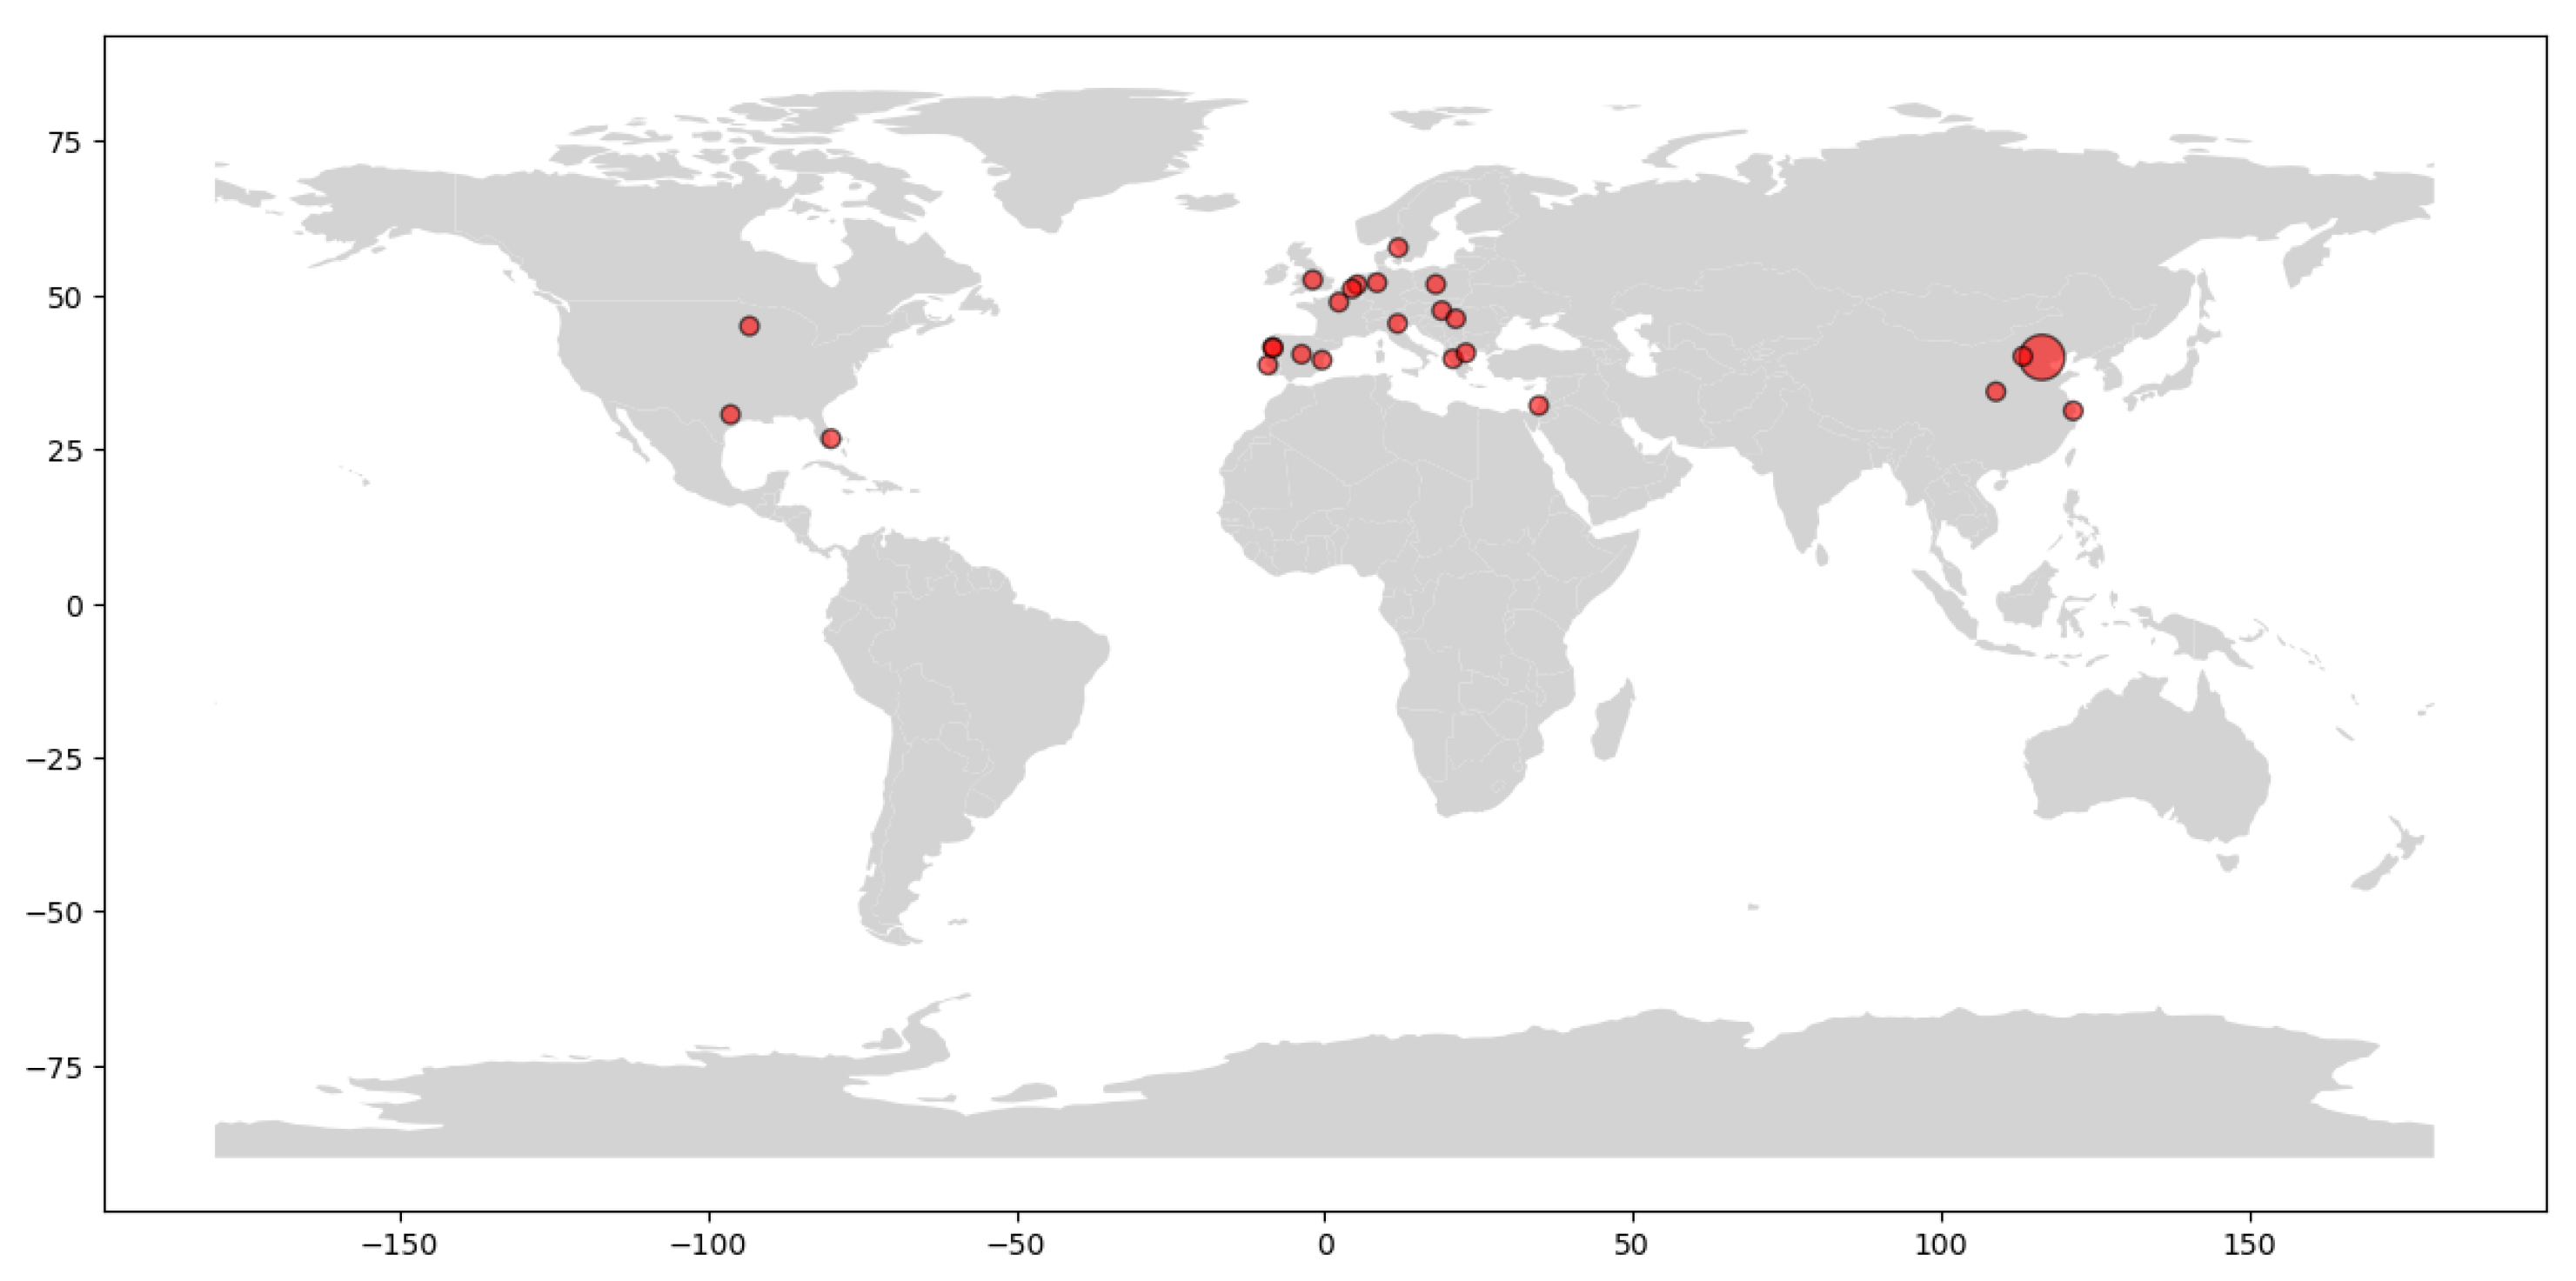
4.1. Survey Design and Data Collection
4.2. Methodology
5. Results and Discussion
6. Conclusions and Discussion
- A selective set of 7 out of 21 innovation indicators emerged as pivotal for predicting a city’s innovation readiness.
- The random-effects model was identified as more adept at capturing the influence of unobserved variables on the innovation readiness of cities, with a nuanced application at the city level.
- The city-level analysis revealed a diverse range of innovation readiness scores, with cities like Madrid, Gothenburg, and Mechelen demonstrating high readiness, while others like Kalisz and Datong showed lower scores.
- The bootstrap Hausman test was employed to validate the model selection, ensuring robustness against the small sample size limitations.
- The random-effects model was ultimately chosen for its efficacy in reflecting the diverse impacts of unobserved variables across different cities.
- The limited dataset size may constrain the generalizability of the findings, but it sets a precedent for future research in this domain.
- Variability in MAPE values across cities, such as 3.2% for Budapest and 0.1% for Madrid, suggests differential prediction accuracies, potentially affecting the reliability of the readiness scores.
- Policies and Regulations: Different regions have different policies and regulations that can significantly impact the readiness of a city to innovate. For example, cities in the European Union might be influenced by the overarching EU policies on innovation and smart city development, whereas cities in Eastern Asia and the United States might be subject to their national and local government policies [68].
- Governance Structures: The governance structures in place can also play a crucial role. Cities with more efficient and supportive governance structures might find it easier to adopt innovative solutions and transform into smart cities [69].
- Cultural Aspects: Cultural aspects, including the society’s openness to change and innovation, can also contribute to discrepancies. Cities in regions with a strong culture of innovation and adoption of technology might be more ready to embrace smart city solutions [70].
- Economic Conditions: The economic conditions of the region can also impact the innovation readiness of a city. Cities in economically stable regions might have more resources to invest in smart city initiatives, whereas cities in less stable regions might face financial constraints [71].
Author Contributions
Funding
Data Availability Statement
Conflicts of Interest
Appendix A

| Question | Score 1 | Score 2 | Score 3 | Score 4 | Score 5 |
|---|---|---|---|---|---|
| Q1 | Non expanded collaboration. There are no horizontal processes applied in planning and procurement in relation to mobility. | Multiple departments are involved in decision making for mobility but there are important gaps and inefficiencies. | Supporting innovation taken up in mobility is a recognized priority and the cooperation of related organizations has started (i.e., intergovernmental partnerships, innovation hubs were organized, emphasizing local innovation capacity for mobility, etc). However, no practical result yet for innovative mobility in the city. | Clear interdepartmental strategy towards implementation of innovative mobility policy exists but its implementation in practice (i.e., achieving generalization of pilots of solutions emerging by companies) is limited. Lack of knowledge and tools, legal obstacles and fragmented market initiatives create problems. | Innovative procurement process is applied and a dedicated Department or authority is responsible for coordinating the actors in speedy adoption and assessment of innovative solutions. Innovation scale up in mobility is already happening in the city. |
| Q2 | NO SUMP, NO SULP. | SUMP Under development. SULP not really advanced. | SUMP Plan in place and under implementation. Poor SULP activities. | Monitoring of SUMP implementation impact. Good SULP measures under assessment. | Full Public involvement for SUMP and SULP Linked with available finance and Political support. Many innovative solutions being part of the applied plan. |
| Q3 | No engagement available | Multi stakeholder platform available but no regular operation nore emphasis in emerging innovative solutions support. | Upon specific issues the stakeholders were (are) mobilized and solution was found to problems. | 6-month meetings among industry and public administration for solutions definitions and measures assessment | Citizens’ engagement platforms and freight partnerships available and in operation in the city. |
| Q4 | Initiatives are low. No funding available for innovative policymaking. City capacity is low in raise funding opportunities | City is participating in networks and initiatives for exploiting smart city including mobility dedicated funds with no results until now. | City or Regional funding is used for implementing small scale initiatives in mobility innovation. City welcomes private investments in emerging mobility solutions. | City is active in raising EU and national funds (participating in EU projects, smart cities mission) for test-bending innovative mobility solutions. | City has secured funding for wide development of integrated ICT and ITS enabled solutions for mobility. A District-wide infrastructure for smart city and smart mobility is under development. |
| Q5 | There are no (inter)national synergies with institutes. | There are national synergies with institutes and universities. | There are national and limited international synergies with institutes and universities. | There are national and international synergies with institutes and universities. | City is part of international collaborations and synergies. |
| Q6 | There are no research institutions (unis, research centers) available. City’s socioeconomical factors are not affected by the operation of institutions. It is not a university city. | Existence of small research institutions in the city (e.g., universities with low/medium reputation) | Existence of universities and research institutions in the city (e.g., universities and institutions with high national reputation). City’s socioeconomical factors are affected by the operation of institutions It is a university city | Unis and research institutions in the city (e.g., universities and institutions with high national reputation). Centre for start-ups/spin-offs foundations | institutes with high reputation, start up companies, research centres, technology parks. City’s socioeconomical factors are dominated by the operation of institutions It is a strong university city. |
| Q7 | Low Educational level of citizens (International standard classification of education (ISCED = 0–2)), aged population and low intern net access capacity. | Young people well educated and capable in electronic means, however important part of the population is considered disadvantages for digital services accessibility. | Medium Educational level of citizens (International standard classification of education (ISCED = 3–4)). Citizens are sufficiently competent in digital services. | Population in full transition towards digital competencies and good level of digital competence is already achieved. | High Educational level of citizens (International standard classification of education (ISCED = 5–8)) and society fully adapted to shared and electronic economy model. |
| Q8 | The government processes are not digitized yet (no e-governance). | Digitization government processes are under development or limited available (e-Documents, open meetings). | Data centric governance (citizen or user can proactively explore the new possibilities inherent in strategically collecting and leveraging data). | Managed (Fully Digital). The organization has fully committed to a data-centric approach to improving government, and the preferred approach to innovation is based on open data principles. | Optimizing governance (smart/innovative). Digital innovation using open data is embedded deeply across the entire government, with buy in and leadership from the top policymakers. |
| Q9 | Data are not open and easily accessible. | Data are open but not easily accessible. | Data are open and easily accessible. | Data are open, easily accessible and safe. | Data are open, easily accessible and safe and there is legal framework for ensuring data privacy. |
| Q10 | No data collection or rare surveys. | Traditional methods of collecting data (e.g., survey). | Smart infrastructure for data collection. | Observatories of data. | City as a living lab (e.g., Digital Twins). |
| Q11 | No data collection or rare surveys. | Traditional methods of collecting data (e.g., survey). | Smart infrastructure for data collection. | Observatories of data. | City as a living lab (e.g., Digital Twins). |
| Q12 | No data available and open data framework do not exist. | Open data framework accepted. | Stakeholders cooperation (PPP for data and knowledge exchange). | Observatories with cloud based data storage. Advanced data analysis techniques. | Living Labs and/or Digital Twins available. Advanced data analysis techniques. Simulation techniques for testing new innovations. |
| Q13 | No data available and open data framework do not exist. | Open data framework accepted. | Stakeholders cooperation (PPP for data and knowledge exchange). | Observatories with cloud based data storage. Advanced data analysis techniques. | Living Labs and/or Digital Twins available. Advanced data analysis techniques. Simulation techniques for testing new innovations. |
| Q14 | Old Modal transport infrastructure and lack of intermodal infrastructure and services. Technology penetration in Transport and mobility operation is low. | Old Modal transport infrastructures and lack of intermodal infrastructure and services. Electronic services have been introduced allowing for integrated use of mobility services. | Infrastructure of traditional modes need modernization. Emerging new mobility services (shared electric, micro mobility) are operating in the city but physical and digital infrastructure for their operation is not sufficient. | The city has modern transport and mobility infrastructure and services. There still lack of framework for their integration and lack of capacity for transition to advanced innovation taken up (i.e., autonomous automated mobility, multimodal, digital mobility services, etc). Digital infrastructure related to mobility needs further improvement. | In the city the infrastructure and services for innovative mobility are advanced and well integrated. Digital multimodal management services will follow soon. Private and Public actors capacity and collaboration is sufficient for transitioning towards innovation scale up in mobility. |
| Q15 | Old Modal transport infrastructure and lack of intermodal infra & services. Electronic services have been introduced allowing for integrated use of mobility services. | Infrastructure of traditional modes need modernization. Emerging new mobility services (shared electric , micro mobility) are operating in the city but physical & digital Infrastructure for their operation is not sufficient. | The city has modern transport & mobility infrastructure and services .There still lack of framework for their integration & lack of capacity for transition to advanced innovation taken up (ie autonomous automated mobility, multimodal digital mobility services, etc). Digital infrastructure related to mobility needs further improvement. | In my city the infrastructure & services for innovative mobility are advanced & well integrated. Digital Multimodal management Services will follow soon. Private and Public actors capacity & collaboration is sufficient for transitioning towards innovation scale up in mobility. | |
| Q16 | Lack of knowledge & expertise | Specific People in public sector with know-how | Team of experts tha can be mobilized for guiding innovation taken up in mobility. The city applies innovative policy for mobility "based on analogy results" from other cities and knowledge gained through networks. | City has acess to specialized organizations and tools for guiding decision making on mobility solutions to be adopted, assessing the solutions impact and developing dedicated policies to strengthening innovation | Capacity is sufficient in the city ecosystem (ie operation of capacity building platform with the stakeholders) and competence is available (ie mobility competence center) for innovative mobility policy & solutions taken up. |
| Q17 | Specific People in public sector with know-how | Team of experts that can be mobilized for guiding innovation taken up in mobility. The city applies innovative policy for mobility "based on analogy results" from other cities and knowledge gained through networks. | City has acess to specialized organizations and tools for guiding decision making on mobility solutions to be adopted, assessing the solutions impact and developing dedicated policies to strengthening innovation | Capacity is sufficient in the city ecosystem (ie operation of capacity building platform with the stakeholders) and competence is available (ie mobility competence center) for innovative mobility policy & solutions taken up. | |
| Q18 | Car is the dominant mode of transport >40%. No available New Mobility Solutions (NMS) ∼0%. There is no noticeable change is active modes use for the past 3 years <30%. Low use of green vehicles <10%. | Available New Mobility Solutions (NMS). Car is still the dominant mode of transport. There is a small tendency to active modes use. Increased use of green vehicles ∼20%. | Increased use of active modes and New Mobility Solutions (NMS). Car use is decreased Green cars are increased. | Increased use of active modes and New Mobility Solutions (NMS). Car use is decreased Green cars are increased. | Increased use of active modes and New Mobility Solutions (NMS). Conventional cars are not used ∼0%. Green cars are increased ∼100%. |
| Q19 | No existing synergies and non previous experience as pilot city in national or EU smart mobility program. | Rare synergies between companies for urban mobility innovations. Local very small implementation of collaborative business models in smart mobility. | Participation in EU funds and/or contribution as pilot city. Occasional synergies between companies for urban mobility innovations (no formal cooperation schemes). | Clusters between the companies in urban mobility of the city preparing and demonstrating collaborative business models and smart mobility solutions (MaaS under preparation, | Synergies with big innovators, (MaaS implemented, electric shared mobility in the city, multimodal digital management services in process, etc). Participation in EU funds and/or contribution as pilot city. Research results are generalized and extended and innovation acceleration activities are implemented. |
| Q20 | No existing synergies and non previous experience as pilot city in national or EU smart mobility program. | Rare synergies between companies for urban mobility innovations. Local very small implementation of collaborative business models in smart mobility. | Participation in EU funds and/or contribution as pilot city. Occasional synergies between companies for urban mobility innovations (no formal cooperation schemes). | Clusters between the companies in urban mobility of the city preparing and demonstrating collaborative business models and smart mobility solutions (MaaS under preparation, | Synergies with big innovators, (MaaS implemented, electric shared mobility in the city, multimodal digital management services in process, etc). Participation in EU funds and/or contribution as pilot city. Research results are generalized and extended and innovation acceleration activities are implemented. |
| Q21 | No high tech companies and start-ups | The city has few high-tech companies and no start-ups (e.g., 100 tech companies and <10 startups) | The city has high-tech companies and start-ups (e.g., 100 tech companies and 100 startups) | The city has high-tech companies and start-ups (e.g., 400 tech companies and 200 startups). | The city is hub for technology and innovation (Big innovators and Startups) (e.g., 2.2 k tech companies and 1.6 k startups). |
References
- Allam, Z.; Dhunny, Z.A. On Big Data, Artificial Intelligence and smart cities. Cities 2019, 25, 80–91. [Google Scholar] [CrossRef]
- Moustaka, V.; Maitis, A.; Vakali, A.; Anthopoulos, L.G. CityDNA dynamics: A model for smart city maturity and performance benchmarking. In Proceedings of the Web Conference, Taipei, Taiwan, 20–24 April 2020. [Google Scholar]
- Anthopoulos, L.G. Understanding smart cities: A tool for smart government or an industrial trick? In Public Administration and Information Technology; Christopher, G., Ed.; Springer: Cham, Switzerland; San Antonio, TX, USA, 2017. [Google Scholar]
- Ibrahim, M.; El-Zaart, A.; Adams, C. Paving the way to smart sustainable cities: Transformation models and challenges. J. Inf. Syst. Technol. Manag. 2016, 12, 559–576. [Google Scholar] [CrossRef]
- Lee, J.H.; Hancock, M.G.; Hu, M.-C. Towards an effective framework for building Smart Cities: Lessons from Seoul and San Francisco. Technol. Forecast. Soc. Chang. 2014, 89, 80–99. [Google Scholar] [CrossRef]
- Rizun, N.; Ciesielska, M.; Pereira, G.; Alexopoulos, C. Mapping negative unintended consequences of disruptive technologies use in smart cities. In ECIS 2021 Research Papers; ECIS: Marrakech, Morocco, 2021; p. 100. [Google Scholar]
- Nezai, A.; Abdellah, N.; Yazid, K. The potential offered by smart cities to promote smart tourist destinations. Tech. Soc. Sci. J. 2021, 22, 651–666. [Google Scholar] [CrossRef]
- Kiyu, A.; Alen, J.; Ali, A. Smart and Healthy Cities: Perspectives from Kuching City. In Proceedings of the 6th Asia-Pacific Conference on Public Health 2019, Penang, Malaysia, 22–25 July 2019. [Google Scholar]
- Buch, T.; Hamann, S.; Niebuhr, A.; Rossen, A. How to woo the smart ones? Evaluating the determinants that particularly attract highly qualified people to cities. J. Urban Aff. 2017, 36, 764–782. [Google Scholar] [CrossRef]
- Hidayanto, A. Smart City Readiness Model based on Technology-Organization-Environment (TOE) Framework and Its Effect on Adoption Decision Completed Research Paper. In Proceedings of the The 22nd Pacific Asia Conference on Information Systems (PACIS 2018), Yokohama, Japan, 26–30 June 2018. [Google Scholar]
- Wooldridge, J.M. Introductory Econometrics: A Modern Approach, 5th ed.; Cengage Learning: Boston, MA, USA, 2013. [Google Scholar]
- Wooldridge, J.M. Introductory Econometrics: A Modern Approach, 7th ed.; Cengage Learning: Boston, MA, USA, 2019. [Google Scholar]
- Wooldridge, J.M. Econometric Analysis of Cross Section and Panel Data, 1st ed.; The MIT Press: Cambridge, MA, USA, 2008. [Google Scholar]
- Baltagi, B.H. Econometric Analysis of Panel Data, 6th ed.; Springer: Cham, Switzerland, 2021. [Google Scholar]
- Ahmed, A.A.; Belrzaeg, M.; Nassar, Y.; El-Khozondar, H.J.; Khaleel, M.; Alsharif, A. A comprehensive review towards smart homes and cities considering sustainability developments, concepts, and future trends. World J. Adv. Res. Rev. 2023, 19, 1482–1489. [Google Scholar] [CrossRef]
- Ortega-Fernández, A.; Martín-Rojas, R.; García-Morales, V.J. Artificial Intelligence in the Urban Environment: Smart Cities as Models for Developing Innovation and Sustainability. Sustainability 2020, 12, 7860. [Google Scholar] [CrossRef]
- Mittal, S.; Sethi, M. Smart and Livable Cities: Opportunities to Enhance Quality of Life and Realize Multiple Co-benefits. In Mainstreaming Climate Co-Benefits in Indian Cities; Exploring Urban Change in South Asia; Sethi, M., Puppim de Oliveira, J., Eds.; Springer: Cham, Switzerland; Singapore, 2018. [Google Scholar]
- Praharaj, S. Area-Based Urban Renewal Approach for Smart Cities Development in India: Challenges of Inclusion and Sustainability. Urban Plan. 2021, 6, 202–215. [Google Scholar] [CrossRef]
- Lee, J.; Babcock, J.; Pham, T.S.; Bui, T.H.; Kang, M. Smart city as a social transition towards inclusive development through technology: A tale of four smart cities. Int. J. Urban Sci. 2021, 6, 202–215. [Google Scholar]
- Giuliodori, A.; Berrone, P.; Ricart, J.E. Where smart meets sustainability: The role of Smart Governance in achieving the Sustainable Development Goals in cities. BRQ Bus. Res. Q. 2023, 26, 27–44. [Google Scholar] [CrossRef]
- Fieuw, W.; Foth, M.; Caldwell, G.A. Towards a More-than-Human Approach to Smart and Sustainable Urban Development: Designing for Multispecies Justice. Sustainability 2022, 14, 948. [Google Scholar] [CrossRef]
- Romanelli, M. Driving smart cities through smart projects. In Proceedings of the Management Trends in the Context of Industry 4.0, Online, 4 December 2020; EAI Endorsed Transactions on Smart Cities. EAI: Bratislava, Slovakia, 2021. [Google Scholar]
- Milovan, K.; Snežana, T.; Mladen, K.; Bayane, B.M. Novel Spherical Fuzzy MARCOS Method for Assessment of Drone-Based City Logistics Concepts. Complexity 2021, 2021, 2374955. [Google Scholar]
- Kitzmann, N.H.; Romanczuk, P.; Wunderling, N.; Donges, J.F. Detecting contagious spreading of urban innovations on the global city network. Eur. Phys. J. Spec. Top. 2022, 231, 1609–1624. [Google Scholar] [CrossRef]
- Xu, L.; Fan, M.; Yang, L.; Shao, S. Heterogeneous green innovations and carbon emission performance: Evidence at China’s city level. Energy Econ. 2021, 99, 105269. [Google Scholar] [CrossRef]
- OECD. Measuring Smart Cities’ Performance, 1st ed.; OECD: Paris, France, 2020. [Google Scholar]
- Strategic Resilience Initiative (SRI). Available online: https://energy.ec.europa.eu/system/files/2022-03/SRI%20Factsheet.pdf (accessed on 3 October 2023).
- Mashau, N.L.; Kroeze, J.H.; Howard, G.R. An integrated conceptual framework to assess small and rural municipalities’ readiness for Smart City Implementation: A Systematic Literature Review. In Lecture Notes in Computer Science; Springer: Cham, Switzerland, 2021; pp. 262–273. [Google Scholar]
- Noori, N.; de Jong, M.; Hoppe, T. Towards an integrated framework to measure smart city readiness: The case of Iranian cities. Smart Cities 2020, 3, 676–704. [Google Scholar] [CrossRef]
- Gheorghița, D.; Ana-Angela, M.; Letiția, A.M.; Anna-Maria, P.; Dragoș, D. Does Circular Economy Contribute to Smart Cities’ Sustainable Development? Int. J. Environ. Res. Public Health 2022, 19, 7627. [Google Scholar]
- Chen, Y.; Li, R.; Zeng, E.-Y.; Li, P. City spatial structure and smart city innovation: The case of China. Emerald 2022, 122, 2217–2236. [Google Scholar] [CrossRef]
- Al-Masri, A.N.; Ijeh, A.; Nasir, M.M. Smart City Framework Development: Challenges and Solutions. In Smart Technologies and Innovation for a Sustainable Future; Springer: Cham, Switzerland, 2019. [Google Scholar]
- Das, D.; Sonar, S. Exploring Dimensions and Elements for Smart City Development in India. In Urbanization and Regional Sustainability in South Asia; Contemporary South Asian, Studies; Bandyopadhyay, S., Pathak, C., Dentinho, T., Eds.; Springer: Cham, Switzerland, 2020. [Google Scholar]
- Paskaleva, K.; Cooper, I.; Linde, P.; Peterson, B.; Götz, C. Stakeholder engagement in the smart city: Making living labs work. In Transforming City Governments for Successful Smart Cities; Public Administration and Information, Technology; Rodríguez-Bolívar, M., Ed.; Springer: Cham, Switzerland, 2020; Volume 8. [Google Scholar]
- Wahyuddin, Y.; Wibowo, M. The Socio-Technical Governance of Smart City to Scaffold City Energy Transition Policy. Civ. Eng. Archit. 2021, 9, 514. [Google Scholar] [CrossRef]
- Lima, D.N.D.O.; Filho, F.D.S.P. Smart Cities and Urban Mobility for Innovation and Sustainability. Int. J. Bus. Adm. 2022, 13, 10–18. [Google Scholar]
- Bridi, G.; Santos, E.; Viera de Viera, E. Smart Mobility and Cities: A Study from Toronto-on. Int. J. Bus. Adm. 2020, 11, 35–45. [Google Scholar] [CrossRef]
- Derlukiewicz, N.; Szałata, Ł.; Mańkowska, D. Scaling Up Innovation—Exemplary Initiatives for Sustainable Development in European Smart Cities with a Focus on Smart Mobility. Eur. J. Sustain. Dev. 2023, 12, 229. [Google Scholar] [CrossRef]
- Agriesti, S.; Soe, R.-M.; Saif, M.A. Framework for connecting the mobility challenges in low density areas to smart mobility solutions: The case study of Estonian municipalities. Eur. Transp. Res. Rev. 2022, 14, 32. [Google Scholar] [CrossRef]
- Qu, Y.M.; Ostrouchov, G.; Samatova, N.; Geist, A. Principal Component Analysis for Dimension Reduction in Massive Distributed Data Sets. In Proceedings of the Second SIAM International Conference on Data Mining, Arlington, VA, USA, 11–13 April 2002. [Google Scholar]
- Akama, Y.; Husnaqilati, A. A Dichotomous Behavior of Guttman–Kaiser Criterion from Equi-Correlated Normal Population. J. Indones. Math. Soc. 2019, 25, 205–213. [Google Scholar] [CrossRef]
- Pandey, I.M.M. The expected stock returns of Malaysian firms: A panel data analysis. SSRN Electron. J. 2002. [Google Scholar] [CrossRef]
- Hausman, J.A. Specification tests in Econometrics. Econometrica 1978, 46, 1251. [Google Scholar] [CrossRef]
- Greene, W.H. Econometric Analysis, 8th ed.; Pearson: New York, NY, USA, 2018. [Google Scholar]
- Uyarra, E.; Edler, J.; Garcia-Estevez, J.; Georghiou, L.; Yeow, J. Barriers to innovation through Public Procurement: A supplier perspective. Technovation 2014, 34, 631–645. [Google Scholar] [CrossRef]
- Banister, D. The Sustainable Mobility Paradigm. Transp. Policy 2008, 15, 73–80. [Google Scholar] [CrossRef]
- Nam, T.; Pardo, T.A. Conceptualizing smart city with dimensions of technology, people, and Institutions. In Proceedings of the 12th Annual International Digital Government Research Conference: Digital Government Innovation in Challenging Times, College Park, MD, USA, 12–15 June 2011. [Google Scholar]
- Carayannis, E.G.; Barth, T.D.; Campbell, D.F. The quintuple helix innovation model: Global warming as a challenge and driver for Innovation. J. Innov. Entrep. 2012, 1, 2. [Google Scholar] [CrossRef]
- Cooke, P. Regionally asymmetric knowledge capabilities and open innovation: Exploring ‘Globalisation 2’—A new model of industry organisation. Res. Policy 2005, 34, 1128–1149. [Google Scholar] [CrossRef]
- Smith, H.L.; Romeo, S.; Bagchi-Sen, S. Oxfordshire Biomedical University spin-offs: An evolving system. Camb. J. Reg. Econ. Soc. 2008, 1, 303–319. [Google Scholar] [CrossRef]
- Glaeser, E.L.; Kallal, H.D.; Scheinkman, J.A.; Shleifer, A. Growth in Cities. J. Political Econ. 1992, 100, 1126–1152. [Google Scholar] [CrossRef]
- Gil-Garcia, J.R.; Pardo, T.A.; Nam, T. What makes a city smart? Identifying core components and proposing an integrative and comprehensive conceptualization. Inf. Polity 2015, 20, 61–87. [Google Scholar] [CrossRef]
- Abella, A.; Ortiz-de-Urbina-Criado, M.; De-Pablos-Heredero, C. A model for the analysis of data-driven innovation and value generation in Smart Cities’ Ecosystems. Cities 2017, 20, 47–53. [Google Scholar] [CrossRef]
- Kamargianni, M.; Li, W.; Matyas, M.; Schäfer, A. A critical review of new mobility services for urban transport. Transp. Res. Procedia 2016, 14, 3294–3303. [Google Scholar] [CrossRef]
- ITF. Big Data and Transport: Understanding and Assessing Options. In International Transport Forum Policy Papers; OECD Publishing: Paris, France, 2016; No. 8. [Google Scholar]
- Marsden, G.; Frick, K.T.; May, A.D.; Deakin, E. How do cities approach policy innovation and policy learning? A study of 30 policies in Northern Europe and North America. Transp. Policy 2011, 18, 501–512. [Google Scholar] [CrossRef]
- International Transport Forum Policy Papers. Available online: https://www.oecd-ilibrary.org/transport/international-transport-forum-policy-papers_24108871 (accessed on 3 October 2023).
- Duca, G.; Trincone, B.; Bagamanova, M.; Meincke, P.; Russo, R.; Sangermano, V. Passenger dimensions in sustainable multimodal mobility services. Sustainability 2022, 14, 12254. [Google Scholar] [CrossRef]
- Behrends, S.; Lindholm, M.; Woxenius, J. The impact of urban freight transport: A definition of sustainability from an actor’s perspective. Transp. Plan. Technol. 2008, 31, 693–713. [Google Scholar] [CrossRef]
- The Future of Mobility. Available online: https://www.mckinsey.com/industries/automotive-and-assembly/our-insights/the-future-of-mobility-mobility-evolves (accessed on 3 October 2023).
- Evangelista, P.; McKinnon, A.; Sweeney, E. Technology adoption in small and medium-sized logistics providers. Ind. Manag. Data Syst. 2013, 113, 967–989. [Google Scholar] [CrossRef]
- Handy, S.; van Wee, B.; Kroesen, M. Promoting cycling for transport: Research needs and challenges. Transp. Rev. 2014, 34, 4–24. [Google Scholar] [CrossRef]
- Evangelista, P.; Huge-Brodin, M.; Isaksson, K.; Sweeney, E. Purchasing Green Transport and logistics services: Implications from the Environmental Sustainability Attitude of 3PLs. In Sustainable Practices: Concepts, Methodologies, Tools, and Applications; IGI Global: Hershey, PA, USA, 2017; pp. 86–102. [Google Scholar]
- Audretsch, D.B.; Heger, D.; Veith, T. Infrastructure and Entrepreneurship. Small Bus. Econ. 2014, 44, 219–230. [Google Scholar] [CrossRef]
- Shapiro, S.S.; Wilk, M.B. An analysis of variance test for normality (complete samples). Biometrika 1965, 52, 591–611. [Google Scholar] [CrossRef]
- Cameron, A.C.; Gelbach, J.B.; Miller, D.L. Bootstrap-based improvements for inference with clustered errors. Rev. Econ. Stat. 2008, 90, 414–427. [Google Scholar] [CrossRef]
- Efron, B. The Jackknife, the Bootstrap and Other Resampling Plans; SIAM: Stanford, CA, USA, 1982. [Google Scholar]
- Kourtit, K.; Nijkamp, P. Smart cities in the innovation age. Innov. Eur. J. Soc. Sci. Res. 2021, 25, 93–95. [Google Scholar] [CrossRef]
- Antonini, E.; Mussinelli, E. Toward the Smart City and Beyond. J. Technol. Arch. Environ. 2018, 1, 26–27. [Google Scholar]
- Antonini, E.; Boulanger, S.; Gaspari, J. Multi-layered Urban Strategies to Foster the Smart Cities Development. WIT Trans. Ecol. Environ. 2015, 194, 23–34. [Google Scholar]
- Balan, A.; Alboaie, S.; Kourtit, K.; Nijkamp, P. Transparency and Accountability in Urban Public Procurement: Design of a Self-Sovereign Blockchain App. Int. Arch. Photogramm. Remote Sens. Spat. Inf. Sci. 2020, XLIV-4/W2-2020, 9–16. [Google Scholar] [CrossRef]
| Participant | Weight |
|---|---|
| Beijing-1 | 19% |
| Beijing-2 | 19% |
| Beijing-3 | 13% |
| Beijing-4 | 13% |
| Beijing-5 | 19% |
| Beijing-6 | 19% |
| City | Affiliation | Role |
|---|---|---|
| Almada | Municipality of Almada | Mobility expert |
| Arad | City of Arad | Mobility expert |
| Bielefeld | City of Bielefeld | Head of Office for Mobility |
| Birmingham | Transport for West Midlands | Mobility Leader |
| Braga | City of Braga | Mobility expert |
| Budapest | Centre for Budapest Transport (BKK) | Head of Piloting and Modelling |
| Gothenburg | City of Gothenburg | Mobility expert |
| Guimarães | City of Guimarães | Mobility expert |
| Hertogenbosch | City of Hertogenbosch | Policy Maker |
| Ioannina | City of Ioannina | Mobility expert |
| Kalisz | City Hall Kalisz | Mobility expert |
| Madrid | Logistic Service Provider | Transport Operator |
| Mechelen | City of Mechelen | Mobility officer |
| Padua | Mobility department of Padua | Mobility expert |
| Région Île-de-France | Regio of Ile-de-France | Freight and Logistics Officer |
| Thessaloniki | Hellenic Institute of Transport | Mobility Expert |
| Valencia | Fundación Valenciaport | Pilot technical coordinator |
| College Station | Texas A&M University | Mobility expert |
| Minneapolis | City of Minneapolis | Mobility expert |
| Palm Beach | NGO | Project Manager |
| Beijing-1 | Public Institution | Project Manager |
| Beijing-2 | Public Institution | Mobility expert |
| Beijing-3 | Local Authority | Project Manager |
| Beijing-4 | Public Institution | Project Manager |
| Beijing-5 | Public Institution | Mobility expert |
| Beijing-6 | Regional Authority | Transport Operator |
| Datong | Local Authority | Project Manager |
| Shanghai | Local Authority | Project Manager |
| Tel Aviv | Technion—Israel Institute of Technology | Mobility Expert |
| Xi’an | Local Authority | Project Manager |
| No | Innovation Indicators |
|---|---|
| 1 | Coordination and adaption level for adopting innovative solutions [45] |
| 2 | Implementation level of sustainable urban mobility solutions [46] |
| 3 | Stakeholders’ engagement in co-creating and co-designing innovative mobility solutions [47] |
| 4 | Competence level in fundraising for innovation and public investment in smart innovative policy making [48] |
| 5 | Collaboration levels with neutral partners and other cities and organisations to transfer knowledge [49] |
| 6 | University Town with Research and Innovation Activities level [50] |
| 7 | City’s population’s educational and digital competence of the city population [51] |
| 8 | Smart and transparent levels of a city’s Government processes [52] |
| 9 | Open-source, safe and easily accessible level for mobility data [53] |
| 10 | Collection and data use level for understanding the current situation of passenger transport mobility [54] |
| 11 | Collection and data use level for understanding the current situation of freight transport mobility [55] |
| 12 | Reliance level on data and evidence to make passenger transport policies [56] |
| 13 | Reliance level on data and evidence to make freight transport policies [57] |
| 14 | Availability and intelligence level of multimodal passenger transport infrastructure and services in the city [58] |
| 15 | Availability and intelligence level of multimodal freight transport infrastructure and services in the city [59] |
| 16 | Skilled workforce level on innovative mobility solutions for passenger transport [60] |
| 17 | Skilled workforce level on innovative mobility solutions for freight transport [61] |
| 18 | Sustainable mobility services and green modes of transport use levels [62] |
| 19 | Openness level to new business models and the application of the triple helix of innovation to smart passenger mobility solutions [54] |
| 20 | Openness level to new business models and the application of the triple helix of innovation to smart freight mobility solutions [63] |
| 21 | Richness level in terms of the number of big innovators and high-tech companies [64] |
| Parameter | Nomenclature |
|---|---|
| The dependent variable that represents the readiness level for each entity considering the fixed-effects model. | |
| The regression coefficient of the independent variable | |
| The value of the independent variable . | |
| The individual fixed effect per entity . | |
| The normally distributed error term with zero mean and variance for each entity | |
| The probability density function of the normal distribution. |
| Parameter | Nomenclature |
|---|---|
| The dependent variable that represents the readiness level for each region considering the random-effects model | |
| The normally distributed random effect with zero mean and variance for each region | |
| The mean value of the unobserved heterogeneity (constant) |
| Innovation Indicators | PCA Loadings | Principal Components | Explained Variance |
|---|---|---|---|
| Collection and data use level for understanding the current situation of freight transport mobility | 31% | PC1 | 31% |
| Collaboration levels with neutral partners and other cities and organisations to transfer knowledge | 42% | PC2 | 13% |
| City’s sustainable mobility services and green modes of transport use levels | −39% | PC3 | 8% |
| Open-source, safe and easily accessible level for mobility data | −46% | PC4 | 8% |
| Coordination and adaption level for adopting innovative solutions | −63% | PC5 | 7% |
| Stakeholders’ engagement level in co-creating and co-designing innovative mobility solutions | 63% | PC6 | 6% |
| Level of competency in innovation fundraising and public investment in smart innovative policy making | 59% | PC7 | 5% |
| Variables | Count | Mean | Std | Min | 25% | 50% | 75% | Max |
|---|---|---|---|---|---|---|---|---|
| Coordination and adaption level for adopting innovative solutions | 30 | 3.3 | 1.1 | 1 | 2.3 | 3 | 4 | 5 |
| Stakeholders’ engagement level in co-creating and co-designing innovative mobility solutions | 30 | 3.1 | 0.9 | 1 | 3 | 3 | 3 | 5 |
| Competence level in fundraising for innovation and public investment in smart innovative policy making | 30 | 3.8 | 0.8 | 2 | 3 | 4 | 4 | 5 |
| Levels of collaboration with neutral partners and other cities and organizations to transfer knowledge | 30 | 4 | 1 | 2 | 3.3 | 4 | 5 | 5 |
| Open-source, safe and easily accessible level for mobility data | 30 | 3.1 | 1.2 | 2 | 2 | 3 | 4 | 5 |
| Data collection and use level to understand the current situation of freight transport mobility | 30 | 2.5 | 1.1 | 1 | 2 | 2.5 | 3 | 5 |
| The levels of use of sustainable mobility services and green modes of transport use levels | 30 | 2.7 | 1.1 | 1 | 2 | 2.5 | 4 | 5 |
| Innovation readiness | 30 | 66.5 | 10.6 | 40.7 | 62.1 | 65.7 | 71.8 | 89.4 |
| Indicators | p Value | Normality |
|---|---|---|
| 1 | 1.4% | Not Gaussian |
| 2 | 0.1% | Not Gaussian |
| 3 | 0.1% | Not Gaussian |
| 4 | 0.0% | Not Gaussian |
| 5 | 0.0% | Not Gaussian |
| 6 | 1.0% | Not Gaussian |
| 7 | 0.4% | Not Gaussian |
| Innovation Readiness Level | 27.6% | Gaussian |
| Results | Values |
|---|---|
| Hausman_Statistic | 0.26 |
| P_Value | 0.90 |
| Decision | Random Effects |
| Bootstrap_Mean | 0.72 |
| Bootstrap_Median | 0.62 |
| Bootstrap_Std | 0.45 |
| Bootstrap_2.5th_Percentile | 0.13 |
| Bootstrap_97.5th_Percentile | 1.93 |
| Variables | Mean Coef. |
|---|---|
| y Intercept | 11.3 |
| Coordination and adaption level for adopting innovative solutions | −0.13 |
| Stakeholders’ engagement level in co-creating and co-designing innovative mobility solutions | 2.34 |
| Competence level in fundraising for innovation and public investment in smart innovative policy making | 0.18 |
| Levels of collaboration with neutral partners and other cities and organizations to transfer knowledge | 2.29 |
| Open-source, safe and easily accessible level for mobility data | 4.11 |
| Data collection and use level to understand the current situation of freight transport mobility | −0.51 |
| The levels of use of sustainable mobility services and green modes of transport use levels Innovation readiness | 1.46 |
| Mean Random Effects | |
| EU | −3.76 |
| Eastern Asia | 6.27 |
| USA | 2.63 |
| City | Mean Predicted Innovation Readiness Score % | MAPE |
|---|---|---|
| Budapest | 50.90 | 3.2 |
| Kalisz | 35.19 | 1.5 |
| Padua | 44.67 | 1.5 |
| Tel Aviv | 40.59 | 0.0 |
| Valencia | 45.41 | 1.8 |
| Almada | 42.38 | 1.4 |
| Arad | 44.25 | 4.1 |
| Gothenburg | 56.11 | 1.9 |
| Hertogenbosch | 46.26 | 0.4 |
| Ioannina | 49.96 | 4.0 |
| Mechelen | 56.28 | 0.0 |
| Minneapolis | 49.02 | 2.6 |
| Région Île-de-France | 48.77 | 1.5 |
| Transport for West Midlands | 47.39 | 1.6 |
| Braga | 51.75 | 0.5 |
| Palm Beach | 44.88 | 1.0 |
| Madrid | 60.62 | 0.1 |
| Thessaloniki | 49.59 | 0.6 |
| Guimarães | 52.31 | 3.7 |
| Bielefeld | 49.10 | 1.1 |
| College Station | 46.20 | 1.3 |
| Xian | 46.45 | 1.3 |
| Beijing 1 | 48.65 | 1.3 |
| Shanghai | 40.10 | 3.3 |
| Datong | 35.92 | 2.1 |
Disclaimer/Publisher’s Note: The statements, opinions and data contained in all publications are solely those of the individual author(s) and contributor(s) and not of MDPI and/or the editor(s). MDPI and/or the editor(s) disclaim responsibility for any injury to people or property resulting from any ideas, methods, instructions or products referred to in the content. |
© 2023 by the authors. Licensee MDPI, Basel, Switzerland. This article is an open access article distributed under the terms and conditions of the Creative Commons Attribution (CC BY) license (https://creativecommons.org/licenses/by/4.0/).
Share and Cite
Ayfantopoulou, G.; Touloumidis, D.; Mallidis, I.; Xenou, E. A Quantitative Model of Innovation Readiness in Urban Mobility: A Comparative Study of Smart Cities in the EU, Eastern Asia, and USA Regions. Smart Cities 2023, 6, 3337-3358. https://doi.org/10.3390/smartcities6060148
Ayfantopoulou G, Touloumidis D, Mallidis I, Xenou E. A Quantitative Model of Innovation Readiness in Urban Mobility: A Comparative Study of Smart Cities in the EU, Eastern Asia, and USA Regions. Smart Cities. 2023; 6(6):3337-3358. https://doi.org/10.3390/smartcities6060148
Chicago/Turabian StyleAyfantopoulou, Georgia, Dimos Touloumidis, Ioannis Mallidis, and Elpida Xenou. 2023. "A Quantitative Model of Innovation Readiness in Urban Mobility: A Comparative Study of Smart Cities in the EU, Eastern Asia, and USA Regions" Smart Cities 6, no. 6: 3337-3358. https://doi.org/10.3390/smartcities6060148
APA StyleAyfantopoulou, G., Touloumidis, D., Mallidis, I., & Xenou, E. (2023). A Quantitative Model of Innovation Readiness in Urban Mobility: A Comparative Study of Smart Cities in the EU, Eastern Asia, and USA Regions. Smart Cities, 6(6), 3337-3358. https://doi.org/10.3390/smartcities6060148