1. Introduction
Residential buildings can play an important role for the development of a climate-neutral economy in Europe by 2050. Greenhouse gas (GHG) emissions-related residential building energy consumption in the form of electricity; gaseous, liquid, and solid fuels; and district heating accounts for six percent of the global energy and process emissions in 2021 [
1]. According to United Nations initiative ‘Global Alliance for Buildings and Construction’ report, residential building emissions have grown in recent years despite the energy efficiency measure, mainly due to increasing populations and living areas consisting of dwellings. These trends indicate that currently used energy technologies and national energy regulations are not successful enough for the implementation of international climate targets for avoiding climate change and limiting global warming to well below 2 °C [
2].
Given the recognition that climate change and the global environmental crises pose serious challenges, the European Union has created a set of energy-related objectives that must be met by all Member States and local governing bodies. The European Green Deal sets the main objective of cutting GHG emissions by 55% by 2030 and reaching climate neutrality by 2050 [
3]. The intensity of residential building energy-related GHG emissions must be reduced by roughly 35% from its current level, i.e., 540 MJ/m
2 to 342 MJ/m
2 annual specific energy consumption, in order to accomplish the required goal of net zero emissions in 2050 [
1]. In the case of Latvia, the annual specific energy consumption in residential buildings is even greater, up to 720 MJ/m
2 [
4]. Heating houses and preparing hot water are basic needs in many countries, including Latvia. There is currently a heated debate on how to improve heat delivery in order to reduce the use of fossil energy resources while maintaining an ideal level of cost [
5]. It is critical to identify alternatives to conventional solutions in order to assess the prospects for renewable energy development at a local level. Given that the potential of RES is altered by international policy, more precise information on the constraints for the applications of specific RES at a local level would be very useful [
6]. Currently, Latvia already accounts for around 42% of renewable energy in the gross final energy consumption [
7]. However, to further break down geographical and ecological constraints, it is vital to promote the efficient use of RES, such as increasing combustion efficiency in biomass boilers or installing high-efficiency solar panels.
A variety of solutions and technologies for achieving the reduction in energy consumption in buildings, including combinations of renewable energy sources (e.g., solar PV, wind energy, micro-cogeneration of biomass), energy-efficiency measures, and specific design of buildings; however, there is no single configuration that is optimal for all climates, regulations, building codes, and markets [
8]. There are also many potential benefits of energy retrofitting measures in buildings [
9,
10,
11], like comfort, costs of climate change, and health, which mainly depend on the selected technological solution. Evaluations to identify the best solution are not always straightforward due to complexity of the technologies and the wide range of environmental aspects to be considered at the same time.
The literature suggests that building-integrated solar PV modules have great potential for transforming energy systems [
12,
13,
14], and their application is widely studied for DH in the context of Latvia [
15]. The authors of [
16] concluded that solar PV with battery storage can be installed in 10% of all households in Latvia without any support policies if electricity prices remain the same. There are certain benefits reported for the application of combined heat and power productions [
17] and wood fuels [
18,
19]. Other studies [
20,
21,
22], have shown that there is also a benefit in terms of energy-related costs and carbon emission reduction in the application of micro-cogeneration (mCHP) units.
When making a choice concerning a certain energy supply technology in line with climate policies, the principal considerations should include the environmental burden-shifting phenomenon. A study on climate policy impacts for building energy use in New York City [
23] found that electricity used in buildings is relatively GHG intense and building electrification may not have emission reduction benefits unless the electrical grid is decarbonized. The results of the research also showed that narrow policies focusing on only GHG emission reduction may lead to a shift from centralized fossil fuels use to the combustion of biomass in residential buildings, consequently causing other impacts such as health problems due to higher rates of locally emitted air pollutants. Such problems are referred to as burden shifting, which plays an important role in the evaluation of building energy supply retrofitting scenarios [
24]. Many existing studies focusing on building energy systems besides GHG emissions [
25,
26,
27,
28] have assessed other environmental impacts related to the contribution of the acidification of soil and water, eutrophication, water resource depletion, human toxicity, etc., using approaches based on lifecycle thinking (LCT).
The concept of LCT goes beyond the traditional focus of product impact and allows the identification of the most suitable emission reduction strategies for energy systems, looking at the whole product system together, from the stage of raw material extraction to disposal [
23]. In this way, LCT helps the understanding of the side-effects of alternative solutions and creates awareness of burden displacement or shifting that may occur among proposed solutions in different products or process lifecycle stages [
26].
The LCT has set the foundation for life cycle assessment (LCA) evaluation systems in various industries and for various products. Several studies [
27,
28,
29,
30,
31] have shown that LCA method has been a useful to determine the environmental impacts of buildings and the energy use, considering different types of impacts and lifecycle stages and allowing to determine the potential burden shifts. The fundamental idea of LCA is to try to avoid burden shifting between environmental effect categories (for example, minimizing climate change while increasing land use) or between life cycle stages [
32]. For example, solar PV have no direct emissions during their use, yet carbon dioxide is emitted in their production stage [
33]. Looking at whole-life-cycle it is possible to identify and prevent the counter-acting negative impacts of the potential technological solution elsewhere.
Previously, the LCA approach has been applied to studies on the district heating system in Latvia [
34], but the residential building sector with its own heat production units has maintained unmapped. This study is undertaking the LCA approach to provide empirical evidence of impacts related to heat and electricity technologies applicable in residential single-family buildings in Latvia, including solar PV and mCHP, in order to understand their potential towards decrease of GHG emission related to residential energy consumption, and at the same time mitigating other environmental impacts and avoiding environmental burden shifts. The hypothesis is combination of alternative energy supply technologies allows to decrease the environmental impact of residential single-family buildings in Latvia compared to business as usual scenario. The results of the study will be useful for informing local stakeholders, including municipal policy planners, energy supply companies and house owners about the environmental impacts and the environmental ‘hot-spots’ associated with particular set of technological solution for single family residential house energy supply.
2. Methods
2.1. Method Definition
This is study undertakes the LCA methodology according to common reference framework ISO 14040:2006 [
35] to compare the environmental impact of different single family residential building energy supply scenarios. According to ISO 14040 standard the four main phases of an LCA study are:
- (1)
Goals and scope definition;
- (2)
Life Cycle Inventory (LCI);
- (3)
Life Cycle Impact Assessment (LCIA);
- (4)
Life Cycle Interpretation.
The methodology of LCA in constantly updated, but the common standard for performing an LCA studies remains the same is declared in ISO 14040. This standard provides general principles and framework of LCA. The framework integrates environmental thought all the products life cycle in quantitative terms, starting from the raw material extraction and processing, then the product’s manufacture, distribution and use, and finally to the recycling or disposal of the product.
The structure of this paper undertakes four main phases as presented in this section of the study ’ in the following way: the LCA phase dedicated to goal and scope describes the object of the study, functional unit and system boundaries. The data used in assessment is described in life cycle inventory section. The descriptions of assessment criteria are provided in the impact assessment section. The interpretation of the obtained results is given in the results section followed by conclusions.
2.2. Goal and Scope Definition
Recently emerging options for decentralized energy supply of single family residential building and their popularity addresses the need to evaluate and compare existing technological solution in different ways, including their environmental performance. The study aims to find which is the optimal solution for energy supply at local level for case of Latvia, taking into consideration multiple criteria and life cycle of technology for describing environmental burden.
Single family residential house in Latvia with living area of 200 square metres is selected as the object of the study. It considered to be a typical house with annual heat consumption of approximately 39 MWh
th and electricity consumption of 3516 kWh
el based on [
36]. The weather conditions in Latvia are described by the average annual air temperature of +5.9 °C with the warmest month is July of average temperature equal to 17.0 °C and the coldest months February with the average temperatures average minimum −7.9 °C. The sunny days when the sky is clear account for half of the possible sunshine—1790 h a year [
37].
The comparative LCA is performed for single family residential house in Latvia for following scenarios:
Scenario 1: Heat supply form boiler and electricity supply from the grid;
Scenario 2: Heat supply from boiler and electricity supply from PV panels;
Scenario 3: Heat and electricity supply from mCHP.
Accordingly, the Scenario 1 is considered to be “business as usual” scenario, in which heat is supplied by small scale boiler in building and electricity is supplied from the public network to fulfil the energy demand of the house. On the contrary, Scenarios 2 and 3 include alternative energy supply technologies installed in building.
The objective of this study is to clarify which of the defined scenarios has the lowest environmental impacts associated with the selected technologies from their cradle to use in energy production, including raw material extraction, transportation, processing, manufacturing, and fuel consumption among the compared scenarios. The end of life stage referring to disposal of technologies is not included in this study.
2.3. Functional Unit Definition
The functional unit (FU) in LCA is a quantified description of the function that product performs and serves as the reference for all calculations regarding products impact assessment during all life cycles. For this study, reference to heat and electrical energy consumption is included in the definition of FU. Moreover, the seasonality is an important factor that affects the energy consumption and therefore the demand for energy supply. This means consumption of energy over one full season is considered and technologies with respective generation power to meet the demand are used in the defined energy supply scenarios. Thus, the FU in this study refers to the annual thermal and electrical energy supplied to an average single-family residential building in Latvia. The FU is the supply of 39 MWhth and 3516 kWhel energy corresponding to the demand of single family residential house in Latvia with living area of 200 square metres.
2.4. System Boundaries
System boundaries in this study are set to include the foreground system (household) and background system (infrastructure and processes beyond household) used for energy supply to house. The consumption of energy within building is considered to be foreground system. The background system includes the processes related to be the production of the technologies, use of land, raw materials (e.g., wood) and general infrastructure (factories, roads, etc.). The production and transportation of electricity in public network is included in background system. Environmental impacts from emissions and resource extraction are accounted at the boundaries between the technological system and nature for all of the processes included in the system boundaries.
The system boundaries for Scenario 1 (see
Figure 1) in the foreground system include the heat generation in 30 kW
th boiler and the rest of the processes are taking place in the background system of the house energy supply. Wood harvesting, logging, transportation and electricity supply from the public network in amount that allows to the meat the annual energy demand of house is considered.
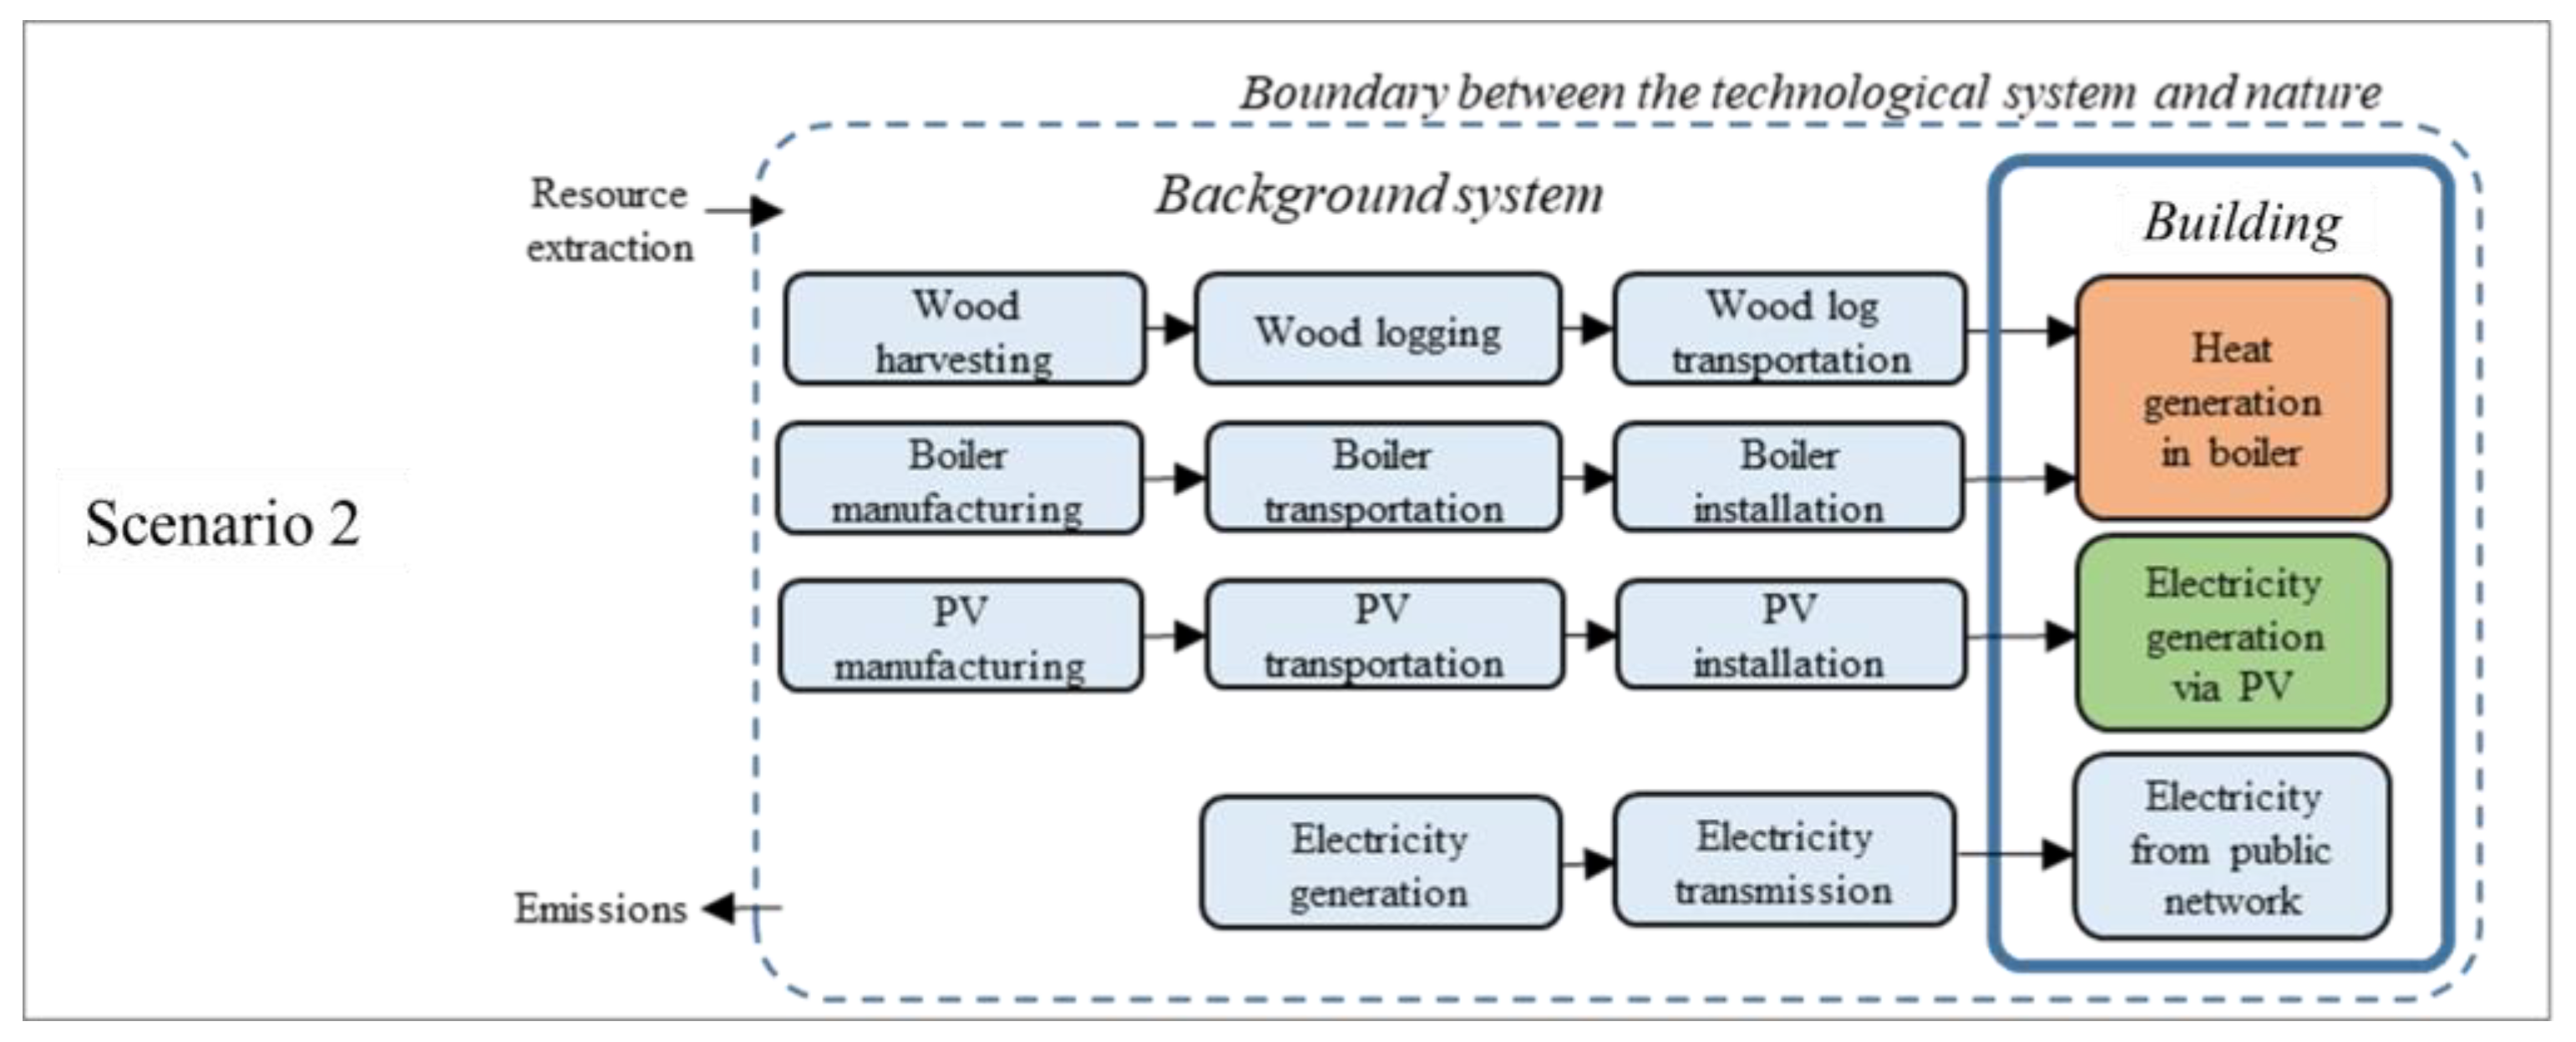
In Scenario 2 (see
Figure 2) the foreground system includes the heat supply form boiler same as in Scenario 1. In additional to electricity supply from the public network, a solar PV installation in the building with output power of 3 kW
el is included. During seasons when energy produced by PV panel is not enough to meet the electricity demand in the building, the electricity demand is covered by electricity form the public network.
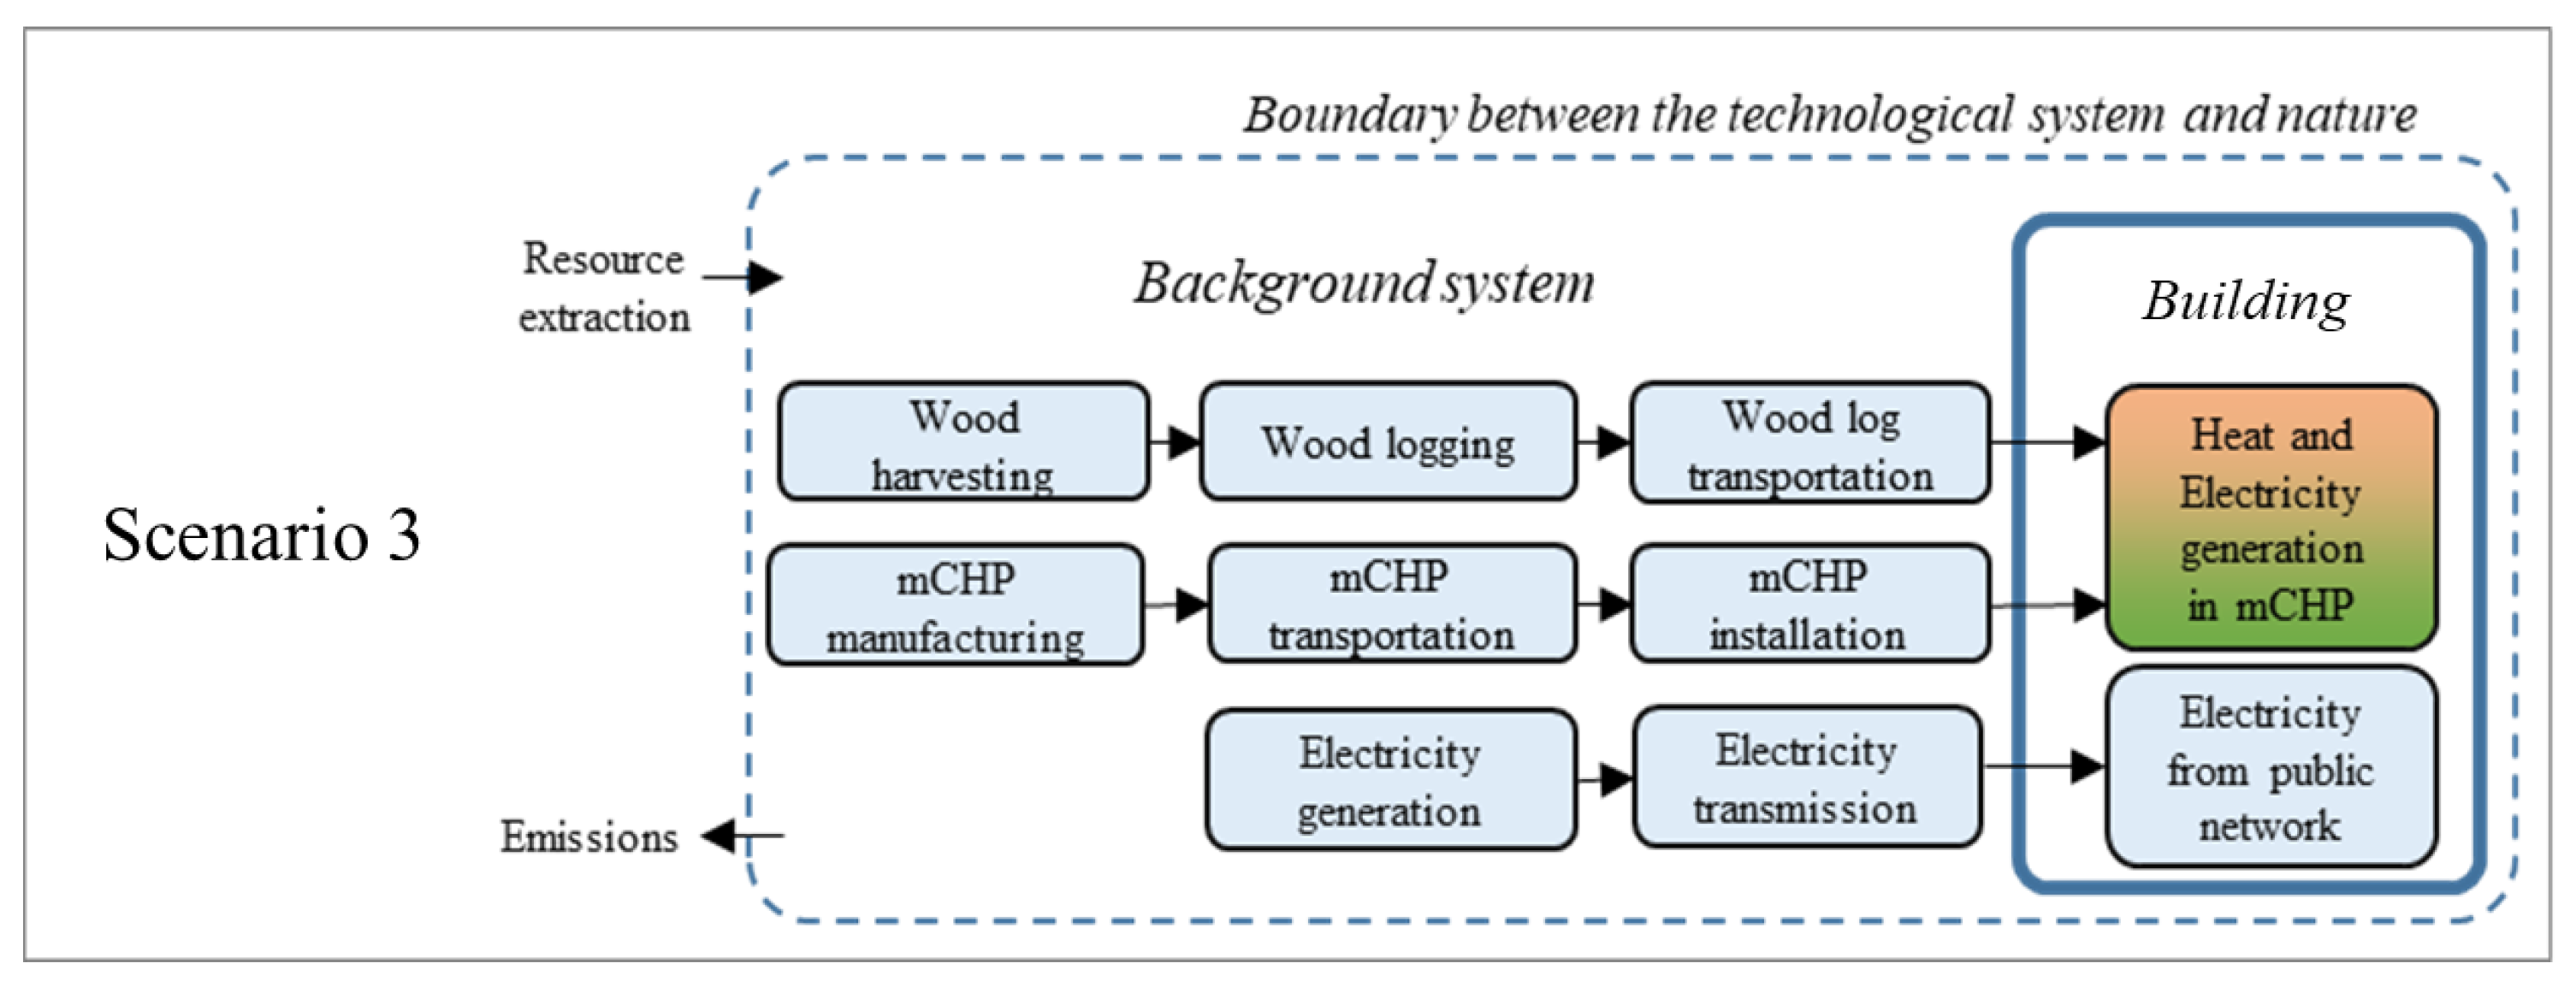
In Scenario 3 the foreground system (i.e., building) includes the same boiler as other scenarios, with additionally installed 1 kW
el Stirling engine in boiler. Therefore, in Scenario 3, heat and electricity is produced together in the micro-combined heat and power (mCHP) production unit in the building. Since the amount energy produced with 1 kW
el Stirling engine does not allow to fully meet the electricity demand of household, additional electricity from public network is considered. The system boundaries for Scenario 3 are shown in
Figure 3.
Within the given system boundaries and the frame of the defined life cycle impact assessment method, the study addresses the impacts related to all the resources and emissions accounted in the Ecoinvent datasets shown in life cycle inventory section. The impacts occurring during repair and change of technologies are not considered in the study. The transportation of technologies to the house before installation is considered only in terms of market average data available within Ecoinvent database. The selected system boundaries do not include any materials and processes related to energy transmission within house (pipes, electrical wires, radiators, etc.) and the processes not included in life cycle inventory data.
2.5. Life Cycle Inventory
The life cycle inventory includes flows from and to nature, raw materials and energy consumption, air emissions, land pollution, water pollution for the defined unit processes within the defined system boundaries. Such inventory for the defined scenarios is created with help of datasets from Ecoinvent 3.8 database [
38]. Ecoinvent is a well-recognized database that was started more than 20 years ago and now provides well documented process data for thousands of products. A peer review process made by internal LCA expert guarantees the quality and reliability of all the data in ecoinvent database [
39].
The quantitative values used for these datasets are based on estimations made in study [
36] for an average single-family residential building in Latvia. Data from Ecoinvent are based on generalized data to global and country average with allocation at the point of substitution, meaning that burdens of by-products in unit process are attributed proportionally to specific processes generating these by-products. The selected input parameter values of the life cycle impact assessment model are considered for specific case and are adjusted to the national electricity mix.
The selected datasets represent the foreground system and within the database are linked to the related to processes in background system. Input parameter values for defined scenarios are shown in
Table 1. The values are presented in respect to the defined FU. The input dataset from Ecoinvent is presented as declared in the database.
In the defined scenarios the heat is produced by combustion of mixed logs in furnace with 30 kWth thermal power. Heating parameter uses input dataset for heat production from combustion of wood logs according to the global average dataset. Wood log lower heating value is 9430 MJ/m3 and is representative for average installed technology. According to Ecoinvent documentation, the selected dataset represents average boiler technology available on market considering the annual operation including start-stop and part-load operation, which results in a reduced efficiency and increasing emissions, the delivery and combustion of wood logs, impacts related to infrastructure, the emissions to air, the electricity needed for operation, and the disposal of the ashes. The dataset is adjusted for purpose of the study by taking out the electricity consumed by the boiler in order to avoid double counting of electricity consumption in other inventory processes.
The dataset for heat from boiler process also includes the impacts related to furnace production and disposal estimated in respect to specific amount energy units produced within heat production. Furnace manufacture includes materials for hot water tank, the chimney flue pipes, concrete basement for furnace of 4 m2 and land transformation activities, but does not include storage silo for logs.
The dataset for electricity from public network considers medium voltage public network in Latvia and includes the impacts on environment created during generation of electricity and the transmission over high and medium voltage electricity network over aerial lines and cables, including the impacts related to high-to-medium voltage switching stations estimated in respect to specific amount energy units supplied. The dataset does not include leakage of insulation oil from cables and electro technical equipment (transformers, switchgear, circuit breakers) in case of accidental and emissions during production and deconstruction of the switchgear. The electricity mix for this Ecoinvent dataset is based on statistics from IEA World Energy Statistics and Balances for 2018.
The input parameters values for Scenario 2 are include the same heating parameter input as in Scenario 1, with an added electricity supply from solar PV. The values for solar PV are estimated for 3 kWel installed solar power panel and equal to annual production of 2400 kWh of electrical energy. The rest of house electricity demand remains supplied from public electricity network. The selected dataset for solar PV in Scenario 3 represents the global average production of grid-connected low voltage electricity with building integrated multi-Si panel PV module with an inverter to convert the low voltage DC power into AC power, considering the impacts created within the background system (impacts related to infrastructure, emissions). The selected Ecoinvent dataset considers environmental impacts in respect to specific amount of energy units produced by solar PV.
The input parameters values for Scenario 3 includes the same input for heating parameter as in Scenario A with addition of 1 kWel Stirling engine that is installed in boiler. Stirling engine dataset includes a global average scenario of a Stirling engine for combustion of wood pellets with power range of 1–3 kWel output and the processes and emissions in background system related to most important materials used for production, the energy needed for production, planning and engineering, transport of the raw materials and the installation on the site.
Ecoinvent dataset considers default efficiency for Stirling engine, however, in Scenario 3 the input parameter values are adjusted to Stirling engine efficiency results in previous case studies [
27], which equals to 1014 kWh
el produced by Stirling engine in combination with 30 kW
th boiler. Also, the lifetime of the Stirling engine is 15 years and therefore the input is value is the parameter is divided by the lifetime to consider the reference to yearly production in the defined FU for this study. The rest of electricity demand is covered by electricity from public network.
2.6. Life Cycle Impact Assessment Method
The ReCiPe 2016 method created by RIVM, Radboud University, Norwegian University of Science and Technology and PRé Sustainability is selected for environmental impact assessment. The method provides framework (see
Figure 3) to convert emissions and resource extractions into a limited number of environmental impact ratings by assessing life cycle impacts at midpoint (17 impact categories) and endpoint level, allowing to assess human health, ecosystem quality and resource scarcity as three areas of protection: Human health, Ecosystem, Resources [
40]. Human health damage is estimated in disability-adjusted life year (DALY) units. For Ecosystem impact, the rise in potentially vanished fraction of species (PDF) units is determined as described in [
41] and shown in
Figure 4 are included in ReCiPe 2016. The obtained scores are normalized to Eco-points units according to the hierarchism perspective, which refers to the normalisation values of indicators with the average weighting set of the world.
The current increased worldwide concern about climate change addresses the need to minimize GHG emissions. However, focusing just on GHG emissions may have unexpected implications, such as shifting the burden to other vital environmental concerns. The concept of ReCiPe 2016, which takes into account numerous effect categories and their relative importance, corresponds well with the larger viewpoint required in environmental policy planning. The use of ReCiPe 2016 guarantees that no single impact category is prioritized at the expense of others by embracing a broad range of environmental consequences, from climate change and resource depletion to human health and ecosystem quality. ReCiPe 2016 helps to perform a more balanced and informed assessment and to avoid the shifting of environmental loads from one impact category to another, which can happen when just a few categories are evaluated, therefore eventually facilitating sustainable decision-making across industries and product life cycles.
2.7. Life Cycle Impact Interpretation
The life cycle interpretation stage is primarily concerned with the description and discussion of the LCIA results, which are reported in
Section 3. Life cycle impact assessment results. The interpretation comprises of an examination of the models generated within the software for each scenario, the contribution of the selected technologies to the total impact of the scenario, an analysis of obtained midpoint category scores, endpoint (damage) category scores, and sensitivity analysis.
Sensitivity analysis is used as a tool to check the consistency of modelled scenarios, and understand the changes occurring in the output when inputs are changed. Within the defined technological systems, the electricity consumption must be responsive to the changes in energy demand. In the sensitivity analysis outcomes to changes in electricity consumption are tested by changing the input values for electrical consumption from the public network by −50%, −20%, −10% and +10%, +20%, +50% in relation to the base case input of each scenario mentioned in
Table 1 and these changes are then analysed for GHG emissions and the endpoint categories together. In such way, the sensitivity analysis allows to look climate change related indicator and the overall environmental performance in order to compare if there is there is a burden transfer in the defined scenarios under changing conditions in electricity consumption.
3. Life Cycle Impact Assessment Results
The results of the model created within SimaPro 9.5 software for single family residential building energy supply scenarios are analyzed in several perspectives, including the single scenario network tree and single scenario impacts per specific emission type, specific process contribution to overall impacts, impacts at midpoint and damage (endpoint) categories, and comparative analysis among different scenarios in the aforementioned perspectives. The multidimensionality of assessment criteria allows for the identification of where the consequences of environmental loads occur among the given scenarios. All of the data are reported per FU and accurately represent the differences between technologies in the analysed scenarios.
3.1. Analysis of Network Tree Diagram
The structure of the model is presented with model network tree allows to track the links between processes involved in the system and identify the main contributing processes to the environmental impacts. The figures of model network trees are presented for all scenarios by including only top 3 layers of processes and applying the cut-off of 4 per cent, because of large number of links is created within database processes for each scenario under study and it is not possible to show all the processes that have contribution to the impact less than 4 percent in one figure. The size of the link denotes the share of environmental impact of the node in respect to the total impact of the defined scenario. The share of impact for each process in the network tree diagrams is identified in per cent of total single score impact.
Model network tree for Scenario 1 in
Figure 5 shows the contribution in the total environmental impact comes heat production in boiler (70.9%) and electricity consumption form the public network (29.1%). Taking a look at the causes of the contribution within Scenario 1, within the heat production the largest share of impact is caused by preparation of wood logs (16.9%). When analysing the network tree for Scenario 1 beyond the cut-off of 4 per cent it is found that Furnace production and wood ash mixture are the next largest under heat production process contributors responsible for 1.36% and 0.02%, respectively. This is a considerably small contribution to the system’s environmental impact, and the remainder of the processes included in the model have even smaller than the two stated above.
Network tree diagram for Scenario 2 in
Figure 6 shows the share of impact for the heat production in boiler is up to 84.7%, electricity production with solar PV is added to the system and contributes to 4.2% of the total impact. The impacts related electricity consumption from public network in Scenario B are 11.1%.
Network tree for Scenario 3 in
Figure 7 shows environmental impacts share for heat production equal to 74.4%, for Electricity consumption form public network 21.8%, and 3.85% for Stirling engine. The main contributors to environmental impacts of Stirling engine is the manufacturing (total 552 processes), which includes a high number of extraction and processing of different metals and use of non-renewable fuels.
3.2. Impact Category Scores
The results presented at midpoint level are given for 14 impact categories in
Table 2. For most of impact categories at midpoint level the highest environmental impact score is for Scenario 1, followed by Scenario 3 and the lowest for Scenario 2, with the exception of the Freshwater eutrophication, Freshwater ecotoxicity and Marine ecotoxicity, Human non-carcinogenic toxicity, and Mineral resource scarcity impact categories. Freshwater eutrophication is constant at around 0.614 kg P eq. in scenarios 1 and 3 and is lowest in scenario 2 equal to 0.512 kg P eq.
A different spread of the impacts among analysed scenario is found amount for Freshwater and Marine ecotoxicity, Non-carcinogenic toxicity and Mineral resource scarcity, which signify that there is burden transfer among impact categories. Scenario 3 has the highest levels of freshwater and marine ecotoxicity. The non-carcinogenic toxicity to humans is the same for Scenario 1 and 2, but increases in Scenario 3. Scenario 1 has the lowest score for the mineral resource scarcity indicator, while Scenario 3 has the greatest.
Global warming, stratospheric ozone depletion, ionizing radiation, terrestrial acidification, and marine ecotoxicity are the effect categories where the disparities between scenarios are significant. The impact levels in these areas vary significantly among scenarios.
3.3. Damage Category Scores
The information on damages to environment caused by the environmental impacts described above according to the selected impact assessment methods are determined for thre categories: damage to human health, damage to ecosystem and damage to resource availability.
Global warming and ozone depletion are among the impact categories, as are ionizing radiation, fine particulate matter production, human carcinogenic and non-carcinogenic toxicity, and water consumption, all of which contribute to the overall estimate of human health impact in DALY. The impacts related to the damage to human health measured in DALY are reported in
Figure 8. Damage to human health is the highest in Scenario 1 and the lowest in Scenario 2. Fine Particulate Matter Formation has the highest damage to human health among the impact categories in analysed scenarios. The second highest impact is for Global warming category. The rest of the impact categories have a relatively small damage to human health.
The damage to the ecosystem for analysed scenarios is presented in PDF units in
Figure 9. The damage to ecosystem has the same distribution among scenarios as damage to human health. The highest damage is found in Scenario 1 and the lowest in Scenario 3. The highest contribution to the damage is coming from the land use indicator in all scenarios, followed by Global warming, Ozone formation and Terrestrial acidification.
The results for damage to resource availability if shown in
Figure 10. The same trend is observed with the highest damage for Scenario 1 and the lowest damage for Scenario 2. The fossil resource scarcity is much more significant contributor to the damage on resource availability in comparison to mineral resource extraction in all analysed scenarios.
Final results of comparative LCA at single score level account the damage category scores together and are shown in
Figure 11 in Ecopoint units. The Scenario 1 is the most impactful scenario in all damage categories. The Scenario 2 has the lowest damage and Scenario 3 ranks in the second place. The highest impact is caused in Human health damage category in all scenarios, followed by Ecosystem quality, and then Climate change and Resources.
3.4. Sensitivity Analysis
The sensitivity analysis for global warming potential in kg of CO
2 eq. is reported in
Figure 12. For all scenarios under analysis the sensitivity trend shows that the global warming potential impact increases with the increase electricity consumption. The most sensitive to changes in electricity consumption is the Scenario 1 and least sensitive is Scenario 2. Thought that Scenario 1 and Scenario 3 have similar impacts at electricity consumption decrease 50%, The change in Scenario 1 increases almost two times from 1783 kg CO
2 eq. to 3685 kg CO
2 eq, while Scenario 3 increases only form 1722 to 3074 kg CO
2 eq.
Similarly, the sensitivity analysis is made for changes in electricity for environmental impacts at the single score level shown in
Figure 13. Also, here the highest impact increase can be observed for Scenario 1 and the lowest for Scenario 2. The changes in the single score have smaller range than for global warming potential. Hence the it can be concluded that no significant burden transfer occurs among scenarios and also the impact categories.
The results of sensitivity analysis show that the model outputs are affected based on changes in input variables in a recognizable and meaningful pattern corresponding to the model structure. Thus, the model is valid and results are representative for selected case of energy supply technologies for an average household in Latvia.
4. Conclusions and Discussion
Life cycle analysis is a widely applied standardized methodology for environmental impact assessment and analysis. This study applies the LCA methodology in scope that was not addressed in scientific literature before—to assess the environmental impacts of energy supply alternative scenarios for an average single-family household in Latvia. The findings of this study show that use of boiler in a household for heating together with solar PV installation for electricity has lowest environmental impacts compared to other two scenarios, which include the electricity supply from public network and mCHP with the use of Stirling engine. The assessment is primarily concerned with identifying the primary causes of environmental problems, calculating impact category scores, and investigating damage category scores. Sensitivity analyses are also performed to assess the model’s robustness and the impact of changing input variables. Overall, the findings of this study help to understand the environmental implications of energy supply technologies for the average Latvian family, and they can help inform decision-making and policy development for more sustainable energy solutions in the region.
The examination of impact category scores revealed that Scenario 1 has the greatest environmental impact scores in most of impact categories, followed by Scenario 3, while Scenario 2 has the lowest environmental impact. Notably, most impact categories have consistent scores across all scenarios. The categories, such as freshwater and marine ecotoxicity, non-carcinogenic toxicity, and mineral resource scarcity exhibit different performance among scenarios, showing burden transfers between effect categories. Across all three scenarios the highest contribution to the environmental impact is made by fine particulate matter formation. This finding corresponds also to results of other studies mentioned in literature and should be addressed more seriously in local policy planning. Considering that the damage of the fine particulate matter formation is mainly for human health, this factor should receive more increased attention in specifically densely populated areas like cities, towns, suburbian areas.
The study investigated three endpoint categories, including damage to human health, damage to ecosystems, and damage to resource availability. Scenario 1 consistently showed the highest damage in all three categories, while Scenario 2 the lowest damage. The generation of fine particulate matter has the greatest influence on human health with outstand higher impact than rest of the impact indicators, followed by global warming. According to the obtained results, the main causes of ecosystem damage are land use and global warming. At the single score Human health damage is most significant among the analysed scenarios, which again shows that particular attention should be addressed to dealing with the source of emissions—combustion furnaces, which is a popular technology for heating of residential sector in the climatic condition given for this study. In order to decrease the potential threats to human health local decision makers and police-planners should more strongly address the preventive measures enabling decrease of the fine particulate matter formation. This can be achieved through forcing in power the regulations for residential sector that foresee various filtering technologies for pollution sources.
The sensitivity analysis results confirm the model’s validity and the representative character of the outputs. The patterns revealed in the sensitivity analysis match the structure of the model, strengthening the assessment’s credibility. In the sensitivity analysis, Scenario 1 was found to be the most sensitive to changes in electricity usage, with a large increase in impact. Scenario 3 also exhibits sensitivity, although the changes in impact are much lower than in Scenario 1. Scenario 2 is the least susceptible in this aspect, indicating that its environmental effect profile is more stable under the changes in electricity demand. However, it is still an open question how to address the environmental impact specifically related to the heat production from local renewable sources for residential buildings. This aspect should be addressed more in-depth in the future research on topic of residential sector energy technologies.


