Article

Energy Saving Optimization of Commercial Complex Atrium Roof with Resilient Ventilation Using Machine Learning

1
School of Architecture, Harbin Institute of Technology, Harbin 150001, China
2
Key Laboratory of Cold Region Urban and Rural Human Settlement Environment Science and Technology, Ministry of Industry and Information Technology, Harbin 150001, China
*
Authors to whom correspondence should be addressed.
Smart Cities 2023, 6(5), 2367-2396; https://doi.org/10.3390/smartcities6050108
Submission received: 29 July 2023 / Revised: 7 September 2023 / Accepted: 7 September 2023 / Published: 11 September 2023
(This article belongs to the Special Issue Smart Cities, Smart Homes and Sustainable Built Environment)

Abstract

:
Carbon-neutral architectural design focuses on rationally utilizing the building’s surroundings to reduce its environmental impact. Resilient ventilation systems, developed according to the thermal comfort requirements of building energy-saving research, have few applications. We studied the Jin-an Shopping Mall in Harbin and established the middle point height (h), middle point horizontal location (d), roof angle (α), and exposure to floor ratio (k) as the morphological parameters of the atrium. Using computational fluid dynamics (CFD), the mean radiant temperature (MRT), and the universal thermal climate index calculations (UTCI), this program was set to switch off air conditioning when the resilient ventilation met the thermal comfort requirement to achieve energy savings. The energy-saving efficiency (U) was calculated based on the energy consumption of the original model, and U could reach 7.34–9.64% according to the simulation and prediction. This study provides methods and a theoretical basis for renovating other commercial complexes to improve comfort and control energy consumption.

1. Introduction

Global population growth and the continuous lack of resources resulting from events such as energy shortages and climate warming have caused countries to focus more on international energy trends and changes [1,2,3]. Various countries have proposed energy policies [4,5,6,7]. Performing energy consumption analysis and establishing energy-saving designs are among the most basic technical means of achieving sustainable development. Research examining energy efficiency and the exploration of energy-saving practices has become the focus of extensive attention in both academic and industrial circles [8].
As a typical public building type in cities, commercial complexes possess complex characteristics such as long operation cycles, high pedestrian flows, large spatial spans, and significant urban node effects, all of which lead to huge energy consumption problems with regard to lighting, heating, and cooling operations. Due to the large area stock, fast growth, and lack of energy-saving design awareness of previously completed projects, large-scale commercial complexes exhibit high renovation potential [9,10,11]. Currently, there are sufficient studies focused on passive energy savings in buildings. Architects have reduced building energy consumption by designing building forms, functional layouts, materials, lighting, and other processes [12,13,14]. However, the effective prediction of building performance requires numerous simulations and evaluations, and thousands of alternatives must be screened during the optimization process [15]. Previous studies examining passive strategies have primarily focused on the optimization of enclosed structures such as the window–wall ratio and thermal properties of materials [16,17,18]. Currently, there are few existing studies examining architectural form optimization. The proposed simulation scheme is insufficient, and the relevant analysis of morphological parameter data requires further quantitative discussion.
With the increasing maturity and enhancement of simulation technology and optimization algorithms, building performance optimization (BPO) has been widely accepted and discussed for optimizing building designs for complex environments [19,20,21,22]. In this study, the Jin-an Shopping Mall, a typical commercial complex in China where the atrium is under long-term resilient ventilation in autumn and summer, was used as an example to simulate the influence of resilient ventilation on the thermal comfort and energy-saving efficiency of the indoor atrium of the building under different roof forms. However, computational fluid dynamics (CFD) and energy consumption simulations require long calculation times, and an artificial neural network (ANN) model with that was trained well can save considerable simulation time and compensate for a lack of computing power. A large number of alternatives exist for the scheme design phase. From an application perspective, the optimization method introduces concerns regarding thermal comfort and energy consumption from the early stages of the scheme design. This can reduce the social and economic costs of optimization after construction, and the complete simulation optimization method can provide a decision-making basis for early design.

2. Literature Review

2.1. Energy-Saving Renovation of Existing Commercial Complexes

Passive architectural design refers to improving and creating a thermal and comfortable indoor environment from the perspective of architectural design without relying on construction equipment. Its principle is the application of natural ventilation, natural lighting, temperature and humidity changes, and other parameters, and the purpose is to minimize the consumption of conventional energy. Aksamija discussed the feasibility of achieving net-zero energy consumption targets in commercial building retrofitting by integrating passive design strategies and energy-efficient building systems to improve building performance and reduce energy consumption [14]. Fan et al. focused on the high energy consumption of the atrium in cold areas and analyzed the influence of the proportion, height, layout, and other parameters on energy consumption through an energy consumption simulation. The results revealed that the unit energy consumption increased with an increase in the atrium volume. The surrounding atrium is more energy efficient than the other types. With an improvement in the uniformity of the atrium plane, the total energy consumption of the building increases [23]. Additionally, many scholars have discussed the design, parameters, and materials of building maintenance structures under energy-conservation guidance [24,25,26]. With the maturity of the parametric design platform and the theory and technology of building energy consumption simulations, there have been sufficient studies examining the in-depth quantitative analysis of building energy consumption [27,28]. Amasyali et al. used EnergyPlus and machine learning to understand and improve user behavior and achieved both energy consumption reduction and occupant comfort [29]. Corbin et al. studied a model-predictive control (MPC) environment. The environment integrated MATLAB and EnergyPlus to predict the optimal building control strategy, and this resulted in energy savings of up to 54% compared to the base case and improved thermal comfort for users [30]. Sangireddy and Bhatia et al. endeavored to reduce the amount of computation needed to calculate the energy consumption of different modes and parameter combinations, and they learned from the data generated by simulation and established a support vector machine to achieve the minimum hourly cooling energy consumption level while maintaining the thermal comfort of the residence [31]. The energy consumption of a commercial complex atrium can surge. Previous studies have conducted research examining the layout, structural design, shading, and other parameters. They have also confirmed the feasibility of passive energy-saving design; in spite of this, passive energy-saving studies focused on building spatial forms remain insufficient. Due to the “chimney effect” of the tall atrium of the commercial complex, it has a good natural ventilation capacity. The design of other types of public buildings such as office, cultural, and sports buildings attaches great importance to the natural ventilation efficiency of the atrium spaces. Therefore, it is necessary to consider natural ventilation and energy savings at the beginning of the design of commercial complexes that experience dense human flow and long operational cycles.

2.2. Thermal Comfort Simulation

Certain researchers calculated indoor thermal comfort using EnergyPlus but ignored the impact of indoor wind speed and temperature [15]. Aghamolaei pointed out that most existing studies have not investigated the joint effect of solar radiation and local wind speed simultaneously. When the model focused on wind, the solar calculation was simplified and vice versa. Therefore, CFD and EnergyPlus should be combined in the research process to improve the accuracy of thermal comfort simulation. This study proposes a novel simulation framework for outdoor environments using CFD and Building Energy Simulation (BES) methods to couple radiation and convective fluxes in outdoor environments [32]. Guo et al. combined EnergyPlus and CFD to evaluate the impacts of climatic conditions and building forms on the natural ventilation of sports venues in subtropical areas [33]. Recently, there has been a gradual increase in the use of CFD software platforms to simulate natural ventilation and improve indoor thermal comfort. However, research combining CFD and EnergyPlus dual-platform simulations to improve resilient ventilation, reduce the frequency of indoor air conditioning, and save energy remains in its infancy. Resilient ventilation has been confirmed to exert a significant impact on the indoor and outdoor thermal comfort of buildings; however, there is still a lack of sufficient quantitative analysis of the effect and duration of different building forms on thermal comfort.

2.3. Machine Learning and Genetic Algorithm in the Field of Building Energy Conservation

Machine learning (ML) is widely used in the context of data processing and model training, has been relatively well studied, and is a popular topic in the academic field [34,35,36]. Olu-Ajayi pointed out that ML methods are considered the best way to produce the desired results in prediction tasks and have been applied to the field of energy consumption in operational buildings. However, few studies have investigated the applicability of ML methods to predict potential building energy consumption in the early design phase to reduce the construction of low-energy buildings [37]. Zhang revealed the relationship between building shape and thermal comfort performance of semi-outdoor sports venues, selected canopy elevation, façade porosity coefficient, and sun-shade tilt angle as parameters to control building shape and developed a method to optimize building shape using an ANN and a genetic algorithm (GA) [38]. However, a relationship between the building form and energy consumption has not been proposed. Although certain scholars have applied machine learning to explore the relationship between spatial form and architectural performance, existing research is relatively weak. In particular, the relationship between the roof design calculation method and building energy consumption requires further investigation. Low-energy buildings have received considerable attention due to energy conservation policies in various countries worldwide. However, a proper assessment of building energy consumption requires dynamic simulations and the analysis of multiple environments or proposals to obtain the optimal solution. Longo et al. reviewed the optimal design of low-energy buildings and determined that multi-objective optimization and GAs were the most popular [39]. Malatji proposed a multi-objective optimization model and solved it using a GA. In the building energy renovation process, an optimal decision is reached by selecting optimal measures [40]. Moreover, the ANN training model method is mature, and a number of scholars have used artificial neural networks and GAs to improve the computational efficiency and accuracy of time-consuming simulations [41,42]. In the field of computational design, a method of combining machine learning with a GA has long been established, and many scholars have conducted in-depth research and discussions. This is a widely accepted industrial workflow. However, the application of artificial neural network learning and optimization screening to explore the atrium roof shape and building energy consumption must still be further investigated to save simulation time and facilitate architects with regard to adjusting the shape design in the early stage of scheme planning.

2.4. Research Gap and Objectives

Through a review of existing relevant studies to simplify the description above, the following conclusions were drawn:
  • Research examining passive energy-saving design methods to reduce air conditioning energy consumption by increasing thermal comfort hours is insufficient.
  • Quantitative research focused on CFD combined with energy consumption simulations in energy-saving designs is insufficient.
  • Research examining the energy savings of atrium roofs lacks an objective law of morphology and an in-depth discussion of different morphology types.
To bridge the existing research gap, the relationship between the architectural form of the atrial portion of a commercial complex and energy consumption was investigated. By establishing a parametric model, the universal thermal climate index (UTCI) was used to measure the thermal comfort of the atrium. A passive retrofit design was adopted to improve the efficiency of resilient ventilation and thermal comfort. Another aim of this study was to develop a method to simulate the annual operation time (4380 h) of each commercial complex, considering real climate data, using an ANN and a GA to optimize the building form to improve performance. This method can quickly and effectively predict energy-saving efficiency, provide architects with many alternative and optimized schemes, and provide quantitative conditions for exploring the morphological law of building energy-saving performance under the influence of resilient ventilation.
The remainder of this paper is organized as follows. In Section 2, the research framework and primary research steps are introduced, including the construction of a parametric model of the commercial complex, the setting and simulation of CFD and energy consumption simulations, a machine learning prediction model, and GA optimization. In Section 3, to analyze the simulation results, the correlation between the parameters of different morphological types and the energy-saving efficiency and value range are classified and discussed. Quantitative analysis of morphological parameters was performed to obtain objective trend rules. Section 4 discusses the findings and limitations of this study, and Section 5 presents the primary conclusions.

3. Methods

In this study, EnergyPlus combined with a CFD simulation was used to evaluate the effects of the atrium roof form on the resilient ventilation and atrium energy consumption of commercial complexes based on parametric models of real operating malls and site meteorological data. The flow includes simulation, energy efficiency calculation, prediction, and optimization. Figure 1 illustrates the working framework of this research.
This method is divided into two primary phases. Phase one includes two steps: simulation and energy-saving efficiency calculations. The first step is to conduct a CFD simulation and building energy consumption simulations to explore the impact of resilient ventilation on thermal comfort and to obtain thermal comfort hours data and energy consumption data. The second step was to calculate the building energy-saving ratio under the influence of resilient ventilation through thermal comfort hours and explore the influence of changes in roof geometric shape on energy-saving efficiency by changing the morphological parameters and obtaining 1600 groups of morphological and energy-saving efficiency datasets. Phase two includes the prediction, optimization, and quantitative analysis of parameters for different morphological types and consists of two steps. First, due to the large number of simulations, the agent model of an ANN can be trained to significantly shorten the time and predict a large number of datasets of morphological parameters with energy-saving efficiency. Genetic optimization can screen morphological parameter data with better energy-saving efficiency to reveal the rule. Subsequently, quantitative parameter analysis was performed to summarize the influence of different parameters of different morphological types on energy-saving efficiency. A detailed description of each research phase and the tools and methods used in each phase is provided in a follow-up article.

3.1. Case study

3.1.1. Basic information

The research model is a commercial complex (45°72′ N and 126°68′ E) located in Harbin, China. Based on the opening time of the shop, the research time was set from 10 a.m. to 10 p.m. throughout the year. As presented in Figure 2, the building zones consisted of two parts that included two shopping areas on both sides and one central atrium. The building exhibited a typical atrium layout pattern of commercial complexes. The weather data for the site are listed in Table 1, and the surrounding buildings were also considered.

3.1.2. Parametric Model

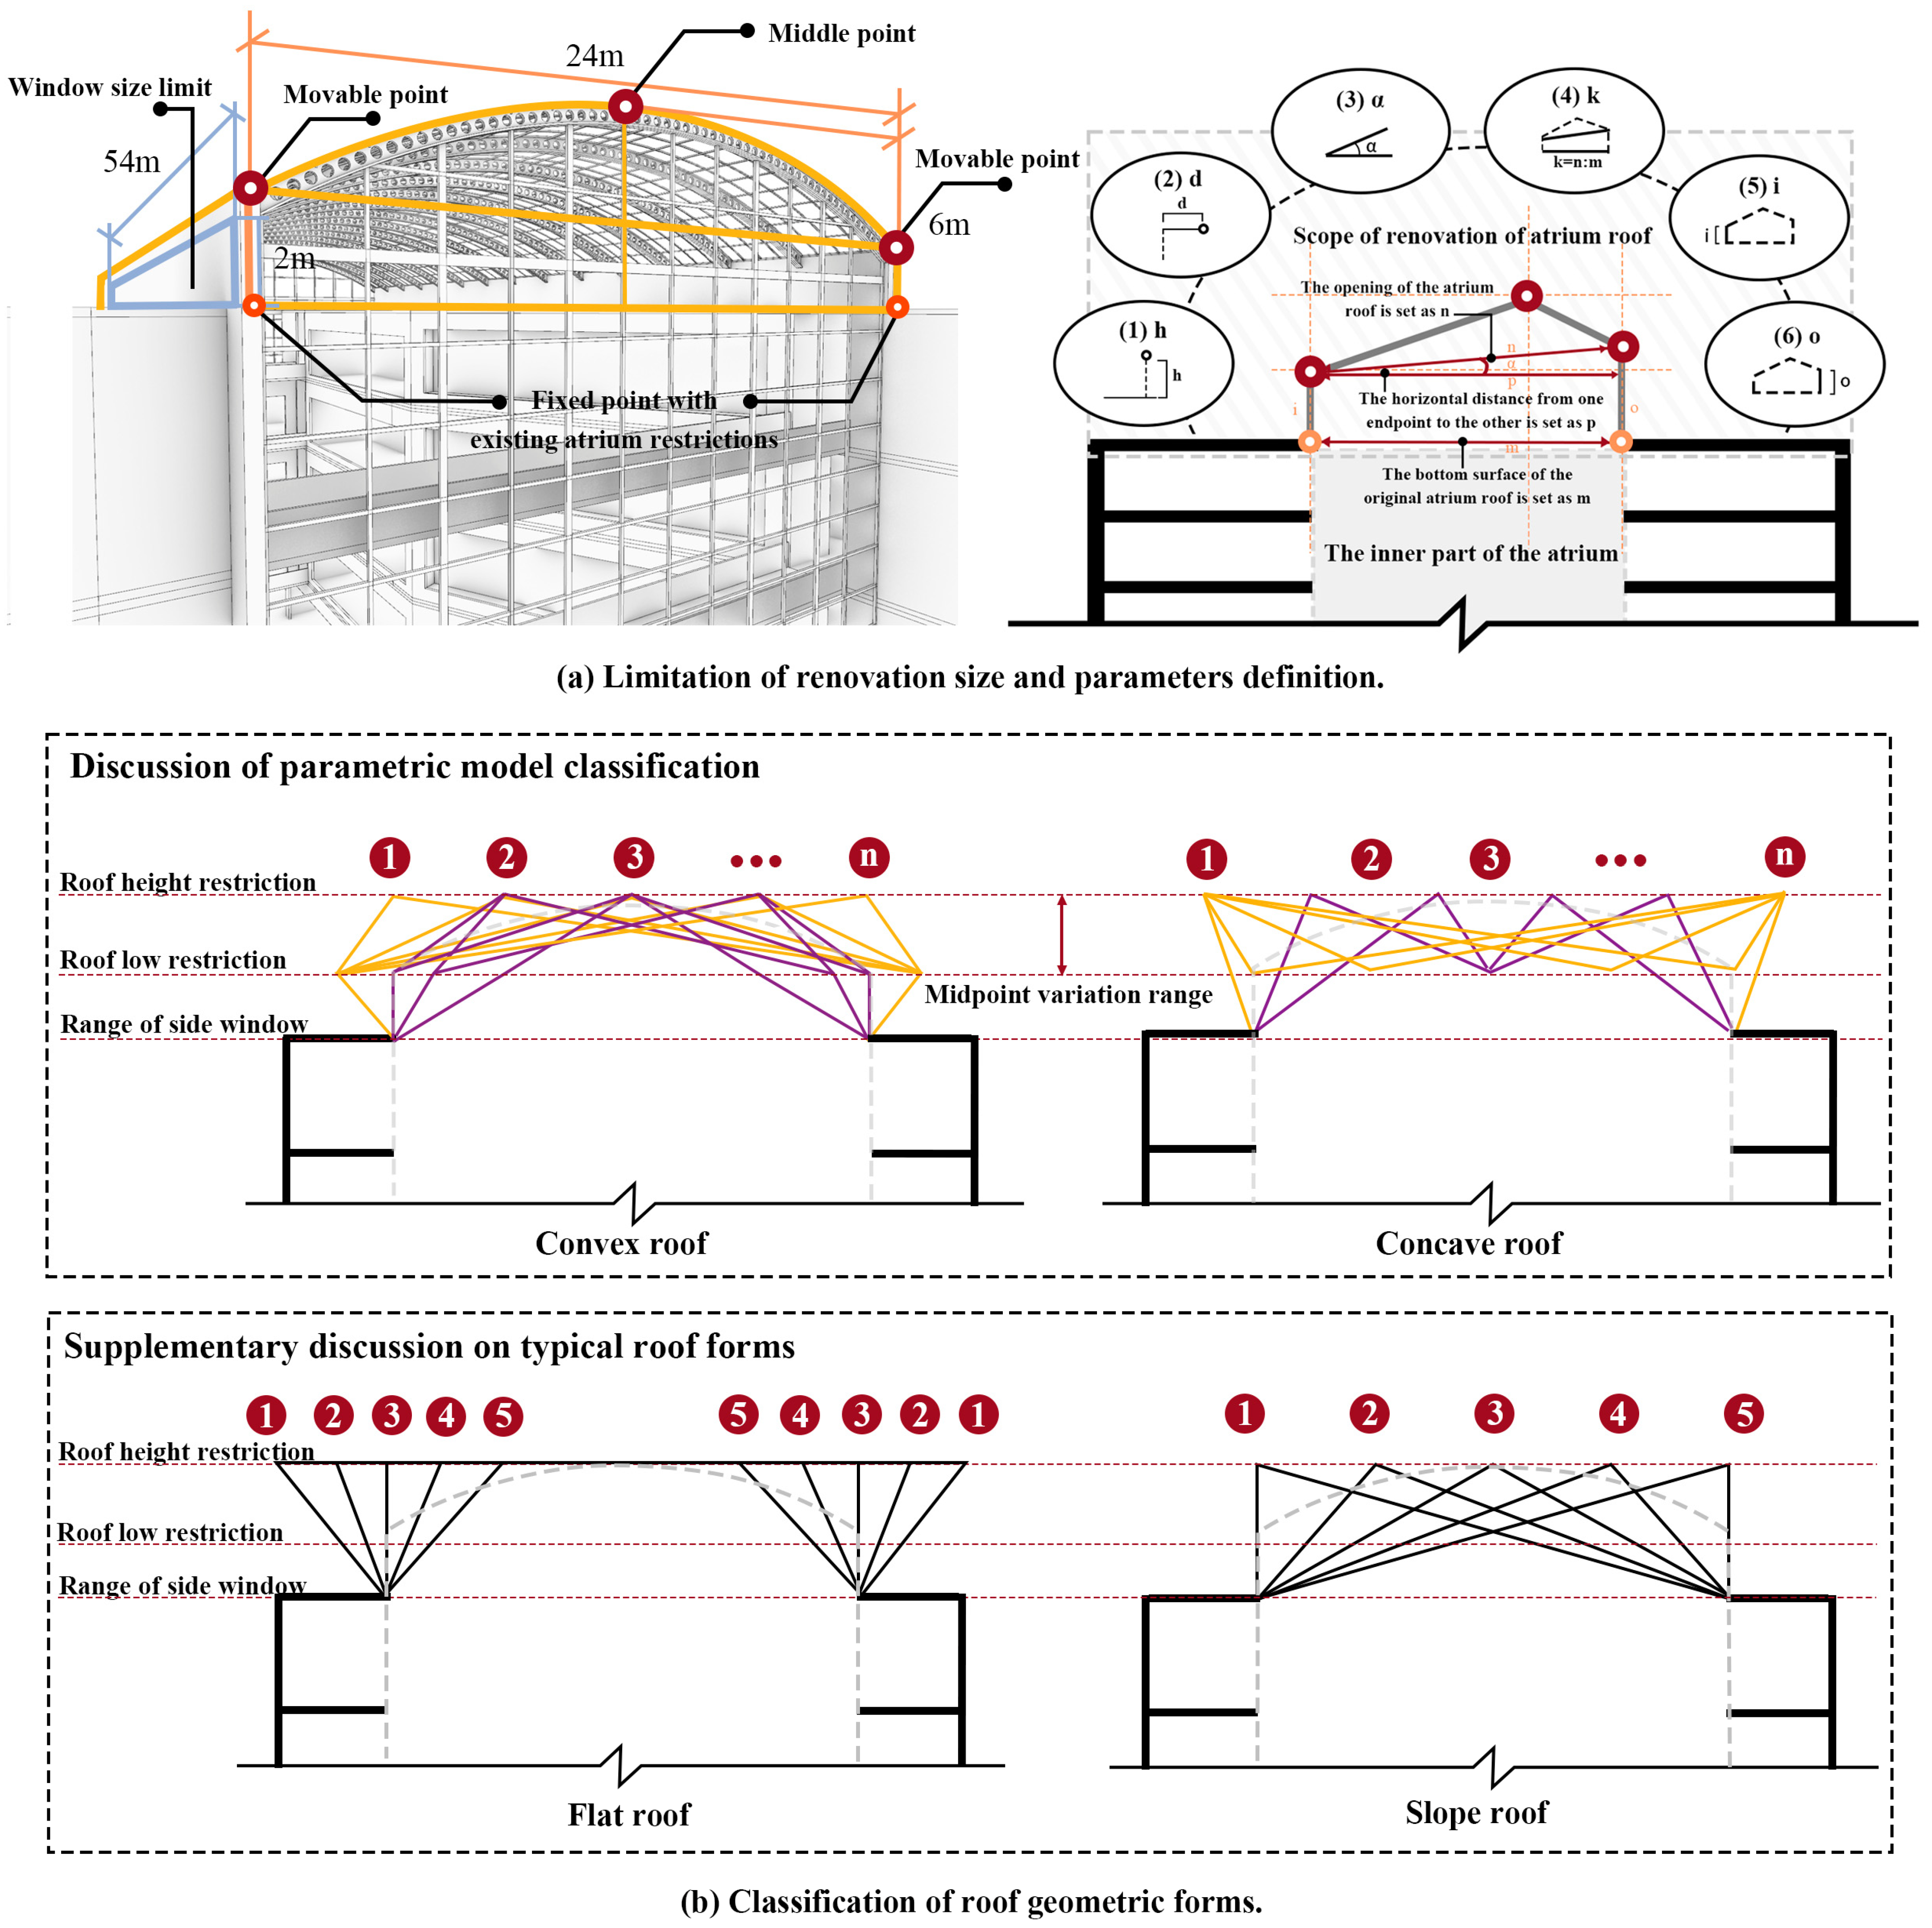
As presented in Figure 3b, through the analysis of the architect’s design logic, the graphic deconstruction of the roof geometry, and the combination of existing research, six parameters (middle point height (h), middle point horizontal location (d), roof angle (α), exposure to floor ratio (k), air intake height (i), and air outlet height (o)) were set during the parametric design process, which controlled the geometry of the atrium roof to optimize thermal comfort by improving the resilient ventilation efficiency. As presented Figure 3a, based on the existing roofing shapes of commercial buildings, the side window was 54 m long and 2 m high. The vertical height and horizontal movement ranges of the roof middle point were 6 and 36 m, respectively. As presented in Figure 3, as most atrium roof forms of commercial complexes are geometric, the generated roof forms were divided into two categories when the parameterized model was controlled by geometric form parameters. If the height of the middle point exceeded the heights of the other two movable points, it was defined as a convex roof; otherwise, it was defined as a concave roof. The original real case consisted of an arc and a curved roof. To compare the roof shapes in a real situation more comprehensively, two types of roofs (flat and sloped) were included for discussion. Using the above five roof types, the relationship between the roof form, thermal comfort, and energy efficiency could be explored more fully.
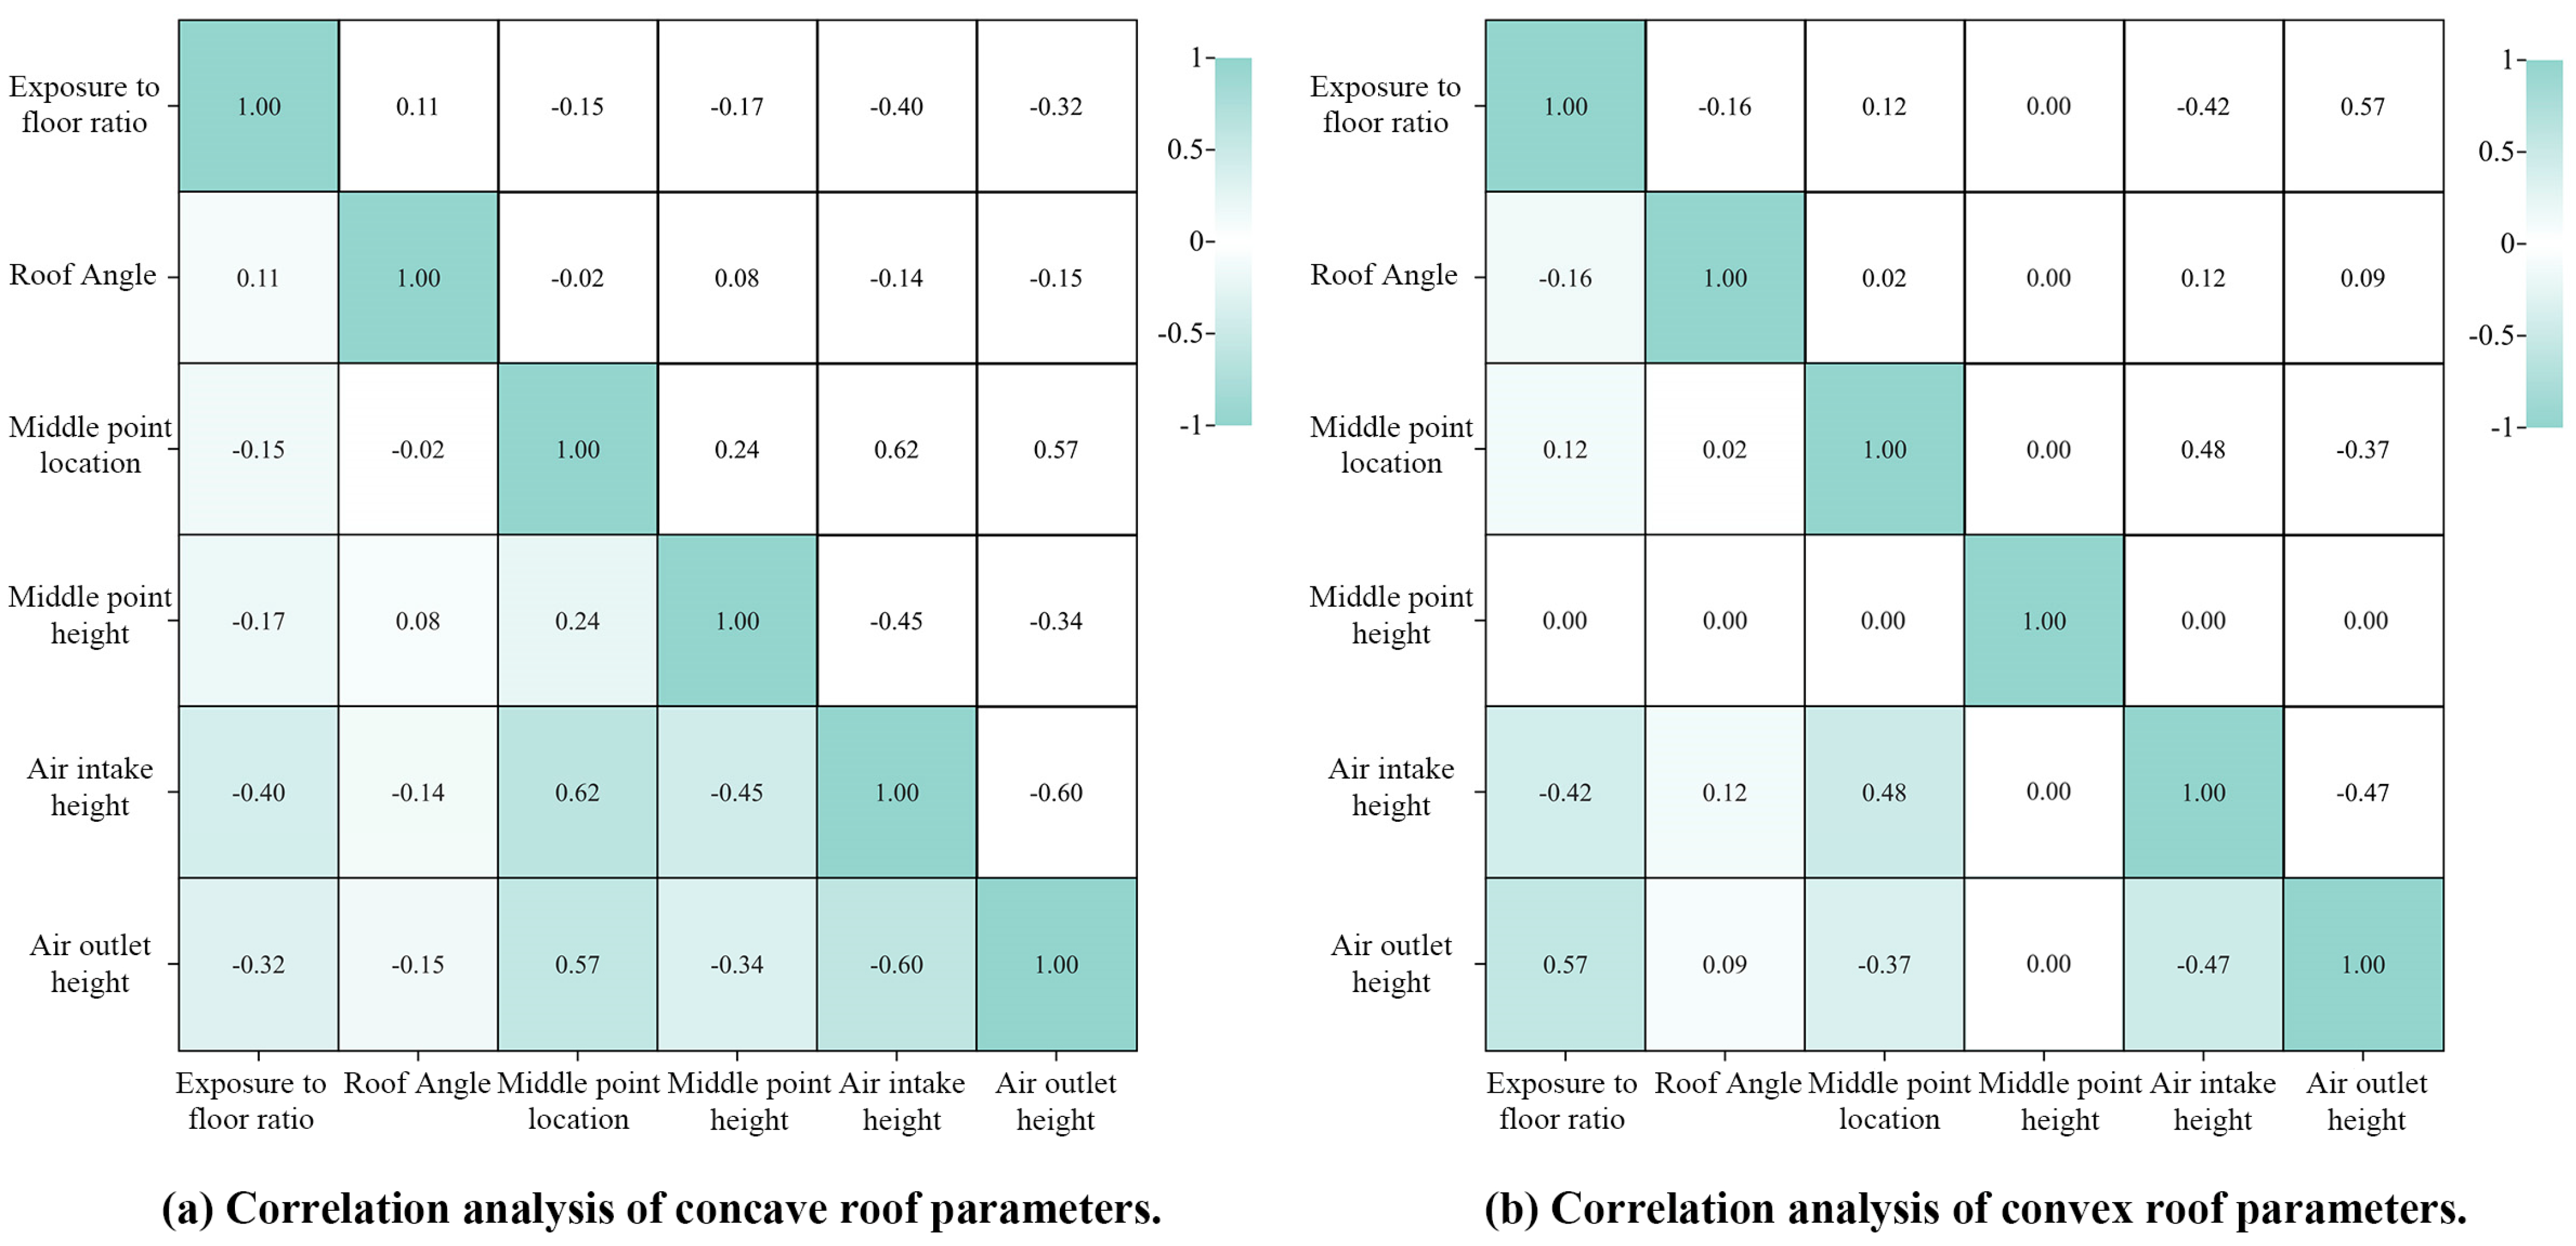
Various correlation coefficients may be applied for the correlation analysis, such as the Pearson correlation coefficient, Kendall correlation coefficient, and Spearman rank correlation coefficient. The Spearman rank correlation coefficient is applicable for both normal and nonnormal distributed data and is effective in characterizing linear or nonlinear correlations and more robust and insensitive to outliers [43]. Geometric parameters were analyzed using intragroup autocorrelation. The calculation results for the Pearson correlation coefficients are presented in Figure 4. Four parameters, middle point height (h), middle point horizontal location (d), roof angle (α), and exposure to floor ratio (k) exhibited a low correlation. Meanwhile, the middle point height (h), middle point horizontal location (d), and exposure to floor ratio (k) were strongly correlated with the air intake (i) and outlet heights (o). The use of fewer and more effective morphological parameters can help architects reference and control morphology more conveniently. Therefore, four parameters (h, d, α, and k) were selected as the four parameters for the control form. The roof forms constructed using the parametric models were divided into two types (convex and concave). The forms of convex and concave roof were calculated using ML combined with GA. The parameter ranges are listed in Table 2.

3.2. Numerical simulation process

3.2.1. CFD Environment Construction and Simulation

CFD simulation has become a popular method for studying indoor and outdoor ventilation due to its economy, speed, and ability to obtain greater amounts of data (such as aerodynamics), and because its flow field data are superior to those of other methods [44,45,46,47]. For CFD simulations, OpenFOAM provides steady-state and multi-domain conjugate heat transfer solvers. Reynolds-mean Navier–Stokes equation model (RANS) simulations were used to assess the impact of building shape, ventilation openings, hourly wind speed, and direction. In addition, the simulation settings such as domain range, grid size, and turbulence closure model selection on resilient ventilation were considered in the simulation process. RANS simulations may be computationally economical, less time-consuming, and richer [48]. OpenFOAM integrated in the same platform is the ideal program for BEM and CFD simulations that can achieve the integration of multiple combination parameters [38]. The RANS simulation method is also provided. To calculate the convection coefficient, a simple combined algorithm was selected that uses surface roughness and local surface wind speed. The equations are as follows:
h c , e x t = D + E V Z + F V Z 2
V Z = V m e t δ m e t Z m e t ω m e t · Z δ ω
where Z means the height above ground of test points, V Z means the air velocity at altitude Z , δ represents the wind boundarylayer thickness of the case, ω represents the wind profile exponent of the case, V m e t represents the air velocity measured of the meteorological station, δ m e t represents the air velocity boundary-layer thickness of the meteorological station, Z m e t represents the test point height of the meteorological station, ω m e t represents the air velocity exponent at the meteorological station, and D , E , F are roughness coefficients of building materials, which are presented in Table 3.
The MultiRegionSimpleFoam OpenFOAM solver was applied in the solving process. In addition, the buoyant turbulent air velocity and heat conduction transfer between the exterior walls and fluid areas were calculated in the CFD simulations [38]. The enthalpy h could be calculated in the CFD energy equation. The equation is
ρ h t + μ · ρ h + ρ μ · 1 2 μ · μ = · q + S H
where ρ means the density of air, μ means the air velocity, q means the thermal flux, and S H is used in the solar radiation calculation. At the interface between the outer surface and the fluid region, the fluid boundary temperature is equal to the outer surface temperature simulated by EnergyPlus.
The equations of mass and momentum conversation are as follows:
ρ t + · ρ μ = 0
ρ t + μ · μ = 1 ρ p + v 2 μ + ρ g
where p means the air pressure, v represents the kinematic viscosity, the gravitational acceleration is g , and ρ means the density change because of the temperature differences and vapor distribution.
The fluid phase was set to be compressible and the Boussinesq approximation was used to calculate the effect of buoyancy [49]. The equation as follows:
ρ = β T T f l u T 0 β x v x v x v 0
where T f l u represents the fluid temperature, T 0 = 300   K is the reference temperature, x v = m a i r m a i r + m v a p o r means the vapor distribution, β T = 3.05 × 10 3 K represents the thermal expansion, β x v = 0.61 represents the vapor expansion level, and x v 0 = 0 is the reference vapor distribution [49]. The finite volume method is used to solve the problem, and a semi-implicit method is used to solve the pressure link equation (simple). Gaussian integration was used as the discretization scheme, and the interpolation scheme was linearized. To evaluate the accuracy of the solution involves control residual 4 × 10⁻⁴ (velocity component), 0.12 (pressure), 4 × 10⁻³ (enthalpy), 5 × 10⁻⁶ (k), and 4 × 10⁻⁵ ( k ω ) turbulence parameters).

3.2.2. Solar Simulation and Mean Radiant Temperature (MRT) Calculation

In addition to personal parameters, four environmental parameters determine the thermal comfort of a room. These include the air temperature, relative humidity, wind speed, and solar radiation. Previous studies have simplified this approach. However, to evaluate user thermal comfort more accurately, the influence of solar radiation should not be ignored or the sunlight simulation should be simplified. EnergyPlus is a common and convenient tool that is used in indoor environments. The mean radiant temperature (MRT) at each measurement point in the simulation depended primarily on the surrounding temperature. The devices for MRT evaluation were selected as convenient and accessible global thermometers. MRT validation requires the black ball temperature and the air velocity at the measured height [50,51].
The MRT at each measurement point in the simulation primarily depended on the surrounding temperature. The angular factor MRT algorithm equation for the Rhino-Grasshopper platform is:
T m r t = ε i F i T i 4 ε i F i
where T m r t means the MRT, ε i mens the surface emissivity, F i means the angle factor from the test points to the around surfaces, T i is the surface temperature in the simulation, and i is the surrounding surfaces’ number.

3.2.3. UTCI Calculation and Modified Air Conditioning Frequency Schedule

The UTCI applied the “Fiala” models which is a reasonable model of human thermoregulation possessing extensive validation. The UTCI equation was roughly described as
U T C I = T a ; T m r t ; v 10 ; R H = T a + O f f e c t T a ; T m r t ; v 10 ; R H
where T a is the air temperature, T m r t is the MRT, v 10 is the air velocity at a height of 10 m, and R H is the relative humidity [38].
Based on the Rhino-Grasshopper platform, MRT from EnergyPlus simulation, wind speed from CFD simulation, and air temperature and relative humidity, data measured from weather stations can be directly captured to calculate the UTCI. According to previous related studies, the evaluation criteria of UTCI (the definition of comfort between 9 °C and 26 °C) can be used to conveniently judge the thermal comfort performance per hour. Based on previous studies, the percentage of comfort in the simulation grid was used as the evaluation index.
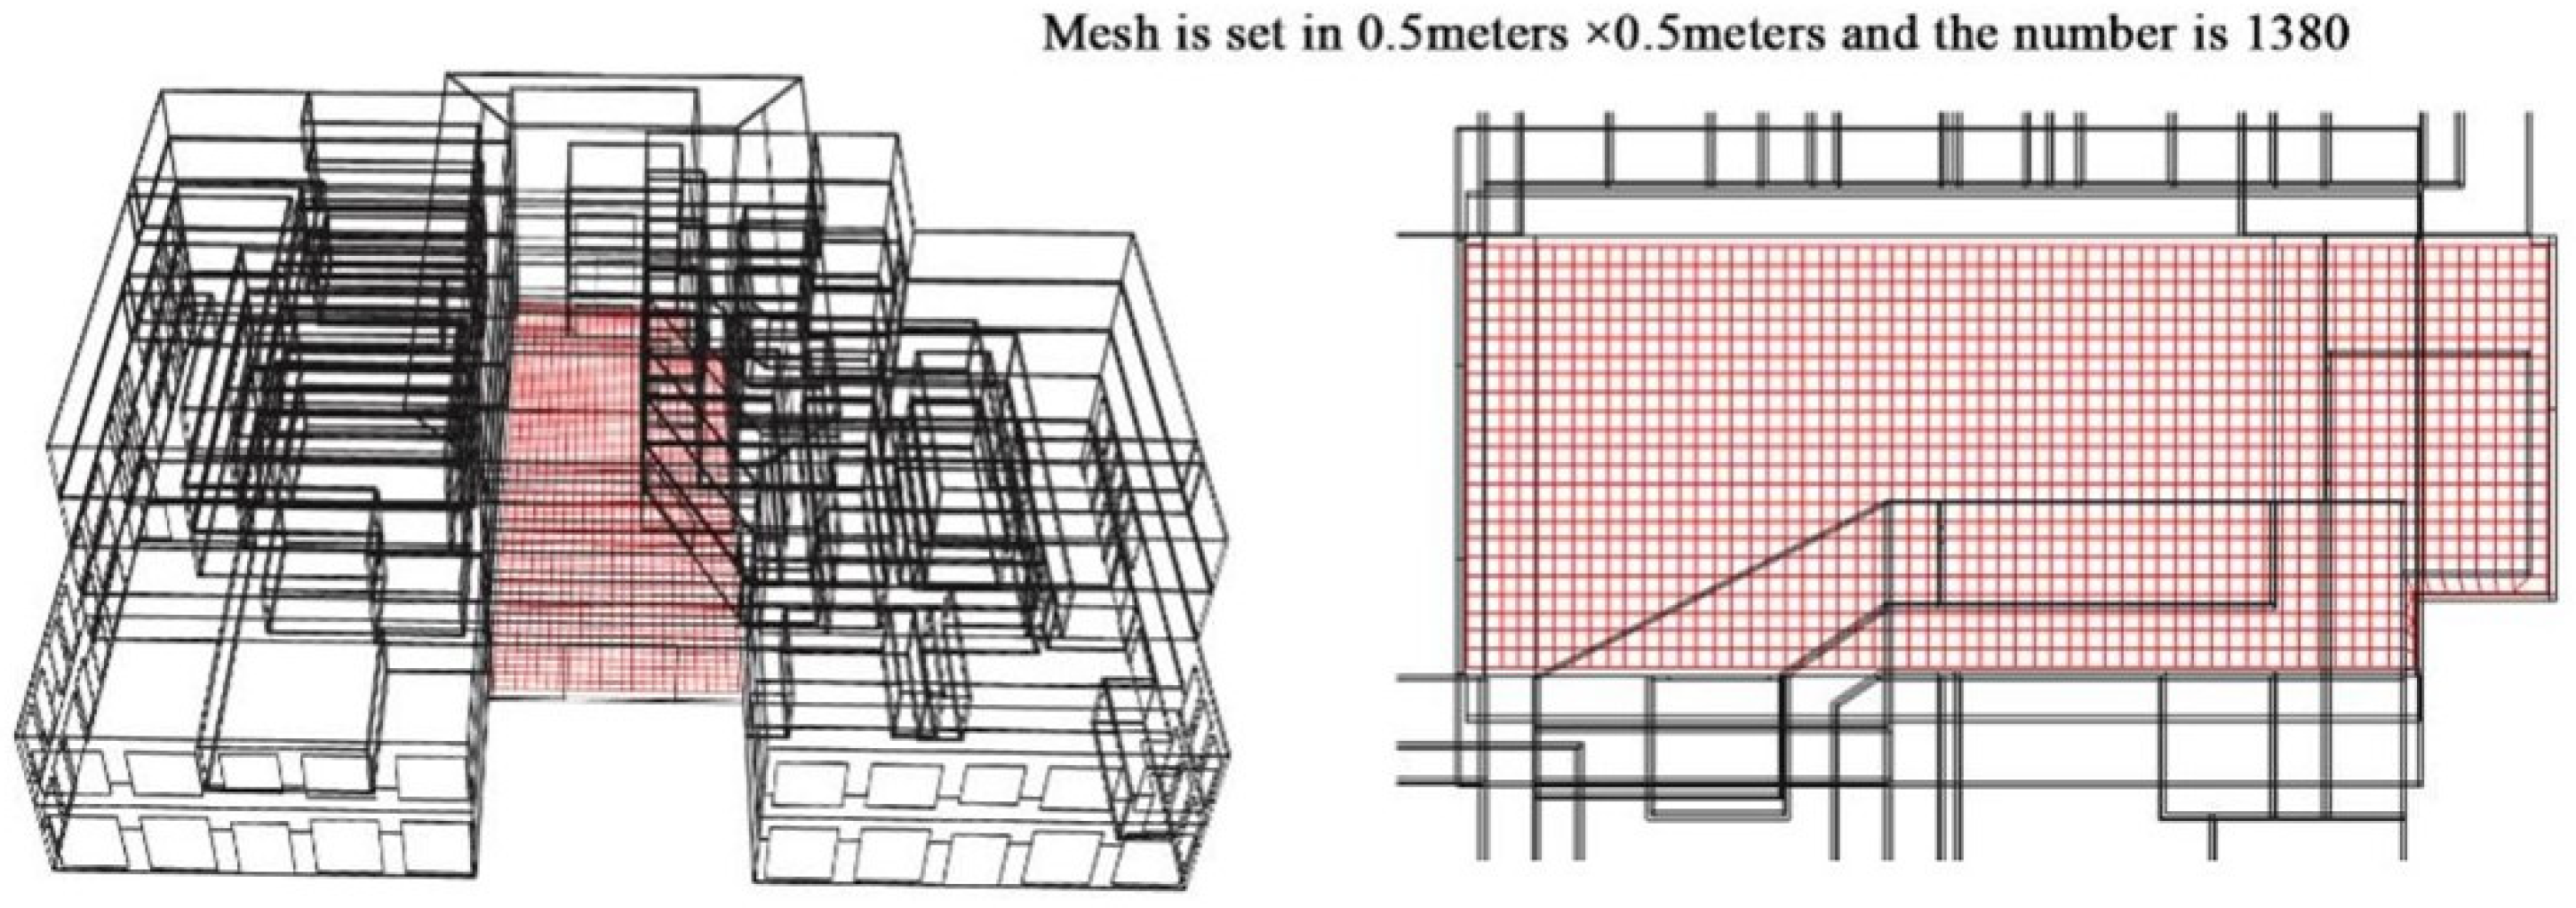
To scientifically evaluate the thermal comfort performance of different atrium roof forms, this study considered all opening hours (4380 h) of the commercial complex in the simulation. As presented in Figure 5, the mesh of the atrium in the simulation was set to 0.5 m × 0.5 m, and the number of test meshes was set to 1380. The percentage of comfortable mesh ( P C i ) was used as an evaluation metric for the thermal comfort performance of the atrium every 4380 h. The P C i can be calculated as follows:
P C i = n i N
where P C i represents the percentage of thermal comfort (9 °C < UTCI < 26 °C) grids to all the grids in atrium in hour i ( i   = 1, 2, 3, …, 4380), n i means the comfort grids number of hour i , and N is the total grids of atrium area. The simulation time (4380 h) was set from 10 am to 10 pm every day between January 1st and December 31st. The total number of meshes in the atrium was 1380; thus, N was set to 1380.

3.2.4. Measurement and Simulation Correction

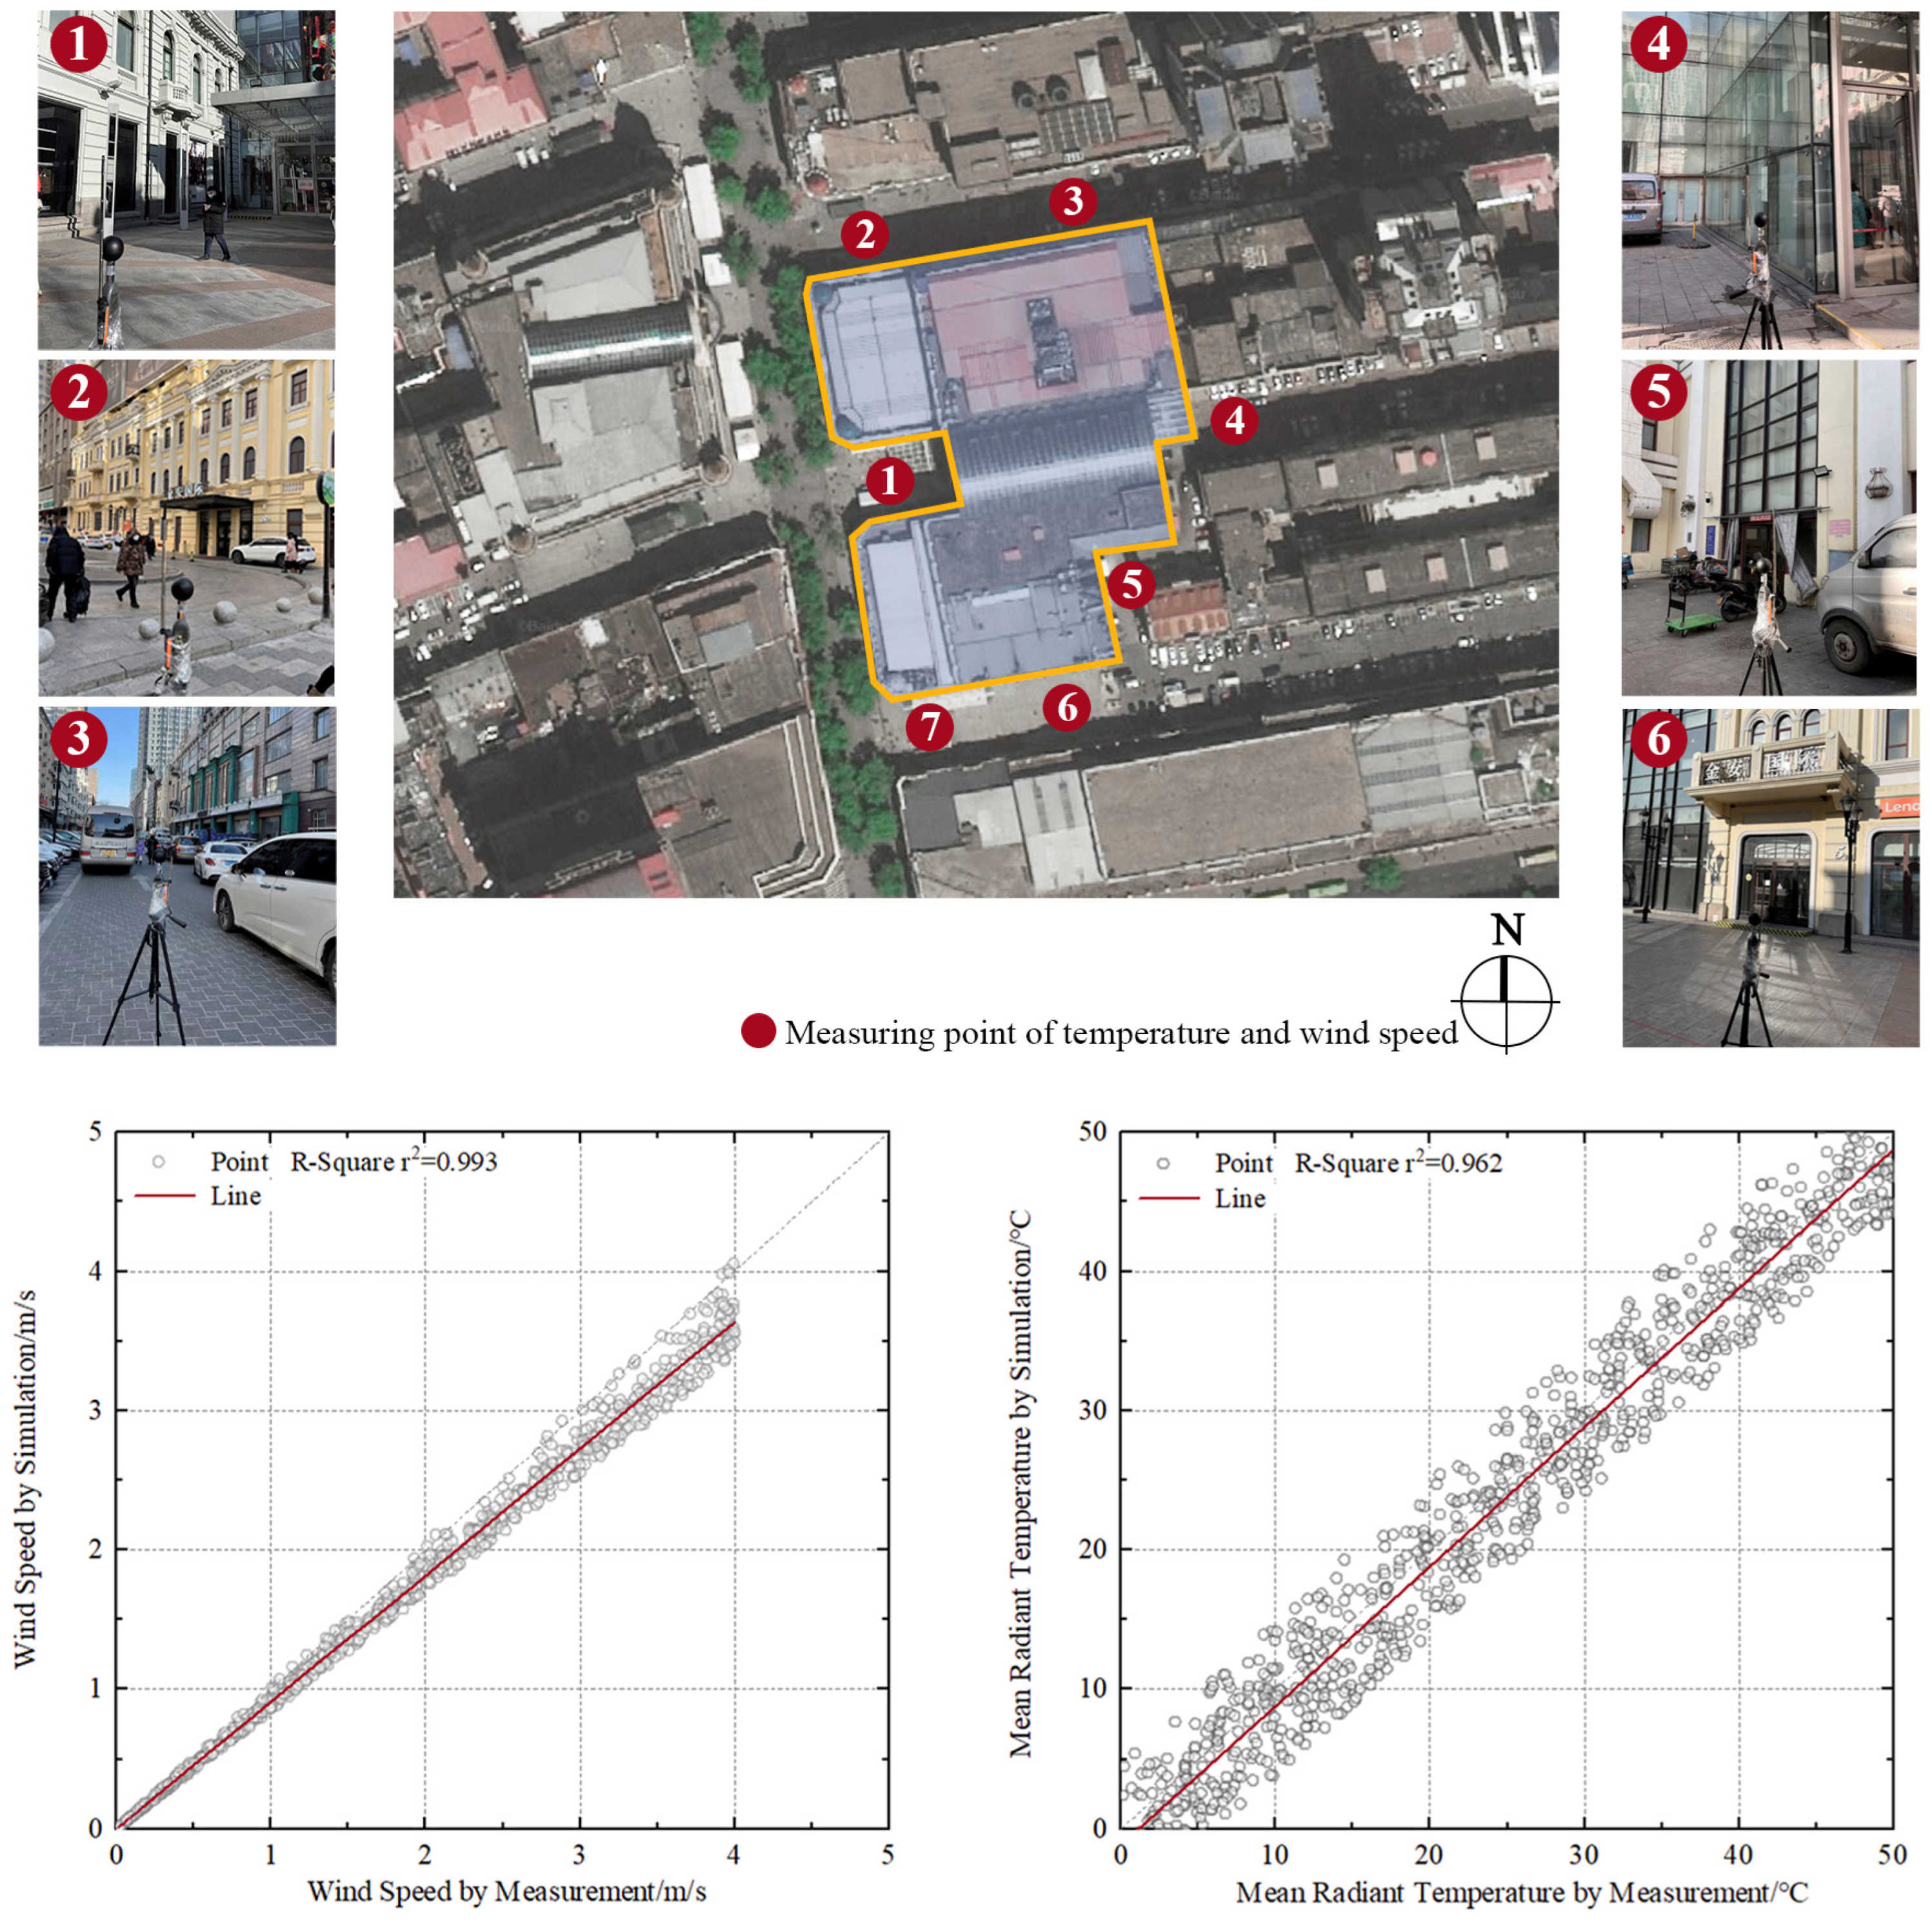
In this subsection, to consider the actual usage situation and more accurate simulation results, the simulation benchmark is set as the atrium location accessible to users. To reduce the error and adjust the parameters in the simulation process, this study compared the measured results from June to November 2022 with the measured results during this period. As presented in Figure 6, seven measurement points around the research object were selected for wind speed and MRT measurements. From the data results, the simulated values of wind speed and MRT are higher than the measured values due to the more complex influence of the real urban environment on the research object. Due to the realistic complex situation, the simulated data of MRT may be more idealized and underestimate the effects of thermal convection and long-wave radiation. The error value between the wind speed and the measured value is small. However, from the overall results in Figure 6, there was a reasonable correlation between them where R2 values were 0.993 and 0.962, respectively, thus proves the reliability of the simulation [38].

3.2.5. Energy Simulation

In this study, EnergyPlus, a commonly used building simulation software, was used to quantify building energy-saving performance [52,53,54]. The energy balance formulation is as follows:
Q s y s = Q s t o r a g e i = 1 N s l Q i i = 1 N s u r f a c e s h i A i T s i T z i = 1 N z o n e s m i C p T z i T z m i n f C p T T z ·
where i = 1 N s l Q i is the sum of the convective internal loads, i = 1 N s u r f a c e s h i A i T s i T z indicates the convective heat which is transferred from the surfaces of zones, i = 1 N z o n e s m i C p T z i T z represents the heat transfer from mixed inter-zone, and m i n f C p T T z indicate the heat transfer which enters from the outside air. In particular, Q s y s is the air system output, and Q s t o r a g e is the energy which is saved in the zone air.
As this research focuses on the load of cooling and heating of commercial complex, the remaining energy consumption can be neglected in the simulation, and the heating and cooling load equation can be calculated as follows:
Q s y s = i = 1 N z o n e s Q c o o l i n g + i = 1 N z o n e s Q h e a t i n g ·
where the i = 1 N z o n e s Q c o o l i n g is the load of cooling load in every zone, and i = 1 N z o n e s Q h e a t i n g is the heating load. The energy consumption of 69 zones was calculated in this study, including 32 sales zones, 36 corridor zones, and 1 atrium zone. The results indicate that the i should be set as 69, and there are 4380 h of energy consumption, which are loaded by heating and cooling obtained in EnergyPlus calculation engine.

3.2.6. Energy Conservation Efficiency with Resilient Ventilation

To study the influence of resilient ventilation on energy-saving design, the amount of energy consumption reduction was calculated in this study using the following equation:
P = w 2 w 3 w 2 × 100 %
where w 2 is the energy consumption of commercial complex without resilient ventilation, and w 3 is the corrected energy consumption of commercial complex with resilient ventilation. P illustrates the effect of the energy-saving design with resilient ventilation.
This study also focuses on the relationship between the shape of the atrium roof and energy consumption. The energy conservation efficiency after renovation of the atrium roof is an important index for evaluating the development of renovation in regard to energy saving. The energy conservation efficiency was calculated using the following equation:
U = w 1 w 3 w 1 × 100 %
where w 1 is the consumption of the original commercial complex, and w 3 is the corrected energy consumption of the renovated building with resilient ventilation. U was used to compare and analyze the energy conservation efficiency of different atrium shapes and could be set as the optimization objective in the parametric energy-saving design in transformation.

3.3. Optimization

There are many scholars in different fields who have studied energy optimization in the existing research [55,56,57]. In this study, passive energy-saving optimization was performed using a digital model of the atrium roof of a commercial complex with geometric parameters. The building geometry combined with the best performance was determined by adjusting the parameters that affected the shape of the atrium roof. In this study, the neural network was trained using 1600 datasets consisting of two different types of roof shape parameters (h, d, α, and k) and the energy efficiency (U) of 800 groups. The trained agent model can replace the simulation process and predict the energy-saving efficiency.

3.3.1. Machine Learning Surrogate Model Training and Validation

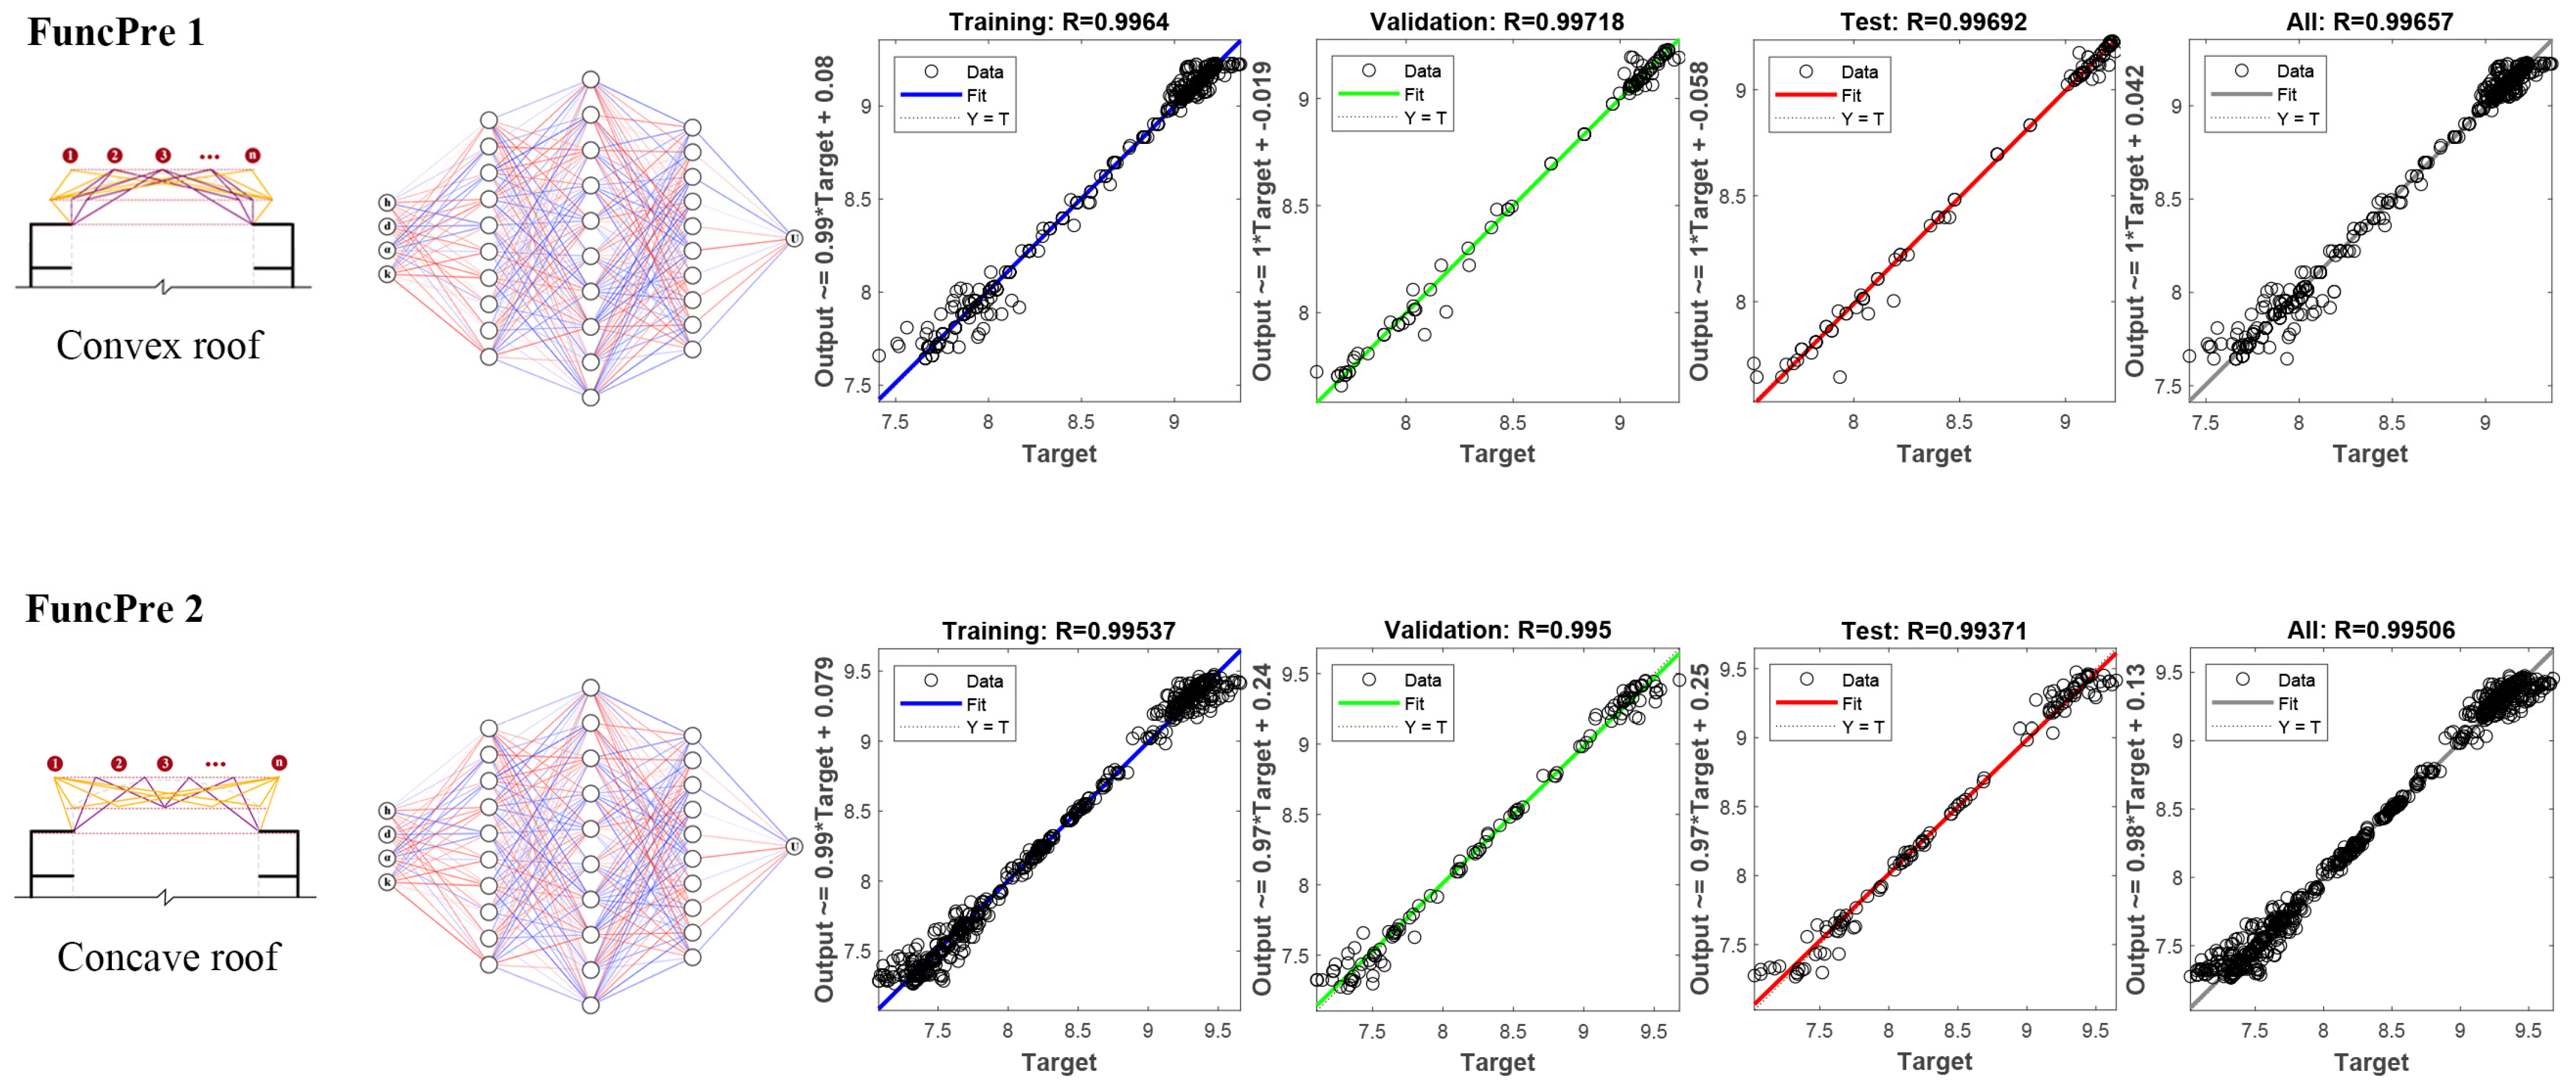
This section introduces the ANN’s training and validation. The ANN algorithm is invoked in MATLAB, where the “Input” is defined as four morphological parameters (h, d, α, and k), and the “Output” is the energy-saving efficiency (U). According to design requirements, the aforementioned complex atrium roof shapes were divided into convex and concave roofs. The machine learning surrogate model FuncPre1 was trained to match the convex roof, and the FuncPre2 was trained to match the concave roof. Three ANN structures were constructed by adjusting the numbers of hidden layers and neurons. Therefore, six machine learning surrogate models were used to predict U in the two different types of atrium morphologies. The activation functions of the hidden layers all used “tansig”, and the output layers all used “purelin”. The data for the two roof types were tested using different levels and neural networks, and the results are listed in Table 4.
To determine the relationship between building geometry and thermal index, 800 datasets were used for ANN training. Based on experience, 70% of the datasets (560 datasets) were randomly used for training, 15% (120 datasets) were randomly used for validation, and the remaining datasets were used for testing [58,59]. The next step involved the construction of a surrogate model structure. As the basis of the ANN model was a multi-layer perceptron model, the number of hidden layers and neurons determined the structure of the ANN. In this study, the ANN model was trained using the neural network toolbox in MATLAB, and the Levenberg–Marquardt backpropagation algorithm was used in the training process [60,61,62].
The correlation between the inputs (u(k)) and output (h(k)) in the hidden layer MLP network can be described as follows:
h k = 2 w 2 · x k + b 2
x k = 1 w 1 · u k + b 1
where x k is the output vector from the hidden layer, w 1 is the connection weight matrix from the input to the hidden layer, w 2 is the connection weight matrix from the hidden layer to the output layer, and b 1 and b 2 are the bias numbers in the hidden and output layers, respectively [44].
The correlation coefficient (R) and root mean square error (MSE) of the six ANN surrogate models were used to evaluate prediction performance [63]. R and MSE are calculated as follows:
R = n i = 1 n x i x i i = 1 n x i i = 1 n x i n i = 1 n x i 2 i = 1 n x i 2 n i = 1 n x i 2 i = 1 n x i 2
M S E = i = 1 n | x i x i 2 | n
Comparing the three ANN structures, the predicted R values were all greater than 93%. Most models exceeded 99%, and the maximum MSE was 0.077, thus indicating that the model achieved a relatively good prediction effect. As presented in Table 4, when comparing the three ANN model structures, the R values of ANN2 and ANN3 are similar, but the MSE performance of ANN3 is better than that of ANN2. This illustrates that a multi-layer neural network is more suitable for energy-saving efficiency prediction than is single-layer neural network. ANN3 was selected for the surrogate model training in this study, and the machine learning proxy model training results are presented in Figure 7. According to the verification of the test datasets, the training model did not exhibit overfitting.

3.3.2. Genetic Algorithm Optimization

Genetic Algorithm (GA) is a computational method that seeks the optimal solution by simulating the generation and evolution of genes in the natural evolution process. The main principle is that the population composed of possible characteristics in the dataset follows the adaptive law of survival of the fittest; it uses the genetic operators of genetics to combine, cross, and mutate to form the offspring population iteratively, until a final convergence that obtains the optimal solution [64]. Shi et al. proposed a bi-objective mixed integer programming model and modified NSGA-II (Non-dominated Sorting Genetic Algorithm II) to solve the model [65]. Gu et al. proposed a simplified modeling method based on a three-stage automatic genetic algorithm which automatically determines the structural characteristic parameters iteratively by taking the period and mode shape as input [66]. GAs have been widely used to solve problems related to building optimization [41,67,68]. The GA based on the MATLAB platform is convenient for architects to control architectural forms and explore their performance relationships due to a series of advantages such as the plug-in of the platform, operability of parametric models, convenience of data conversion, and visualization of simulation results [69,70,71].
As presented in Figure 8, this study uses GA to input effective training ANN model datasets. The optimization process was halted after 95 and 118 generations of computations were completed. The first 100 optimal cases were selected according to the GA, and the influence of 4 parameters (h, d, α, and k) on energy-saving efficiency (U) was analyzed.

4. Results

In the first subsection of this section, the thermal comfort impact of resilient ventilation on the atrium of the commercial complex was explored and quantified by energy consumption simulation. In the second subsection, the relation between architectural geometry parameters on the energy-saving efficiency was analyzed. In the third subsection, the ANN surrogate model combined with optimization algorithm was used to predict and screen the range and optimal value of geometric shape parameters, and different roof forms were discussed.

4.1. Energy Efficiency Calculation of the Original Model

This study focuses on the influence of applying resilient ventilation on the energy consumption of a commercial complex while ensuring thermal comfort. The CFD and MRT simulation results are presented below to characterize the degree of impact on energy-saving efficiency. The energy consumption of each zone in the buildings and the schedule affected by resilient ventilation are presented in this section.

4.1.1. CFD Simulation Result

The simulation results of the horizontal and vertical cloud maps illustrated the influence of resilient ventilation on indoor and outdoor environments. As presented in Figure 9, in the virtual wind field, the wind speed before the wind entered the building group was 7 m/s, and when it entered the primary building (case study), it decreased to less than 3 m/s. Compared to the single-building simulation (although it was still slightly higher than the measured data), it was more accurate than the CFD simulation results of a single building. As presented in Figure 9, eight typical days with eight different wind directions (North, Northeast, East, Southeast, South, Southwest, West, and Northwest) were selected, and the indoor CFD simulation results for the first floor are presented in this study. It is evident that the wind speed at the entrance was close to the outdoor wind speed of approximately 3 m/s. After the air intake, it rapidly decreased to 0.7 m/s, and this is close to the speed of a quiet wind. Subsequently, the wind speed increased slightly through the middle of the atrium.
In particular, as the side window of the atrial roof opens, eddy currents are generated in the middle of the atrium, thus accelerating the air velocity to 2 m/s. Upon comparing the eight conditions in different wind directions, when the wind flow entered the primary entrance, the improvement effect was more evident than that through the side entrance. As presented in Figure 9, the air velocity of the sales zones cannot be affected by resilient ventilation, and the corridor zones and atrium indoor wind environments are obviously influenced.

4.1.2. UTCI and Atrium Thermal Comfort Hours

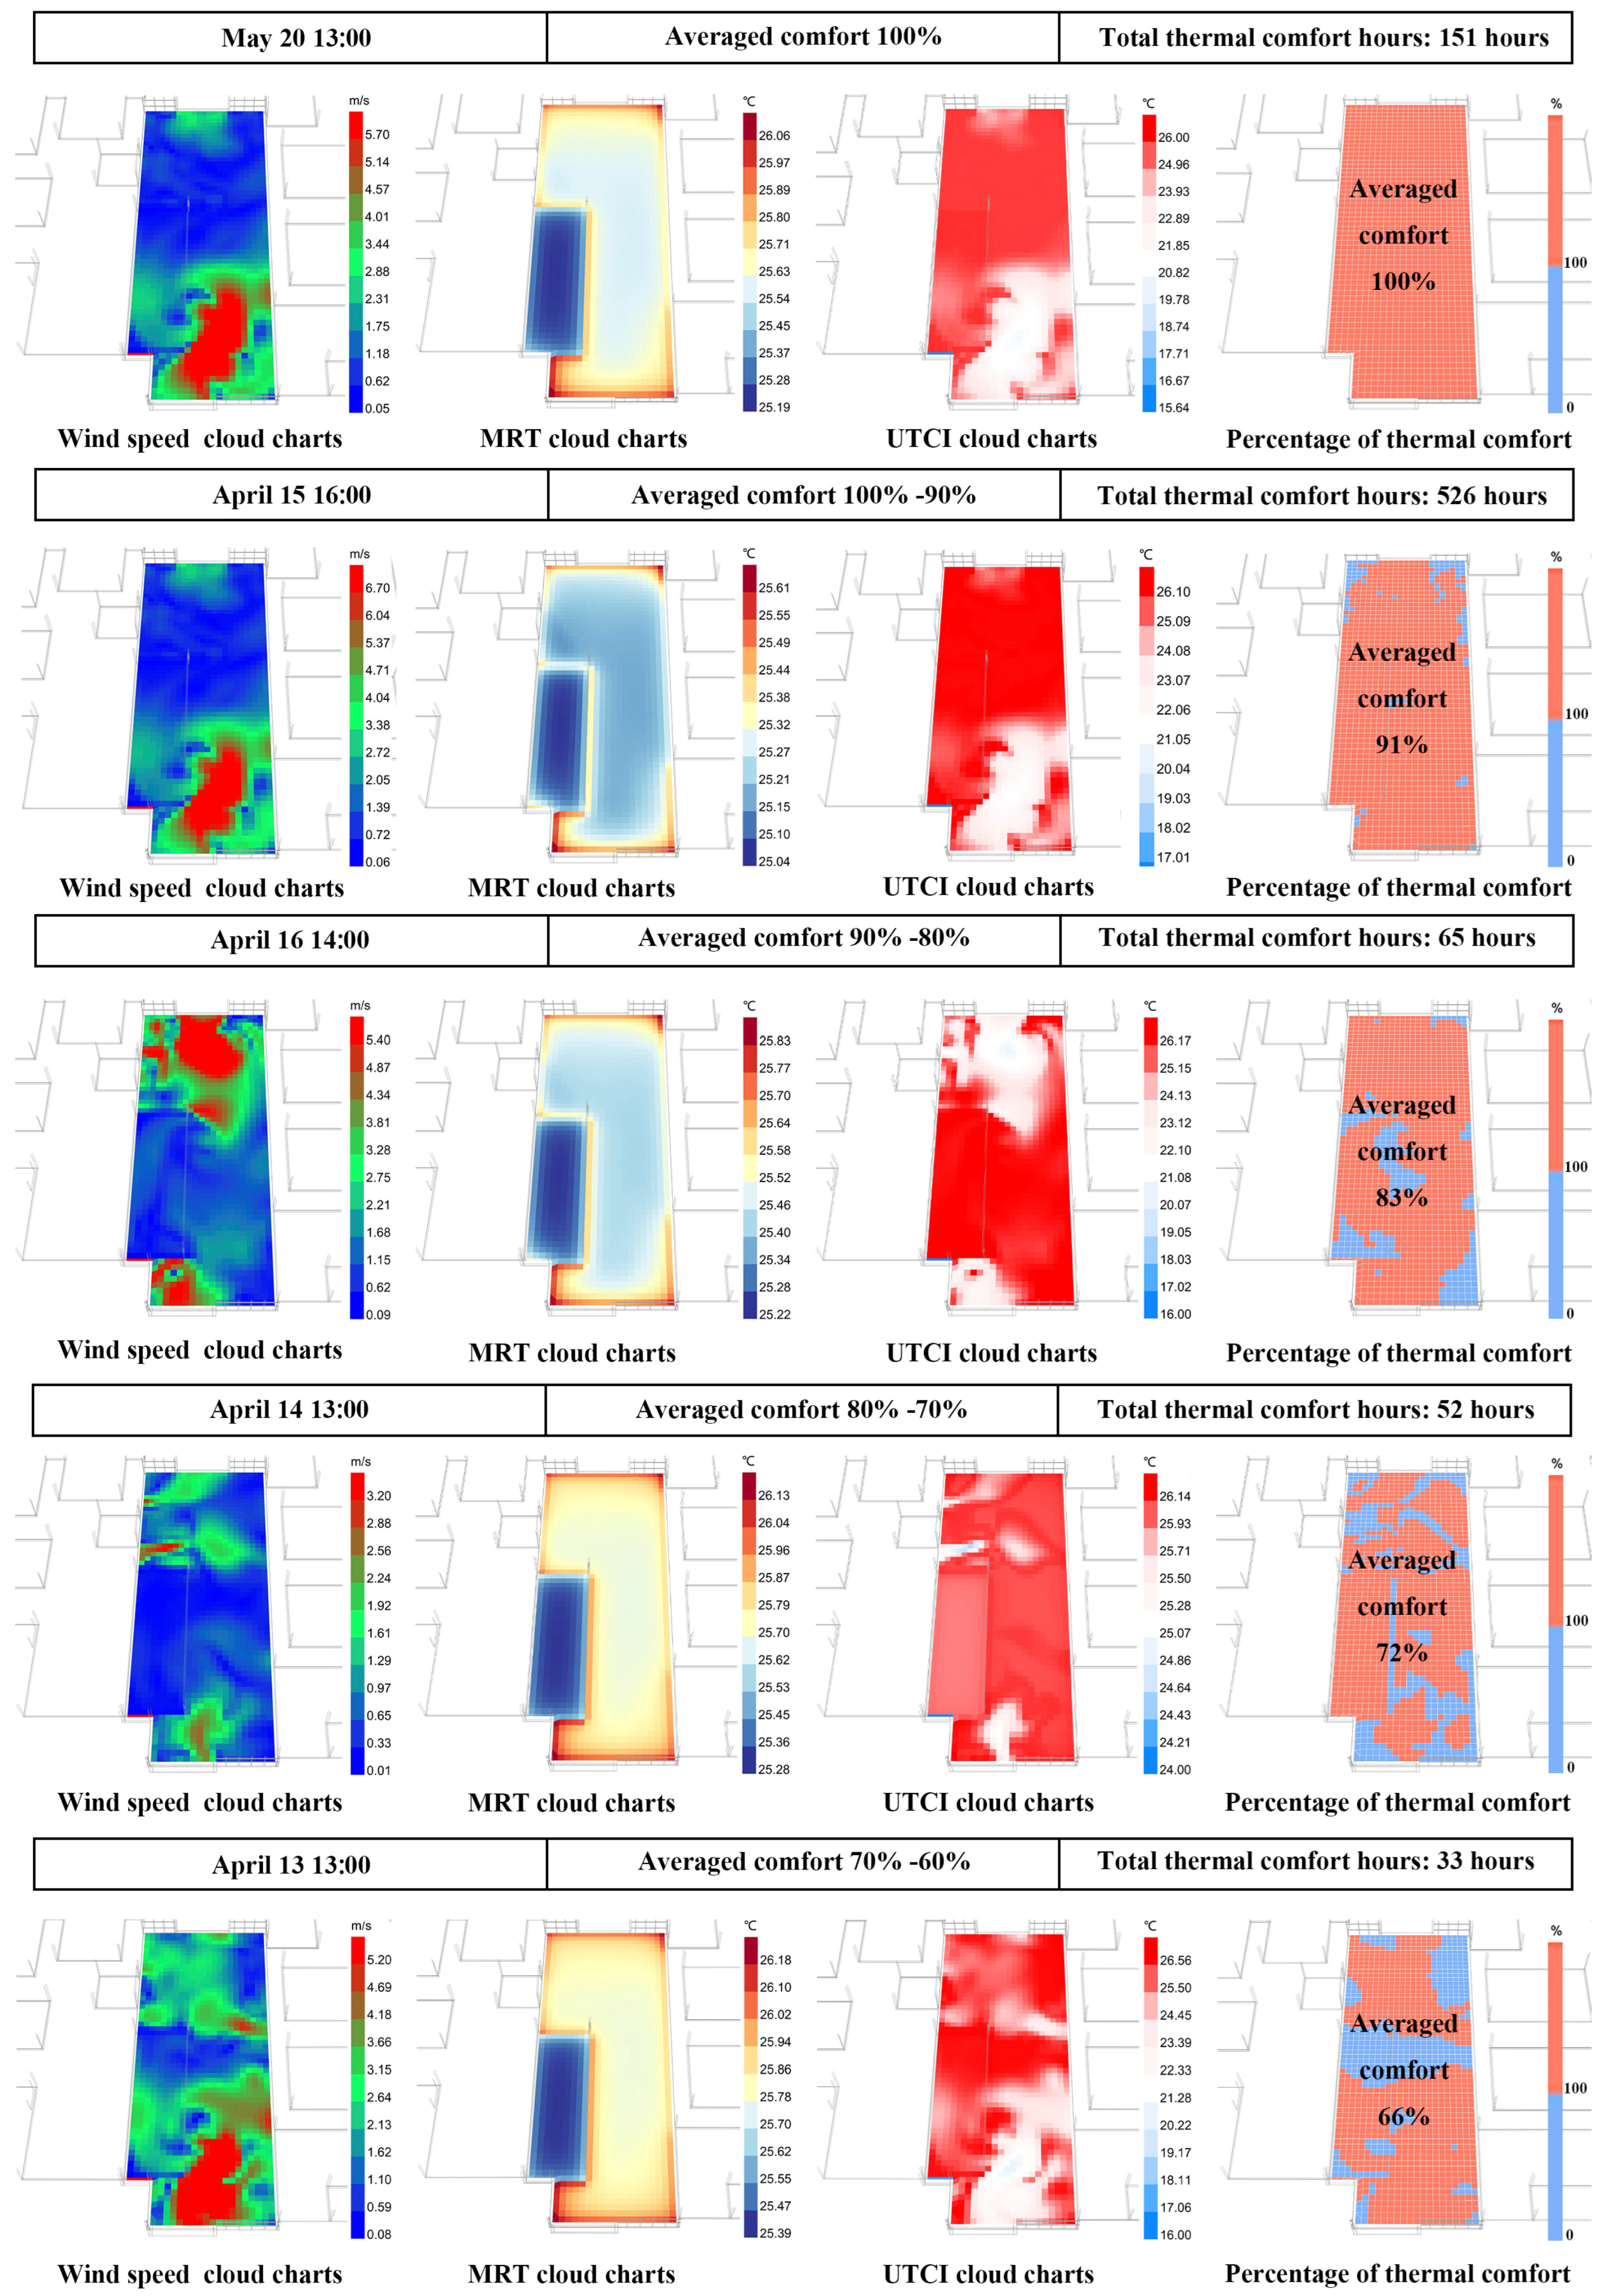
As presented in Figure 10, by comparing the wind speed cloud chart and MRT cloud chart of five hot typical hours (air temperature 32 °C, 30 °C, 31 °C, 29 °C, and 31 °C, respectively) to different atrium P C i (the percentage of grid [9 °C < UTCI temperature < 26 °C] representing thermal comfort) thermal comfort ratios (100%, 91%, 83%, 72% and 66%), it can be observed that both air velocity and MRT influence the calculation of UTCI. As the atrium is constructed with glass material, five similar MRT cloud charts illustrate that solar radiation primarily increases the MRT value in the atrium, and this decreases thermal comfort.
Based on the UTCI calculations, P C i was used to evaluate the thermal comfort ratio of the atrium. Here, P C i was calculated every 4380 h and the hours for different P C i ranges were counted. From the statistical data, the times of P C i between 60% and 70%, 70% and 80%, 80% and 90%, 90% and 99%, and 100% were 33, 52, 65, 526, and 151 h, respectively. From the perspective of the thermal comfort time of the atrium under the influence of resilient ventilation, the increase in time was not evident when the P C i was reduced to 80%. Considering user experience, it is recommended to control the P C i to exceed 80%. An important finding is that the wind speed cloud charts are similar to the UTCI cloud charts, and this confirms that increasing wind speed decreases the UTCI temperature effectively and increases the P C i . Additionally, the CFD simulation results indicate if effective convection can be formed in the vent of the commercial floor, and this also exerts a significant impact on the improvement of thermal comfort.

4.1.3. Effect of Resilient Ventilation on Energy Savings

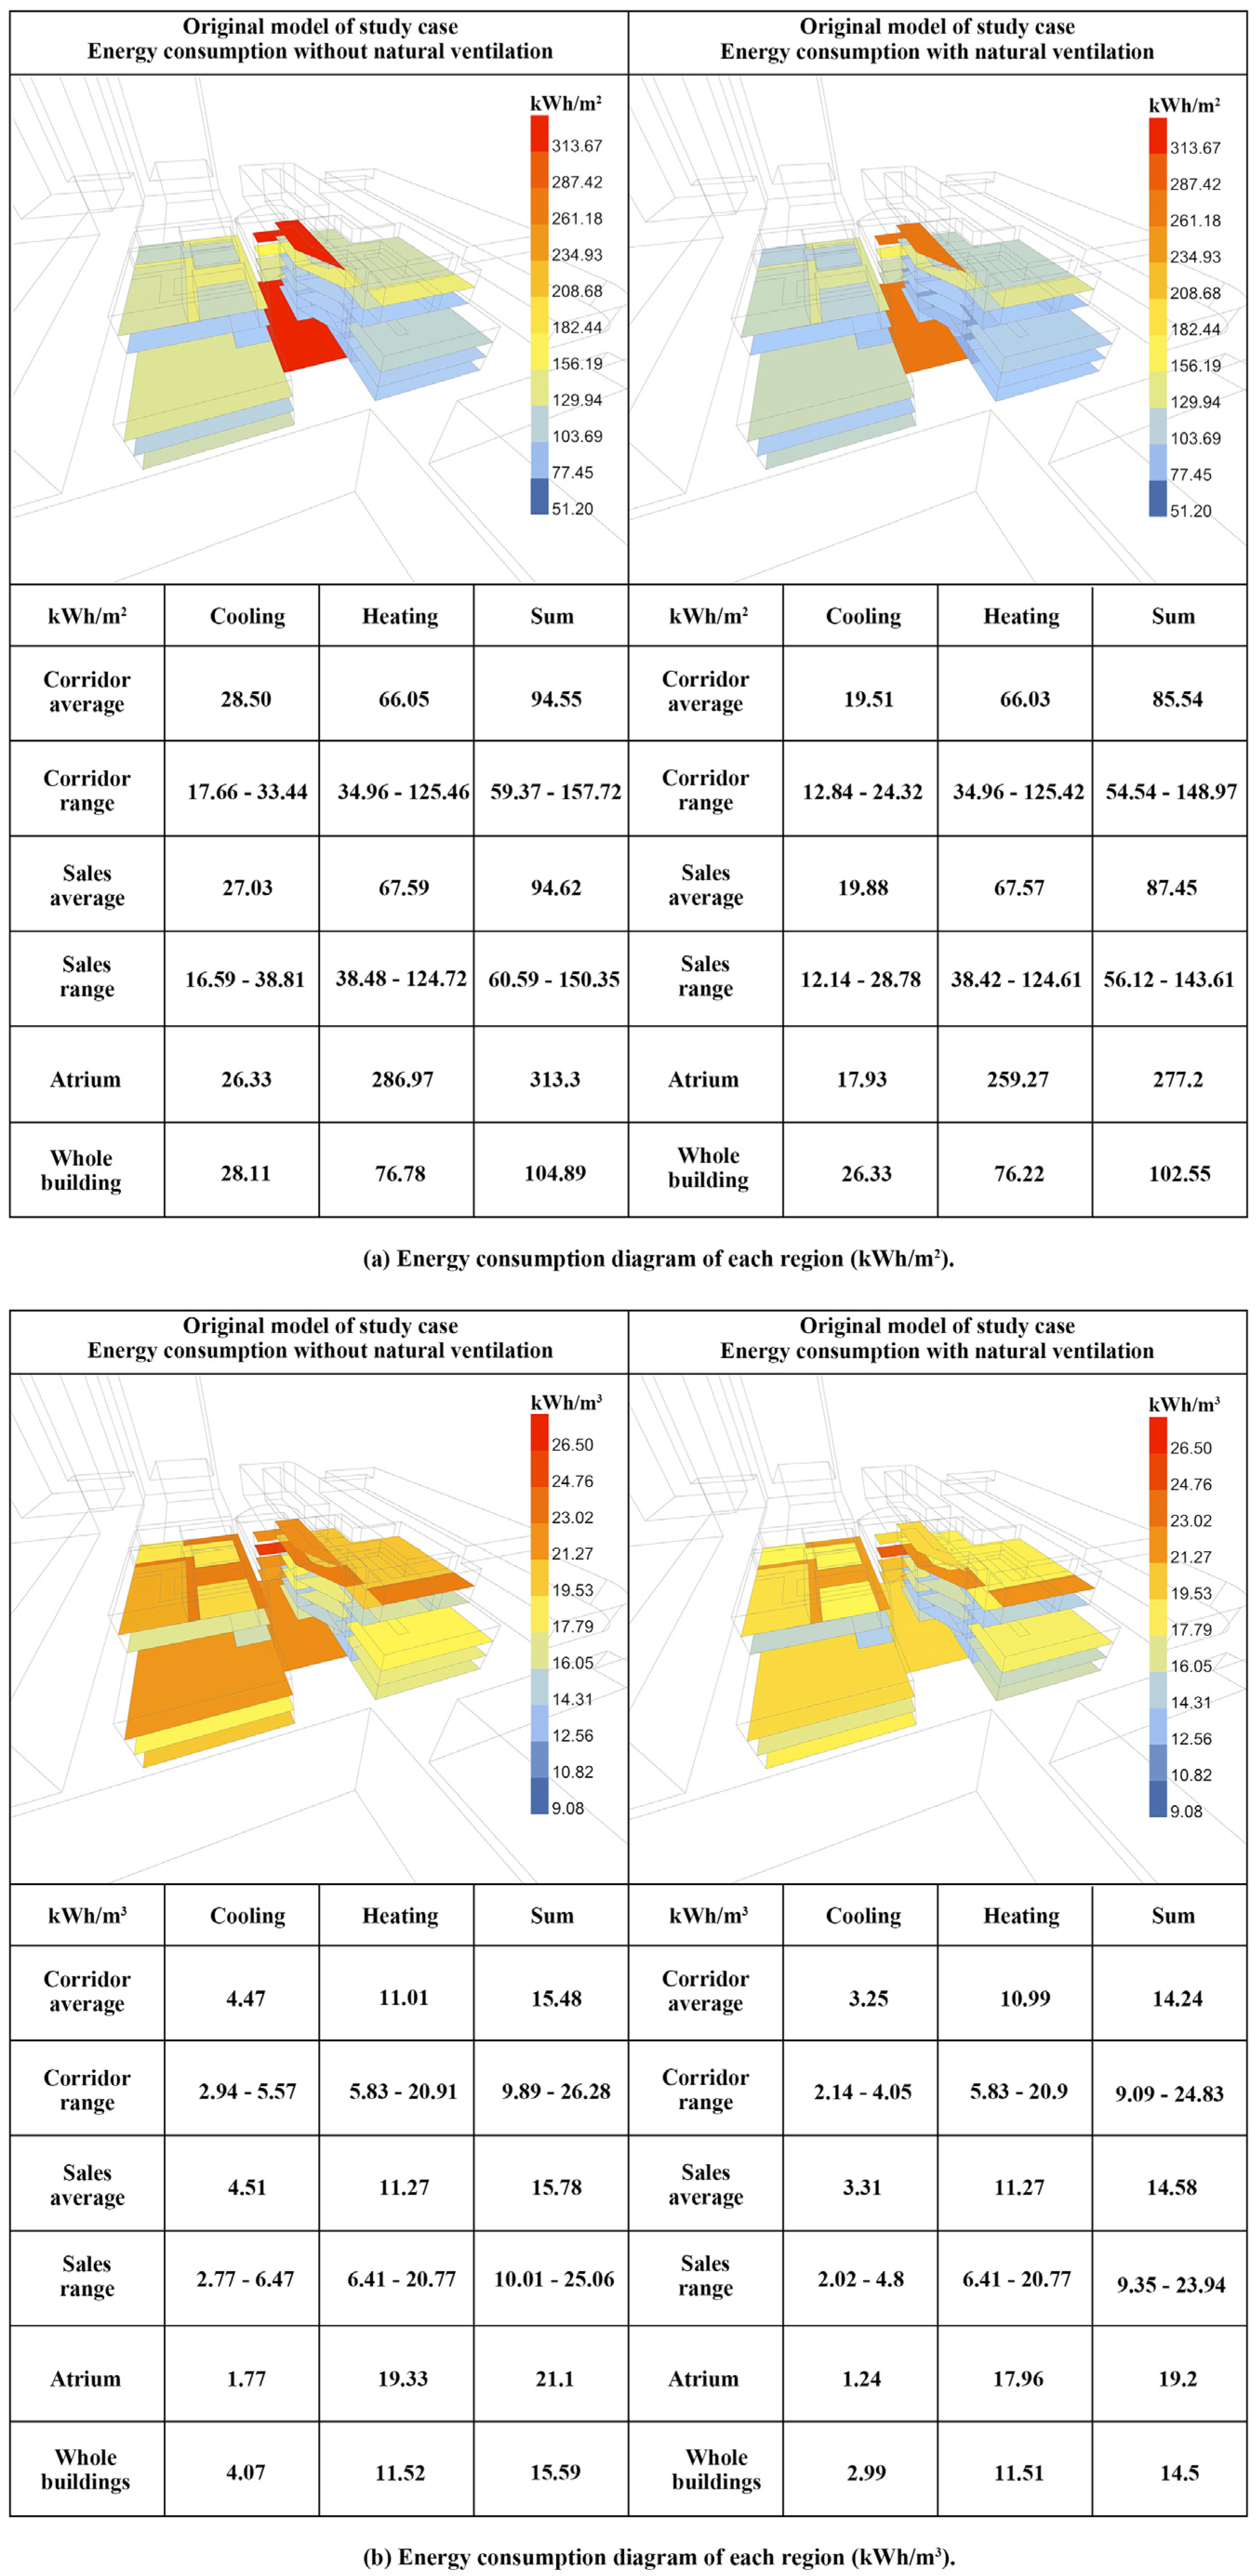
This section presents the influence of resilient ventilation on the original building’s energy consumption, particularly in the heating and cooling portions. As presented in Figure 11, the total cooling energy consumption decreases by 2.33%, the total heating energy consumption decreased by 0.73%, and the sum energy consumption decreases by 2.23%. We found that on a square meter (m2) basis, the energy consumption of the atrium was significantly higher than that of the other areas. However, measured in cubic meters (m3), although the energy consumption of the atrium is less than that of some sales areas and corridor areas, the decrease of atrium energy consumption is most affected by natural ventilation. From the analysis, it can be inferred that the influence of resilient ventilation on energy consumption is concentrated on refrigeration energy consumption, particularly in the atrium area with the highest energy consumption per unit area.
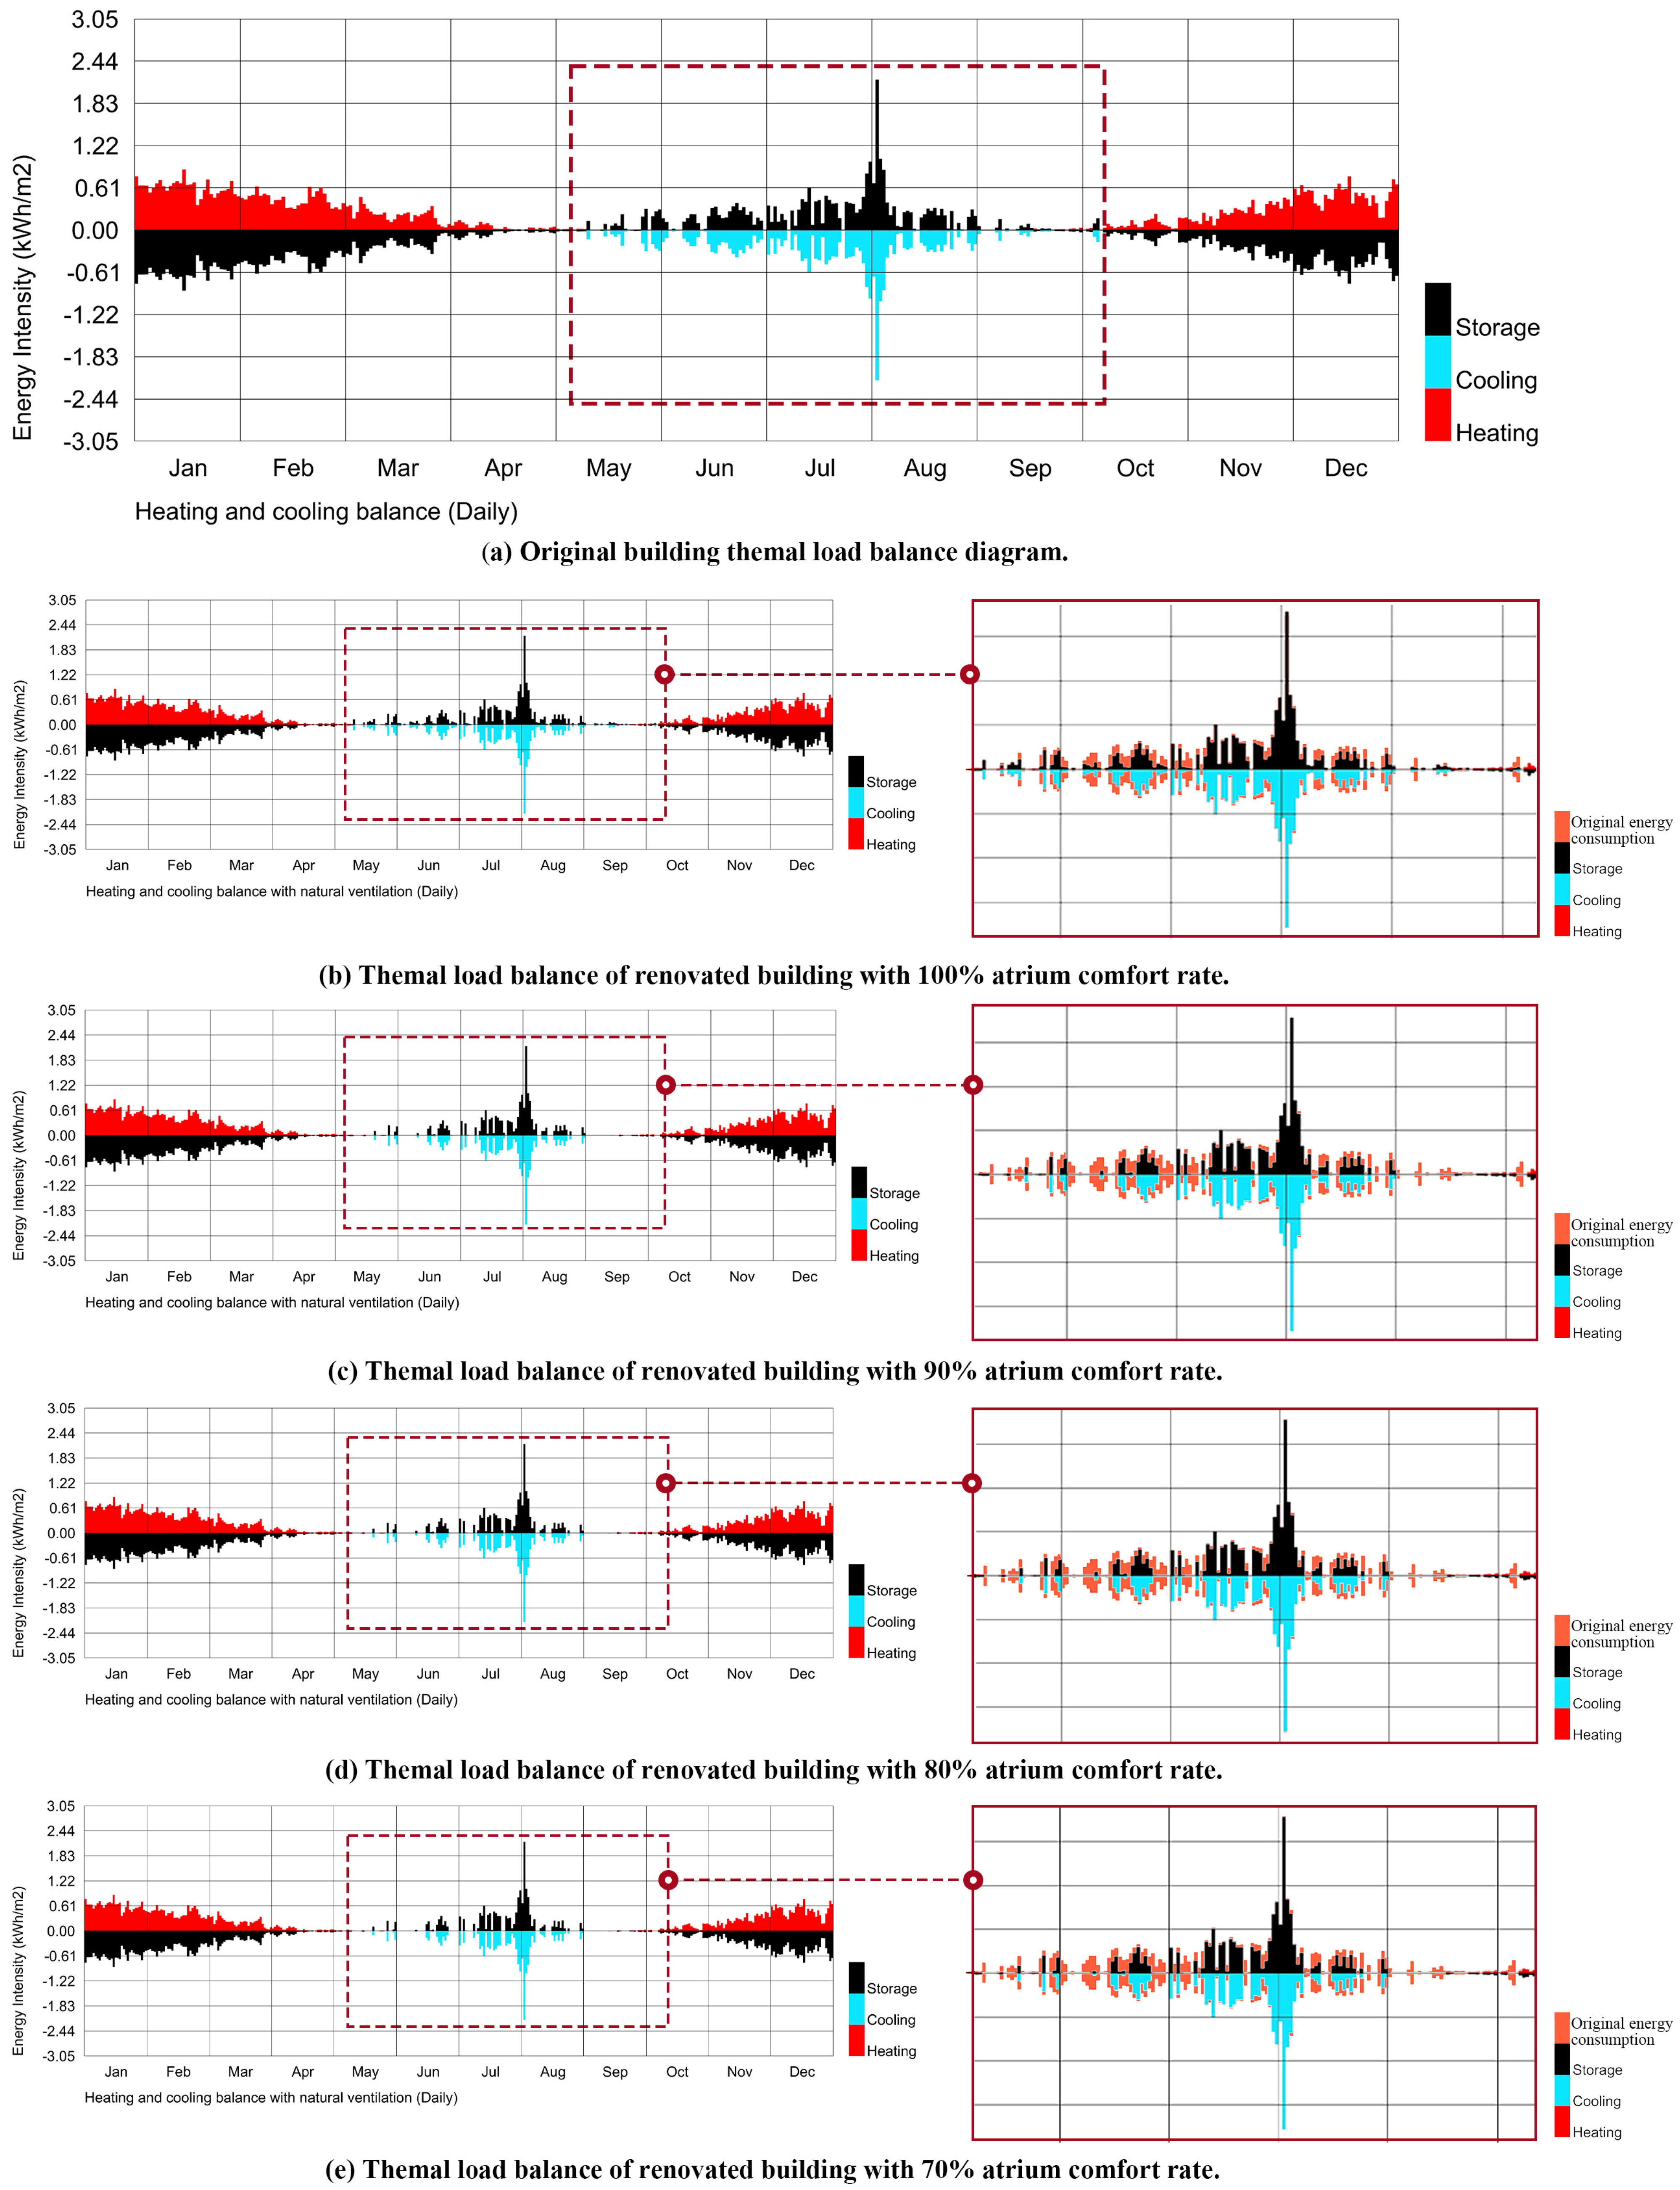
As presented in Figure 12, the corrected air-conditioning schedule primarily influences the cooling energy consumption in hot climates, and this may indicate that resilient ventilation can effectively reduce the influence of high temperatures and improve thermal comfort. However, it is worth noting that resilient ventilation exerts little effect on improving thermal comfort at extremely high temperatures in summer. By comparing the energy consumption balance diagram of the resilient ventilation commercial complex with that of the original commercial complex (Figure 12a), it can be observed that resilient ventilation can effectively reduce energy consumption from July to August. Seasonal change exerts a better energy-saving effect not only in the typical summer high-temperature period but also in April to May and September to October. By comparing the different percentages of thermal comfort requirements (Figure 12b–e), it can be observed that reducing the percentage of thermal comfort can significantly reduce the cooling energy consumption in spring and autumn. However, when the switch air-conditioning standard is set to a thermal comfort area ratio of 100–90%, it has a significant impact on energy savings. With the on-off air conditioning standard set to 100–80%, the impact on energy savings begins to decrease, and when the switch air conditioning standard is set to a thermal comfort area ratio of less than 80%, it has a small impact on energy savings. Therefore, to reduce energy consumption through resilient ventilation, it was inferred from the results of this study that the thermal comfort demand of the atrium of a commercial complex in an extremely cold area should not be lower than 80%.

4.2. Morphological Parameters Analysis

In this section, a correlation analysis was applied to explore the relationship between the energy-saving efficiency and morphological parameters of the two types of roofs. First, Spearman’s correlation was used to analyze the influence of each parameter on the energy-saving efficiency, and different regression models were then fitted and screened for parameters with a high correlation and energy-saving efficiency. Finally, a bivariate quadratic regression model was selected to perform surface fitting between the effective parameters and energy-saving efficiency to obtain the change trend of the roof shape and energy-saving efficiency.

4.2.1. Parameters and Energy Efficiency Correlation

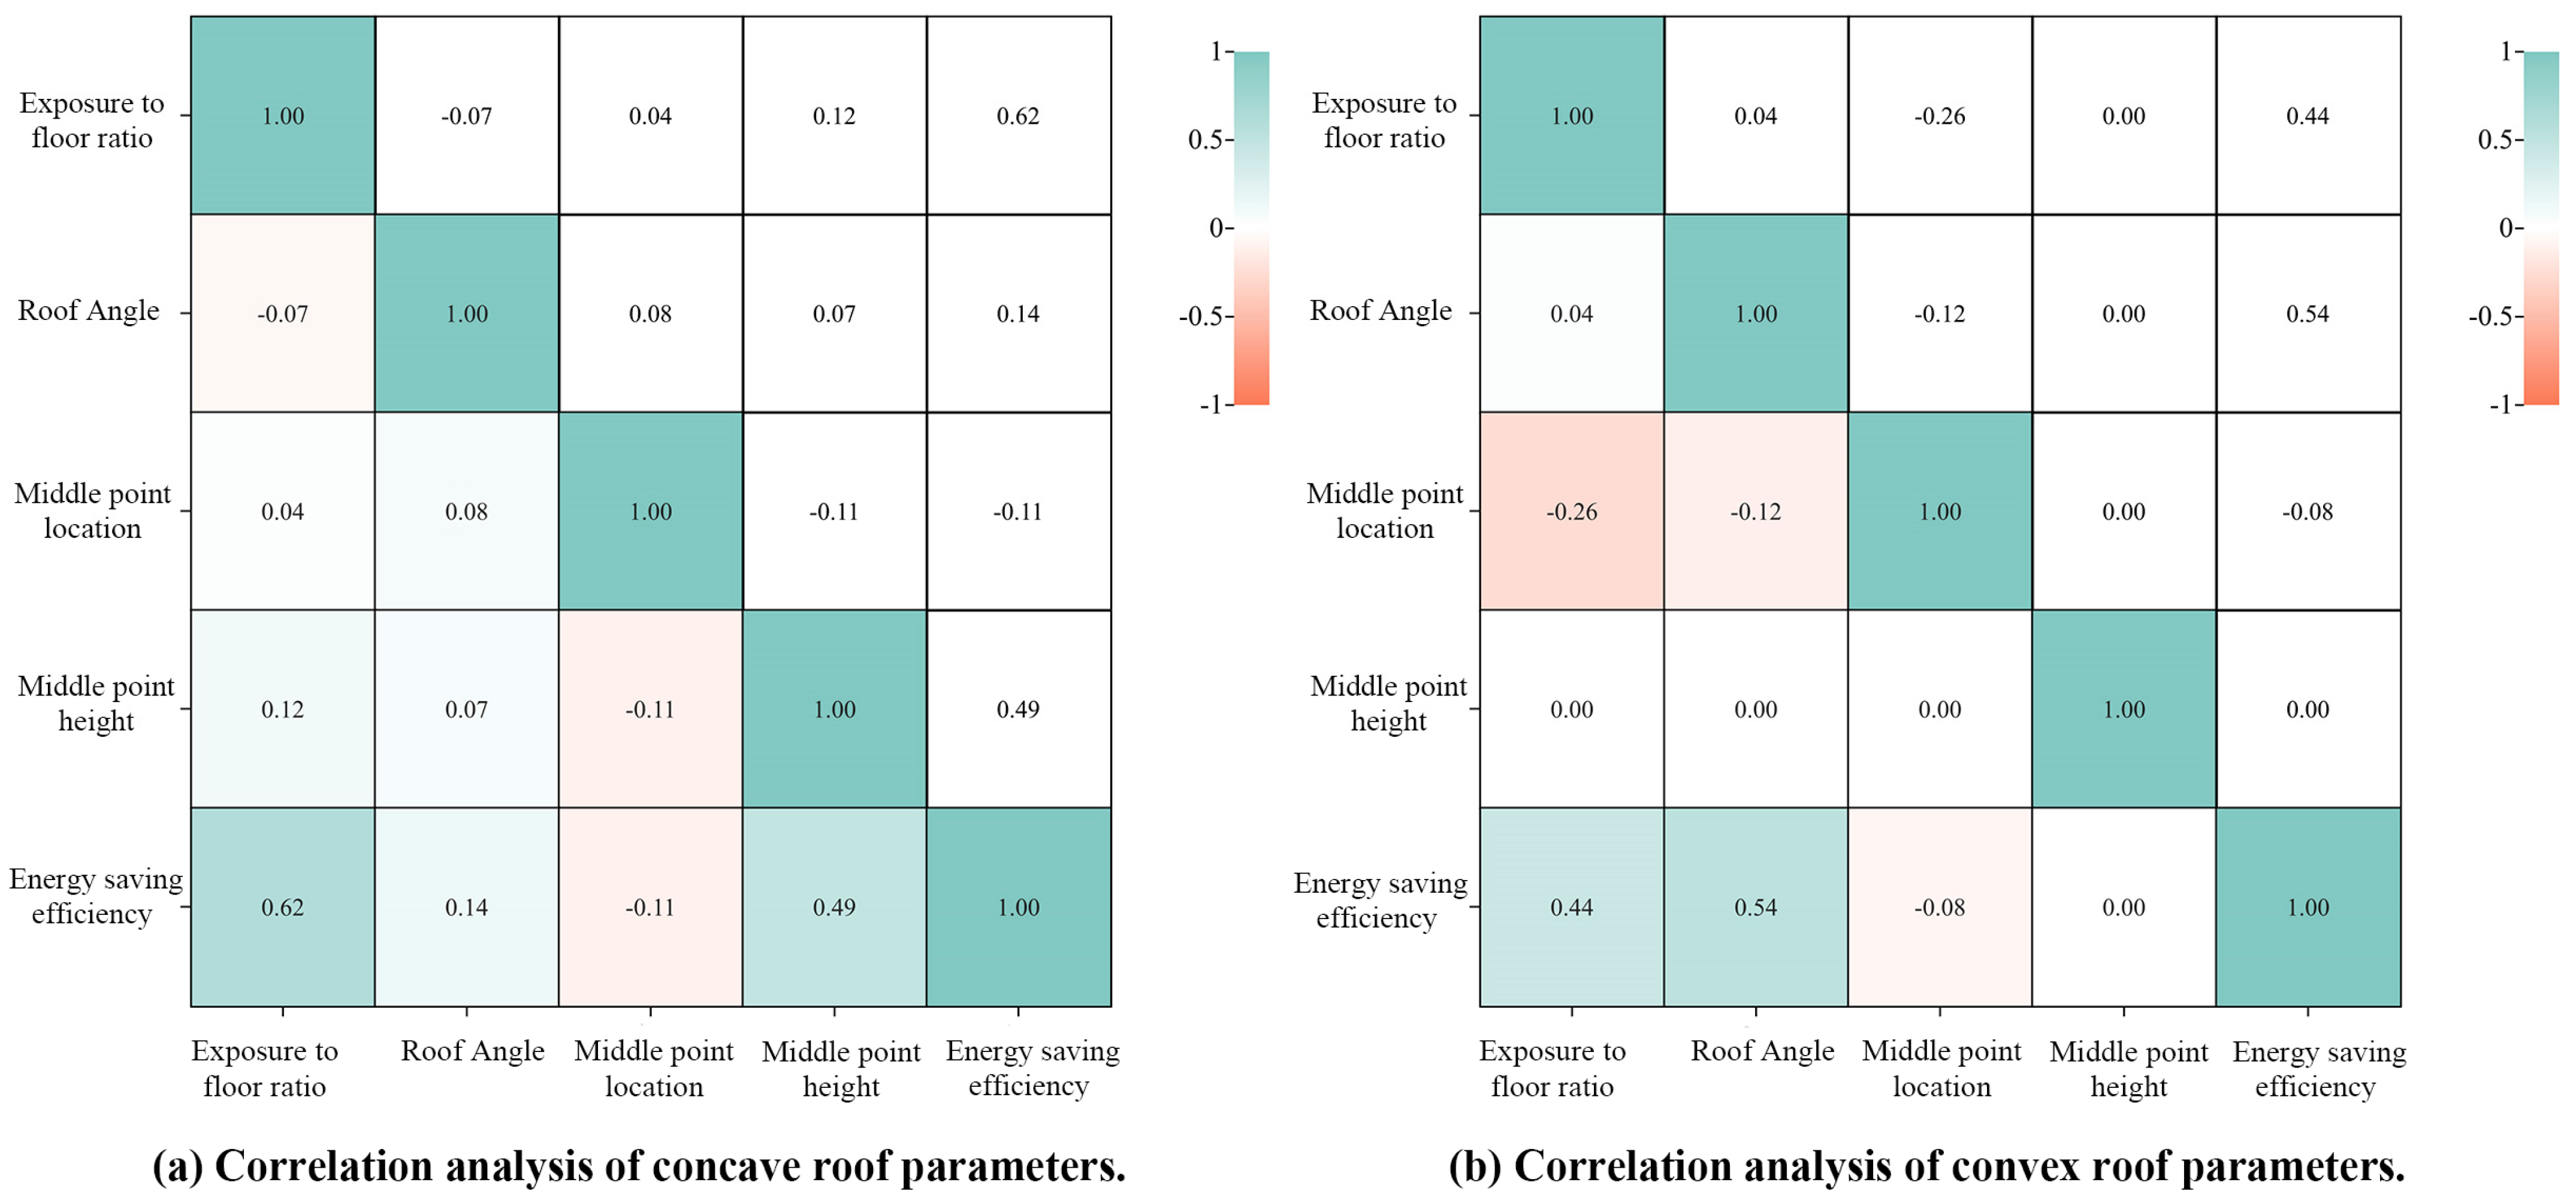
As presented in Figure 13, by applying a Spearman correlation analysis, it can be observed that energy-saving efficiency is significantly correlated with the exposure to floor ratio (k) and middle point height (h) in the concave roof form (0.62 and 0.49, respectively). Therefore, parameters k and h of the concave roof type are analyzed below. Conversely, in the convex roof Spearman correlation analysis, energy efficiency is significantly correlated with exposure to floor ratio (k) and roof angle (α) (0.44 and 0.54, respectively). Based on the above results, parameters k and α were selected for detailed analysis.
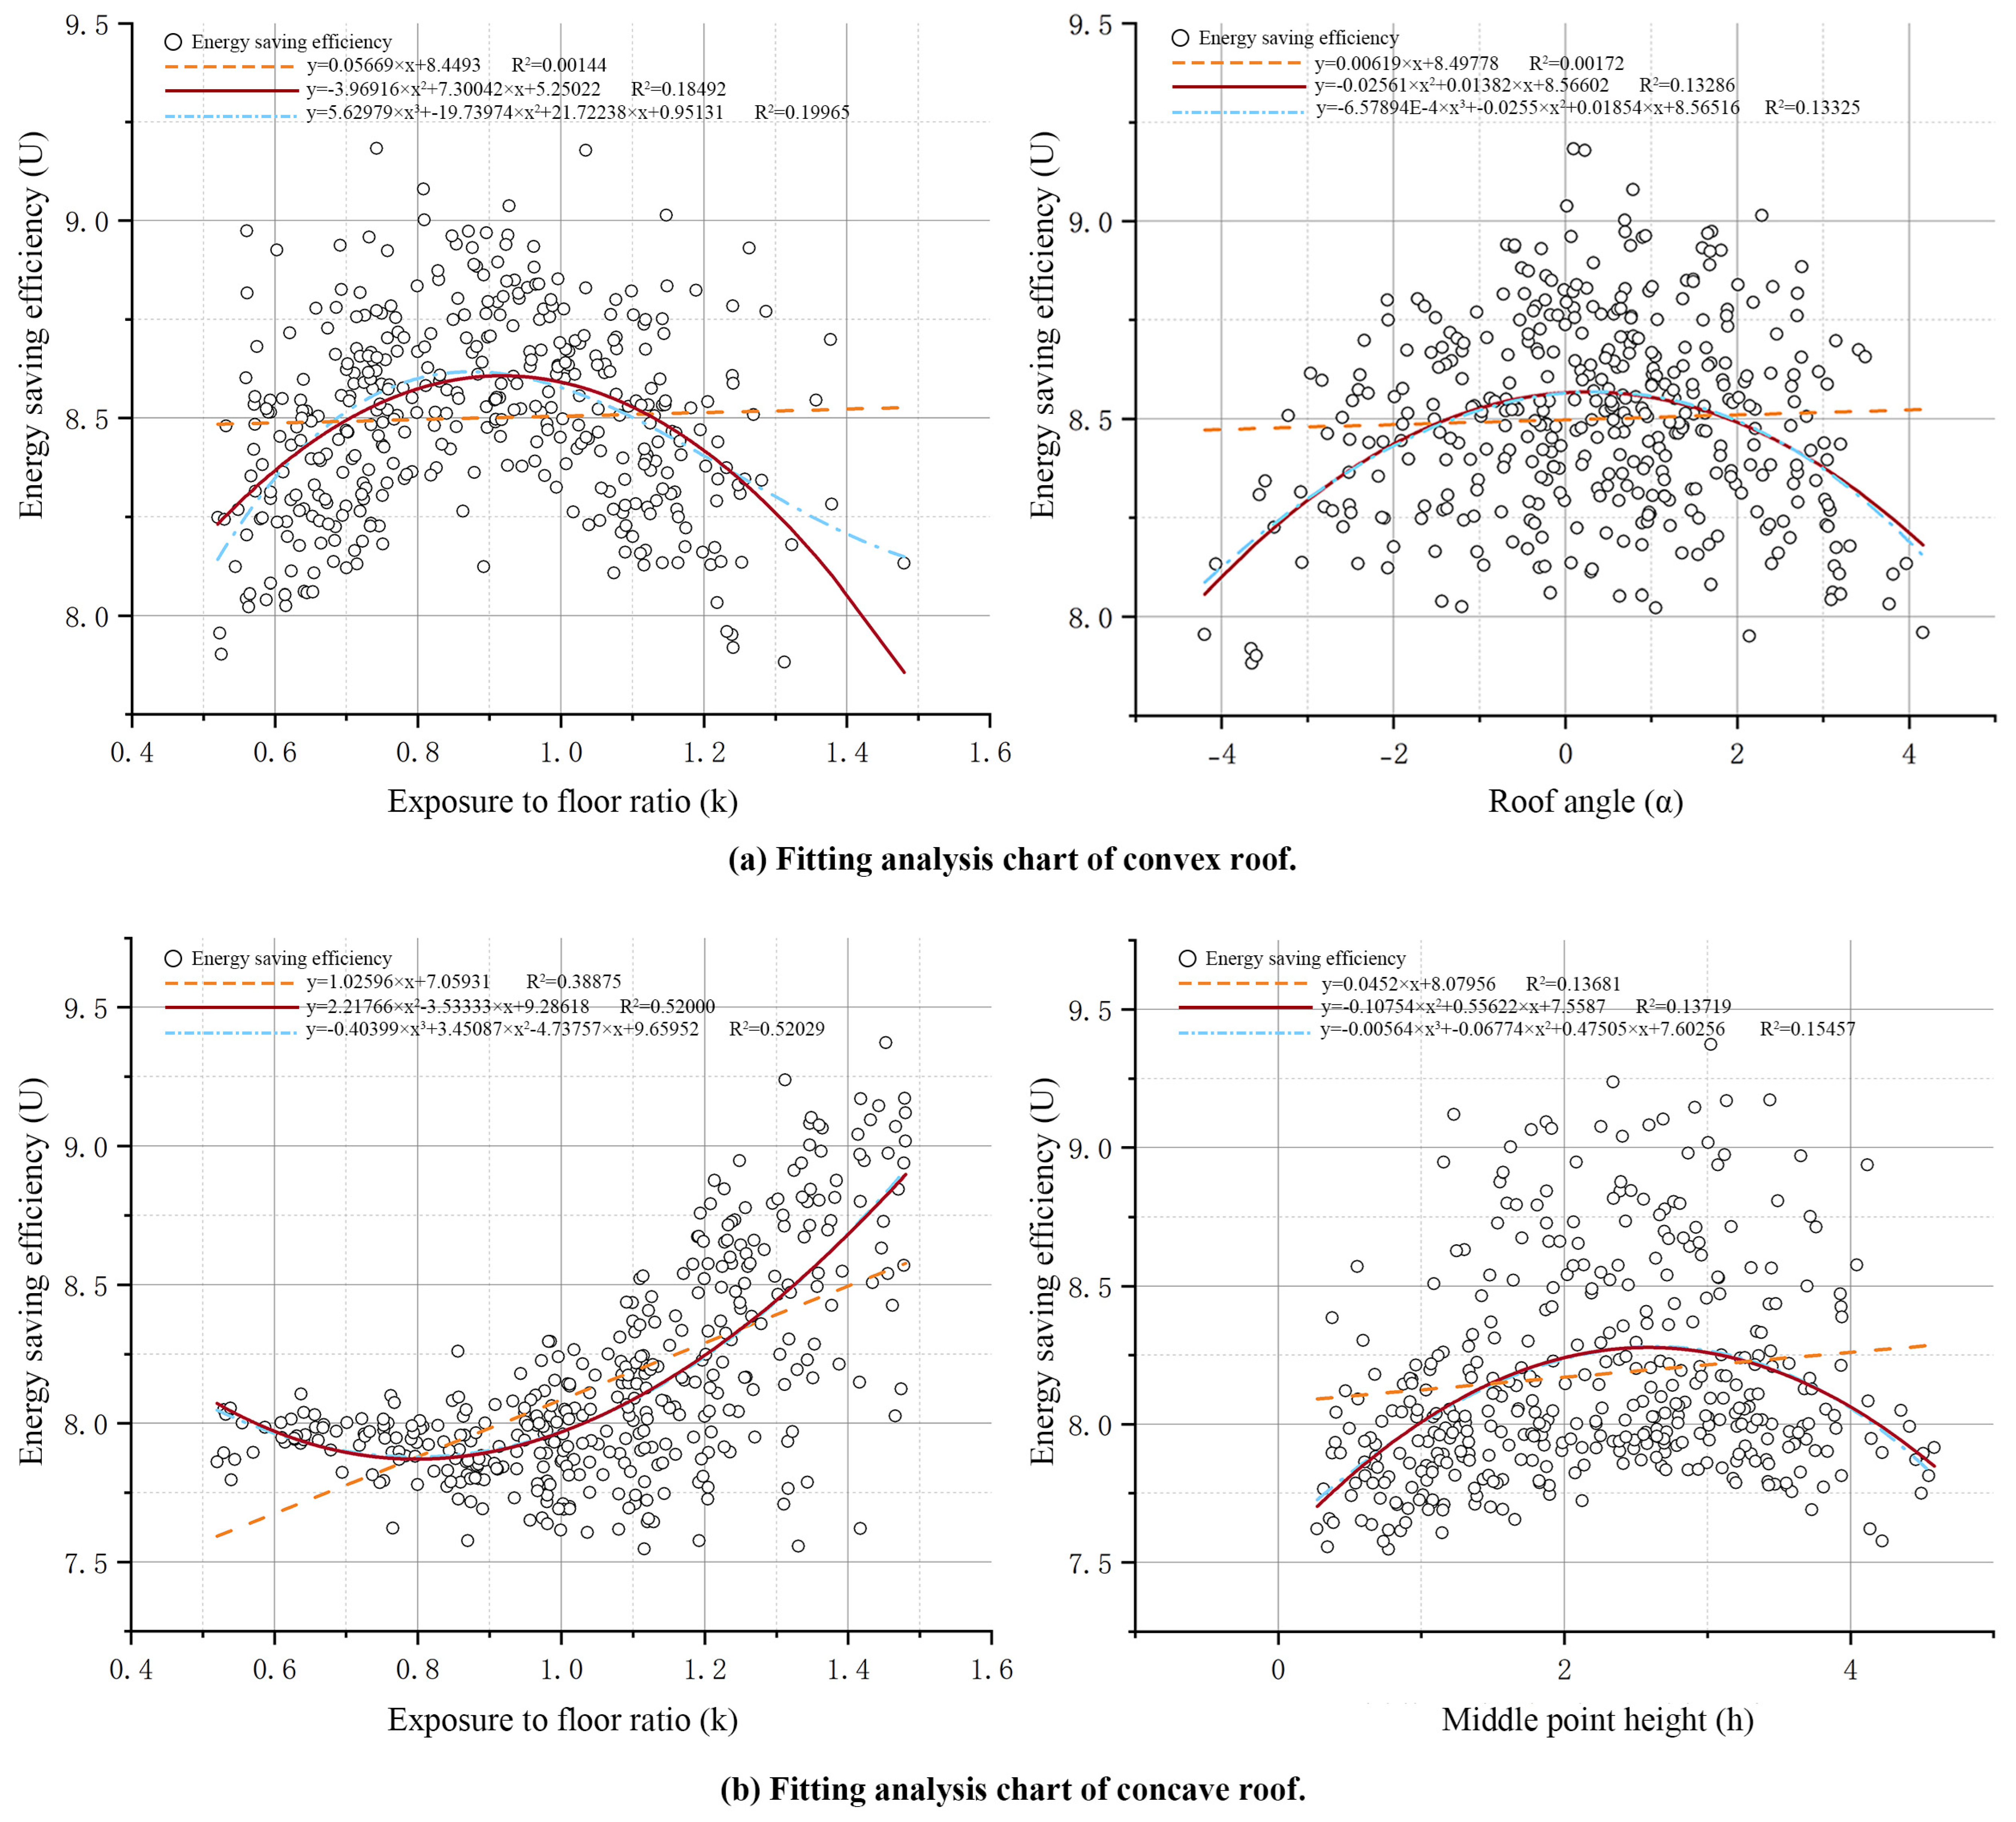
Figure 14 presents the fitting results of a single effective parameter for the energy-saving efficiency. The R2 values of the nonlinear fitting equations of one quadratic variable between the exposure-to-floor ratio (k) and energy-saving efficiency in the convex roof and of one cubic variable were 0.18492 and 0.19965, respectively. The R2 values of the nonlinear fitting equations of one variable quadratic between the roof angle (α) and energy-saving efficiency and of one cubic variable were 0.13286 and 0.13325, respectively. The R2 values of the nonlinear fitting equations of one quadratic variable between the exposure to floor ratio (k) and energy-saving efficiency on a concave roof and of one cubic variable were 0.52 and 0.52029, respectively. The R2 values of the nonlinear fitting equations of one quadratic variable between the middle point height (h) and energy-saving efficiency and of one cubic variable were 0.13719 and 0.15457, respectively.
In summary, compared with the different fitting models, according to the characteristics of the data and prevention of overfitting, the fitting results of the nonlinear fitting equation of one variable and two times were better. Based on the above inertial analysis, a quadratic-function-fitting model was chosen to study the influence of the effective parameters on the energy-saving efficiency. The data characteristics of the parameters were determined using a fitting curve. Additionally, the exposure to floor ratio (k) of the concave roof increased and the energy-saving efficiency decreased and then increased, whereas the energy-saving efficiency of the other three parameters first increased and then decreased with an increase in the parameter’s value.

4.2.2. Multiple Parameter Regression Fitting

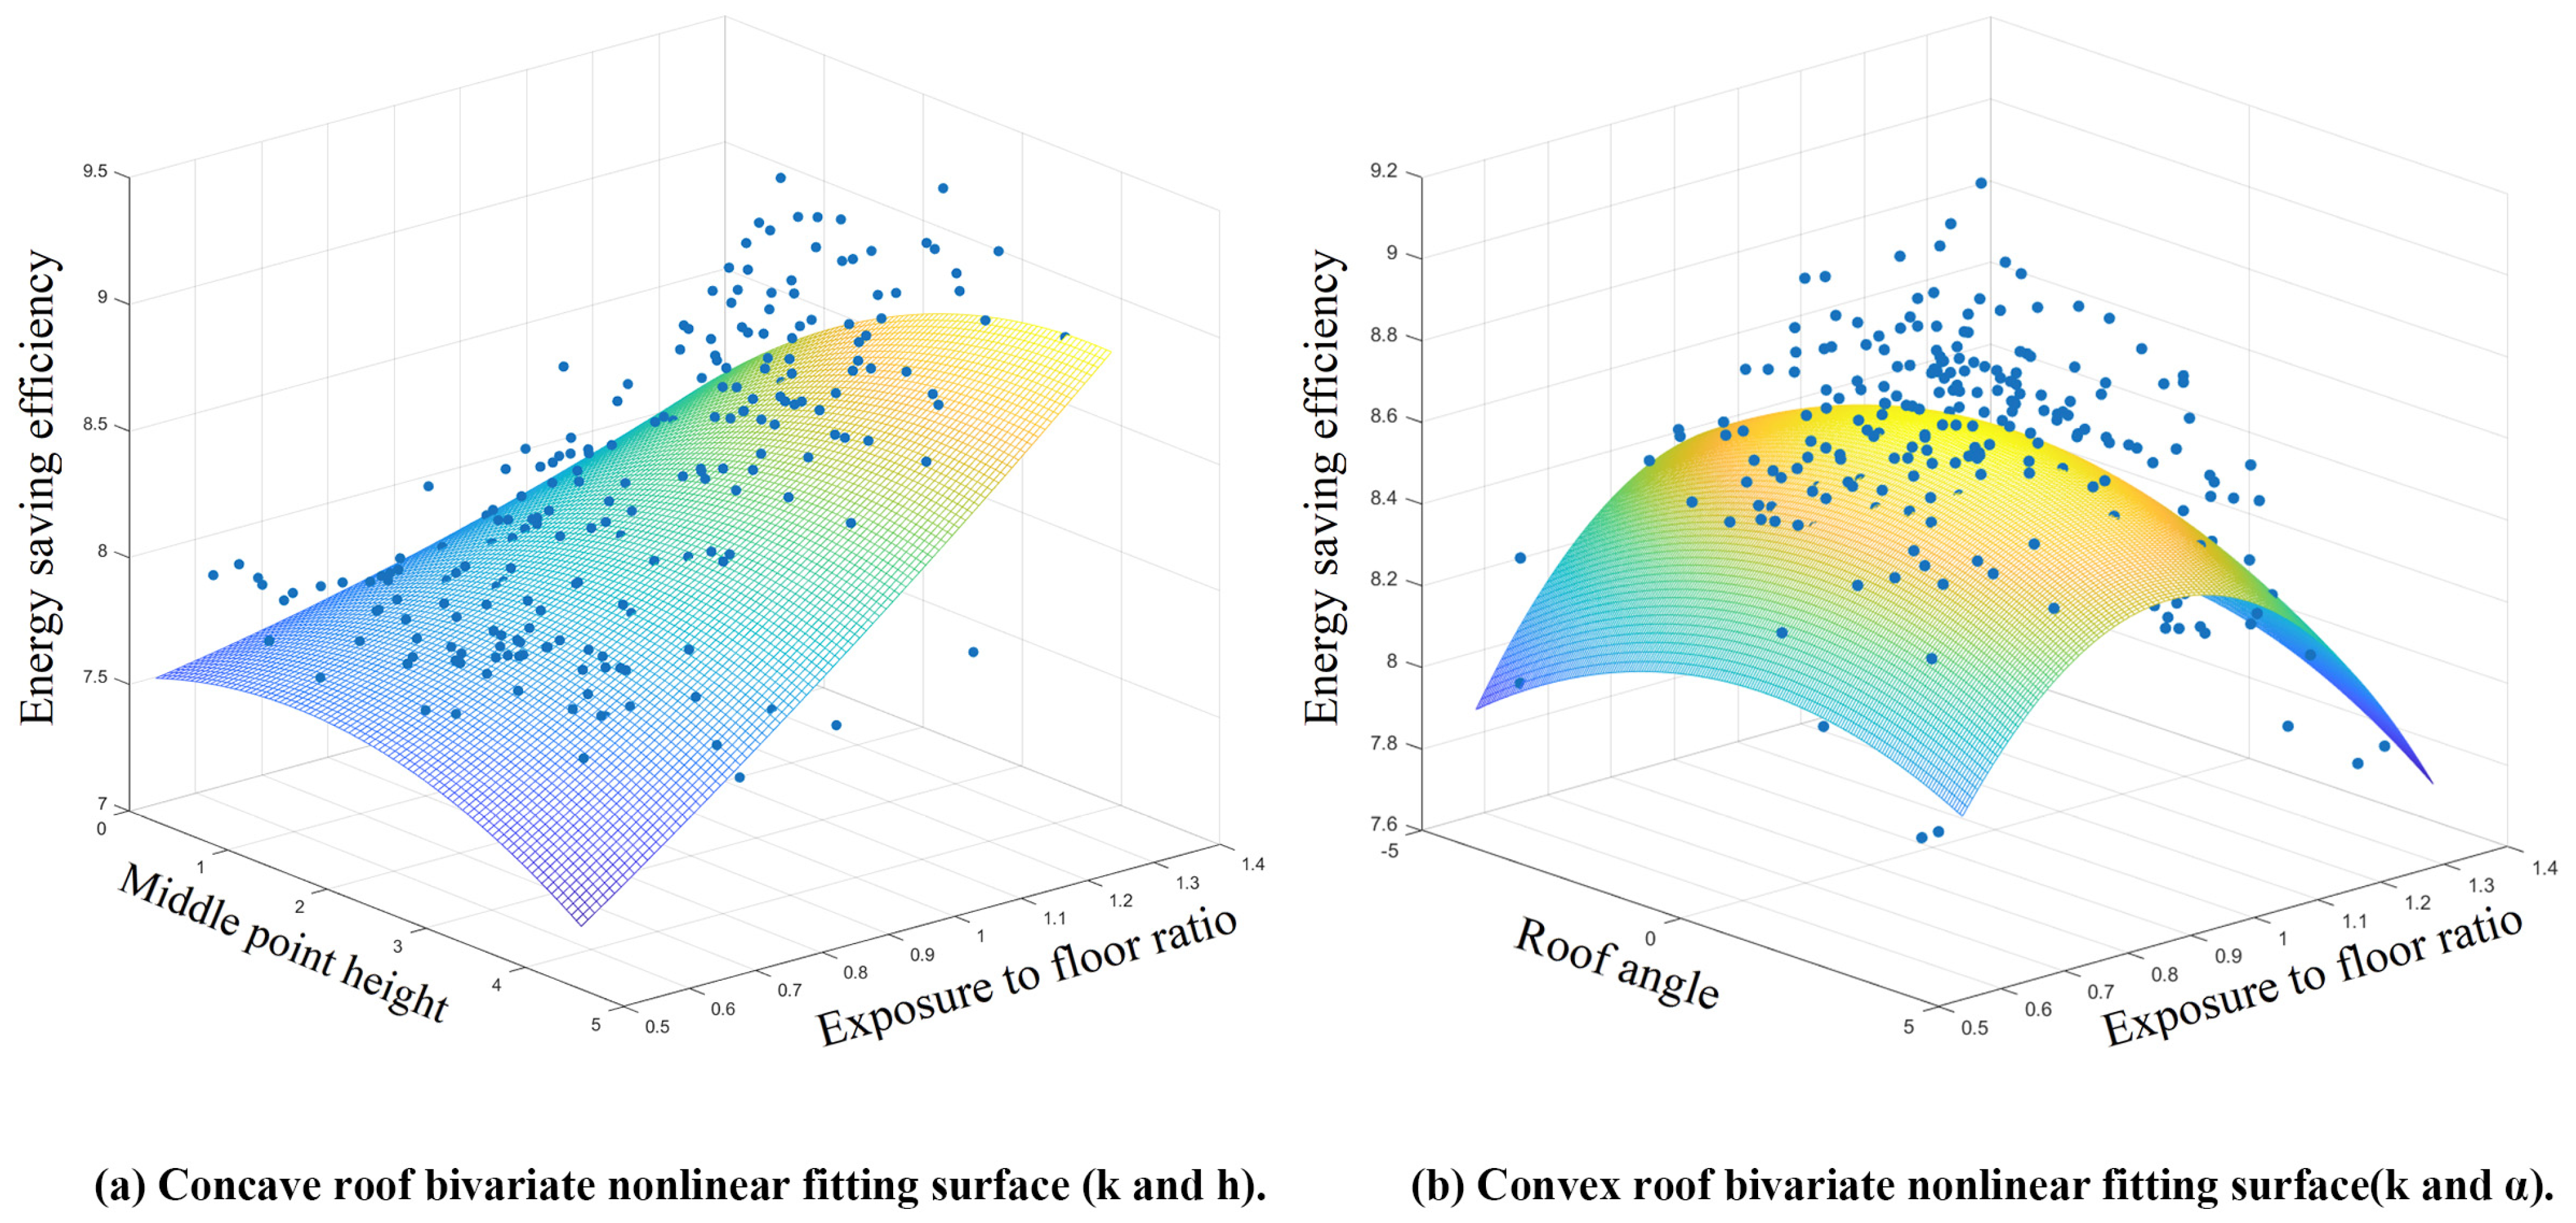
According to the comparison results described in Section 3.2.1, the fitting effect of the quadratic function is better than that of the other two functions. To reveal the influence of the two parameters on energy-saving efficiency, a binary quadratic surface regression model was used to perform multiple nonlinear regressions on the data to explore the relationship between the effective parameters and the energy-saving efficiency. By applying the binary nonlinear regression fitting model, the fitting result of the R2 is 0.1389, and the fitting equation for the concave roof is as follows:
y = 9.8057 0.0895 x 1 2 + 3.3637 x 2 2 + 0.3251 x 1 x 2 + 0.1928 x 1 5.6637 x 2
By applying the binary nonlinear regression fitting model, the fitting result of the R2 is 0.0434, and the fitting equation for the concave roof is as follows:
y = 5.5668 0.0092 x 1 2 3.6308 x 2 2 0.0406 x 1 x 2 + 0.0380 x 1 6.6470 x 2
As presented in Figure 15a, the concave roof-fitting surface was approximately hyperboloid. The two effective parameter peak sets approached the edge of the surface, the exposure to floor ratio (k) approached 1.4, and the middle point height (h) was approximately 2 m. In Figure 15b, for the convex roof-fitting surface, the peaks of two effective parameters of the convex roof-fitting surface are concentrated at the center point of the surface, the exposure to floor ratio (k) is close to 1, and the roof angle (α) is close to 0°.

4.3. Optimized Design Result

In this section, two energy efficiency prediction models of the two types of roofs are applied to reveal the optimized parameter range, and the geometrical parameters of the optimal solution for the two types of roofs are calculated using a GA. Additionally, to improve the diversified characteristics of architectural design forms, two typical forms (flat roof and slope roof) were selected and compared to the above optimized results for supplementary discussion.

4.3.1. Optimized Range of Parameters

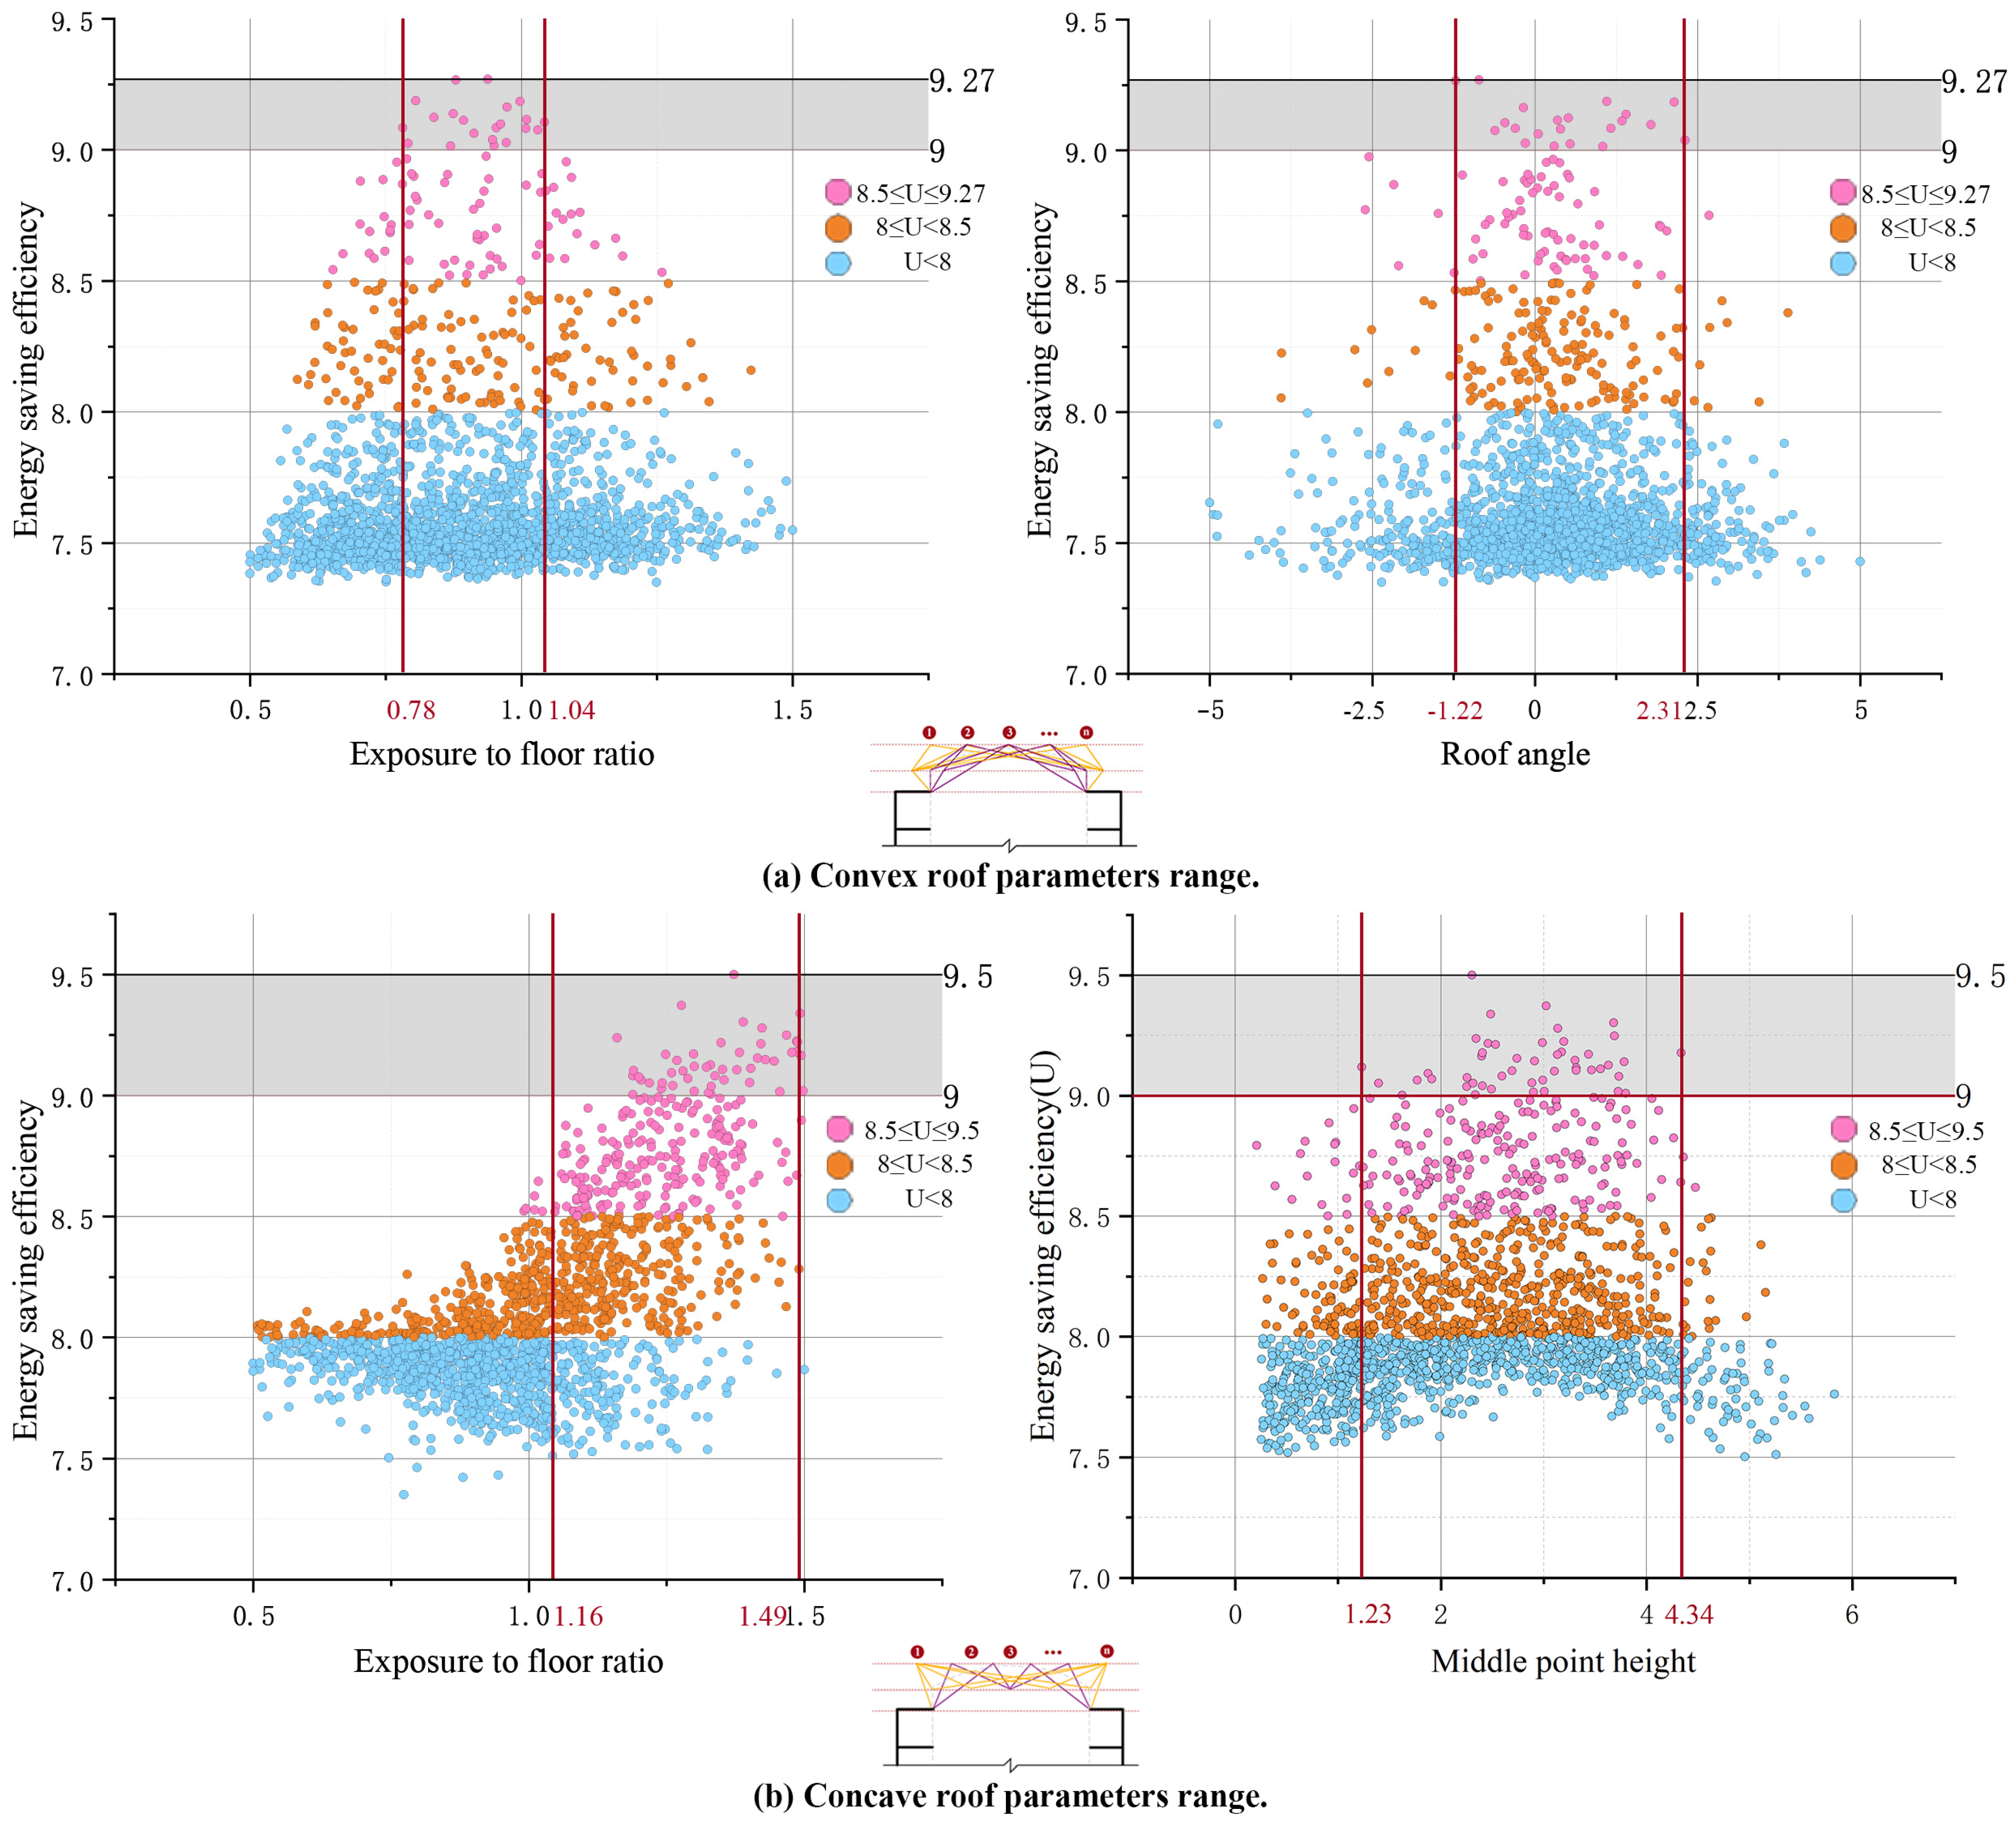
A total of 2000 sets of prediction data for each of the two roof types were calculated using the machine learning surrogate model as described in Section 3.3.1. An energy-saving efficiency (U) of greater than 9% was considered as the standard to measure the parameter value range, and different forms of roof energy efficiency were accompanied by different parameters.
As presented in Figure 16a, in 2000 sets of convex roof energy-saving efficiency data, it can be observed that the energy-saving efficiency of the exposure to floor ratio (k) first increases and then decreases as the ratio increases. When the predicted values of energy-saving efficiency (U) are greater than 9%, the exposure to floor ratio (k) of the convex roof range is between 0.78 to 1.04, and the roof angle (α) range is from −1.22° to 2.31°. Most of the roof angles exhibit a range of greater than 0°, thus indicating that the inclination angle of the atrium roof is related to the prevailing wind direction in the region and that the air inlet facing the prevailing wind direction should be higher than the leeward inlet in summer.
For the 2000 sets concave roof energy-saving efficiency data, Figure 16b indicates that when the predicted values of energy-saving efficiency (U) are greater than 9%, the exposure to floor ratio (k) range is from 1.16 to 1.49, and the middle point height (h) range is from 1.23 m to 4.34 m. Additionally, it can be concluded that the exposure to floor ratio should be greater than 1.16, and the overall energy-saving efficiency exhibits an increasing trend with an increase in the ratio that is significantly higher than that of the convex roof. The middle point height should not be lower than 1.23 m, and it is worth noting that the middle point height increases, and the energy efficiency increases and then decreases. This indicates that the middle point height may significantly affect resilient ventilation. But as the height of the middle point increases, the horizontal tendency of the roof shape may reduce wind pressure. Therefore, when designing the concave roof, the focus should be on the value range of the middle point height, and it should not be higher than 4.34 m.

4.3.2. Optimal Parameters of Atrium Roofs

In this research, the top 100 roof shape models with the highest energy efficiency were calculated in the GA process (shown in Section 3.3.2, and the optimal 100 datasets were used to compare the energy-saving efficiency of different atrium roof geometries.
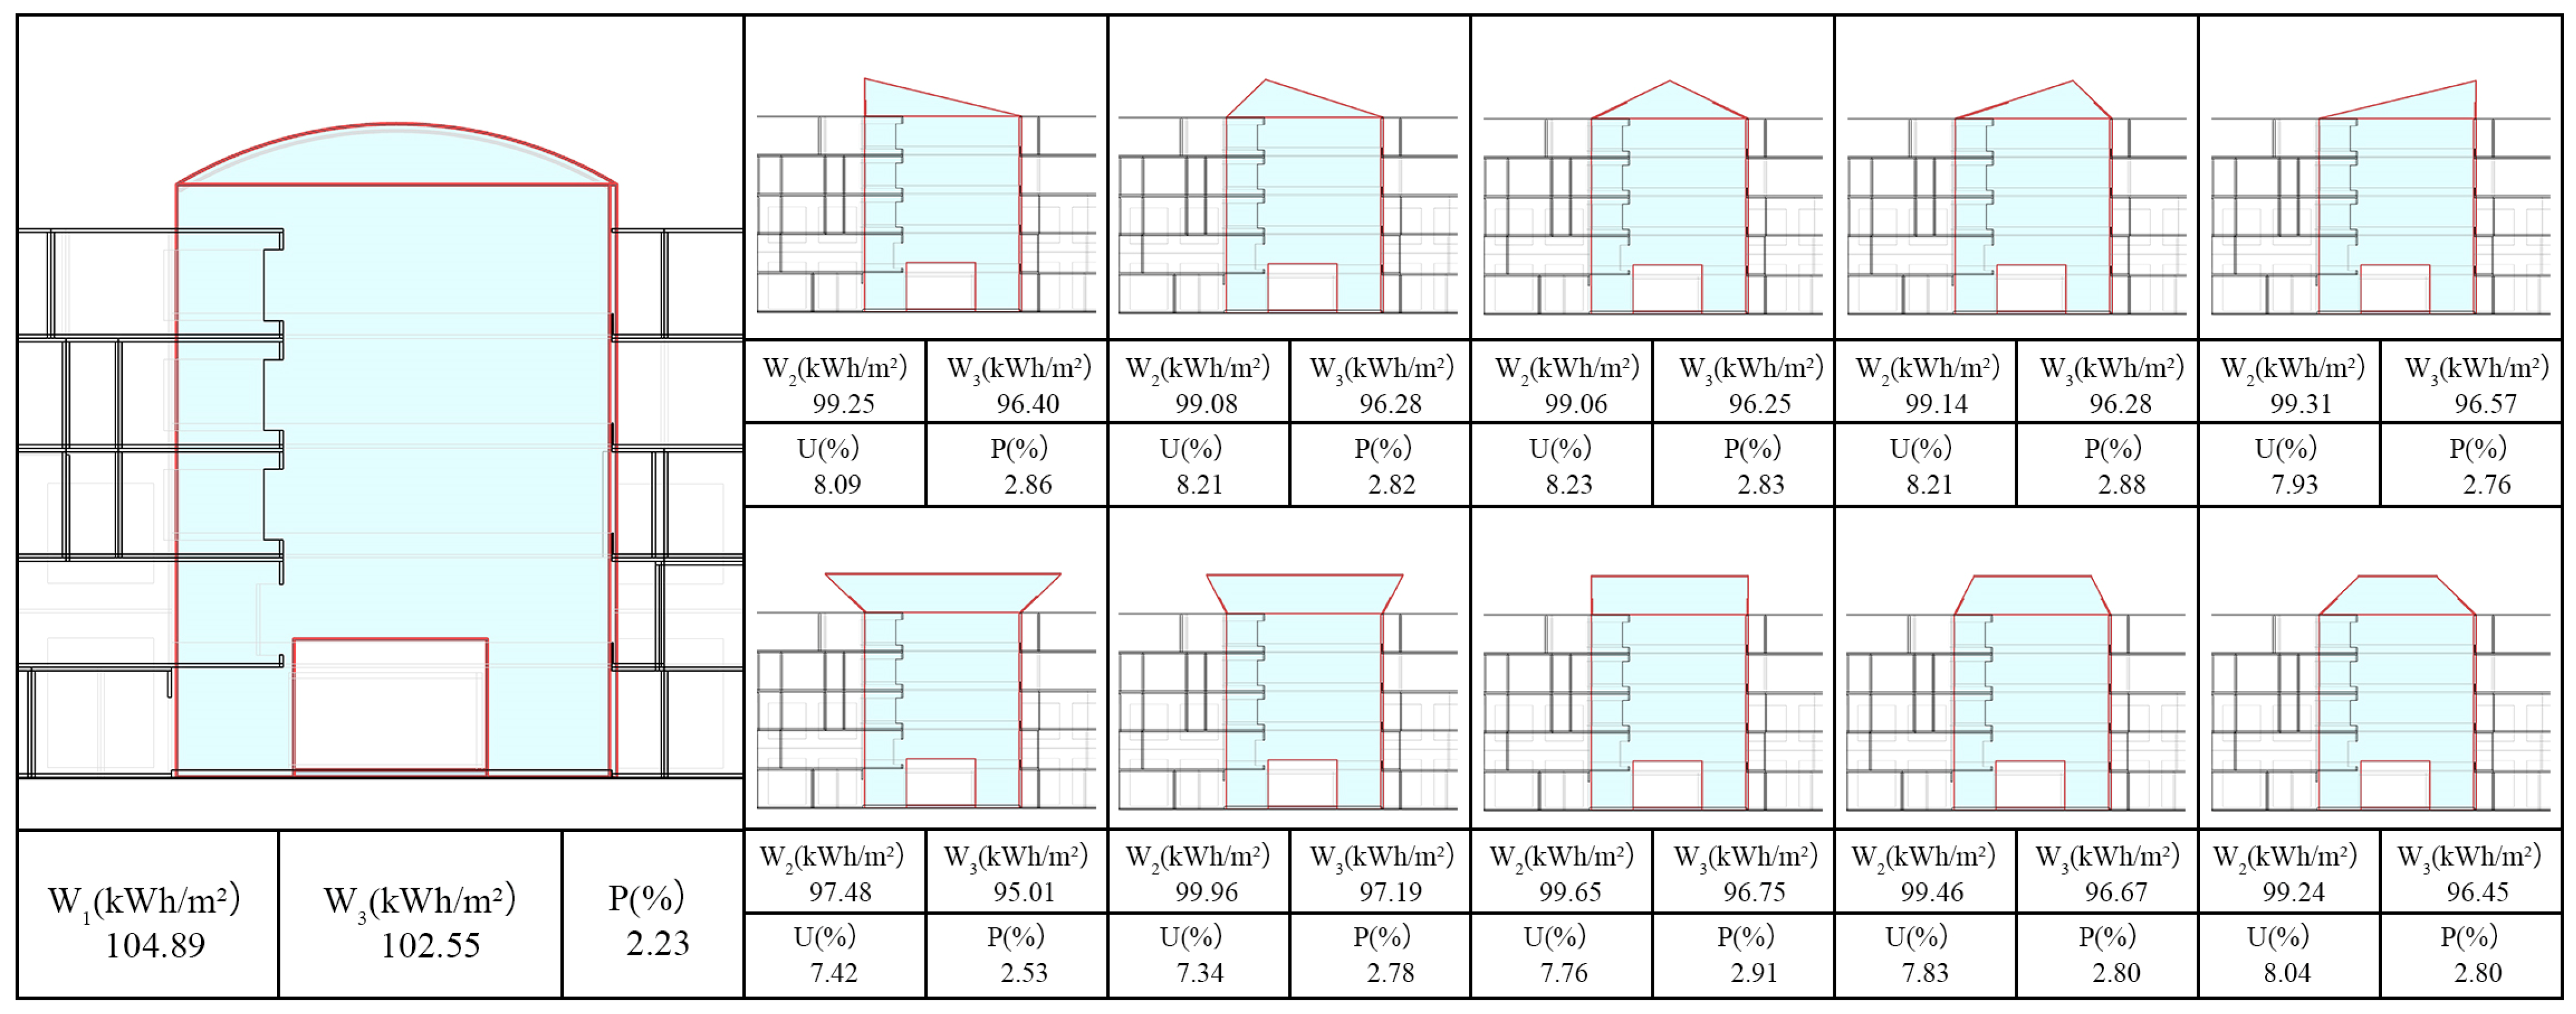
Combined with the classification of building forms, the aforementioned parameterized atrium models can be divided into convex and concave roof types for comparison. As presented in Figure 17, compared to the energy-saving effect of resilient ventilation in the actual commercial complex, the energy-saving effect of atrium roof reconstruction under the optimized form increased from 8.95% to 9.64%. The highest energy efficiency roof is a concave roof (9.64%), where parameter h is 2.23 m, d is 13.22 m, α is 0.75°, and k is 0.93. The highest convex roof possesses 9.33% energy efficiency, where parameter h is 6 m, d is 17.47 m, α is 2.45°, and k is 1.42.
Among the top 100 roof shapes, the concave roof accounted for 72%, and the energy efficiency ranged from 8.95% to 9.64%. The convex roof occupied 28%, and the energy efficiency ranged from 9.03% to 9.33%. According to the optimization results, the concave roof morphology should be prioritized in this study. Notably, the maximum energy-saving efficiency of the concave roofing is higher than that of the convex roofing. However, with a decrease in the middle point height of the concave roof, the energy efficiency of the concave roof was lower than that of the convex roof. This may indicate that although the building form of the convex roof increases the building body factor to some extent, a moderate focal height can enhance the airflow in the atrium and promote the improvement of resilient ventilation and thermal environment.

4.3.3. Comparison of Other Typical Forms

As presented in Figure 18, when comparing the energy-saving efficiency of the sloped roof and flat roof forms, it can be observed that the difference is not obvious, and the difference between the maximum and minimum values is only approximately 0.89%. The highest energy-saving efficiency was 8.23% for the sloped roof. The fluctuation range of the energy-saving efficiency of the sloped roof was better than that of the trapezoidal flat roof. This may be based on the ability of a change in the flat roof to affect the MRT results. This indicates that architects can choose the two forms more subjectively within the climate zone and renovation limits of this study. For example, a flat trapezoidal roof can provide a large area.
When comparing the simulation results of the same type of roof form, the extreme value of the energy-saving efficiency of the sloped roof was only 0.3%, while the extreme value of the energy-saving efficiency of the trapezoidal flat roof was 0.7%. Due to the small range of transformation after the limitation in this study, the middle point horizontal location exerts little influence on the energy-saving efficiency. Although increasing the roof area may capture more solar radiation and thus affect the results, a roof with a smaller body shape factor is still advantageous for improving energy efficiency.
By comparing the two types of typical roof shapes to the optimized results, it was observed that among all the forms involved in this study, the optimal form of energy-saving efficiency was still the optimized concave roof with an energy-saving efficiency difference of 1.41%. This may be due to the observation that the concave roof achieved relatively better results in terms of the balance between the CFD and MRT simulations.

5. Discussion

In this study, the Harbin Jin-an commercial complex was used as an example to discuss two aspects: the first is the passive energy-saving efficiency of buildings under resilient ventilation, and the second is the influence of the atrial roof shape on resilient ventilation and its relationship with the energy-saving efficiency. The results of the case study show that the proposed workflow obtained a more scientific and comprehensive scheme than the traditional shape design. This effectively supports the optimization and transformation of the atria of commercial complexes. However, in the face of practical problems, some reliability spaces require further consideration and improvement.
With the aid of a large data volume, the morphological parameters had different influences on the energy-saving efficiencies of different roof forms, and the influencing relationships could be predicted and tested using various data regression methods. This research process and procedure can be applied to studying the impact of natural ventilation on the energy consumption of various building types, particularly when exploring the influence of architectural form when adapting to the environment. The parametric model constructed in this study can generate numerous regular geometric roofing forms; however, the value range of the parameters is often unclear, and effective guidance cannot be directly obtained. This is because architects are required to conduct professional comparative analyses of different roof types in the computational design of buildings. For example, the values of the different roof types (convex roof and concave roof) parameters in the results of this study may have been completely opposite. Additionally, this study explored a passive energy-saving retrofitting method. Photovoltaic energy technology could be combined in future studies to obtain higher energy efficiency. By combining active and passive techniques, the optimal results for roof shape may change.
This study was conducted in Harbin (a city in a severely cold region of China), where the climate is cold and the winter is long. Therefore, energy-saving efficiency is greatly restricted by the climate zone’s conditions. This study proposes an energy-saving optimization design method based on climate adaptation. In future studies, relevant research and verification should be conducted in warm or hot and humid areas to further explore the relationships among spatial form, resilient ventilation, and energy-saving efficiency [67,68]. As a simulation platform for optimization with the help of an ANN training agent model and genetic algorithm optimization, the amount of computation remains a problem to be solved; according to different realities and design requirements, analyses of the relevant parameter constraints of the architect will be helpful in solving this problem. Additionally, the robustness of this method must be verified by changing the climate zones and surrounding environmental factors [69]. Although this study explored optimization design research among space forms, resilient ventilation, and energy-saving efficiency, different factors, such as light and building structural performance, were not studied [70,71]. In future research, the influence of different environmental factors or detailed designs, such as materials and construction forms, on building energy efficiency should be studied, and multi-objective optimization should be conducted to obtain a scheme that is closer to reality.

6. Conclusions

Passive energy-saving methods using resilient ventilation can effectively reduce the energy consumption of commercial complexes during the summer and seasonal change periods. Based on the simulation and optimization workflow proposed above, the following conclusions were drawn:
  • Combined with CFD and MRT dual-platform simulations, an air-conditioning schedule correction was performed to calculate energy consumption. According to the optimized results and resilient ventilation, the energy consumption could be reduced by 7.34–9.64%.
  • Although MRT and wind speed both affected the proportion of the atrial thermal comfort zone under resilient ventilation, the resilient ventilation influenced by the atrial roof shape exerted a significant effect on the proportion of the atrial thermal comfort zone.
  • The energy efficiency results of the roof forms proposed in this study and those of the original buildings demonstrate the effective influence of different roof forms on natural ventilation. The concave roof type was optimal. However, some free and variable curved roofs were not mentioned in this study because most atrial roofs of commercial complexes have regular geometric shapes. The relationship between the curved roof form and energy-saving efficiency can be further explored in the future.
  • Correlation analyses of parameters and energy-saving efficiency showed that the exposure to floor ratio (k) and roof angle (α) of the convex roof exerted a significant influence on the energy-saving efficiency. The exposure to the floor ratio (k) and middle-point height (h) of the concave roof exerted a significant impact on the energy-saving efficiency. In addition, for two different roof types (convex roof and concave roof) of the same parameter, the exposure to floor ratio (k), the value range differed. This indicates that the geometric shape parameters proposed in this study could effectively control the roof shape. The four geometric parameters proposed to control the shape of a roof in this study can provide a reference for future studies on different atrium layout patterns in commercial complexes to verify the applicability of the parameters.
In this study, machine learning was used to predict the energy-saving efficiency of roof forms (prediction accuracy exceeded 99%, with MSE ≤ 0.077). The surrogate model could quickly predict the specific energy-saving efficiency of different roof geometric forms and save considerable time and computing power costs for CFD and building energy consumption simulations. When combined with the GA, the optimal results could be effectively determined. The overall framework proposed in this study and the research method of comparing geometric roof forms by classification can provide methods and a theoretical basis for the renovation of other commercial complexes to improve comfort conditions and control energy consumption.

Author Contributions

Conceptualization, R.Z. and A.X.; methodology, R.Z. and A.X.; software, R.Z. and A.X.; validation, R.Z.,Y.D. and A.X.; formal analysis, A.X.; investigation, A.X.; resources, R.Z. and Y.D.; data curation, A.X. and J.Y.; writing—original draft preparation, A.X. and R.Z.; writing—review and editing, R.Z. and A.X.; visualization, R.Z. and A.X.; supervision, R.Z. and A.X.; project administration, Y.D.; funding acquisition, Y.D. All authors have read and agreed to the published version of the manuscript.

Funding

This research received no external funding.

Institutional Review Board Statement

Not applicable.

Informed Consent Statement

Not applicable.

Data Availability Statement

Not applicable.

Conflicts of Interest

The authors declare no conflict of interest.

References

  1. Tian, W.; Song, J.; Li, Z.; de Wilde, P. Bootstrap techniques for sensitivity analysis and model selection in building thermal performance analysis. Appl. Energy 2014, 135, 320–328. [Google Scholar] [CrossRef]
  2. Niemela, T.; Kosonen, R.; Jokisalo, J. Energy performance and environmental impact analysis of cost-optimal renovation solutions of large panel apartment buildingsin Finland. Sustain. Cities Soc. 2017, 32, 9–30. [Google Scholar] [CrossRef]
  3. Cao, X.; Dai, X.; Liu, J. Building energy-consumption status worldwide and the state-of-the-art technologies for zero-energy buildings during the past decade. Energy Build. 2016, 128, 198–213. [Google Scholar] [CrossRef]
  4. Economidou, M.; Todeschi, V.; Bertoldi, P.; D’Agostino, D.; Zangheri, P.; Castellazzi, L. Review of 50 years of EU energy efficiency policies for buildings. Energy Build. 2020, 225, 110322. [Google Scholar] [CrossRef]
  5. Li, D.H.; Yang, L.; Lam, J.C. Impact of climate change on energy use in the built environment in different climate zones—A review. Energy 2012, 42, 103–112. [Google Scholar] [CrossRef]
  6. Bertoldi, P.; Mosconi, R. Do energy efficiency policies save energy? A new approach based on energy policy indicators (in the EU Member States). Energy Policy 2020, 139, 111320. [Google Scholar] [CrossRef]
  7. Zhao, X.; Li, H.; Wu, L.; Qi, Y. Implementation of energy-saving policies in China: How local governments assisted industrial enterprises in achieving energy-saving targets. Energy Policy 2014, 66, 170–184. [Google Scholar] [CrossRef]
  8. Ferrara, M.; Monetti, V.; Fabrizio, E. Cost-Optimal Analysis for Nearly Zero Energy Buildings Design and Optimization: A Critical Review. Energies 2018, 11, 1478. [Google Scholar] [CrossRef]
  9. Bhandari, M.; Hun, D.; Shrestha, S.; Pallin, S.; Lapsa, M. A Simplified Methodology to Estimate Energy Savings in Commercial Buildings from Improvements in Airtightness. Energies 2018, 11, 3322. [Google Scholar] [CrossRef]
  10. Huang, H.; Chen, L.; Hu, E. A new model predictive control scheme for energy and cost savings in commercial buildings: An airport terminal building case study. Build. Environ. 2015, 89, 203–216. [Google Scholar] [CrossRef]
  11. Li, X.; Malkawi, A. Multi-objective optimization for thermal mass model predictive control in small and medium size commercial buildings under summer weather conditions. Energy 2016, 112, 1194–1206. [Google Scholar] [CrossRef]
  12. Prieto, A.; Knaack, U.; Auer, T.; Klein, T. Passive cooling & climate responsive facade design Exploring the limits of passive cooling strategies to improve the performance of commercial buildings in warm climates. Energy Build. 2018, 175, 30–47. [Google Scholar]
  13. Lu, P.; Li, J. Acceptable temperature steps for occupants moving between air-conditioned main space and naturally ventilated transitional space of building. Build. Environ. 2020, 182, 107150. [Google Scholar] [CrossRef]
  14. Aksamija, A. Regenerative design and adaptive reuse of existing commercial buildings for net-zero energy use. Sustain. Cities Soc. 2016, 27, 185–195. [Google Scholar] [CrossRef]
  15. Yue, N.; Li, L.; Morandi, A.; Zhao, Y. A metamodel-based multi-objective optimization method to balance thermal comfort and energy efficiency in a campus gymnasium. Energy Build. 2021, 253, 111513. [Google Scholar] [CrossRef]
  16. Shekar, V.; Krarti, M. Control strategies for dynamic insulation materials applied to commercial buildings. Energy Build. 2017, 154, 305–320. [Google Scholar] [CrossRef]
  17. Brunoro, S. Sustainable technologies in the refurbishment of existing building envelopes in Italy. In Proceedings of the International Conference on Sustainable Construction, Materials and Practices, Lisbon, Portugal, 11–13 June 2007; p. 257. [Google Scholar]
  18. Tavakolan, M.; Mostafazadeh, F.; Eirdmousa, S.J.; Safari, A.; Mirzaei, K. A parallel computing simulation-based multi-objective optimization framework for economic analysis of building energy retrofit: A case study in Iran. J. Build. Eng. 2022, 45, 103485. [Google Scholar] [CrossRef]
  19. Yan, H.; Ji, G.; Yan, K. Data-driven prediction and optimization of residential building performance in Singapore considering the impact of climate change. Build. Environ. 2022, 226, 109735. [Google Scholar] [CrossRef]
  20. Wang, S.; Yi, Y.K.; Liu, N. Multi-objective optimization (MOO) for high-rise residential buildings’ layout centered on daylight, visual, and outdoor thermal metrics in China. Build. Environ. 2021, 205, 108263. [Google Scholar] [CrossRef]
  21. de Wilde, P. Ten questions concerning building performance analysis. Build. Environ. 2019, 153, 110–117. [Google Scholar] [CrossRef]
  22. Pang, X.; Wetter, M.; Bhattacharya, P.; Haves, P. A framework for simulation-based real-time whole building performance assessment. Build. Environ. 2012, 54, 100–108. [Google Scholar] [CrossRef]
  23. Fan, Z.; Zhang, Y. Numerical Investigation of key design parameters impact on energy consumption of commercial complex distributed atrium in cold area of China. In Proceedings of the 3rd International Conference of Green Buildings and Environmental Management (GBEM), Electr Network, Qingdao, China, 5–7 June 2020; Volume 531, p. 2020. [Google Scholar]
  24. Negendahl, K.; Nielsen, T.R. Building energy optimization in the early design stages: A simplified method. Energy Build. 2015, 105, 88–99. [Google Scholar] [CrossRef]
  25. Yu, J.; Tian, L.; Xu, X.; Wang, J. Evaluation on energy and thermal performance for office building envelope in different climate zones of China. Energy Build. 2015, 86, 626–639. [Google Scholar] [CrossRef]
  26. Zhang, L.; Qin, Y. Case study and countermeasures on commercial building energy saving renovation. In Proceedings of the International Conference on Manufacture Engineering and Environment Engineering (MEEE), Hong Kong, China; 2014; Volume 84, pp. 879–884. [Google Scholar]
  27. Brown, N.C.; Mueller, C.T. Design for structural and energy performance of long span buildings using geometric multi-objective optimization. Energy Build. 2016, 127, 748–761. [Google Scholar] [CrossRef]
  28. Hong, T.; Luo, X. Modeling Building Energy Performance IN Urban Context. In Proceedings of the Building Performance Analysis Conference and SimBuild, Chicago, LA, USA, 26–28 September 2018; pp. 100–106. [Google Scholar]
  29. Amasyali, K.; El-Gohary, N. Machine learning for occupant-behavior-sensitive cooling energy consumption prediction in office buildings. Renew. Sustain. Energy Rev. 2021, 142, 110714. [Google Scholar] [CrossRef]
  30. Corbin, C.D.; Henze, G.P.; May-Ostendorp, P. A model predictive control optimization environment for real-time commercial building application. J. Build. Perform. Simul. 2013, 6, 159–174. [Google Scholar] [CrossRef]
  31. Sangireddy, S.A.R.; Bhatia, A.; Garg, V. Development of a surrogate model by extracting top characteristic feature vectors for building energy prediction. J. Build. Eng. 2019, 23, 38–52. [Google Scholar] [CrossRef]
  32. Aghamolaei, R.; Fallahpour, M.; Mirzaei, P.A. Tempo-spatial thermal comfort analysis of urban heat island with coupling of CFD and building energy simulation. Energy Build. 2021, 251, 111317. [Google Scholar] [CrossRef]
  33. Guo, W.; Liang, S.; He, Y.; Li, W.; Xiong, B.; Wen, H. Combining EnergyPlus and CFD to predict and optimize the passive ventilation mode of medium-sized gymnasium in subtropical regions. Build. Environ. 2022, 207, 108420. [Google Scholar] [CrossRef]
  34. Pan, Y.; Zhang, L. Roles of artificial intelligence in construction engineering and management: A critical review and future trends. Autom. Constr. 2021, 122, 103517. [Google Scholar] [CrossRef]
  35. Akinosho, T.D.; Oyedele, L.O.; Bilal, M.; Ajayi, A.O.; Delgado, M.D.; Akinade, O.O.; Ahmed, A.A. Deep learning in the construction industry: A review of present status and future innovations. J. Build. Eng. 2020, 32, 101827. [Google Scholar] [CrossRef]
  36. Khallaf, R.; Khallaf, M. Classification and analysis of deep learning applications in construction: A systematic literature review. Autom. Constr. 2021, 129, 103760. [Google Scholar] [CrossRef]
  37. Olu-Ajayi, R.; Alaka, H.; Sulaimon, I.; Sunmola, F.; Ajayi, S. Building energy consumption prediction for residential buildings using deep learning and other machine learning techniques. J. Build. Eng. 2022, 45, 103406. [Google Scholar] [CrossRef]
  38. Zhang, R.; Liu, D.; Shi, L. Thermal-comfort optimization design method for semi-outdoor stadium using machine learning. Build. Environ. 2022, 215, 108890. [Google Scholar] [CrossRef]
  39. Longo, S.; Montana, F.; Sanseverino, E.R. A review on optimization and cost-optimal methodologies in low-energy buildings design and environmental considerations. Sustain. Cities Soc. 2019, 45, 87–104. [Google Scholar] [CrossRef]
  40. Malatji, E.M.; Zhang, J.; Xia, X. A multiple objective optimisation model for building energy efficiency investment decision. Energy Build. 2013, 61, 81–87. [Google Scholar] [CrossRef]
  41. Lu, Y.; Gong, X.; Kipnis, A.B. Prediction of Low-Energy Building Energy Consumption Based on Genetic BP Algorithm. Comput. Mater. Contin. 2022, 72, 5481–5497. [Google Scholar] [CrossRef]
  42. Ilbeigi, M.; Ghomeishi, M.; Dehghanbanadaki, A. Prediction and optimization of energy consumption in an office building using artificial neural network and a genetic algorithm. Sustain. Cities Soc. 2020, 61, 102325. [Google Scholar] [CrossRef]
  43. Zhang, L.; Wang, L. Optimization of site investigation program for reliability assessment of undrained slope using Spearman rank correlation coefficient. Comput. Geotech. 2023, 155, 105208. [Google Scholar] [CrossRef]
  44. Hajdukiewicz, M.; Geron, M.; Keane, M.M. Formal calibration methodology for CFD models of naturally ventilated indoor environments. Build. Environ. 2013, 59, 290–302. [Google Scholar] [CrossRef]
  45. Zhu, Y.; Fukuda, T.; Yabuki, N. Integrating Animated Computational Fluid Dynamics into Mixed Reality for Building-Renovation Design. Technologies 2020, 8, 4. [Google Scholar] [CrossRef]
  46. Yi, Y.K.; Feng, N. Dynamic integration between building energy simulation (BES) and computational fluid dynamics (CFD) simulation for building exterior surface. Build. Simul. 2013, 6, 297–308. [Google Scholar] [CrossRef]
  47. Heidarinejad, M.; Gracik, S.; Roudsari, M.S.; Nikkho, S.K.; Liu, J.; Liu, K.; Pitchorov, G.; Srebric, J. Influence of building surface solar irradiance on environmental temperatures in urban neighborhoods. Sustain. Cities Soc. 2016, 26, 186–202. [Google Scholar] [CrossRef]
  48. Zhang, X.; Weerasuriya, A.U.; Tse, K.T. CFD simulation of natural ventilation of a generic building in various incident wind directions: Comparison of turbulence modelling, evaluation methods, and ventilation mechanisms. Energy Build. 2020, 229, 110516. [Google Scholar] [CrossRef]
  49. Sosnowski, P.; Petronio, A.; Armenio, V. Numerical model for thin liquid film with evaporation and condensation on solid surfaces in systems with conjugated heat transfer. Int. J. Heat Mass Transf. 2013, 66, 382–395. [Google Scholar] [CrossRef]
  50. Guo, H.; Aviv, D.; Loyola, M.; Teitelbaum, E.; Houchois, N.; Meggers, F. On the understanding of the mean radiant temperature within both the indoor and outdoor environment, a critical review. Renew. Sustain. Energy Rev. 2020, 117, 109207. [Google Scholar] [CrossRef]
  51. Alfano, F.R.D.; Dell’isola, M.; Palella, B.I.; Riccio, G.; Russi, A. On the measurement of the mean radiant temperature and its influence on the indoor thermal environment assessment. Build. Environ. 2013, 63, 79–88. [Google Scholar] [CrossRef]
  52. Attia, S.; Gratia, E.; De Herde, A.; Hensen, J.L. Simulation-based decision support tool for early stages of zero-energy building design. Energy Build. 2012, 49, 2–15. [Google Scholar] [CrossRef]
  53. Crawley, D.B.; Lawrie, L.K.; Winkelmann, F.C.; Buhl, W.; Huang, Y.; Pedersen, C.O.; Strand, R.K.; Liesen, R.J.; Fisher, D.E.; Witte, M.J.; et al. EnergyPlus: Creating a new-generation building energy simulation program. Energy Build. 2001, 33, 319–331. [Google Scholar] [CrossRef]
  54. Neto, A.H.; Fiorelli, F.A.S. Comparison between detailed model simulation and artificial neural network for forecasting building energy consumption. Energy Build. 2008, 40, 2169–2176. [Google Scholar] [CrossRef]
  55. Hou, W.; Li, R.M.; Sittihai, T. Management Optimization of Electricity System with Sustainability Enhancement. Sustainability 2022, 14, 6650. [Google Scholar] [CrossRef]
  56. Wu, Z.; Shi, X.; Fang, F.; Wen, G.; Mi, Y. Co-optimization of building energy systems with renewable generations combining active and passive energy-saving. Appl. Energy 2023, 351, 121514. [Google Scholar] [CrossRef]
  57. Xu, B.; Xie, X.; Pei, G. New method of equivalent energy consumption for evaluating thermal performance of energy-saving materials in passive buildings. Appl. Therm. Eng. 2023, 230, 120774. [Google Scholar] [CrossRef]
  58. Alanani, M.; Elshaer, A. ANN-based optimization framework for the design of wind load resisting system of tall buildings. Eng. Struct. 2023, 285, 116032. [Google Scholar] [CrossRef]
  59. Chegari, B.; Tabaa, M.; Simeu, E.; Moutaouakkil, F.; Medromi, H. Multi-objective optimization of building energy performance and indoor thermal comfort by combining artificial neural networks and metaheuristic algorithms. Energy Build. 2021, 239, 110839. [Google Scholar] [CrossRef]
  60. Ekici, B.B.; Aksoy, U.T. Prediction of building energy consumption by using artificial neural networks. Adv. Eng. Softw. 2009, 40, 356–362. [Google Scholar] [CrossRef]
  61. Chang, C.; Zhao, J.; Zhu, N. Energy saving effect prediction and post evaluation of air-conditioning system in public buildings. Energy Build. 2011, 43, 3243–3249. [Google Scholar] [CrossRef]
  62. Mba, L.; Meukam, P.; Kemajou, A. Application of artificial neural network for predicting hourly indoor air temperature and relative humidity in modern building in humid region. Energy Build. 2016, 121, 32–42. [Google Scholar] [CrossRef]
  63. Behboudi, N.; Butt, F.; Abhari, A. Automatic Building Design with Genetic Algorithms, and Artificial Neural Networks (WIP). In Proceedings of the Symposium on Simulation for Architecture and Urban Design (SimAUD 2012), Orlando, FL, USA, 26–30 March 2012; Volume 44, pp. 40–43. [Google Scholar]
  64. Aruta, G.; Ascione, F.; Bianco, N.; Mauro, G.M.; Vanoli, G.P. Optimizing heating operation via GA- and ANN-based model predictive control: Concept for a real nearly-zero energy building. Energy Build. 2023, 292, 113139. [Google Scholar] [CrossRef]
  65. Shi, Y.; Lin, Y.; Li, B.; Li, R.Y.M. A bi-objective optimization model for the medical supplies’ simultaneous pickup and delivery with drones. Comput. Ind. Eng. 2022, 171, 108389. [Google Scholar] [CrossRef]
  66. Gu, Z.; Lu, W.; Fan, Y.; Gao, Y. Automated simplified structural modeling method for megatall buildings based on genetic algorithm. J. Build. Eng. 2023, 77, 107485. [Google Scholar] [CrossRef]
  67. Nadiri, P.; Mahdavinejad, M.; Pilechiha, P. Optimization of Building Façade to Control Daylight Excessiveness and View to Outside. J. Appl. Eng. Sci. 2019, 9, 161–168. [Google Scholar] [CrossRef]
  68. Rosso, F.; Ciancio, V.; Dell’Olmo, J.; Salata, F. Multi-objective optimization of building retrofit in the Mediterranean climate by means of genetic algorithm application. Energy Build. 2020, 216, 109945. [Google Scholar] [CrossRef]
  69. Rutten, D. Galapagos: On the Logic and Limitations of Generic Solvers. Arch. Des. 2013, 83, 132–135. [Google Scholar] [CrossRef]
  70. Zhang, L.; Zhang, L.; Wang, Y. Shape optimization of free-form buildings based on solar radiation gain and space efficiency using a multi-objective genetic algorithm in the severe cold zones of China. Sol. Energy 2016, 132, 38–50. [Google Scholar] [CrossRef]
  71. Calcerano, F.; Martinelli, L. Numerical optimisation through dynamic simulation of the position of trees around a stand-alone building to reduce cooling energy consumption. Energy Build. 2016, 112, 234–243. [Google Scholar] [CrossRef]
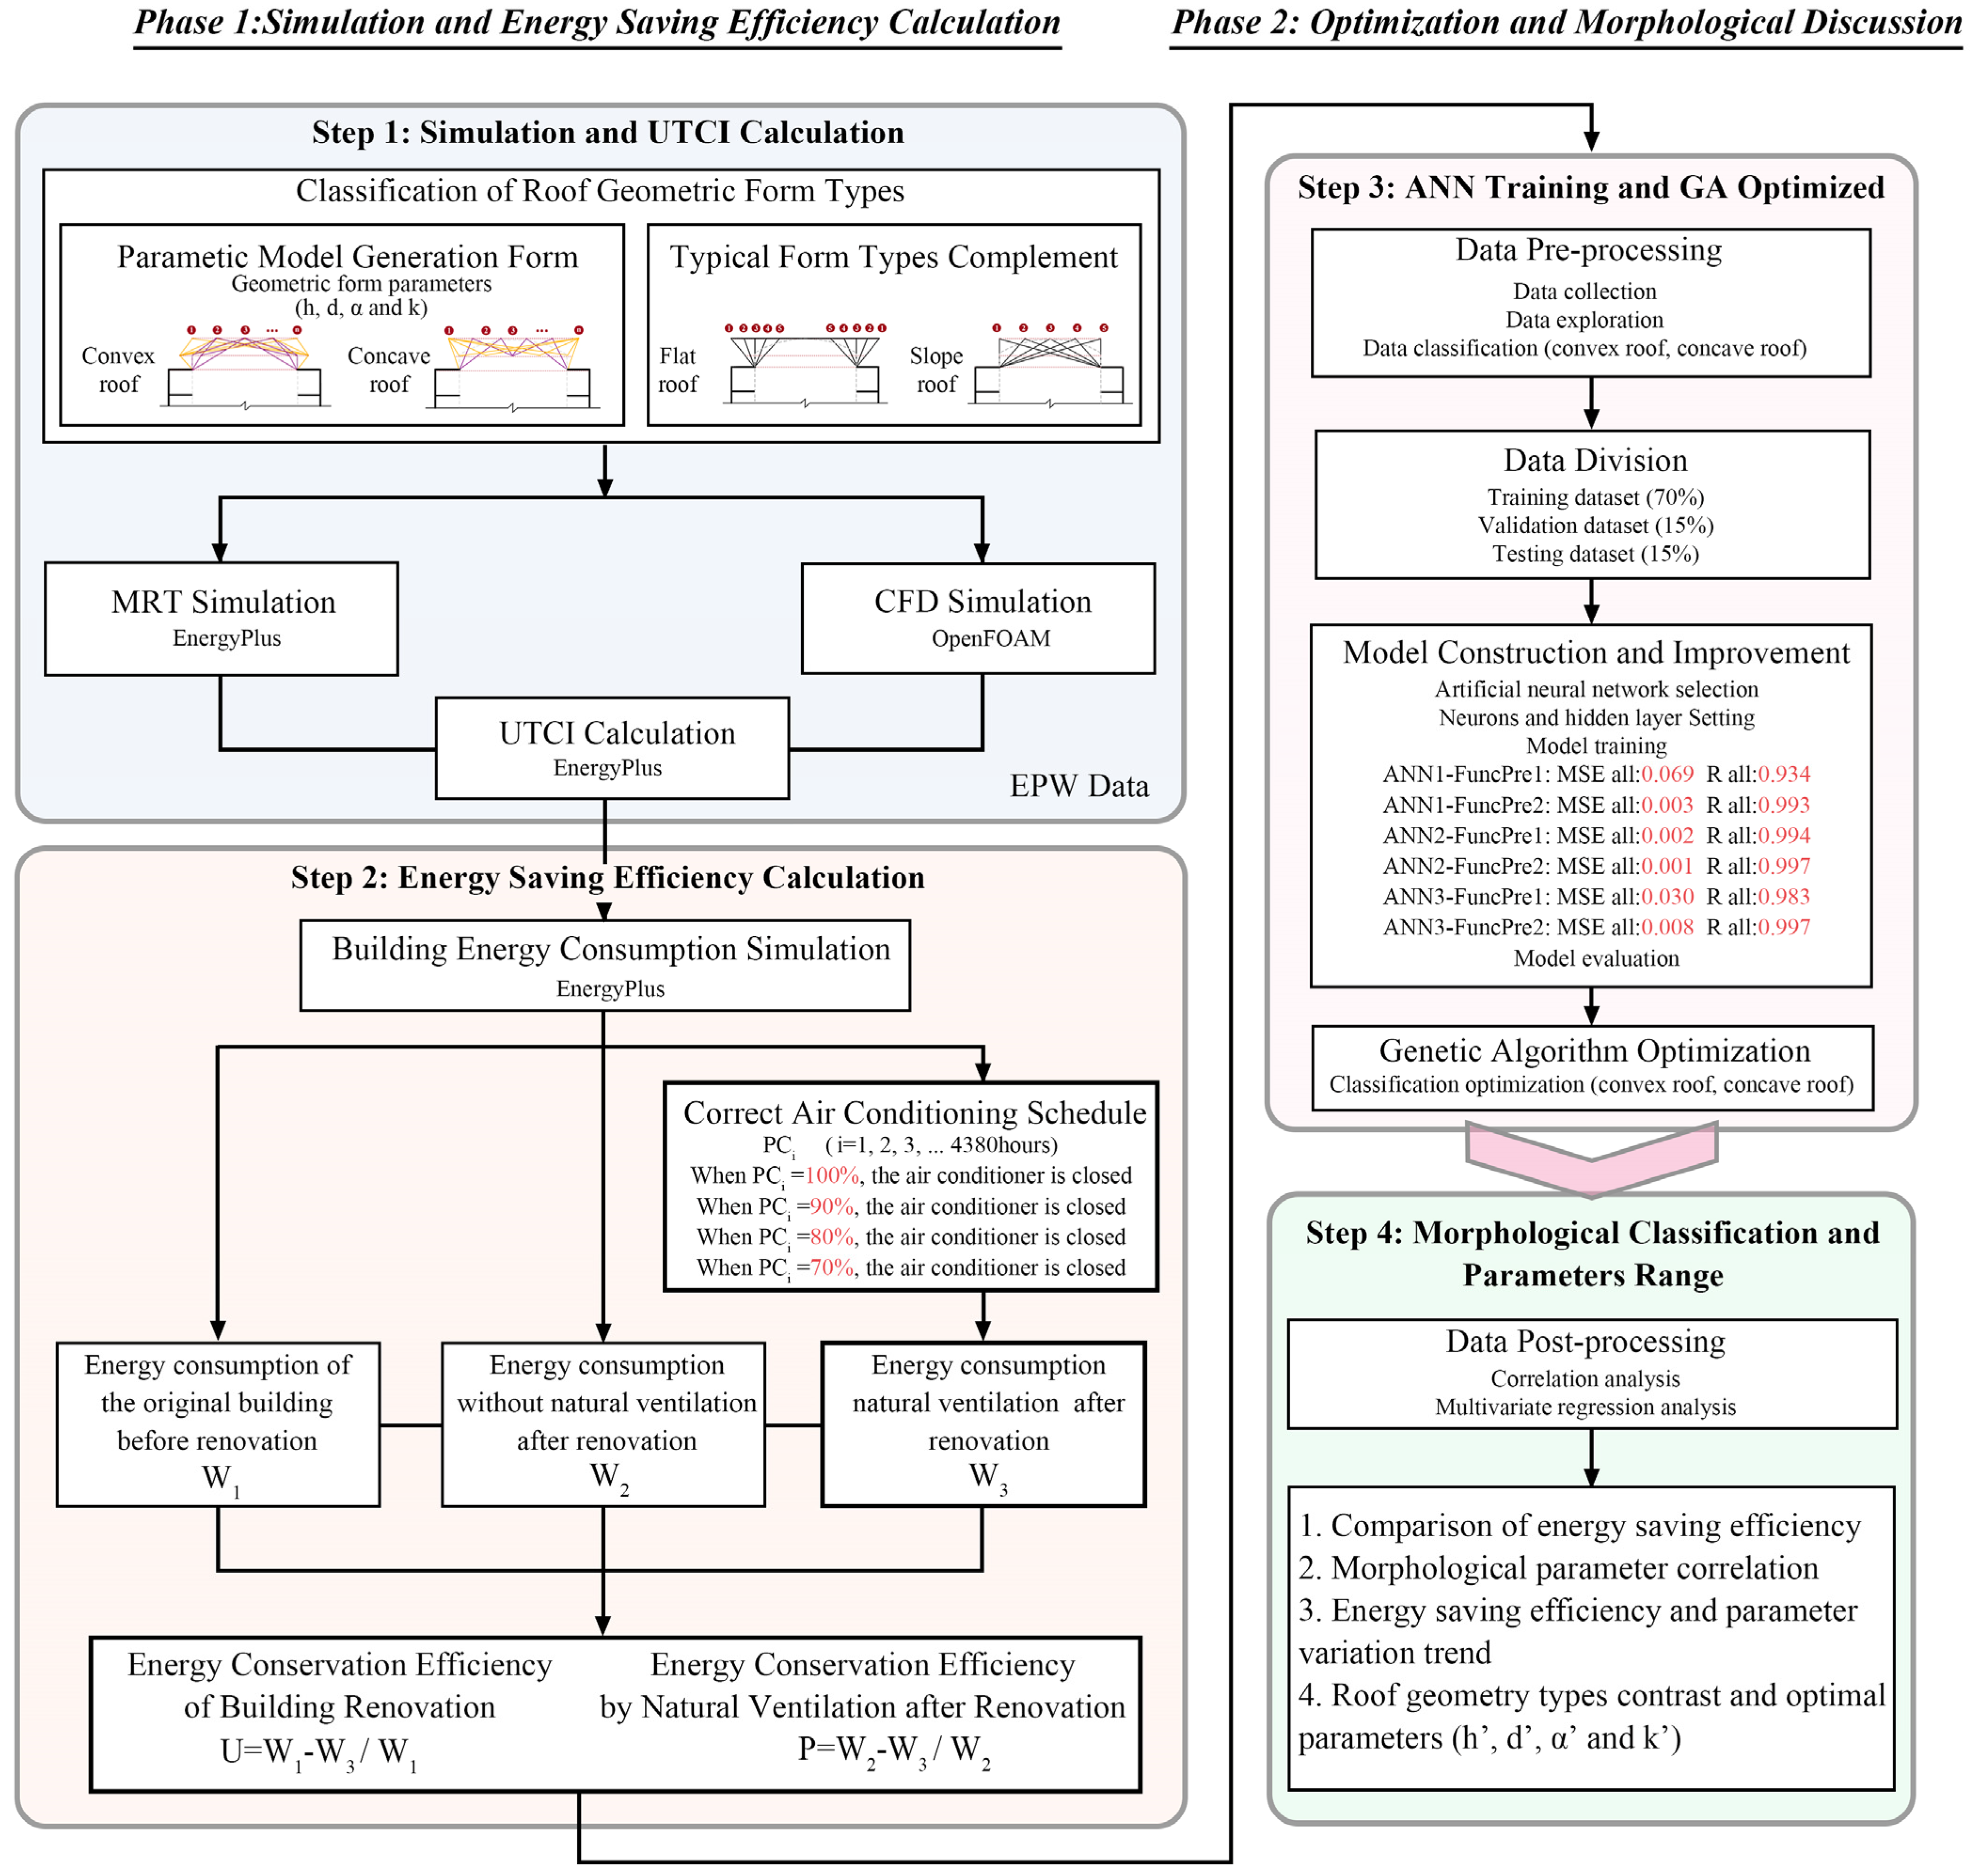
Figure 1. Flowchart of the entire simulation and optimization procedure.
Smartcities 06 00108 g001
Figure 2. (a,b) Basic information for the case study (commercial complex).
Smartcities 06 00108 g002
Figure 3. (a,b) Parameter limitations and classifications of roof geometric forms.
Smartcities 06 00108 g003
Figure 4. (a,b) Correlation analysis of parameters.
Smartcities 06 00108 g004
Figure 5. Parameters of the test mesh used in the simulation.
Smartcities 06 00108 g005
Figure 6. Correction of measured data and simulation.
Smartcities 06 00108 g006
Figure 7. Predictive accuracy of energy conservation efficiency of 2 different types of roofs.
Smartcities 06 00108 g007
Figure 8. Genetic algorithm optimization process.
Smartcities 06 00108 g008
Figure 9. (a,b) Cloud charts of the CFD simulation. (The red wireframe marks the case site).
Smartcities 06 00108 g009
Figure 10. Five different thermal comfort percentage cloud charts.
Smartcities 06 00108 g010
Figure 11. (a,b) Comparison of energy consumption in different areas of the original building using intelligent control natural ventilation system and non-application.
Smartcities 06 00108 g011
Figure 12. (ae) Annual energy balance chart and air conditioning correction energy balance chart.
Smartcities 06 00108 g012
Figure 13. (a,b) Correlation analysis between parameters and energy-saving efficiency.
Smartcities 06 00108 g013
Figure 14. (a,b) Fitting analysis chart of effective parameters and energy-saving efficiency.
Smartcities 06 00108 g014
Figure 15. (a,b) Multiple parameter regression fitting chart.
Smartcities 06 00108 g015
Figure 16. (a,b) Parameter optimization range chart (convex roof and concave roof).
Smartcities 06 00108 g016
Figure 17. Top 100 roof morphologies in regard to energy-saving efficiency optimization.
Smartcities 06 00108 g017
Figure 18. Simulation results of typical roof morphology (slope roof and flat roof).
Smartcities 06 00108 g018
Table 1. Environment basic information of the case study.
UnitsDetailed Information
Locationdegrees (°) and first (‘)45°72′ N 126°68′ E
Dry Bulb TemperatureDegree centigrade (°C)−29.9–33.1
Wind SpeedMeter per second (m/s)0–17
Direct Normal RadiationKilowatt-hours per square meter (kWh/m2)0–983
Diffuse Horizontal RadiationKilowatt-hours per square meter (kWh/m2)0–608
Global Horizontal RadiationKilowatt-hours per square meter (kWh/m2)0–98,800
Diffuse Normal IlluminanceLux(lx)0–69,200
Table 2. Parameter selection and range.
ParameterUnitConvex RoofConcave Roof
Middle point height (h)Meter (m)6 m1.8–5.4 m
Middle point horizontal location (d)Meter (m)7.2–16.8 m7.2–16.8 m
Roof angle (α)Degrees (°)−5°–5°−5°–5°
Exposure to floor ratio (k)-0.5–1.50.5–1.5
Table 3. Building materials’ radiative properties and roughness coefficients in the simulation.
PartMaterial ε DEF
WallConcrete0.9510.794.1920.0
Steel structureSteel0.48.234.0–0.057
AtriumGlass0.8210.553.10.0
GroundAsphalt0.9211.585.8940.0
Table 4. Predictive accuracy performance of 6 surrogate ANN models.
MSE ALLMSE TrainingMSE ValidationMSE TestR ALLR TrainingR ValidationR Test
ANN1-FuncPre10.0030.0040.0030.0330.9930.9970.9980.971
ANN1-FuncPre20.0000.0000.0010.0000.9960.9970.9950.996
Five neurons in one hidden layer
ANN2-FuncPre10.0010.0010.0010.0010.9970.9970.9980.997
ANN2-FuncPre20.0010.0020.0010.0020.9960.9960.9980.994
Fifteen neurons in one hidden layer
ANN3-FuncPre10.0080.0080.0080.0070.9950.9940.9940.995
ANN3-FuncPre20.0060.0050.0050.0060.9940.9950.9920.991
Ten neurons for each of the three hidden layers
Disclaimer/Publisher’s Note: The statements, opinions and data contained in all publications are solely those of the individual author(s) and contributor(s) and not of MDPI and/or the editor(s). MDPI and/or the editor(s) disclaim responsibility for any injury to people or property resulting from any ideas, methods, instructions or products referred to in the content.