Article

Designing Geographic Information System Based Property Tax Assessment in India

1
Centre for Climate Change & Water Research, Suresh Gyan Vihar University, Jaipur 302017, Rajasthan, India
2
Centre for Sustainable Development, Suresh Gyan Vihar University, Jaipur 302017, Rajasthan, India
3
Department of Ecology, Environment and Remote Sensing, Government of Jammu and Kashmir, Srinagar 190018, Kashmir, India
4
Faculty of Geotechnical Engineering, University of Zagreb, Hallerova aleja 7, 42000 Varaždin, Croatia
5
Department of Civil Engineering, University North, 42000 Varaždin, Croatia
*
Authors to whom correspondence should be addressed.
Smart Cities 2022, 5(1), 364-381; https://doi.org/10.3390/smartcities5010021
Submission received: 15 February 2022 / Revised: 9 March 2022 / Accepted: 14 March 2022 / Published: 16 March 2022
(This article belongs to the Special Issue Economy and Finance in Smart-Cities)

Abstract

:
Property tax is the primary source of revenue for municipal bodies. In India, municipal corporations are facing issues in property tax collection, and the primary reason for it is a lack of count of assessed properties under its jurisdiction. Also, the storage of information on the properties is mainly based on manual efforts, which leads to data redundancy and failure to appropriate tax collection. Geographical Information Systems (GIS) consists of technology, personnel, and resources to create, maintain, visualize, search, and share geospatial data and services. The study has been carried out in the Hauz Khas Ward, South Delhi Municipal Corporation, Delhi. This paper aims to develop a spatial database for property tax management. It includes capturing the building footprint, road, land use such as parks, paved area, drains, and demarcation of boundaries such as locality slums, based on a regular grid net with a cell size of 250 m by 250 m. The generated geospatial database has been finally used to evaluate parameters for property tax calculation. Moreover, this spatial database can be organized as different models for any web-based application for municipal services. This study provides a working example of a GIS-based property tax collection solution for whole of India and other South-Asian countries.

1. Introduction

Worldwide more than 130 countries collect taxes on the properties, and almost all countries consider it the prime source of revenue for the local governments to administrate effectively [1,2]. Moreover, developing countries rely on it more than developed ones and acknowledge the importance of so-called local tax [3,4]. Even in most of the developing countries, the local governments rely on property-related revenues to service out other essential services such as education and health [5]. Now that the global community has acknowledged the significance of taxation as a ‘state-building’ process, the practical consequences of implementing a strategy to tax reform require clarification and efficient procedure to implement.
Property tax is a levy on property that the owner is required to pay to the governing authority of the area where the property exists. For any development, property tax is one of the major sources of income state or country to cover the expenditure of development [6]. The local or municipal authorities are bound for the development of their administration, and without capital, it can become a challenge for them. Besides, taxation can be used as an urban management tool that can track land use, urban expansion, land market, and transactions related to properties [7]. As a matter of fact, for property taxation, location is foremost as it matters to unit value for tax calculation. The location as a spatial attribute of property is crucial for the analysis or estimation of many aspects related to property or urban management.
India also has the same scenarios of revenue collections related to property. At present, there are about 3842 urban local bodies (ULBs) in India, wherein 2108 are Nagar Panchayats, 1595 are Municipalities, and 139 are Municipal Corporations. Mainly there are three sources from where ULBs generate their revenue, i.e., revenue shared taxes, exclusive taxes, and nontax revenues. The exclusive taxes include property, entertainment vacant land, advertisement, and professional taxes. While the property tax is the most important tax levied among all the taxes at the local scale. For any local or municipal body, property tax reflects the relation between the types of services financed at the local level vs. the benefit to property values. Hence, it is considered a good tax. In India, the state government is responsible for designing the property tax system, and the ULBs control the tax rate and collection planning.
In India, many studies have been carried out to lay down the taxation system of the properties. A study carried out by the National Institute of Urban Affairs (NIUA) in 10 Indian cities shows that the trend has shifted from the annual rental value-based system to an area-based system in many cities [8]. The area-based taxation is based on factors such as location, usage, type of construction, and age of the building. Many corporations have introduced the self-assessment scheme, and a few, like in Bangalore, have introduced online tax payment. As mentioned earlier, the success of reforms has been uneven. While the revenue productivity in Bangalore has shown a sharp increase, the revenues have continued to be stagnant in many other metros, including Delhi [9].
Noncompliance with property taxes is common in south Asian countries, and it can worsen their liquidity problems [7]. Revenue elasticities and metrics of taxpayer hardship are used to characterize optimal enforcement and taxing regimes [5]. These characteristics are calculated utilizing a variety of sources of variance as well as administrative data. Rate hikes and increased enforcement generate revenue, but liquidity restrictions also influence taxpayer behavior [4]. Despite liquidity restrictions, increasing tax rates improve wellbeing. On the other hand, enforcement has larger private expenses than welfare benefits. Mostly on margin, welfare-maximizing authorities would instead raise tax rates than strengthen enforcement [3]. Therefore an efficient system is required for assisting the collection and management of the property taxes.
Property tax can be a significant source of revenue, but practically it fails to collect expected revenue efficiently. In Delhi, the method of tax calculation is unit based for which many factors are required, such as property address, colony name, colony category, no. of floors, covered area, vacant land area, type of property (residential/commercial), type of occupancy (owner/tenant), type of structure (kaccha, pacca, semi pucca), year of construction and owner type (single/joint). A door-to-door ground survey is essential to complete this database. Proper assessment of properties and efficient tax collection are vital for the ULBs. The current infrastructure has insufficient information to ease the process of tax status verification. For tax inspectors, it is imperative to identify the defaulters who are not paying appropriate tax in terms of its factors or not paying at all. The good thing about property taxation is that the primary object, i.e., property, is immoveable. But again, if you don’t know its location, you can’t manage it. Therefore, many municipal bodies are planning to adopt GIS-based property tax systems to boost their revenues. GIS is a modern system of tools for effective and efficient storage, retrieval, and manipulation of spatial and non-spatial data for attaining efficient management and policy-making information [10]. GIS can provide a system for inputting spatial data and intelligence for planning and monitoring project implementation [11].
GIS is used to locate assets, track information, and save an organization time and resources. Multiple analyses can be done on a database that can be readily displayed on any GIS-based platform with various color-coded parameters that the corporation’s officials can easily interpret. One can quickly identify the number of households who want to know the defaulters in their assigned area. It provides a visual result in a hard copy or digital map about where those properties are located. Moreover, it was challenging to identify the impact of location on land value as determining accurate location was very challenging [12]. Nowadays, using GIS, to analyze spatial attributes of any number of entities is relatively easy [13,14,15,16]. Also, GIS mapping is of great significance in scientific research, planning, and management [17]. GIS technologies can handle large volumes of data from multiple sources, integrating them to produce information in a spatial context through maps and models [18]. Applying GIS-based municipal information tools can lead to the solution of these data management problems. Thus, GIS can be a handy tool for municipal planning and decision-making that evaluates and assesses assets. Not just worldwide but also in India, many local and municipal governments use GIS as a decision-making tool to design and support development programs [19].
This study is a pilot study to be carried out for the whole of India initially with the four major metropolitans, Delhi, Mumbai, Kolkatta, and Chennai. The present study is the representative study of one of the wards of South Delhi, i.e., Hauz Khas. The agency responsible for levying the tax on properties in South Delhi is South Delhi Municipal Corporation (SDMC). The present work aimed to create a geospatial database of all the properties present in Hauz Khas to take them under the tax net of SDMC. In Delhi, the property tax calculation is based on the unit area method. Since 2004, the collection of property tax has been moved to the self-assessment method. Since then, the number of assessed properties has decreased [20]. Also, because it is a self-assessment basis, SDMC has information for those properties that have filed the property tax. The properties which have never paid the tax have not come under the notice of SDMC. Therefore there is an ever-increasing need for digital spatial data to be more feasible and reliable for this decision-making system [21,22,23,24,25].
The paper demonstrates the need as well as how a successful spatial database consisting of multiple layers in GIS environment is created to provide a solution through ground reflective analyses and could be easily accessed through an intranet or internet application [26,27,28]. This work is also designed as an enterprise GIS for municipalities all over India that can customize attributes and geospatial data with spatial and non-spatial models and operations to create a service-oriented architecture from Geo web services [29,30,31,32]. The study also demonstrates how planned spatial data (attribute and non-attribute) such as building footprint, roads, drains, parks, location boundaries are digitized for the jurisdiction of Hauzkhas Ward, South Delhi Municipal Corporation, in the GIS environment.

2. Materials and Methods
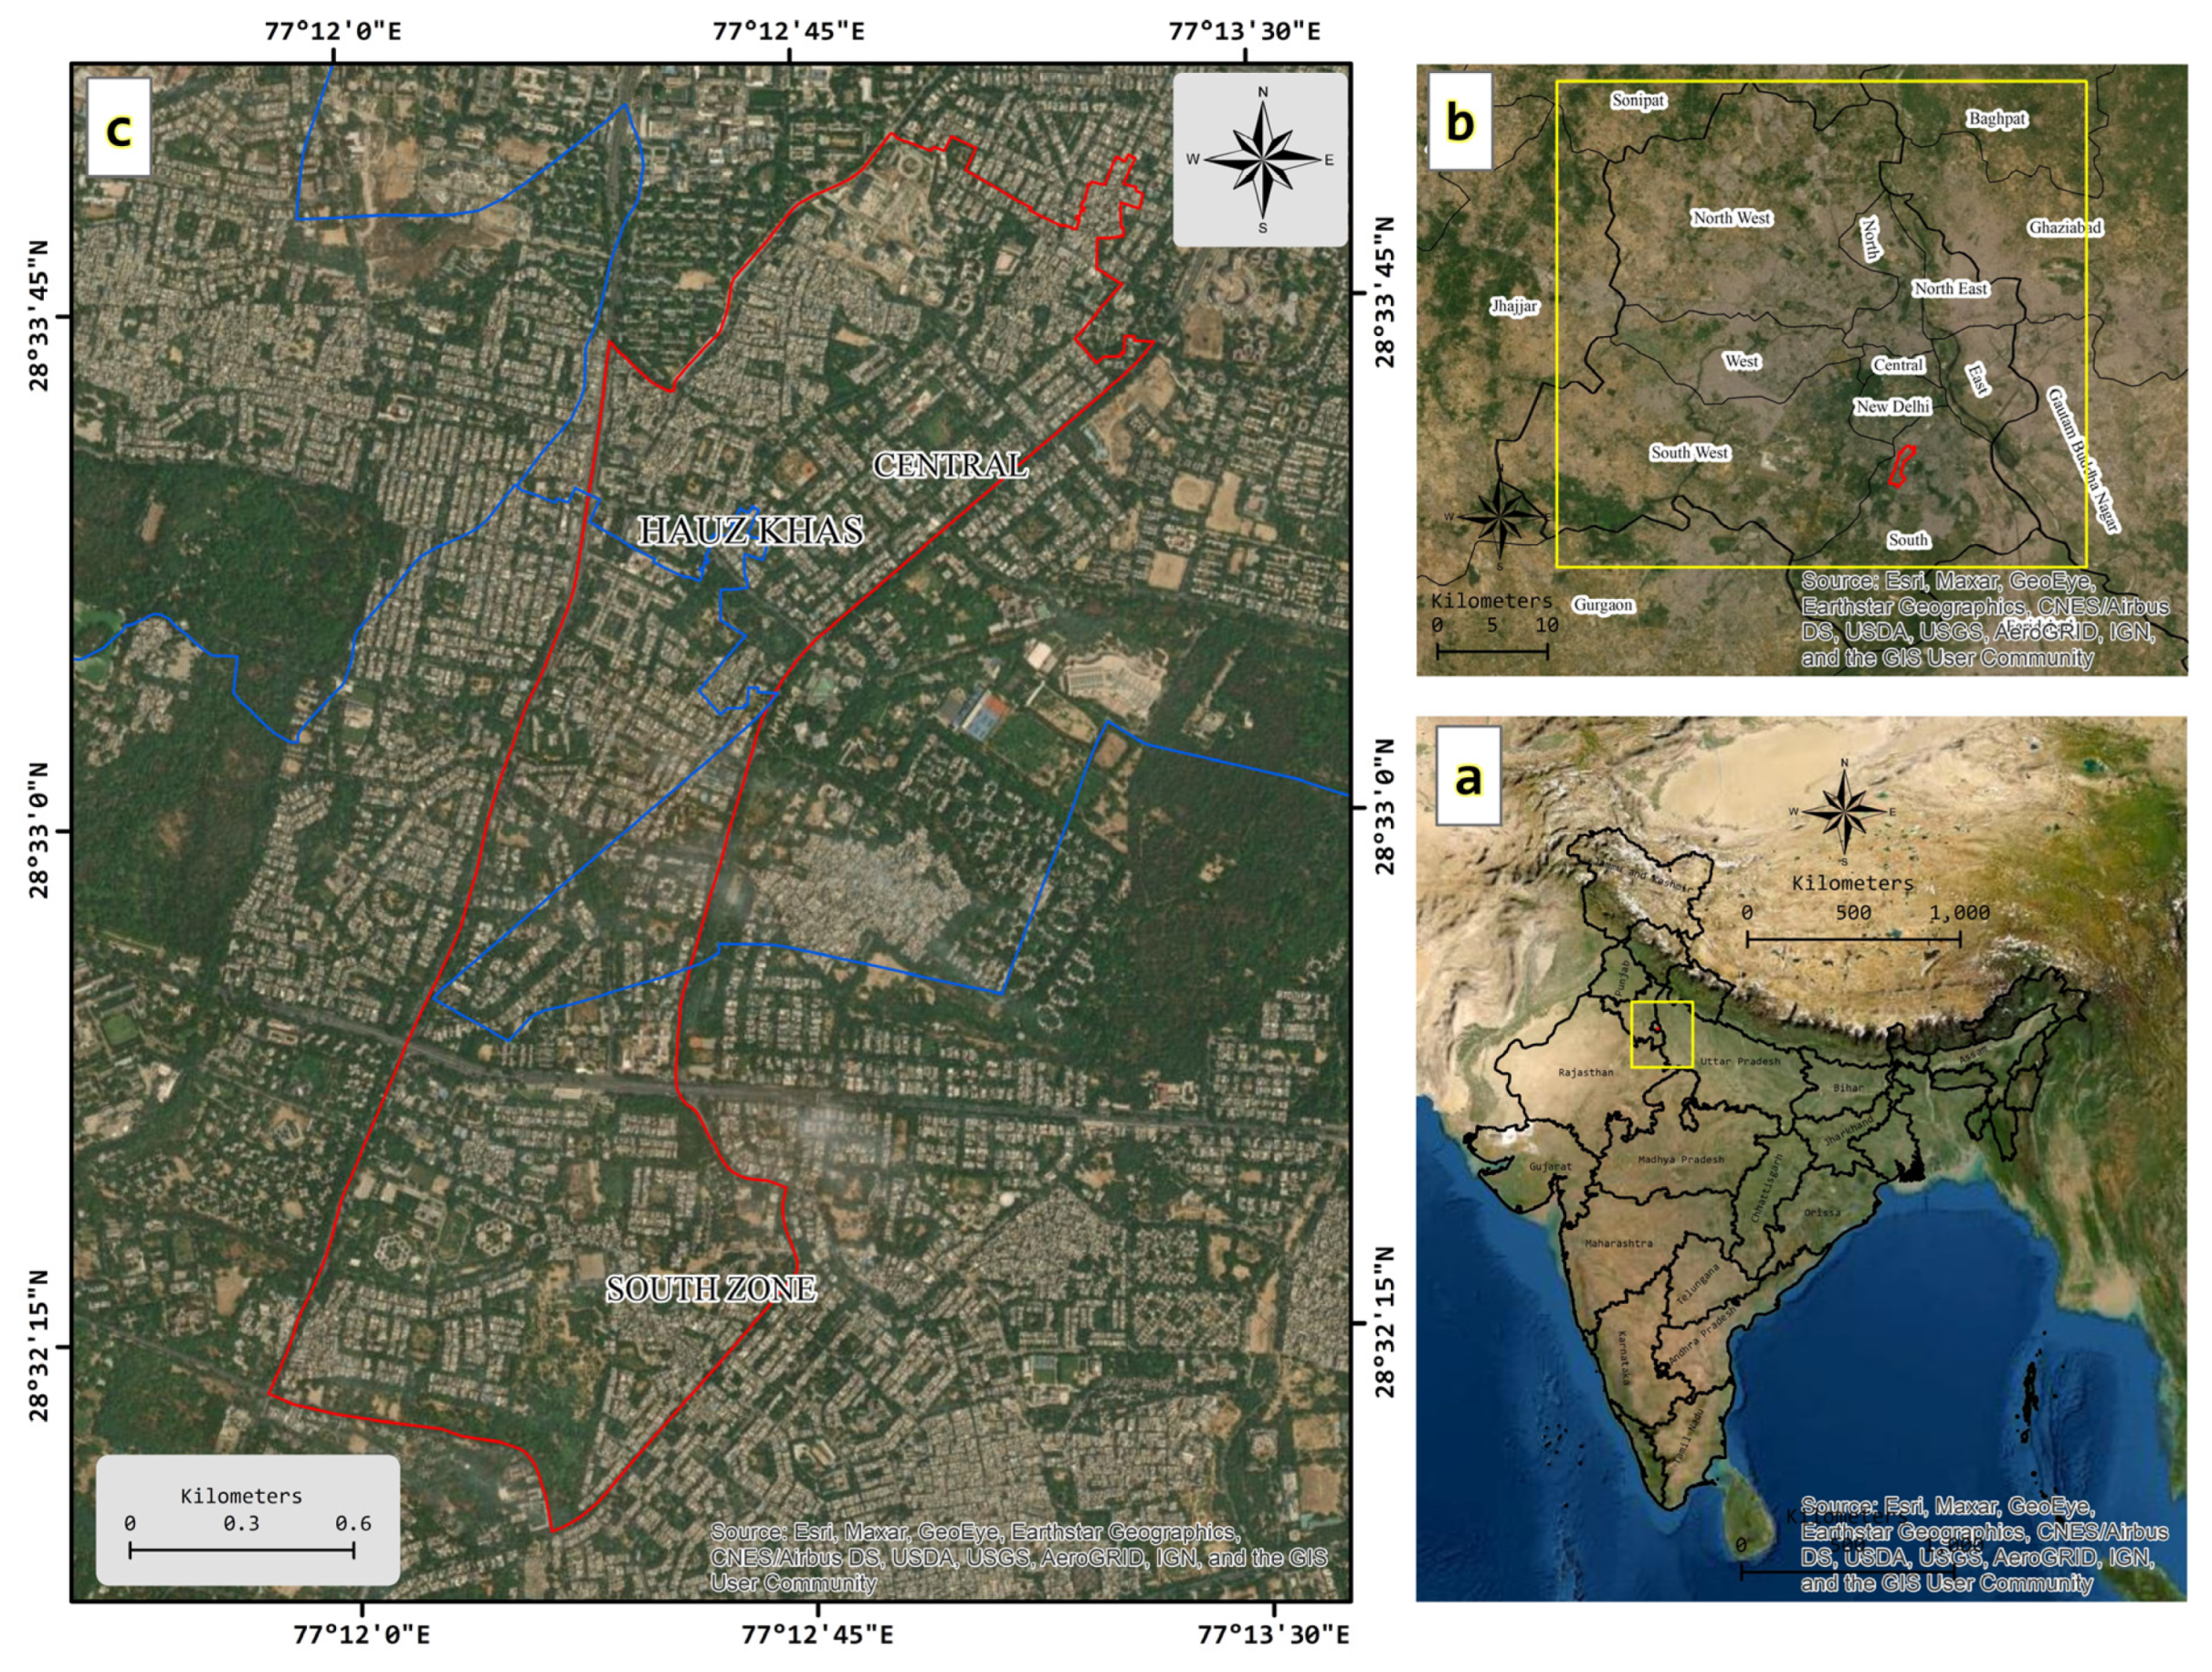
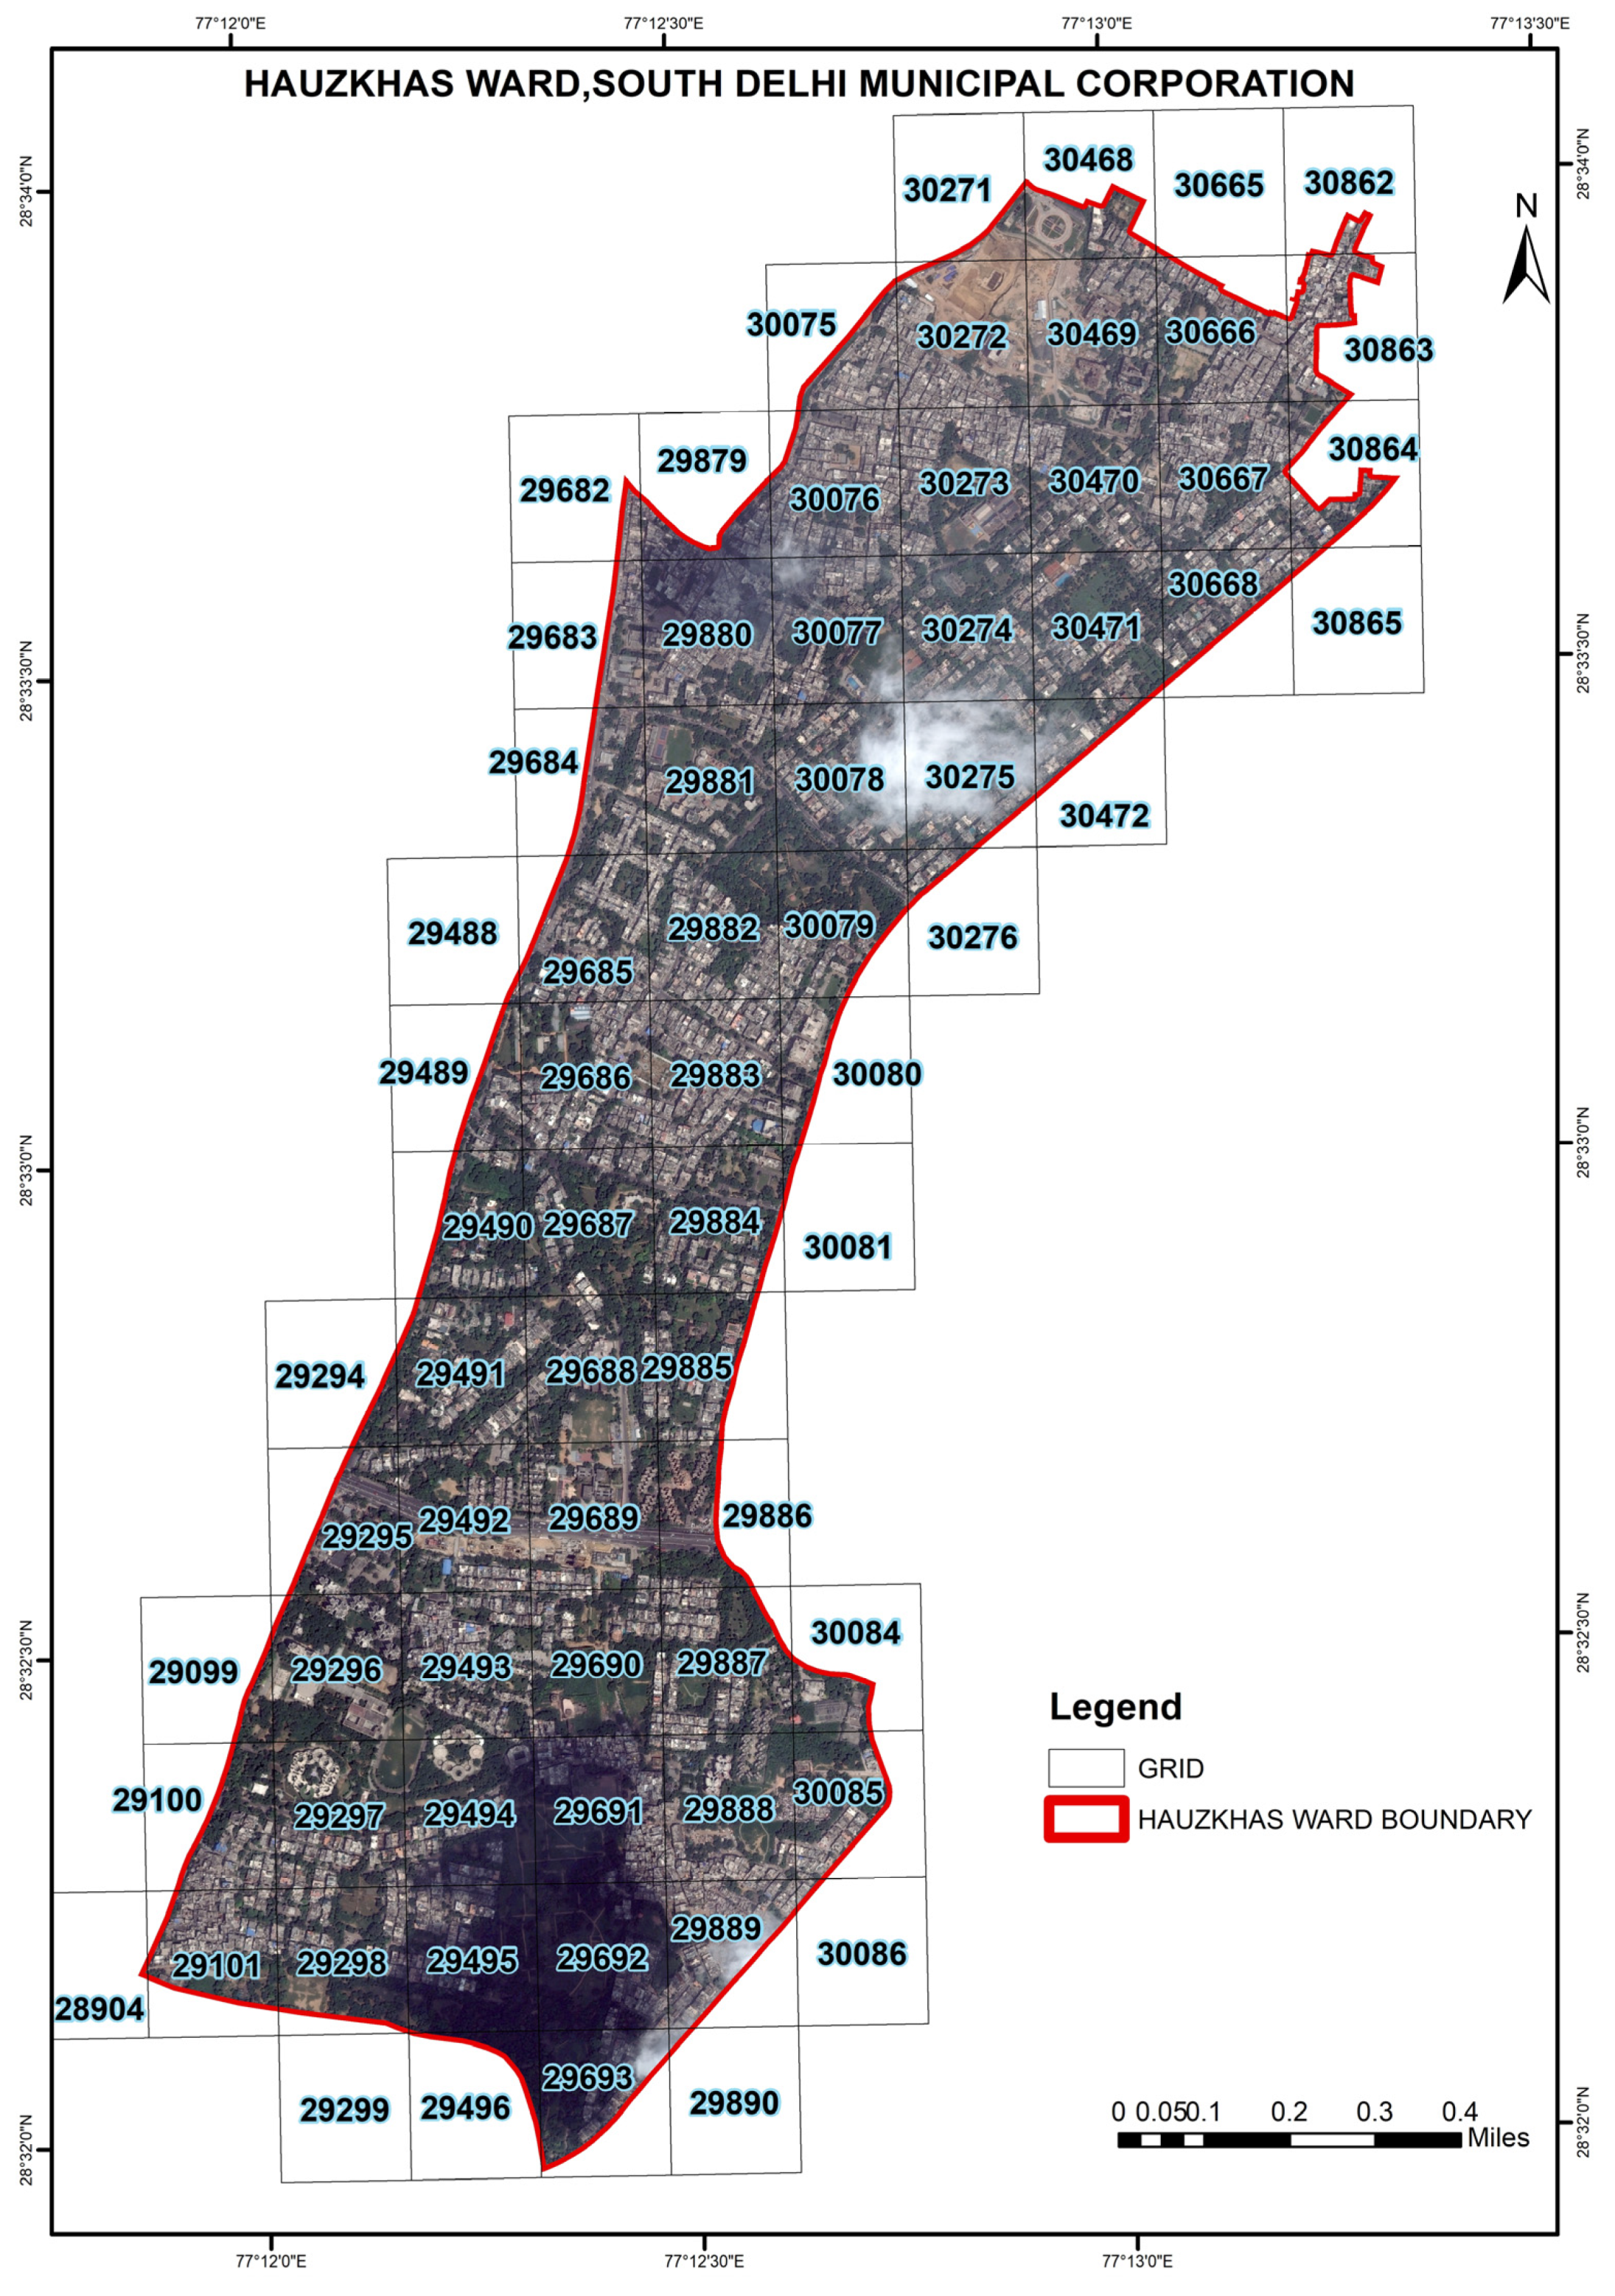
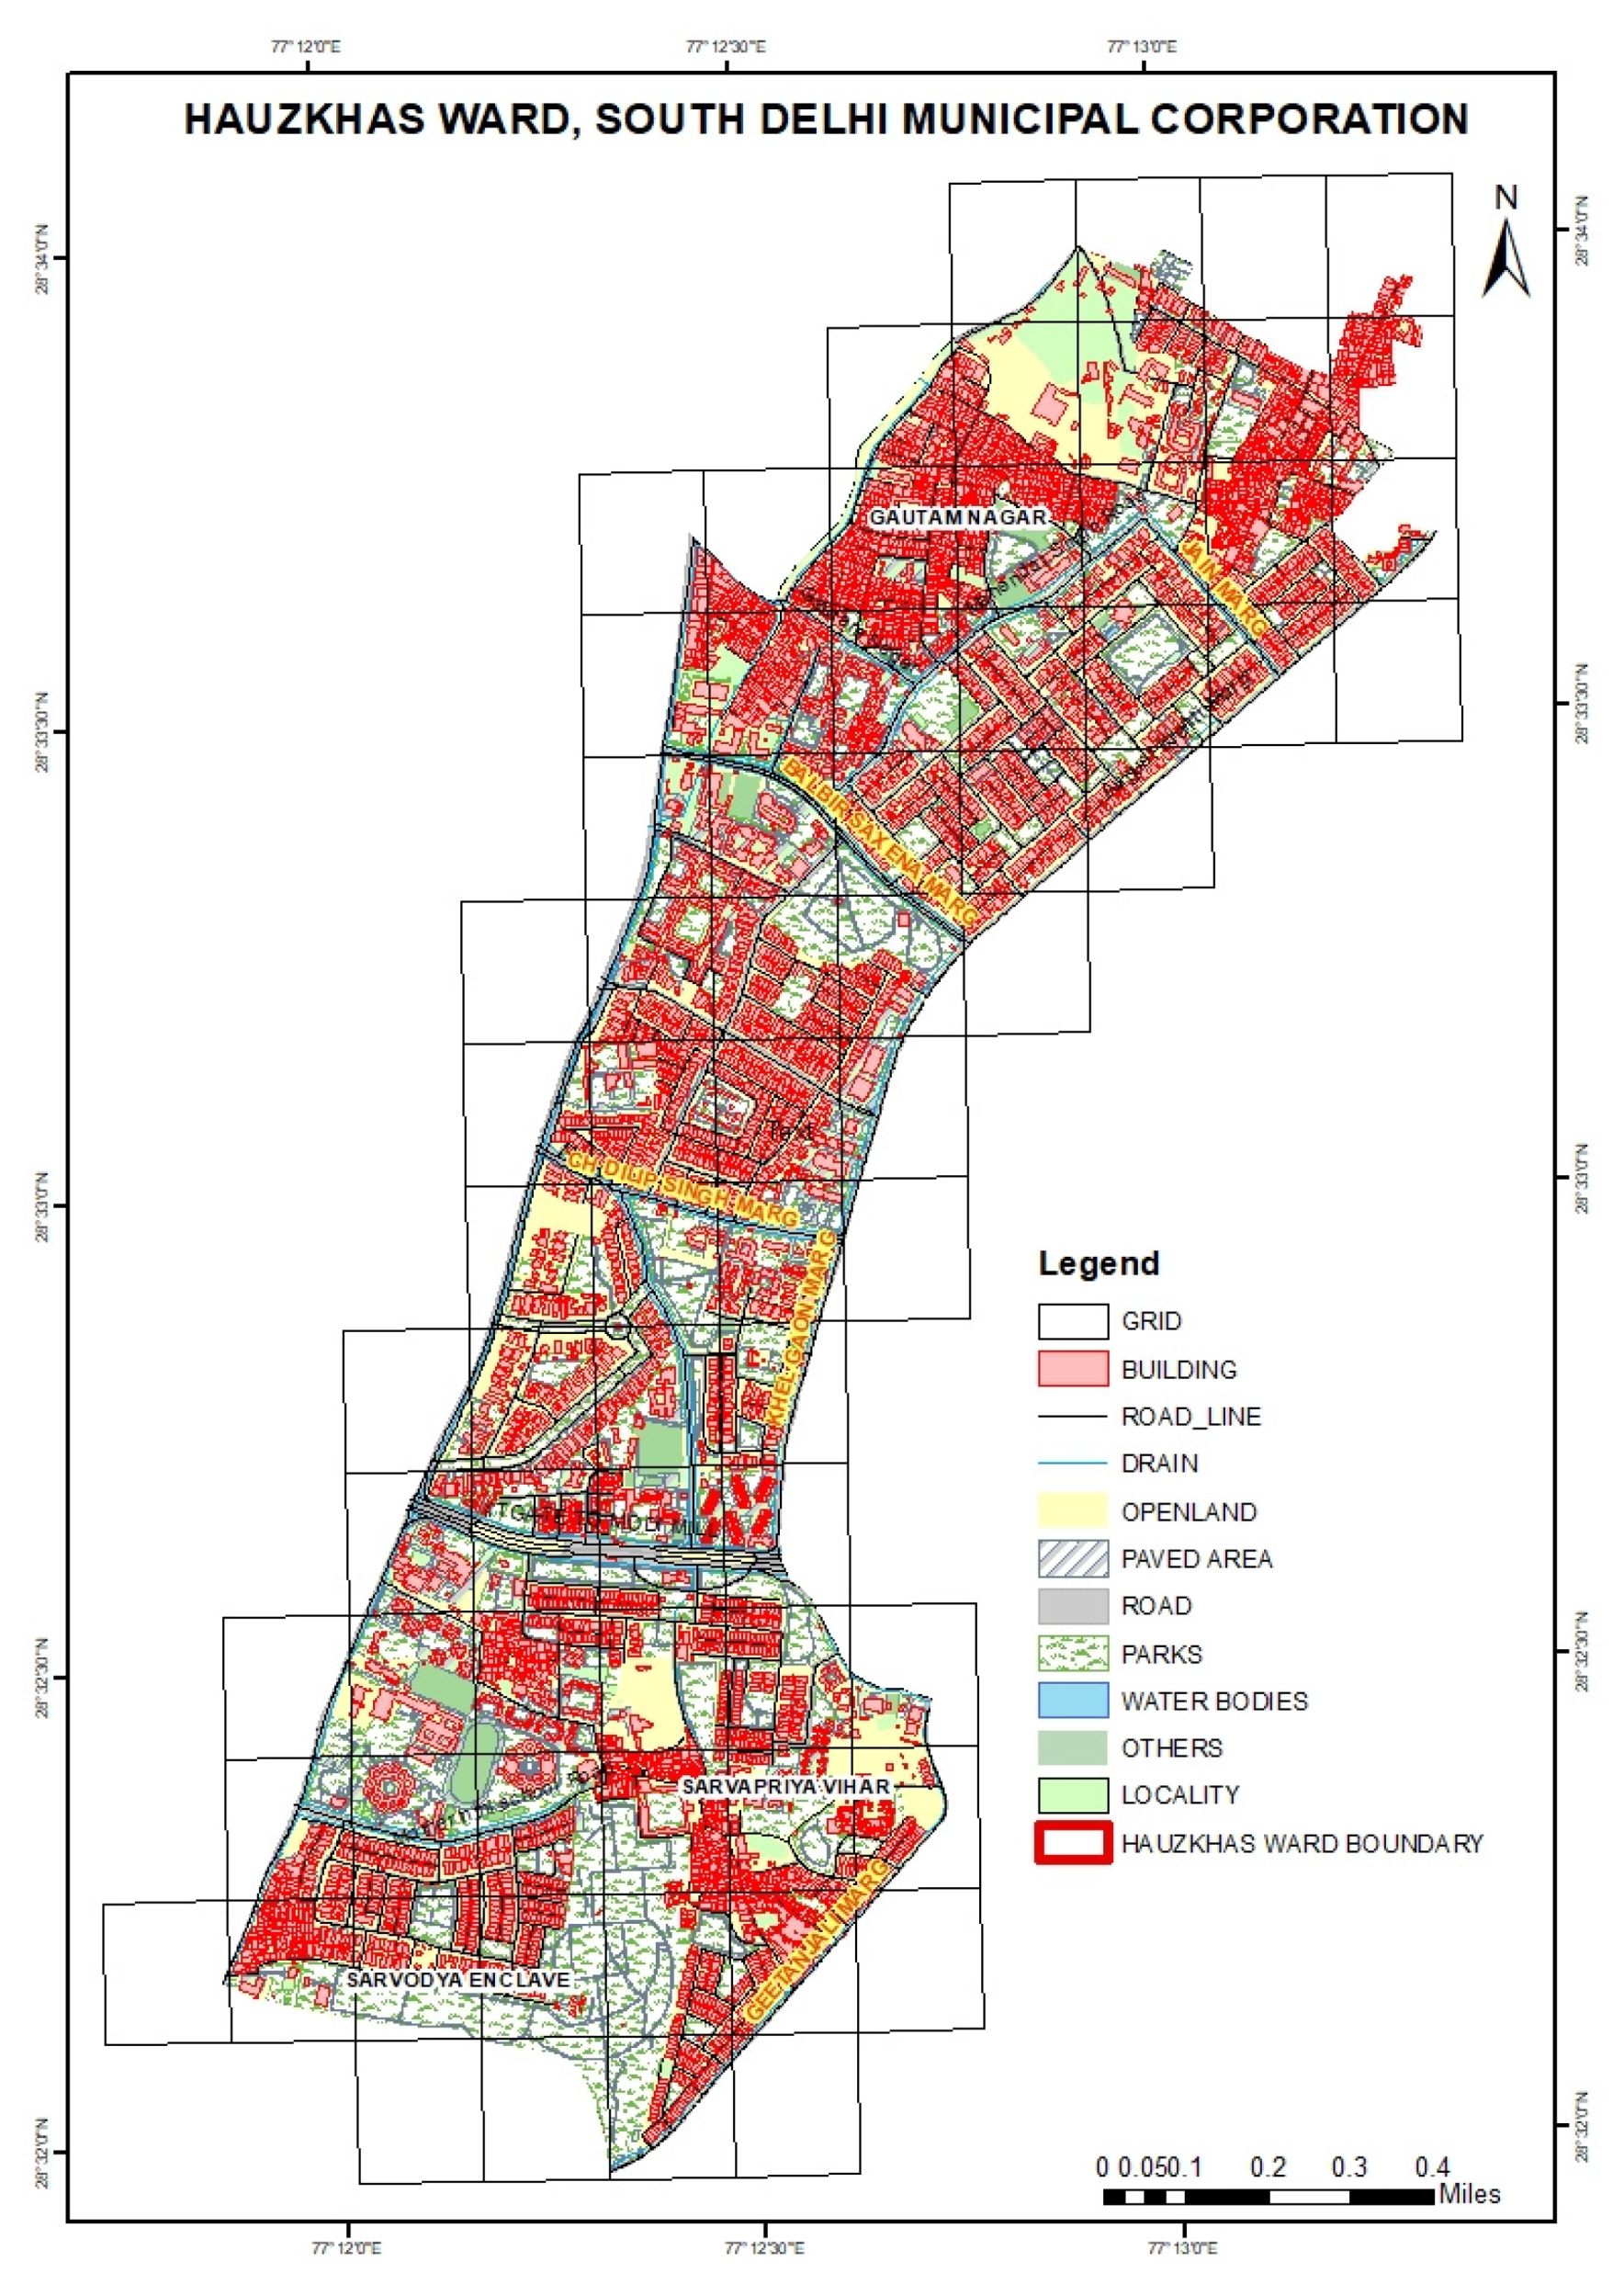
2.1. Study Area

Delhi is located at a latitude of 28°34′ N and a longitude of 77°07′ E, having an average elevation of 233 m (ranging from 213 to 305 m) above the mean sea level. The NCT has three local municipal corporations: Municipal Corporation of Delhi (providing civic amenities to an estimated 13.78 million people), New Delhi Municipal Council (New Delhi), and Delhi Cantonment Board. The total geographic area of Delhi is 1483 km2 (Rural-689 km2, urban-624 km2 and forest-170 km2). Recently Delhi Municipal Corporation of Delhi has been trifurcated into three smaller Municipal corporations—North Delhi Municipal Corporation, South Delhi Municipal Corporation, East Delhi Municipal Corporation. Among all the corporations, South Delhi Municipal corporation is the largest one, having 667.38 km2. The South Delhi municipal corporation is further divided into four-zone and 104 wards. Hauz Khas ward (Ward No.62S) falls under the South Zone of South Delhi Municipal corporation (Figure 1). It consists of planned, unplanned as well as commercial properties.

2.2. Methods

For this study, the primary concern is building, as it is fundamental for property tax calculation. For the level of visual interpretation required in this study, WorldView-2 imagery has been used. The resolution of the world view is 0.5 m which was suitable for the interpretation of building edges and partitions. A visible feature like building, land-cover, drains can be captured using this image, but the boundary of localities is not possible with it. For interpretation of localities, blocks, colonies, other sources such as Google or Eicher maps are useful. For this paper, a reference to Eicher map-2007 and Google map has been used. ArcGIS (version 10.1), an ESRI suite platform, was opted for geodatabase creation. Figure 2 shows an overview of the overall methodology.
The primary data, i.e., categorized property data, was collected through field surveys using the property tax form (Annexure 1, 2). The secondary, i.e., wards boundary gazette notification, slum boundary list, enumeration block extent list, SDMC property tax form, and colony categorization lists have been collected from the concerned departments. The unique key between the property survey form and spatial data of the building was proposed to be an identifier referred to as BUID. On the platform of ArcGIS, the survey data have been mapped using the geocode tool. The survey data led to creating three related layers, i.e., building, properties, and unit.
Since for property taxation, “Property” is the foremost requirement, and it can be one building or part of a building or cluster of buildings. During digitalization, all buildings have been assigned a BUID with a unique number for each building so the polygons can be used to map real-world properties. All buildings were assigned with a reference number ranging from 1 to N within the Grid, where N is the maximum count of buildings in any grid having limits of 99999. This reference number was formulated as a five digit alphanumeric text. To make it 5 digits, an additional pre “0” has been added to the attribute’s reference number (RN). For example, if the given Grid no. 30274, the building has been given reference no. from 1 to 114. The building Id will be “00001”, 00010, 00100, etc.
The unique reference number (URN) is a 10-digit number combined with Grid number and Building ID. This was a means of creating a unique reference number for each building throughout the data. In Table 1, the design and creation of BUID have been shown.
For digitization of location boundary, Eicher image has been used. Eicher is an image having visualized major base layer information. The colonies and locations are generally separated by any natural or manmade boundary such as road, drain, building, or landcover pattern. A Reference Google image has also been taken for this task. Information like the name of a major road, major drains, localities, and major landmarks has been added in the data using Eicher and Google.

3. Results and Discussion

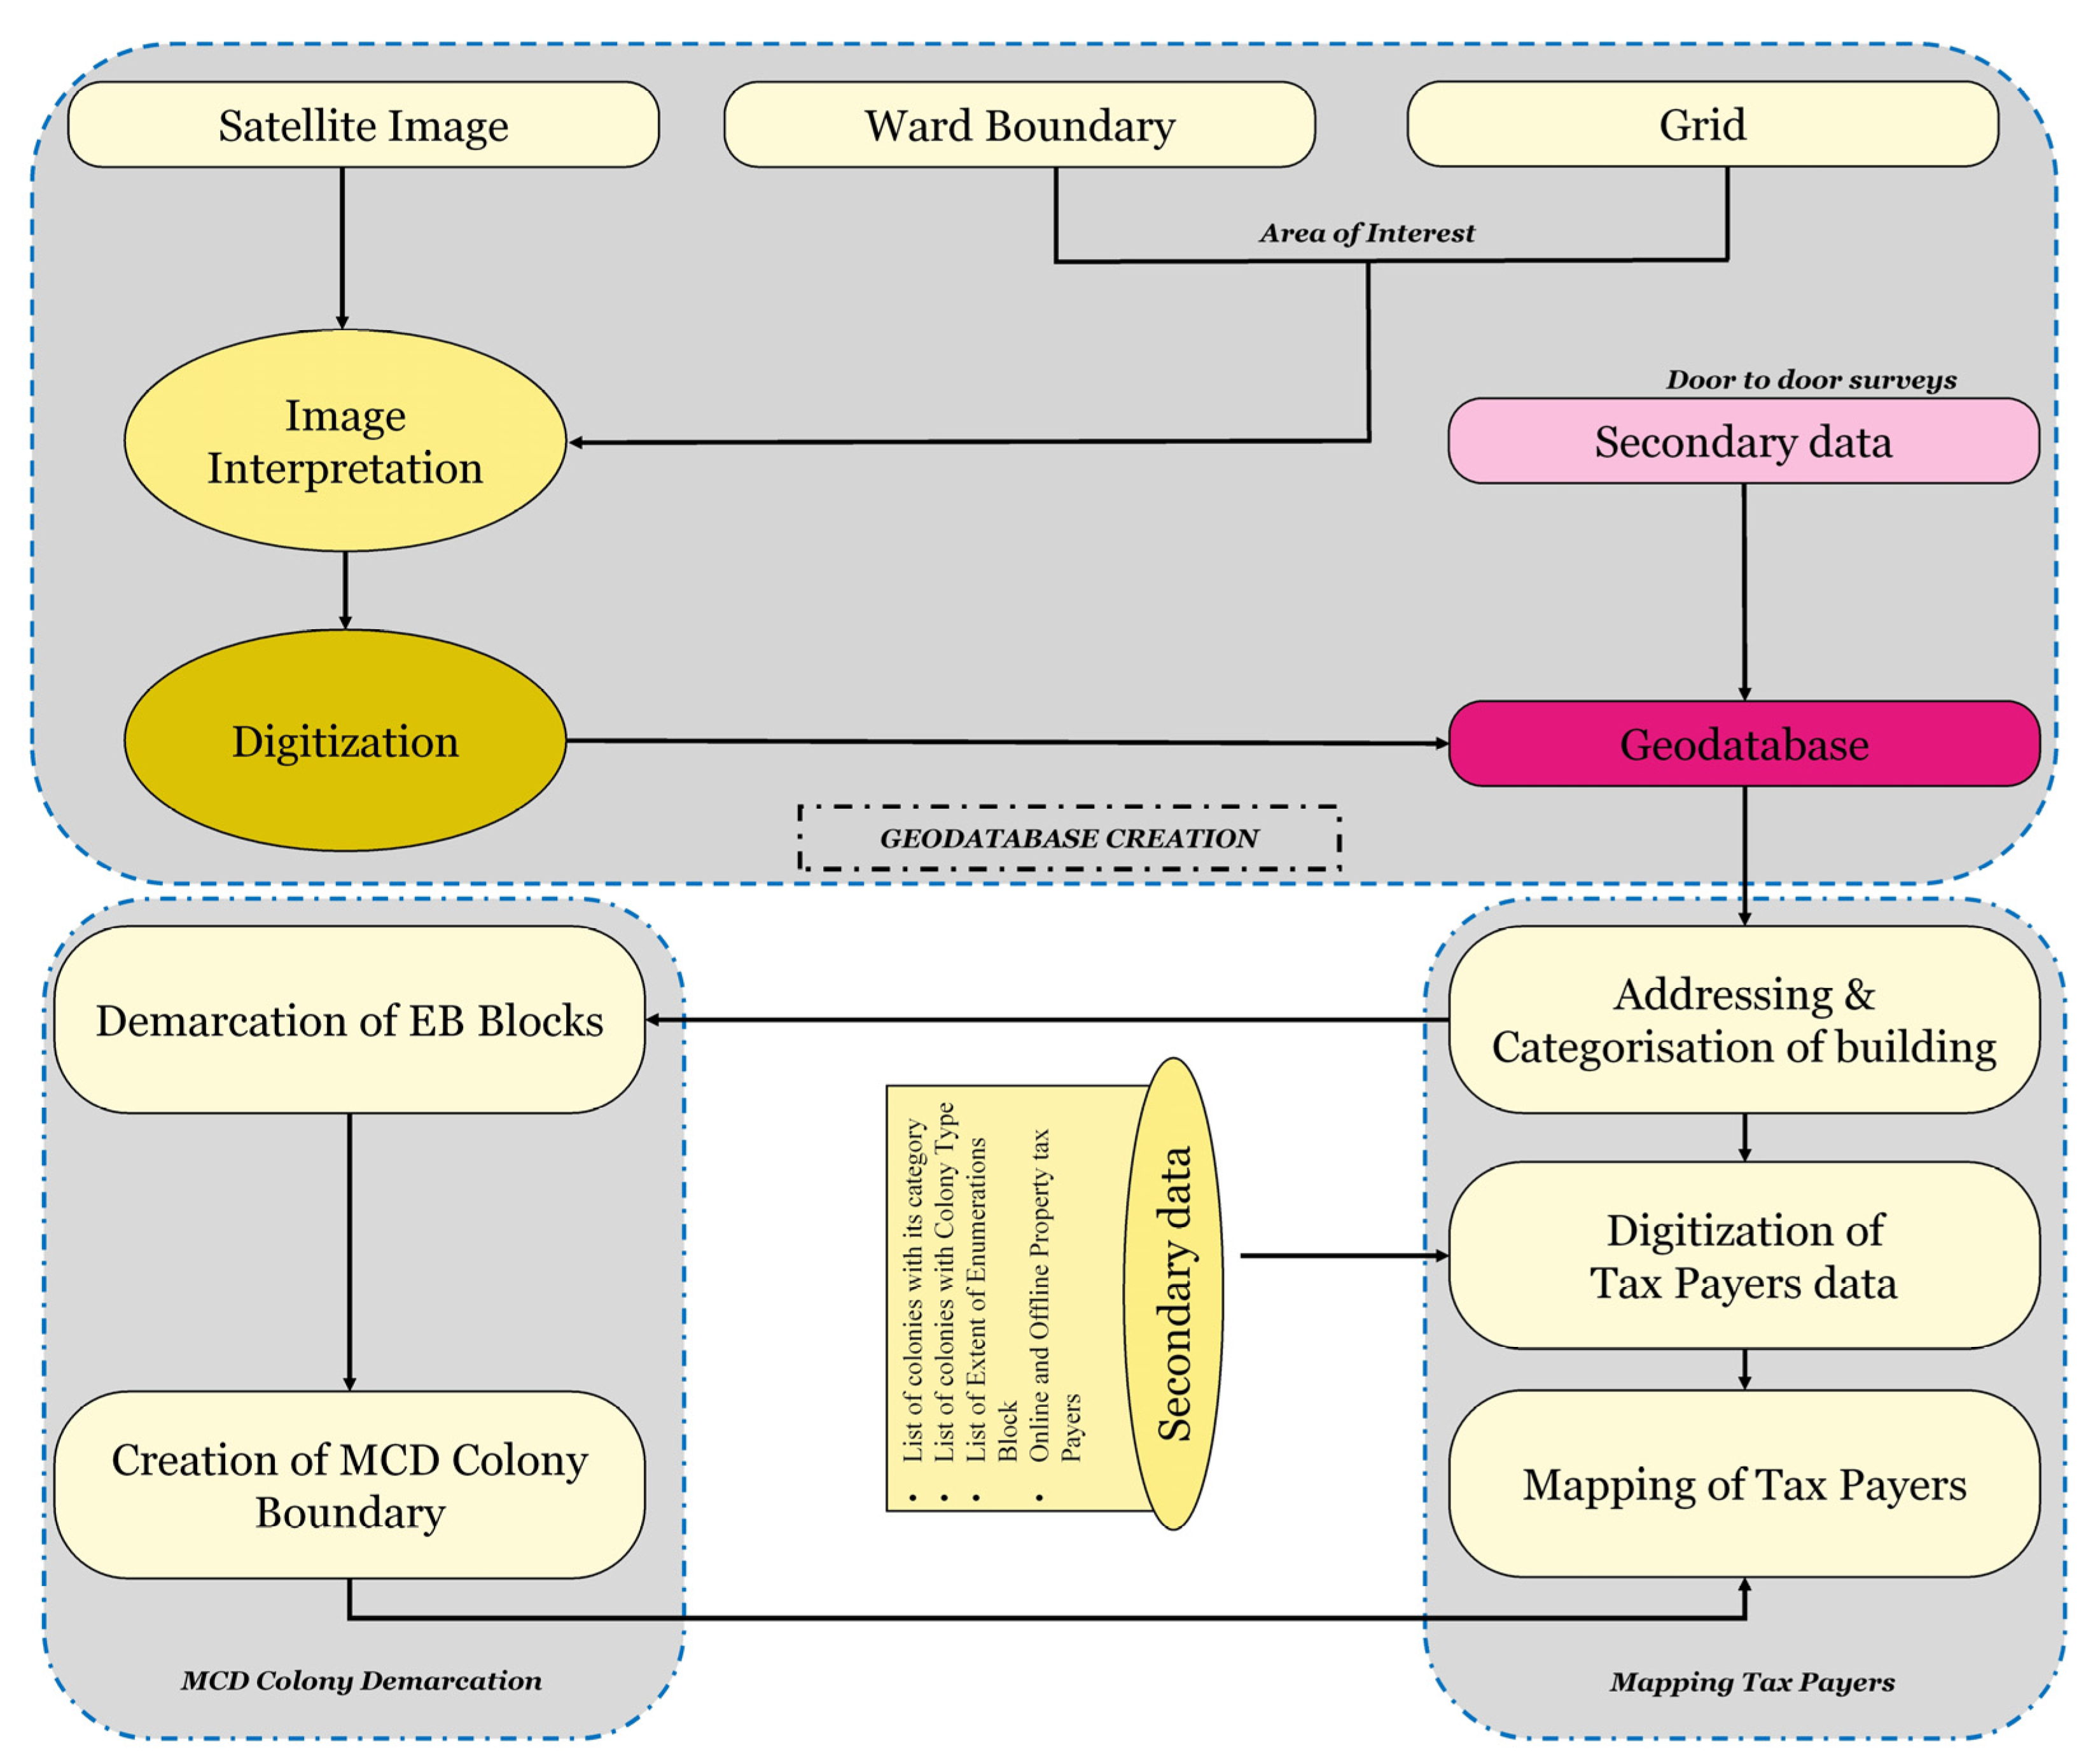
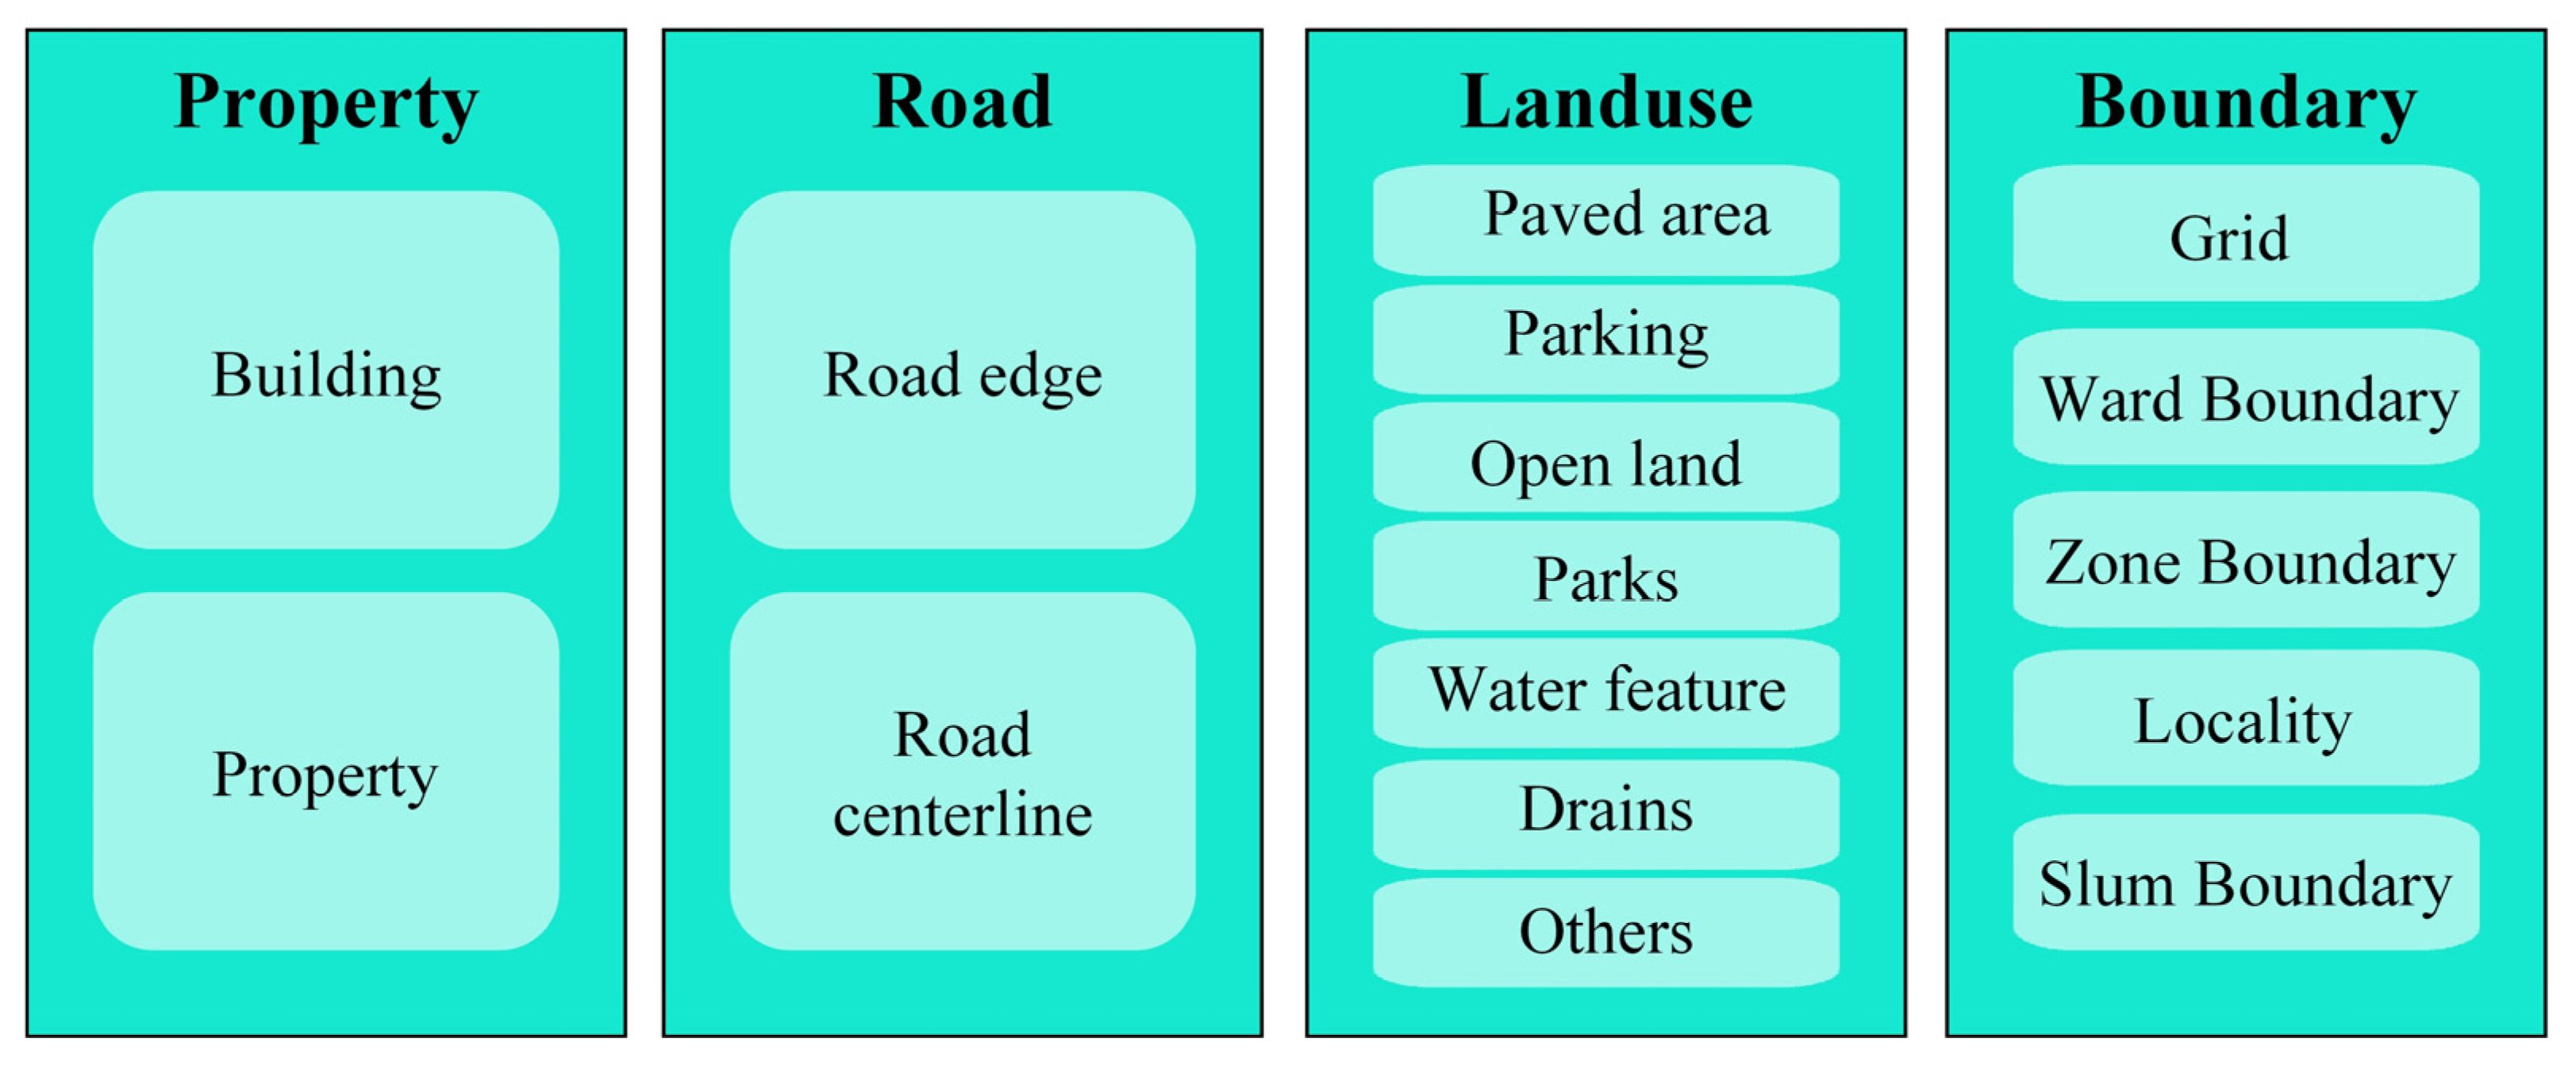
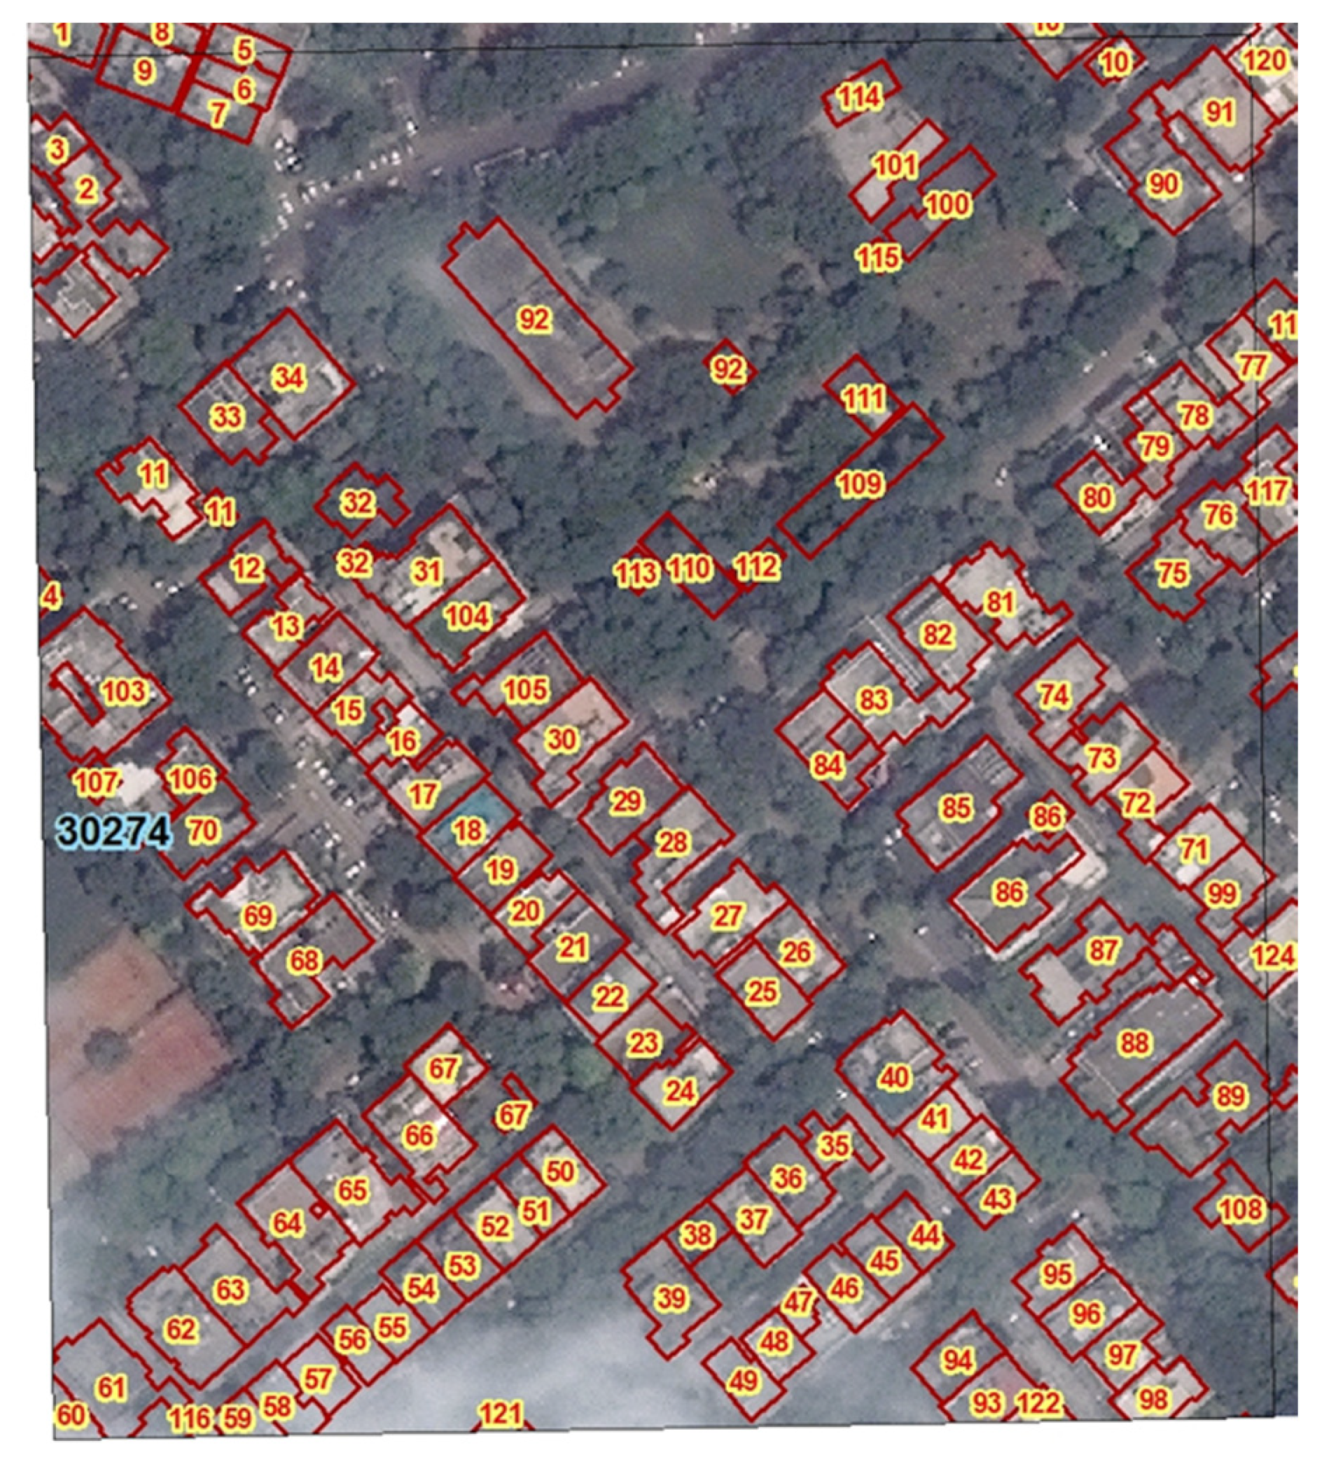
3.1. Geodatabase of the Implementing the Property Tax

Understanding the ground reality in terms of available features, structures, and economic activities is essential to creating any management and planning activities for any area. This requires digitization of all the available features on the ground, such as buildings, lands, forests, water bodies, and roads within the municipal boundaries [33,34,35,36,37]. This is wherein GIS-based geodatabase plays come into play. The data captured as a .shp file and stored in a .gdb format at the ESRI Platform forms the data input process. The geodatabase is a structured way to store multiple shapefiles of different feature types, whether point or line or polygon [38]. The structure of the geodatabase used in this study is presented in Figure 3. The set of shapefiles has been categorized in geodatabase based on its entity type. Before capturing the data in the shapefile, required fields with the name have been created as per the data type and field length.
There are four major geodatabases (.gdb)categorized in the present work, i.e., building, road, land use, and boundary, under which various other essential information layers are stored either by digitization or creation. One of the important layers in this project is a grid of 250 × 250 m which is the base for creating a unique ID for building and property survey maps. Each Grid is assigned a unique number, and each building with the Grid has also been assigned a unique number. A combination of both the numbers at the Grid and building will create a unique ID for the building, i.e., BUID (Figure 4 and Figure 5).
On the ground, there are multiple properties. By assigning a unique no. to each property within the building, it will create a Unique ID to each property. In another way, the concatenation of Grid no., building no, and property no. will create a Unique ID for property (PID: Property ID).
The creation of spatial data is majorly an image interpretation job. Before capturing any building, a 250 × 250 m grid has been created. This Grid has been created using the fishnet tool in Arc GIS [39]. Each Grid has been assigned a unique number. The same grid number will be updated in the building under the respective Grid. It will not just help in tracking of digitization of data but also will help create a unique ID for Building.
SDMC colony boundaries were mapped starting with the enumeration block. Enumeration Block (EB) means a specific area allotted to one particular enumerator to carry out census operations relating to population enumeration. The State Election Commission defines these EB Boundaries. SDMC uses these EB Boundaries to form SDMC colony boundaries. The municipal valuation committee decides the category of colonies. The boundary of wards and colonies is most likely to change within its Assembly constituency boundary every five years. Demarcation of EBs on the digital platform is a one-time exercise that will be a base for future modification of ward or colony boundaries.
The digital profile of the Hauz Khas ward has been created, which has visual information of building, road, use of lands, and locality. Land use and land cover information are important for several planning and management activities concerned with the surface of the earth [40,41]. The land-use types are estimates of the study area is given in Table 2. The land use distribution can define and predict human activity using agriculture, housing, or institutional. Ward area of Hauzkhas is 3.14 km2 having 5620 buildings under its jurisdiction. The covered area of the building is 0.93 km2 in Hauzkhas, i.e., 29% of the area, which is the tax-net for the SDMC (Figure 6). Through this approach, only horizontal expansion of built-up can be determined. Still, again for the actual covered area, it is imperative to calculate the vertical built-up, which can be best possible through the door-to-door survey of these buildings. Apart from this, approximately 20% of the area is covered by roads and paved areas. Since the Hauzkhas ward is planned, 23% of the area has been dedicated to the gardens and park. Since many of these portions are owned privately, this can be maintained the same in consecutive years. One more thing is very focal in this study for the municipal that approx. 23% of the area is open land, which is prone to have unauthorized construction leading to unauthorized colonies.
Apart from the land-use profile, this database has also resulted in a building polygon with a unique ID. The decided range for building reference is 99999 for each Grid, which is quite enough as each Grid area is 250 × 250 m2. The 250 × 250 m grid size is a requirement under the Government of India guidelines to map buildings within such grids under this framework. Very high-scale grids would complicate the GIS-based processing and shall require more computing power (storage and processing). Therefore the 250 × 250 m grids were selected after various hit and trial experiments to avoid computational and data storage issues and, at the same time, was fair enough to provide a rigorous comparison.
Since the data type of Building ID is alphanumeric, an alphabet can be added to the ID for any adverse condition such as partition or new building construction in the same building.
This BUID is key to smooth access of these polygons to use it to collect property information through field surveyor to link it with other digital databases or to map any other attributes. For the development and maintaining the ward, this exercise can provide a foundation where multiple analyses and predictions can be made.

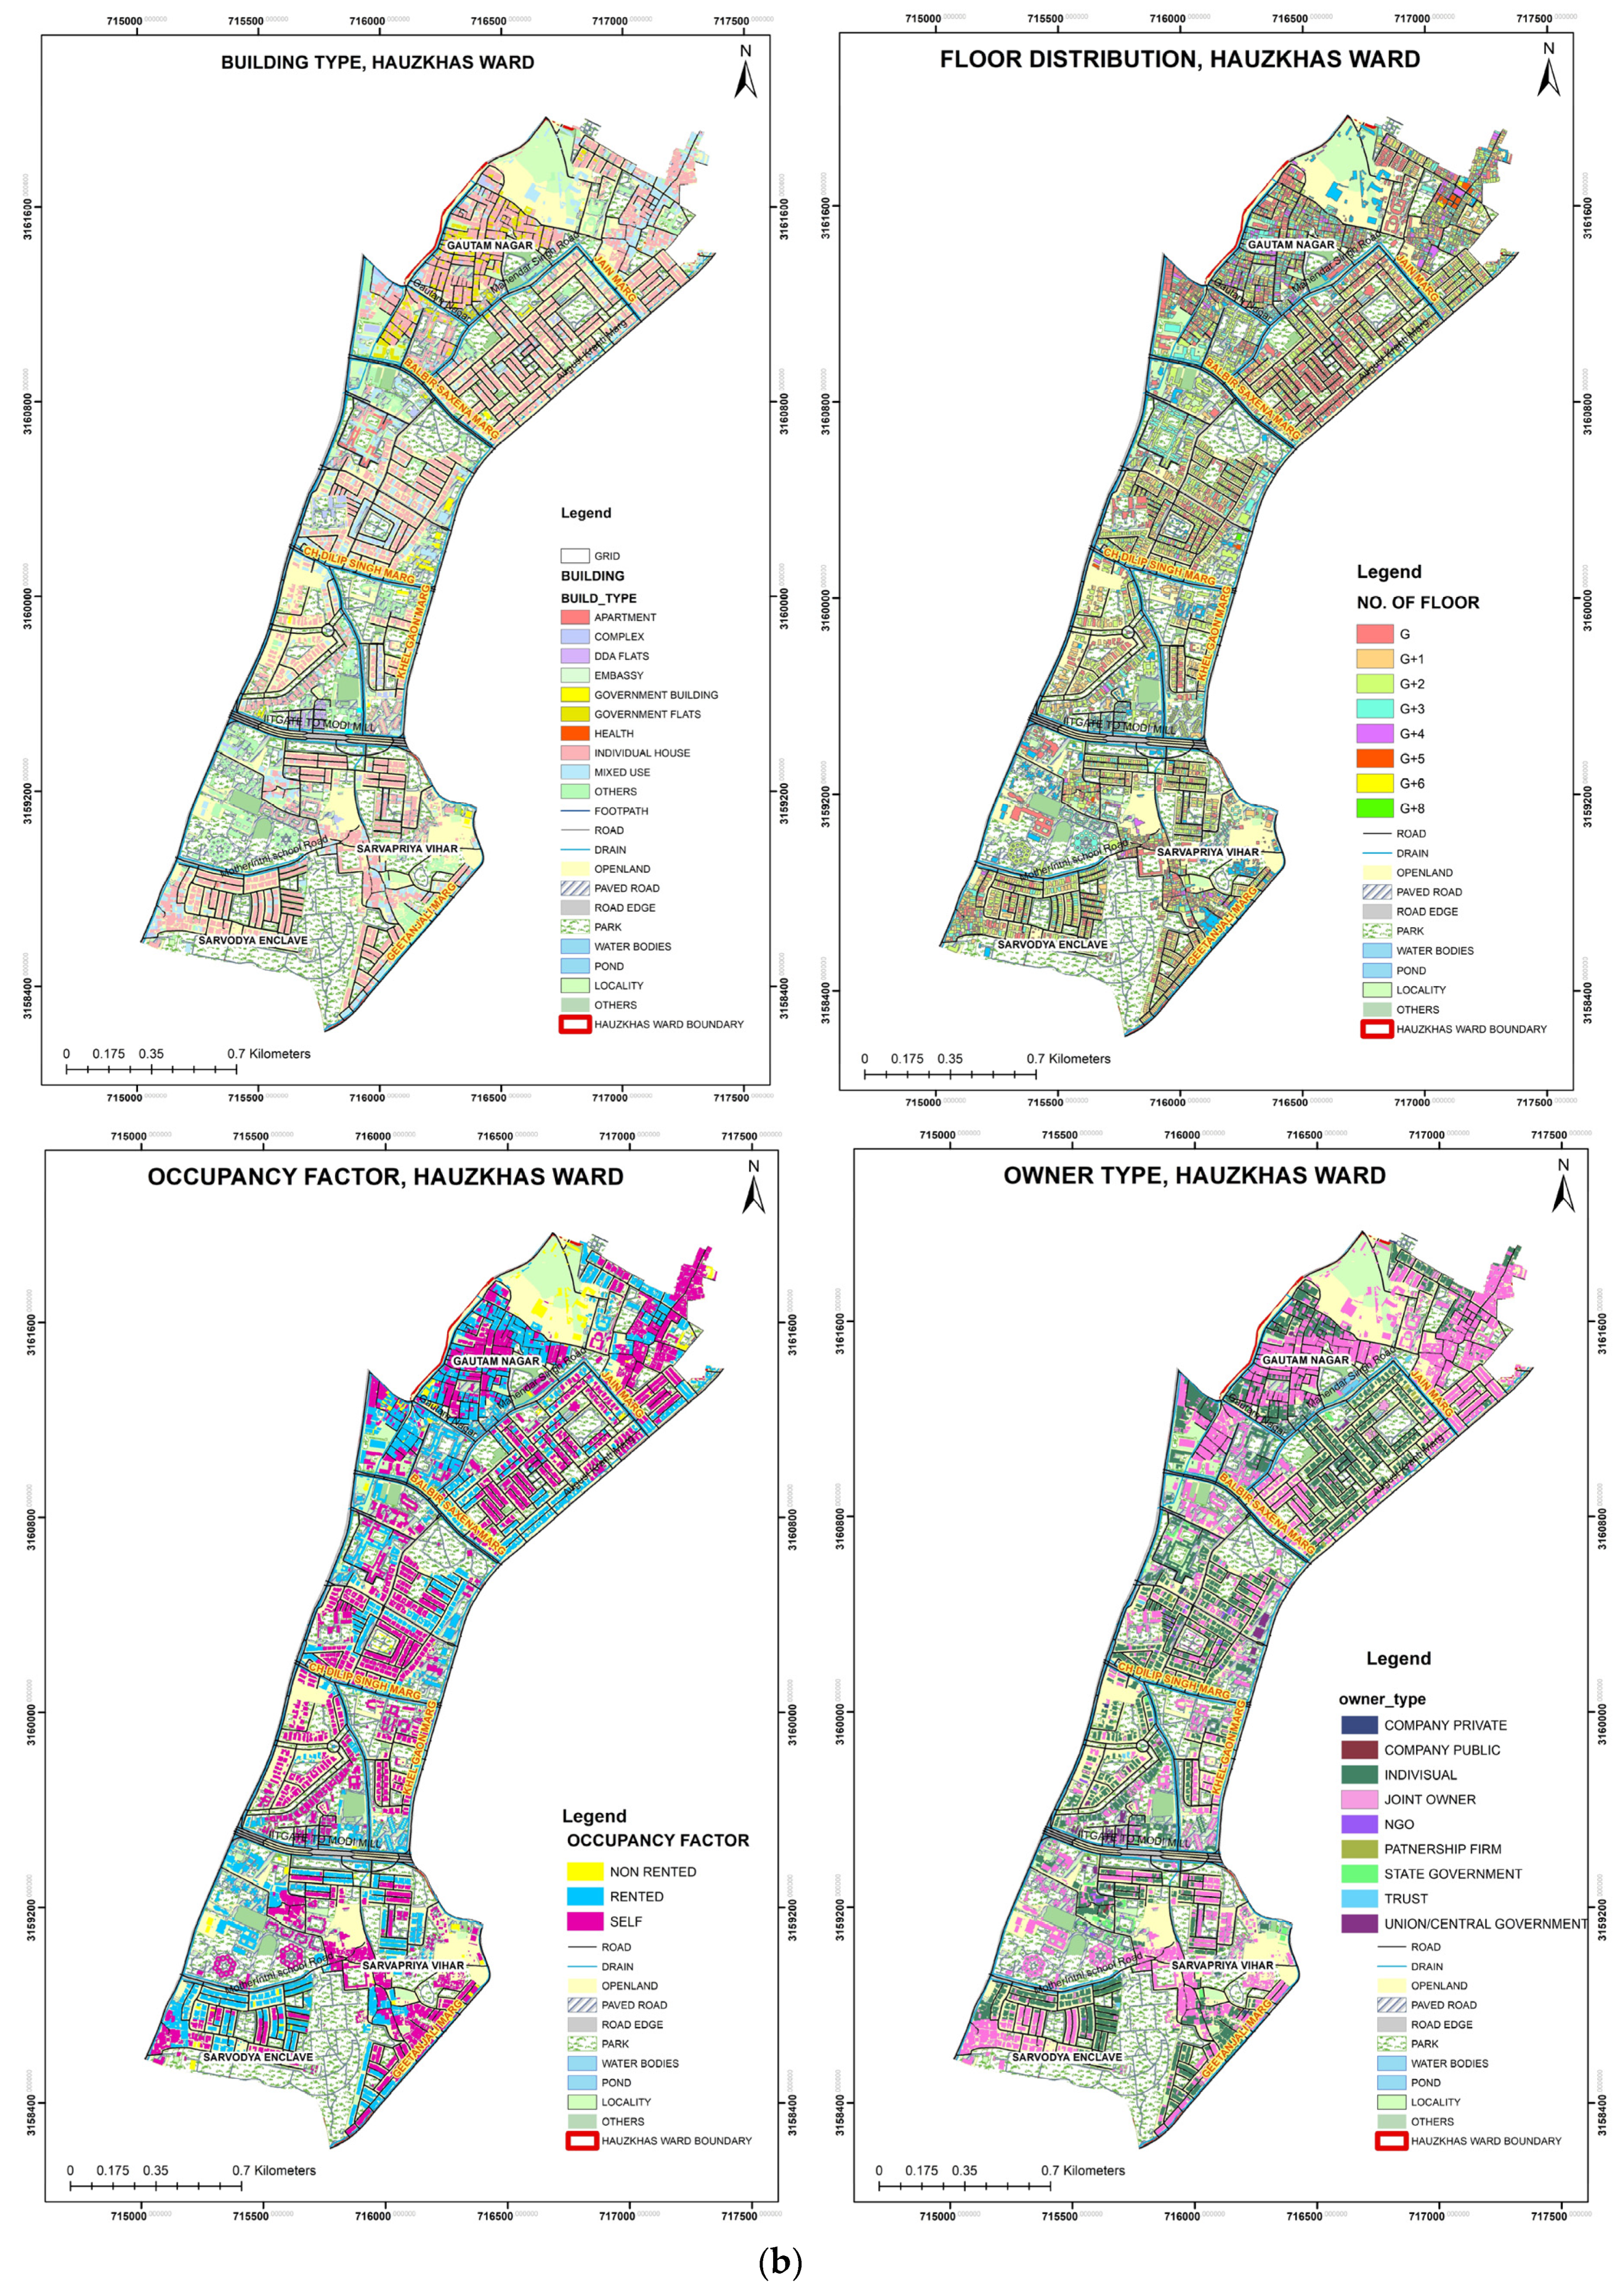
3.2. Property Tax Implementation

Property tax isn’t used to its full potential due to low property valuation rates and ineffective revenue collection. Municipalities and local civic bodies’ largest difficulty today is defining improved property valuation procedures, keeping a regular track of income receipts, and calculating losses on exemptions [42]. GIS aids in the monitoring of property tax revenue by establishing a platform that spatially interconnects all property-related data, such as the number of storeys in each building, the total structured area of each building, individual plot areas, locality details, and municipal colony boundaries, to the tax calculation principles.
The formula of property tax is
Annual value × Tax Rate
In Delhi, the rate of tax is divided into eight categories from A to H (Table 3).
To devolve a robust database, the creation of thematic maps of the property tax formula parameters will be a major advantage. For example, the database will have visible information like use factor such as commercial, residential; Age factor means a year of construction of the building; Structure factor such as kachha, pucca; Occupancy factor such as self-occupied, tenants.
Annual value = Unit area value per m2 × Unit area of property × Age factor × Use factor × Structure factor × Occupancy factor
Apart from this, many other rebate factors are applicable for tax calculation. More the variable stored in the database directly proportionates to the improvement of the database. Access to these kinds of the color-coded map through the administration system of property tax will be boon for the tax inspector. It will be easy to identify and verify the values given by taxpayers. The GIS information layers are shown below as maps (Figure 7a,b).
Also, for calculating annual value, one of the factors is Unit area value per m2 which is the assigned value per square of meter built-up area of the property. It also varies on colony categories.

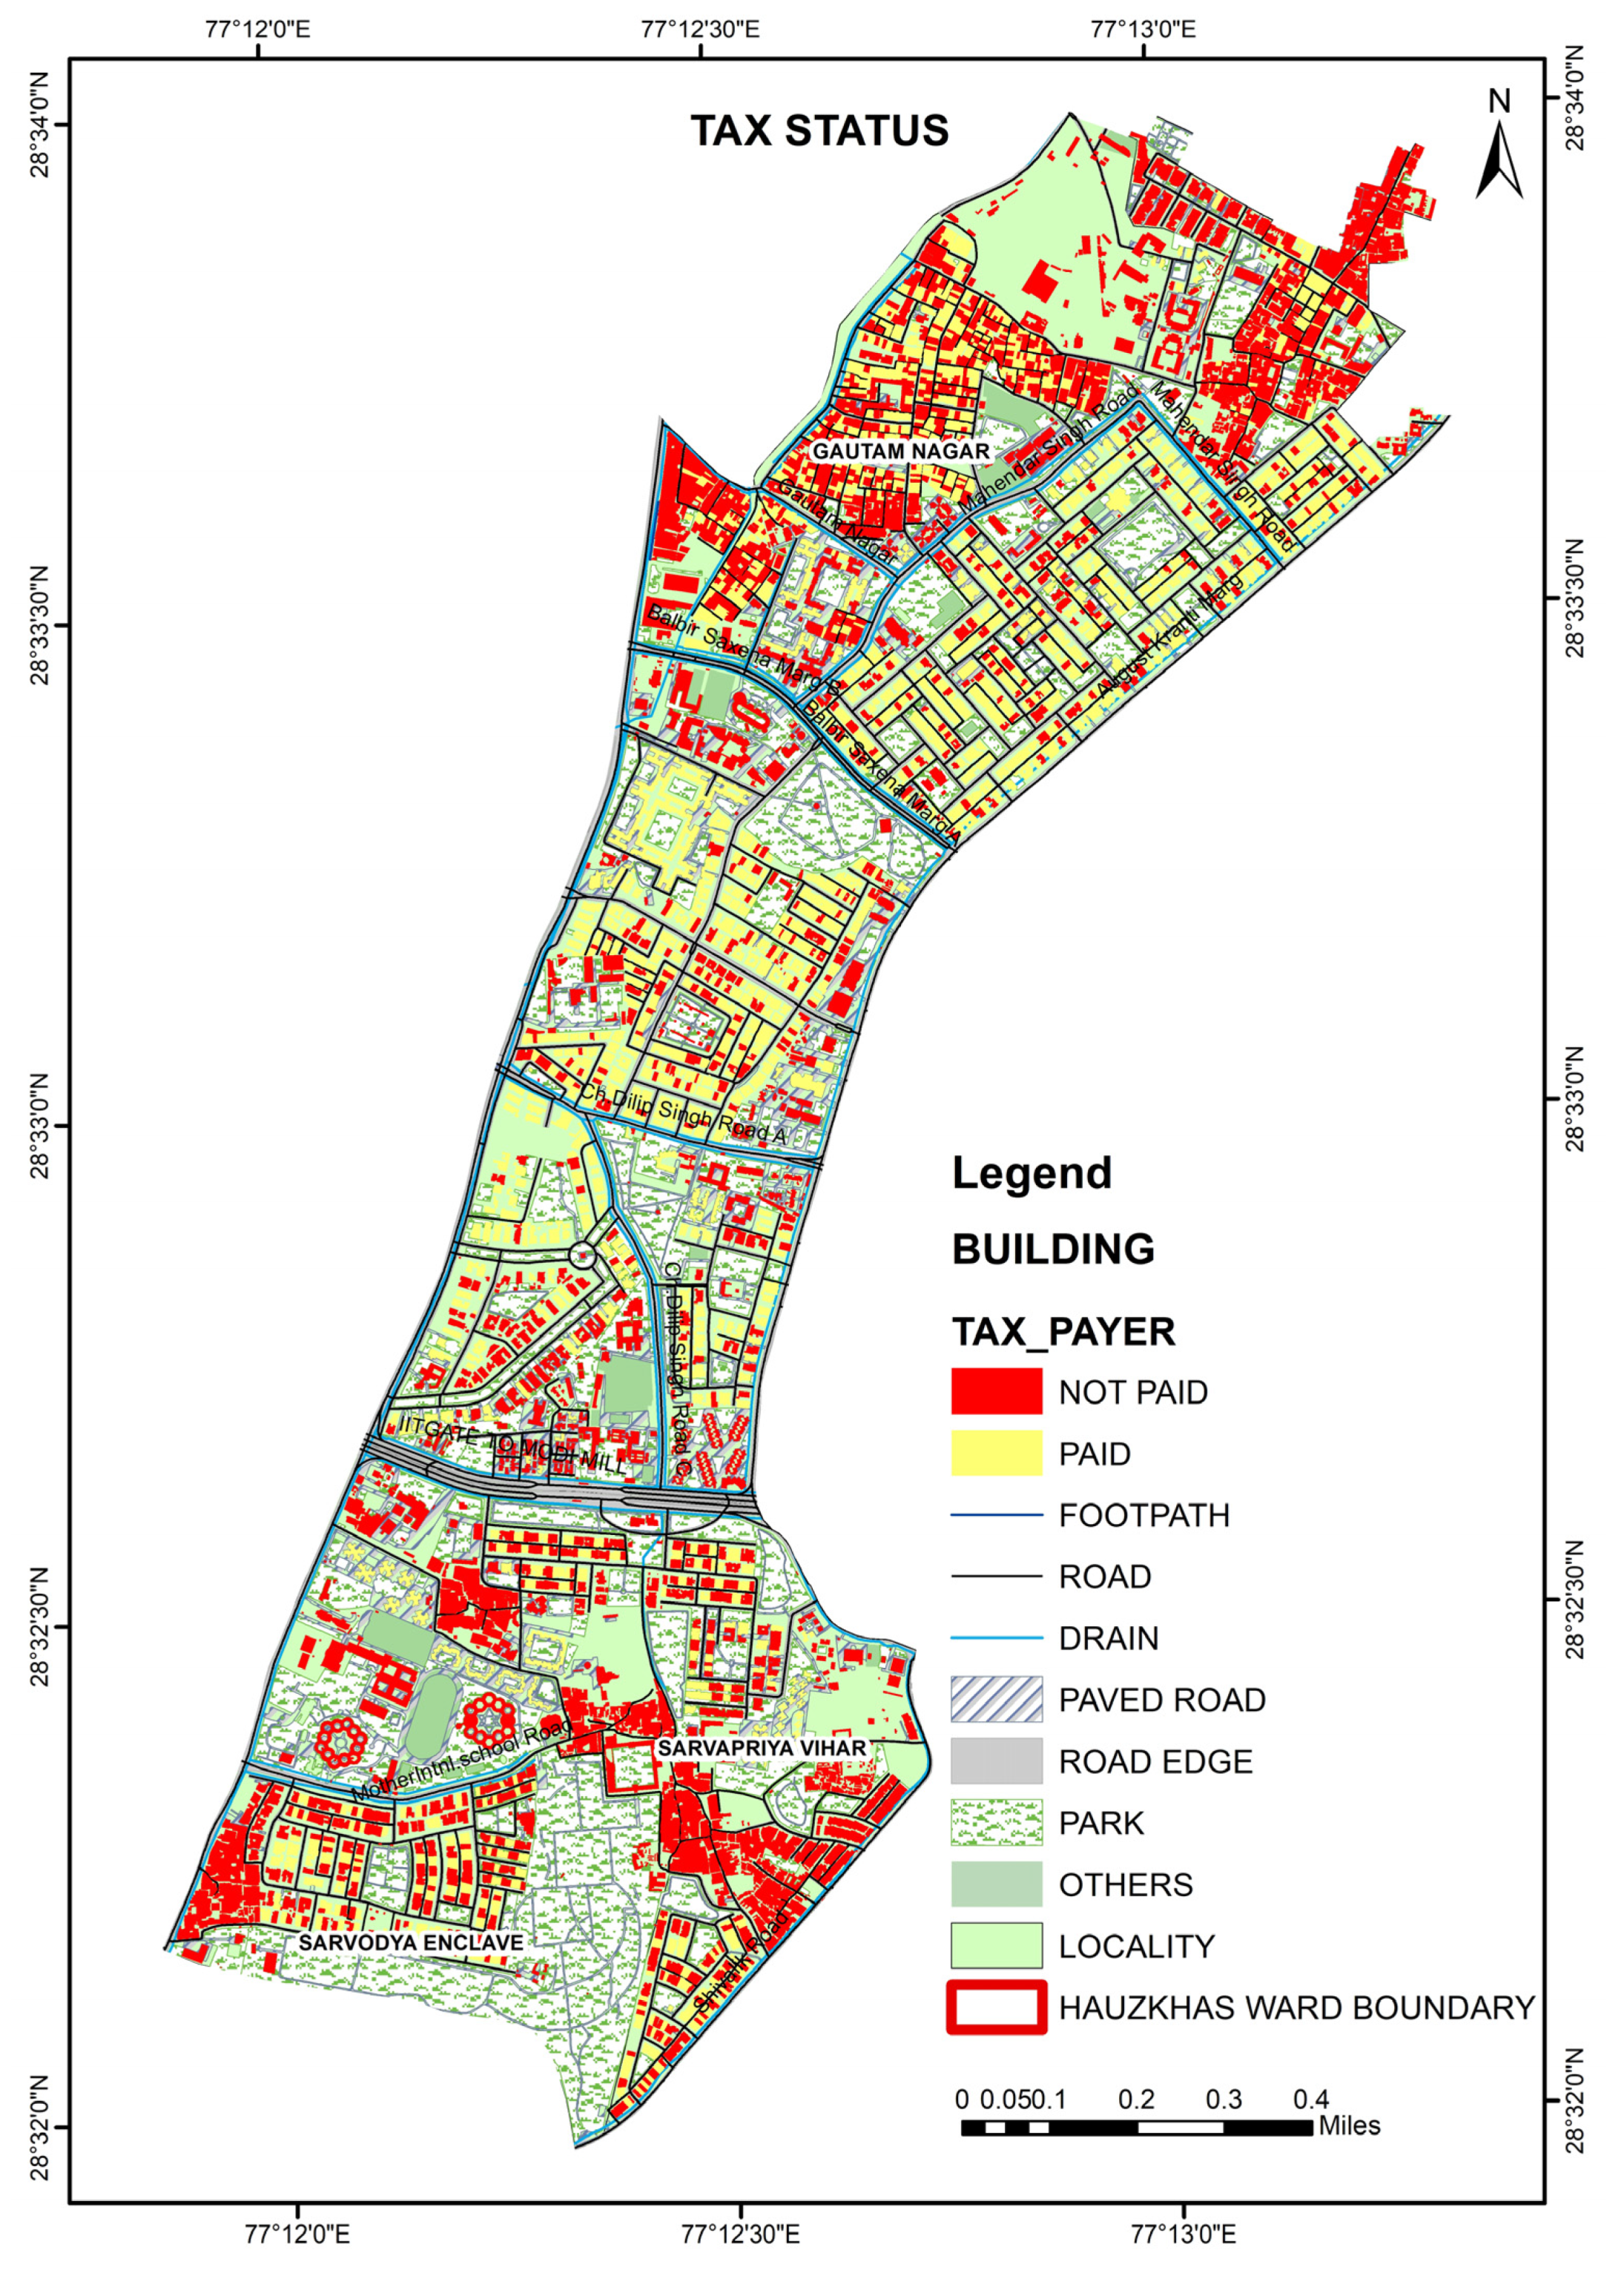
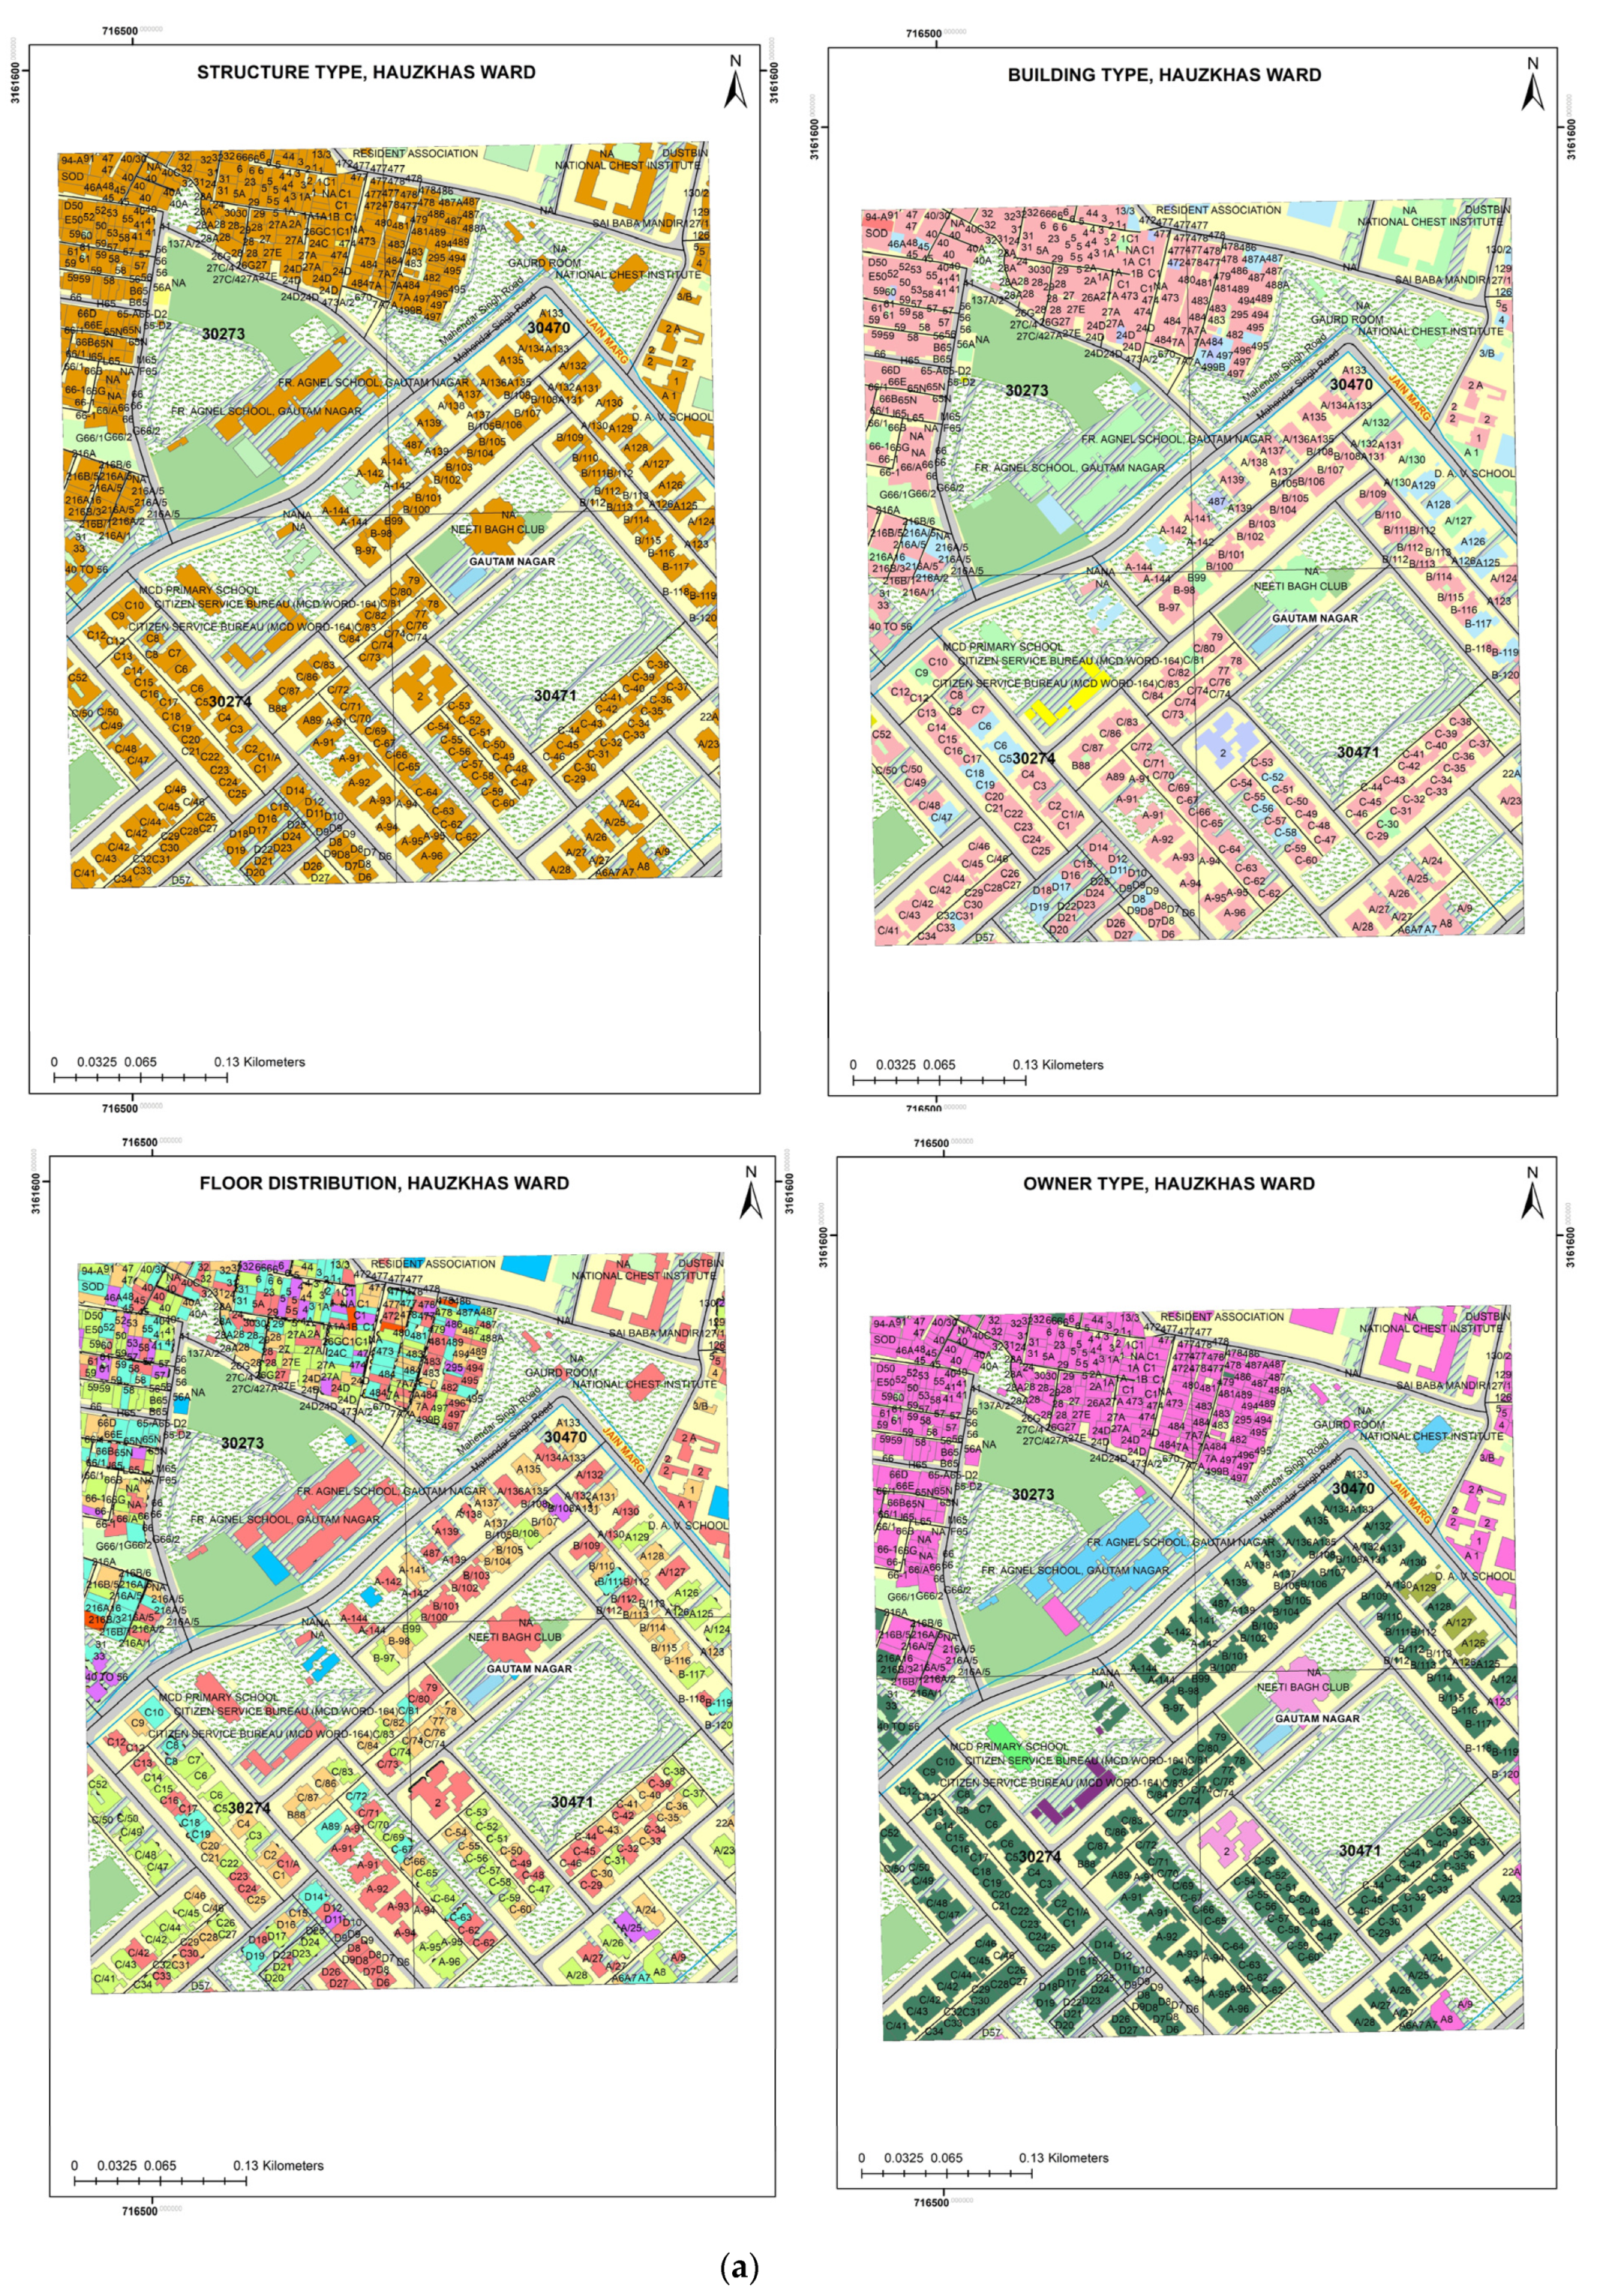
3.3. Mapping of Taxpayers Data

There is no regular monitoring of whether property tax has been paid or not. As with the case of property tax, there is no assessment of whether owners make proper property taxes in terms of its factors. In the current system, there are various blockers to identify such defaulters. If any tax has never been paid for any property, then the record of the property does not exist in the database. Even the tax for the property has been paid since property tax payment is a self-assessment method, so to verify the details of property provided by the owner, the only option for a tax inspector is ground verification (Figure 8).
Using the spatial digital property database would be a systematic and easy process to identify these issues [43]. SDMC has two types of taxpayer data: Online tax data paid by the taxpayer using an online portal and a ledger that has information on those taxpayer data that pay tax offline. Both the data contain information about taxpayers, including addresses and arrears. Joining SDMC taxpayer data with the property database helps bring out the required quality for developing an application that includes correlation and computerization of owner details and tax-paid history on the spatial platform to visualize the property from all aspects. After spatial joining and data sorting, analysis is done on each record to identify the status based on criteria, i.e., tax Paid and Not Paid (Figure 8). The final analysis result will be colony-wise sorted spatial data with information of property details on the ground and given by the owner concerning its tax history.
The amount of money collected from property tax in India is currently low. Its revenues currently account for just 0.2 percent of India’s GDP, but it accounts for 3 to 4% of GDP in wealthy countries such as Canada and the United States [44]. Even a small increase in revenue from these might help local municipalities significantly grow their infrastructure, perhaps enhancing their development operations. Therefore an efficient property tax system is essential for development at grass-roots levels in India.
In fact, every country works in the field of its economic development and pushes itself to rise with other global powers. This is a joint exercise between the government and the people [45,46]. Taxation is one such system that acts as a feedback loop [47]. The government necessarily has to establish a system that would help the people have enough money to keep up with the rising output scales of any form of taxation. With automation gaining a central stage in India, various options are available for people to participate in the economic cycle. While industrialized countries already have significant shifts in revenues from the taxations, developing countries like India are trying to cope with their pace with the systems like the one discussed in the present study. Various studies suggest that developing countries should deliberately implement automation to maximize the financial outputs [48,49]. This study attempts to address India’s progress in tax automation in the form of spatial information systems, GIS. Existing property tax collection systems do not try to close the gap in the efficient assessment of the taxes [50]. Most crucially, planned GIS-based automation must be implemented through solid regulations that recognize property-specific flexibility and allow reinstatement methods to achieve effective economic returns that ultimately help in restoring ecosystem services [51,52].

4. Conclusions

The study demonstrates the working process of a geospatial database of various information parameters to calculate the property tax in the Hauz Khas ward of South Delhi. A well-organized geodatabase is created with four main types of information databases, building, road, land use, and boundary. Within these, a lot of other parameters, e.g., property address, colony name, category of the colony, no. of the floor, covered area, vacant land area, type of property (residential/commercial), type of occupancy (owner/tenant), type of structure (kaccha, pacca, semi pucca), year of construction and owner type (single/joint) were incorporated aimed at the calculation of property of the study area. For property taxation, there are mainly three steps, i.e., identification of properties to be taxed, accounting and creation of tax based on property parameter, and collection of tax, including arrears. All this information was collected through the image and a door-to-door ground survey to complete this database. The created database will make this process effortless and in time. It also provides control to secure the database and can be backed up to prevent data losses. Again, maintenance and updating of the database are much faster than the current hardcopy data format. It can overlay with any other layer, such as planning the layout of the development area and roads. This database can be used by other administrative divisions and will be easily upgraded by exchanging information of property tax department with other departments. So, the cost can be shared by multiple divisions of government. On the other hand, it will provide a channel for the interaction of citizens and municipalities. Both parties can access the data with different rights of control. Having all information on the property will bring transparency in local taxation. Municipal applications need databases at a large scale for micro-level planning. Digital database creation is the primary and most crucial step towards development. Since the data has been captured on the GIS platform for fieldwork activity and the transfer of multiple attributes of field data, it will act as a powerful tool. Again, for the evaluation and development of colonies, other information on infrastructures such as type of road and drain and governing bodies is vital. This one-time task will be the key to multiple solutions to municipal challenges. This database can systematically store historical, current, and future databases and be utilized for analysis or development. Since there are many GIS platforms, this can be used and accessed through any IT-enabled GIS application.

Author Contributions

Conceptualization, A.S., S.K. and G.M.; methodology, S.K., S.K.S. M.F.; software, A.S., S.K., S.K.S., G.M., B.Đ., S. and N.K. validation, A.S., G.M. and M.F.; formal analysis, A.S.; investigation, A.S., S.K., S.K.S., G.M., B.Đ., S. and N.K.; resources, B.Đ., S.; data curation, A.S., and G.M.; writing—original draft preparation, A.S., S.K. and G.M.; writing—review and editing, A.S., G.M., and S.K.S; visualization, A.S. and M.F.; supervision, S.K.; funding acquisition, B.Đ. All authors have read and agreed to the published version of the manuscript.

Funding

This research received no external funding.

Data Availability Statement

Data available upon request from the authors.

Acknowledgments

The authors express their gratefulness to the three anonymous reviewers for their valuable comments and suggestions on the earlier version of the manuscript that greatly improved its content and structure. The author G.M. is thankful to Department of Science and Technology, Government of India for providing the Fellowship under Scheme for Young Scientists and Technology (SYST-SEED) [Grant no. SP/YO/2019/1362(G) and (C)].

Conflicts of Interest

The authors declare no conflict of interest.

References

  1. Eckert, J.K.; Goudemans, R.J.; Almy, R.R. Properp Appraisal and Assessment Administration; The International Association of Assessing Otlicers: Kansas City, MO, USA, 1990; p. 6. [Google Scholar]
  2. Dillinger, W. Urban Property Tax Reform: Guidelines and Recommendations. World Bank Urban Management Program Tool #1; World Bank: Washington, DC, USA, 1991. [Google Scholar]
  3. Bahl, R.; Linn, J. Urban Public Finance in Developing Countries; Oxford University Press: New York, NY, USA, 1992. [Google Scholar]
  4. Bahl, R. Implementation Rules for Fiscal Decentralization. Paper Presented at the International Seminar on Land Policy and Economic Development, Land Reform Training Institute, Taoyuan City, Taiwan, 17 November 1998; International Studies Program, School of Policy Studies, Georgia State University: Atlanta, GA, USA, 1999. [Google Scholar]
  5. Corker, L.; Nieminen, J. Improving Municipal Cash Flow—Systematic Land Information Management. In Proceedings of the International Conference on Spatial Information and Sustainable Development, TS 6.1 Economic Values, Nairobi, Kenya, 2–5 October 2001; pp. 1–12. [Google Scholar]
  6. Soeb, P.; Zahari, W.; David, M.; Fazira, S. Property Tax Management Model of Local Authorities in Malaysia Soeb Pawi. Chinese Bus. Rev. 2011, 10, 1–12. [Google Scholar]
  7. Kundu, D.; Ghosh, D. Innovations in property taxation systems in India. In Innovative Land and Property Taxation; Sietchiping, R., Ed.; UN-Habitat: Nairobi, Kenya, 2011; pp. 92–109. ISBN 978-92-1-132407-5. [Google Scholar]
  8. National Institute of Urban Affairs (NIUA). Available online: https://www.niua.org/urban-india/urban-india-2010-jan-jun (accessed on 12 December 2021).
  9. Gupta, R.D.; Garg, P.K.; Arora, M. A GIS Based Decision Support System for Developmental Planning in Dehradun District. J. Indian Cartogr. 2001, 21. [Google Scholar]
  10. Bell, M.E. An Optimal Property Tax: Concepts and Practices. In Proceedings of the Intergovernmental Fiscal Relations and Local Financial Management, Almaty, Kazakhstan, 17–21 April 2000. [Google Scholar]
  11. Mathur, O.P.; Thakur, D.; Rajadhyaksha, N.; Bahl, R. Urban Property Tax Potential in India; National Institute of Public Finance and Policy: New Delhi, India, 2009. [Google Scholar]
  12. Stylianidis, E.; Roustanis, T.; Karanikolas, N. A Geographical Information System for Real Estate (GEOVAL) BT—Location Based Services and TeleCartography II: From Sensor Fusion to Context Models; Gartner, G., Rehrl, K., Eds.; Springer: Berlin/Heidelberg, Germany, 2009; pp. 317–329. ISBN 978-3-540-87393-8. [Google Scholar]
  13. Arbia, G. Spatial Data Configuration in Statistical Analysis of Regional Economic and Related Problems; Kluwer Academic: Dordrecht, The Netherlans; Boston, MA, USA, 1989; ISBN 0792302842 9780792302841. [Google Scholar]
  14. Tomlin, C.D. Geographic Information Systems and Cartographic Modeling, 1st ed.; Prentice-Hall, Inc.: Englewood Cliffs, NJ, USA, 1990; ISBN 0-13-350927-3. [Google Scholar]
  15. Huxold, W.E. An Introduction to Urban Geographic Information Systems; Oxford University Press: New York, NY, USA, 1991; ISBN 9780195065343. [Google Scholar]
  16. Star, J.; Estes, J. Geographic information systems: An introduction. Geocarto Int. 1991, 6, 46. [Google Scholar] [CrossRef]
  17. Aronoff, S. Geographic information systems: A management perspective. Geocarto Int. 1989, 4, 58. [Google Scholar] [CrossRef]
  18. Fedosin, S.; Yamashkin, S.A. Technological process of solving the problem of modeling the structure of land use based on remote sensing data. Sci. Tech. Bull. Volga Reg. 2014, 6, 356–359. [Google Scholar]
  19. Farooqi, S.A.; Gazali, S. Application of Geographical Information System in Urban Management and Planning: A Case Study of Kulgaon-Badlapur, Dist-Thane, Maharashtra. Int. J. Adv. Remote Sens. GIS 2014, 3, 476–485. [Google Scholar]
  20. Bandyopadhyay, S. Property Tax Reforms in India: A Comparison of Delhi and Bangalore; Georgia State University: Atlanta, GA, USA, 2013. [Google Scholar]
  21. Samadzadegan, F.; Alvand, A.; Abootalebi, A.; Hasanlou, M. Enterprise GIS For Municipalities—A Service Oriented Approach. In Proceedings of the The International Archives of the Photogrammetry, Remote Sensing and Spatial Information Sciences; Leibniz University Hannover Institute of Photogrammetry and GeoInformation: Hannover, Germany, 2008; pp. 1133–1136. [Google Scholar]
  22. Idrizi, B.; Sulejmani, V.; Zimeri, Z. Multi-Scale Map for Three Levels of Spatial Planning Data Sets for the Municipality of Vitia in Kosova. In Proceedings of the 7th International Conference on Cartography and GIS, Sozopol, Bulgaria, 18–23 June 2018. [Google Scholar]
  23. Krishna, G.; Biradar, C. Geo-Big Data in Digital Augmentation and Accelerating Sustainable Agroecosystems. In Data Science in Agriculture and Natural Resource Management; Springer: Singapore, 2022; pp. 221–242. [Google Scholar]
  24. Sibilla, M.; Abanda, F.H. Multi-Criteria Decision Making Optimisation Framework for Positive Energy Blocks for Cities. Sustainability 2022, 14, 446. [Google Scholar] [CrossRef]
  25. Olawumi, T.O.; Chan, D.W. Cloud-based sustainability assessment (CSA) system for automating the sustainability decision-making process of built assets. Expert Syst. Appl. 2022, 188, 116020. [Google Scholar] [CrossRef]
  26. Ahansal, Y.; Bouziani, M.; Yaagoubi, R.; Sebari, I.; Sebari, K.; Kenny, L. Towards Smart Irrigation: A Literature Review on the Use of Geospatial Technologies and Machine Learning in the Management of Water Resources in Arboriculture. Agronomy 2022, 12, 297. [Google Scholar] [CrossRef]
  27. El Hoummaidi, L.A.L.A.; Larabi, A. Dubai Smart Map, A New Tool Enabling Geo-Digital Government, Driven By Innovative Geospatial Thinking For A Smart And Sustainable Dubai. Int. J. Civ. Struct. Environ. Infrastruct. Eng. Res. Dev. 2019, 9, 17–36. [Google Scholar]
  28. Ujjwal, K.C.; Garg, S.; Hilton, J.; Aryal, J.; Forbes-Smith, N. Cloud Computing in natural hazard modeling systems: Current research trends and future directions. Int. J. Disaster Risk Reduct. 2019, 38, 101188. [Google Scholar]
  29. Pretorius, R.W.; Carow, S.; Wilson, G.; Schmitz, P. Using real-world engagements for sustainability learning in ODeL in the Global South: Challenges and opportunities. Int. J. Sustain. High. Educ. 2021, 21, 1316–1335. [Google Scholar] [CrossRef]
  30. Shah, P. IGiS for Managing Cities Smartly–Urban Geoinformatics. Int. Arch. Photogramm. Remote Sens. Spat. Inf. Sci. 2021, 46, 509–513. [Google Scholar] [CrossRef]
  31. Rowland, A.; Folmer, E.; Beek, W. Towards Self-Service GIS—Combining the Best of the Semantic Web and Web GIS. ISPRS Int. J. Geo-Inf. 2020, 9, 753. [Google Scholar] [CrossRef]
  32. Miloudi, L.; Rezeg, K. Leveraging the power of integrated solutions of IoT and GIS. In Proceedings of the 2018 3rd International Conference on Pattern Analysis and Intelligent Systems (PAIS), Tebessa, Algeria, 24–25 October 2018; pp. 1–7. [Google Scholar]
  33. Meraj, G.; Kanga, S.; Kranjčić, N.; Đurin, B.; Singh, S.K. Role of natural capital economics for sustainable management of earth resources. Earth 2021, 2, 622–634. [Google Scholar] [CrossRef]
  34. Shyam, M.; Meraj, G.; Kanga, S.; Farooq, M.; Singh, S.K.; Sahu, N.; Kumar, P. Assessing the Groundwater Reserves of the Udaipur District, Aravalli Range, India, Using Geospatial Techniques. Water 2022, 14, 648. [Google Scholar] [CrossRef]
  35. Kanga, S.; Singh, S.K.; Meraj, G.; Kumar, A.; Parveen, R.; Kranjčić, N.; Đurin, B. Assessment of the Impact of Urbanization on Geoenvironmental Settings Using Geospatial Techniques: A Study of Panchkula District, Haryana. Geographies 2022, 2, 1–10. [Google Scholar] [CrossRef]
  36. Tomar, P.; Singh, S.K.; Kanga, S.; Meraj, G.; Kranjčić, N.; Đurin, B.; Pattanaik, A. GIS-Based Urban Flood Risk Assessment and Management—A Case Study of Delhi National Capital Territory (NCT), India. Sustainability 2021, 13, 12850. [Google Scholar] [CrossRef]
  37. Farooq, M.; Gazali, S.; Dada, M.; Gera, N.; Meraj, G. Forest Fire Alert System of India with a Special Reference to Fire Vulnerability Assessment of the UT of Jammu and Kashmir. In Disaster Management in the Complex Himalayan Terrains; Springer: Cham, Switzerland, 2022; pp. 155–167. [Google Scholar]
  38. Bajjali, W. Geodatabase. In ArcGIS for Environmental and Water Issues; Springer: Cham, Switzerland, 2018; pp. 103–116. [Google Scholar]
  39. Musiaka, Ł.; Nalej, M. Application of GIS Tools in the Measurement Analysis of Urban Spatial Layouts Using the Square Grid Method. ISPRS Int. J. Geo-Inf. 2021, 10, 558. [Google Scholar] [CrossRef]
  40. Farooq, M.; Meraj, G.; Kanga, S.; Nathawat, R.; Singh, S.K.; Ranga, V. Slum Categorization for Efficient Development Plan—A Case Study of Udhampur City, Jammu and Kashmir Using Remote Sensing and GIS. In Geospatial Technology for Landscape and Environmental Management; Springer: Singapore, 2021; pp. 283–299. [Google Scholar]
  41. Meraj, G.; Farooq, M.; Singh, S.K.; Islam, M.; Kanga, S. Modeling the sediment retention and ecosystem provisioning services in the Kashmir valley, India, Western Himalayas. Modeling Earth Syst. Environ. 2021, 1–26. [Google Scholar] [CrossRef]
  42. Cullingworth, J.B. Essays on Housing Policy: The British Scene; Routledge: London, UK, 2021. [Google Scholar]
  43. Rahman, M.M.; Szabó, G. Multi-objective urban land use optimization using spatial data: A systematic review. Sustain. Cities Soc. 2021, 74, 103214. [Google Scholar] [CrossRef]
  44. Tapping the Revenue Potential of Property Tax in India. Available online: https://www.ideasforindia.in/topics/governance/tapping-the-revenue-potential-of-property-tax-in-india.html#:~:text=Property%20tax%20system%20in%20India&text=However%2C%20the%20revenue%20collections%20from,to%204%25%20of%20their%20GDP (accessed on 31 December 2021).
  45. Lucas, G. Remote Sensing and Image Interpretation, 3rd ed.; Lillesand, T.M., Kiefer, R.W., Eds.; Wiley: Chichester, UK, 1994; ISBN 0471-305-758. [Google Scholar]
  46. Sharma, R.K. 8 BRICS in India’s Vision for Global Governance. In India and Global Governance: A Rising Power and Its Discontents; Routledge: London, UK, 2022. [Google Scholar]
  47. Jiang, S.; Li, Y.; Lu, Q.; Hong, Y.; Guan, D.; Xiong, Y.; Wang, S. Policy assessments for the carbon emission flows and sustainability of Bitcoin blockchain operation in China. Nat. Commun. 2021, 12, 1938. [Google Scholar] [CrossRef] [PubMed]
  48. Rocha, C.; Quandt, C.; Deschamps, F.; Philbin, S.; Cruzara, G. Collaborations for Digital Transformation: Case Studies of Industry 4.0 in Brazil. IEEE Trans. Eng. Manag. 2021, 1–15. [Google Scholar] [CrossRef]
  49. Stitzlein, C.; Fielke, S.; Waldner, F.; Sanderson, T. Reputational Risk Associated with Big Data Research and Development: An Interdisciplinary Perspective. Sustainability 2021, 13, 9280. [Google Scholar] [CrossRef]
  50. Maessen, L. Tax Avoidance by Multinational Enterprises and the Current International Tax System: An Ethical Perspectivei. Master’s Thesis, Raboud University, Nijmegen, The Netherlands, 2021. [Google Scholar]
  51. Bera, A.; Taloor, A.K.; Meraj, G.; Kanga, S.; Singh, S.K.; Đurin, B.; Anand, S. Climate vulnerability and economic determinants: Linkages and risk reduction in Sagar Island, India; A geospatial approach. Quat. Sci. Adv. 2021, 4, 100038. [Google Scholar] [CrossRef]
  52. Meraj, G.; Singh, S.K.; Kanga, S.; Islam, M. Modeling on comparison of ecosystem services concepts, tools, methods and their ecological-economic implications: A review. Modeling Earth Syst. Environ. 2022, 8, 15–34. [Google Scholar] [CrossRef]
Figure 1. Location of the study area. (a) India, (b) Delhi Municipal Corporation, (c) Hauz Khas ward.
Smartcities 05 00021 g001
Figure 2. Overall methodology opted for in the present study.
Smartcities 05 00021 g002
Figure 3. Geodatabase structure of the Hauz Khas ward (I).
Smartcities 05 00021 g003
Figure 4. Geodatabase structure of the Hauz Khas ward (II).
Smartcities 05 00021 g004
Figure 5. Reference number (RN) for each building in the Hauz Khas ward.
Smartcities 05 00021 g005
Figure 6. Land use map of Hauz Khas Ward.
Smartcities 05 00021 g006
Figure 7. Information required for calculating the annual tax i.e., structure type, building type, floor distribution, and owner type. (a) Zoomed-in view (b) Overall Hauz Khas.
Smartcities 05 00021 g007aSmartcities 05 00021 g007b
Figure 8. Annual tax payers status in the geodatabase.
Smartcities 05 00021 g008
Table 1. Creation of Building Unique ID.
Map NumberBuilding Reference NumberBuilding IDBUID
302741000013027400001
302742000023027400002
3027481000813027400081
3027482000823027400082
30274112001123027400112
30274113001133027400113
Table 2. Land use/Land cover of Hauz Khas Ward estimates.
Land UseArea (m2)Percentage
Water Body0.020.005
Building92.5729.50
Open land72.3623.06
Others12.113.86
Park72.4823.09
Paved Area26.878.56
Road Edge37.4511.93
Table 3. Rate of Colony Categories for Property Tax Calculation.
CategoryResidential PropertyCommercial PropertyIndustrial Property
A12%20%15%
B12%20%15%
C11%20%12%
D11%20%12%
E11%20%12%
F7%20%10%
G7%20%10%
H7%20%10%
Publisher’s Note: MDPI stays neutral with regard to jurisdictional claims in published maps and institutional affiliations.

