1. Introduction
The traditional method of transport data often used manual traffic survey to identify and analyze traffic patterns. This method suffers from a lack of reliability and accessibility as the amount of data collected is often limited and inadequate. However, the rapid technological development in navigation and communication systems such as GPS, mobile phones and Wi-Fi, etc., has allowed the convenience and availability of detecting large-scale individual travel data and subsequently recording vehicle trajectories [
1]. Various data such as vehicle trajectories, origin–destination, pick-up, drop-off locations, trip length, and duration can be retrieved and analyzed.
The convenience of location-aware technologies was previously implemented widely in hired mobility such as taxi services. Mobility services navigation data proved to be a significant source in exploring various traffic research subjects such as travel patterns and characteristics and traffic models. Yuan et al. [
2] utilized historical taxi trajectories and used a variance–entropy clustering approach to estimate travel time between locations. Alexander et al. [
3] investigated the effects of ridesharing adoption the network-wide traffic congestion by analyzing origin–destination trips from both auto and non-auto travelers that were extracted from mobile phone data. The results suggested that a significant reduction in total vehicle and total travel time were obtained when 50% of the drivers adopted the ridesharing scheme. Qu et al. [
4] developed an adaptive routing method using a probabilistic network model taking into consideration between supply and demand. Using the availability of large data, some researchers analyzed the characteristics of urban mobility to understand overall traffic mobility [
5] better and subsequently provide insights on urban planning [
6]. Some research focuses specifically on defining traffic congestion patterns [
7,
8].
Furthermore, the advancement of technologies has brought out the flexibility of mobility-on-demand to customer’s fingertips through the transportation network companies (TNCs), such as Uber and Grab, by conveniently requesting trips through a personal mobile phone instead of traditional taxi-hailing from the sidewalk. These trips have become the bulk of current transportation services, and records of these trips are stored in the TNC database. Hence, analyzing these data rather than the conventional taxi trips have become essential in visualizing and analyzing traffic demand.
Meanwhile, several kinds of research have also incorporated taxi data in determining pick-up and drop-off (PUDO) zones to integrate taxi operation management better and incorporate the user’s travel pattern analysis. Different clustering methods are often used in determining such hotspots considering the spatiotemporal distribution of taxi traffic data [
9,
10,
11]. However, all of these studies do not consider possible station placement within the area and their possible advantages. By incorporating station placement, the operators will be able to identify prominent PUDO spots and possibly decrease PUDO occurrences in random places. In place of this, optimizing PUDO stations can potentially be deployed to minimize random on-road PUDO events and decrease traffic congestion [
12]. By analyzing current PUDO demand as well as other defining factors such as minimum capacity and walking distance, PUDO stations can be optimized and implemented strategically in improving overall traffic condition in the system.
Therefore, the objective of this study is to identify potential PUDO stations based on the spatial–temporal distribution of traffic patterns in Jakarta, Indonesia using the ride hailing trajectories data provided by Grab-Posisi [
13]. Grab-Posisi is Southeast Asia’s first GPS trajectory dataset. The data were collected in April 2019 with a 1 s sampling rate that consisted of ride hailing’s GPS trajectory data from both developed countries (Singapore) and developing countries (Jakarta, Indonesia).
The PUDO location optimization algorithm was developed using a genetic algorithm and the optimum walking distance and capacity were set as constraints. Analysis of spatial–temporal distribution was carried out to observe the PUDO distribution within the study area. Spatial filtering of the provided area was conducted based on the travel demand distribution. Based on the spatio-temporal travel demand, three PUDO location optimization algorithms were developed; morning peak, off-peak, and evening peak. Spatial clustering was conducted for the initial pre-processing of each PUDO location optimization and the resulting analysis was fed into the genetic algorithm where optimal PUDO locations were then determined by incorporating certain placement requirements. Thus, this paper contributes to the following areas:
The proposed location placement using a genetic algorithm was able to find a prominent location for pick-up/drop-offs for the convenience of both the ride-hailing company and potential riders.
The proposed algorithm used a refined fitness function that consists of the combination of applied constraints of distance and demand coverage by modifying the potential interaction of the gravity model.
The algorithm was able to adapt to find an appropriate placement based on observed demand that assisted in determining the optimum pick-up and drop-off (PUDO) zones to improve taxi and ride hailing operation management.
The remainder of this article is structured as follows. In
Section 2, reviews of multiple studies are examined and described for the motivation of this study. In
Section 3, details of research methodology are presented. The results and conclusion are presented in
Section 4 and
Section 5, respectively.
3. Research Methodology
This research aims to determine the optimal PUDO station’s location, considering distance and capacity constraints, based on traffic demand’s spatial–temporal pattern. The optimization of PUDO stations allows the minimization of customer’s walking distance and possibly reducing the number of PUDO occurrences that may lead to longer travel time. By minimizing walking distance, user convenience is achieved, and the optimum placement of a PUDO station could reduce the number of random PUDOs that will lead to longer travel time.
A genetic algorithm was used to incorporate constraints to the placement problem, allowing greater flexibility in modifying the model constraints and producing optimum solutions by carrying out a global stochastic search process. This study incorporated a modified potential interaction gravity model to quantify the interaction between PUDO stations and demand. Firstly, travel data were extracted and analyzed based on spatial and temporal filtration using the combinatorial software application of RStudio and QGIS [
34,
35]. The data used in this study were provided by Grab and the travel data location provided was in Jakarta, Indonesia. The resulting data created the PUDO trip data within the study area as well as clustering centers for each different trip data. The clustering results were imported to the genetic algorithm as initial input, and optimization was carried out by incorporating walking distance requirements and minimum capacities through a potential interaction gravity model between PUDO stations and assigned demands.
In this study, capacity refers to the demand data served by PUDO stations within its restricted walking distance radius. Unlike traditional traffic demand data collection that were collected by conducting an origin–destination traffic survey, travel demand data analysis is conducted based on quantitative spatio-temporal ride hailing data provided by Grab. This allows for greater precision of the origin–destination location and higher accuracy of traffic demand analysis. Data extraction and analysis were conducted with the use of statistical computing and graphics application, R software and QGIS, an open-source geographic information system for analysis and viewing. Then, the PUDO locations’ algorithm was developed using a genetic algorithm coded in Python coding language.
3.1. Data Extraction
The ride hailing-based trips data generated from Grab were used in this study [
13]. The data consist of 2 weeks (08/04/2019–22/04/2019) of ride hailing-based trips data within Greater Jakarta and the surrounding area. This corresponds to more than 50,000 trips within a 650 km
2 area. Private and personal information is omitted from the data to protect ride hailing user consumer rights. Only necessary trip information was recorded into the file such as trip ID, vehicle mode, trip device used, timestamp, latitude, longitude, speed, bearing and accuracy. This information was recorded in the Parquet file and imported to RStudio for analysis. The data consist of the point of trajectory of recorded trips. These trips were separated based on ID, and PUDO details were obtained based on minimum and maximum trajectory time recorded for each trip ID. Then, the data were further filtered based on the determined trip period (weekdays or weekends and morning peak, off-peak or evening peak). Finally, spatial filtration was performed in QGIS based on the study area.
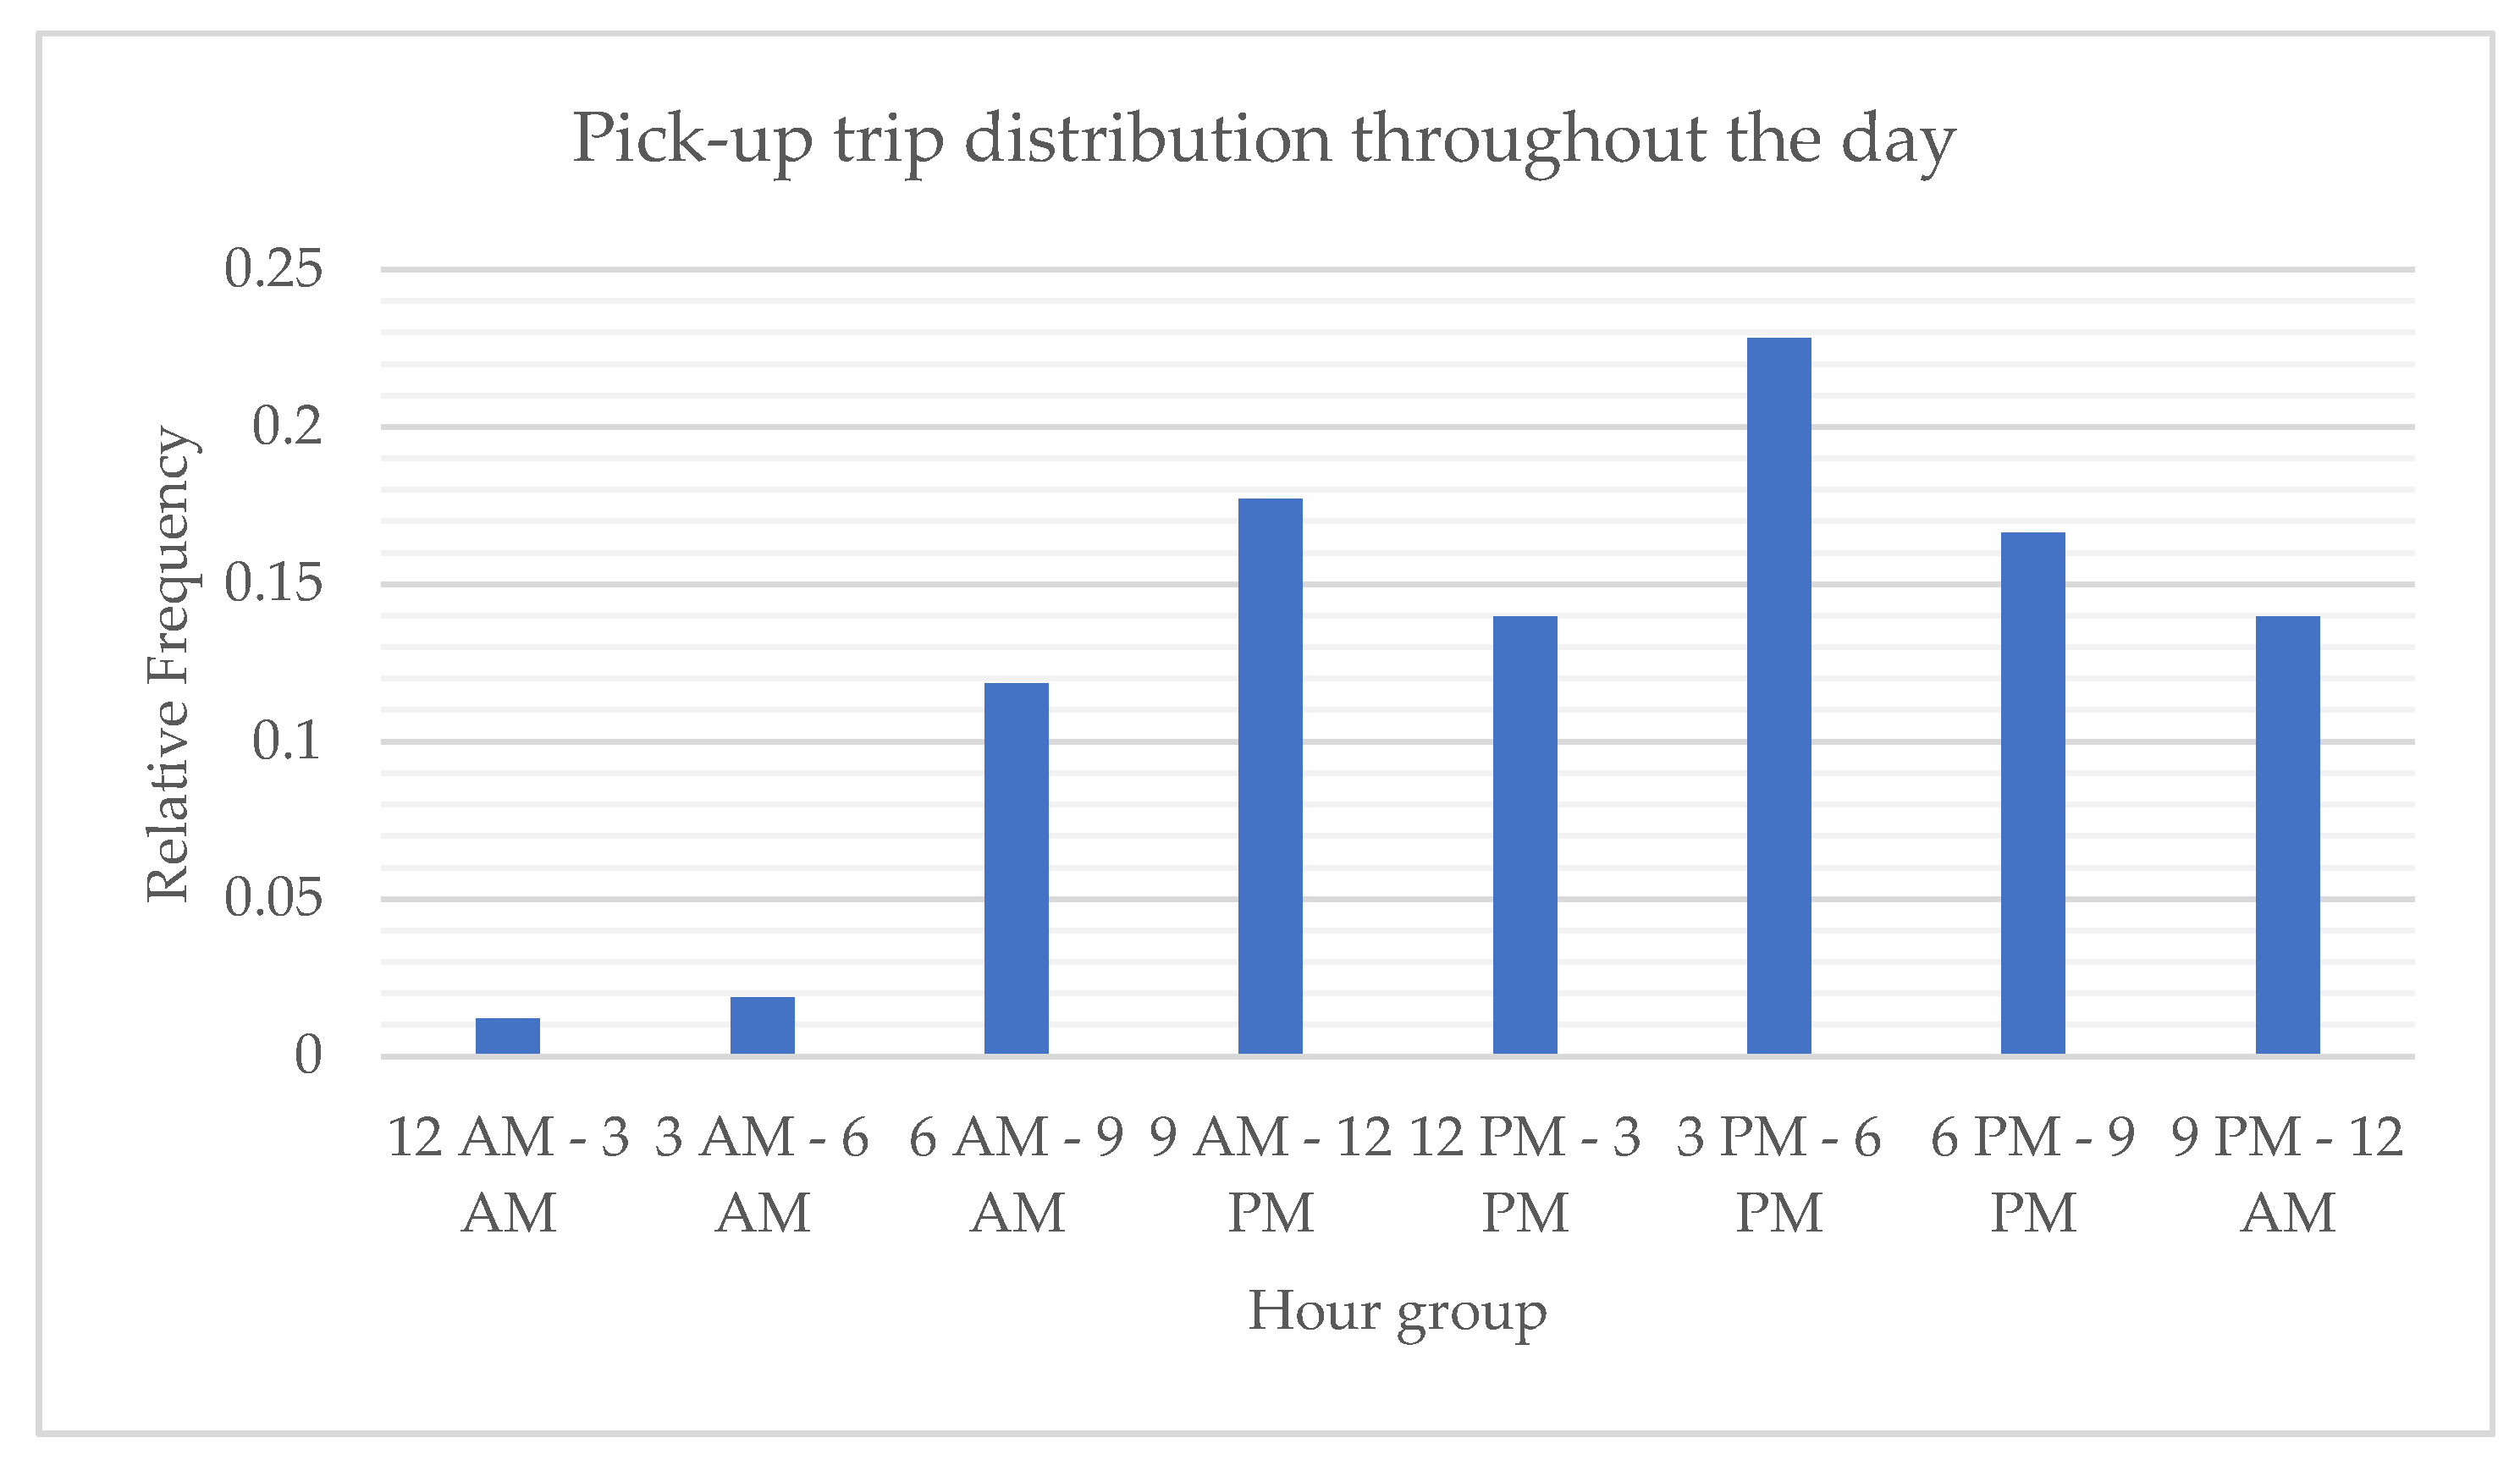
Figure 1 shows the temporal trip distribution throughout the day. To protect the data confidentiality, only the relative frequency of trip demand is presented in this paper. As shown in
Figure 1, the temporal trip demand is fairly distributed within the conventional working time period. It is at its minimum between 12 A.M. and 6 P.M.; however, the trend continues upward from then on until the peak at between 3 P.M. to 6 P.M.
3.2. Chosen Study Area and Data
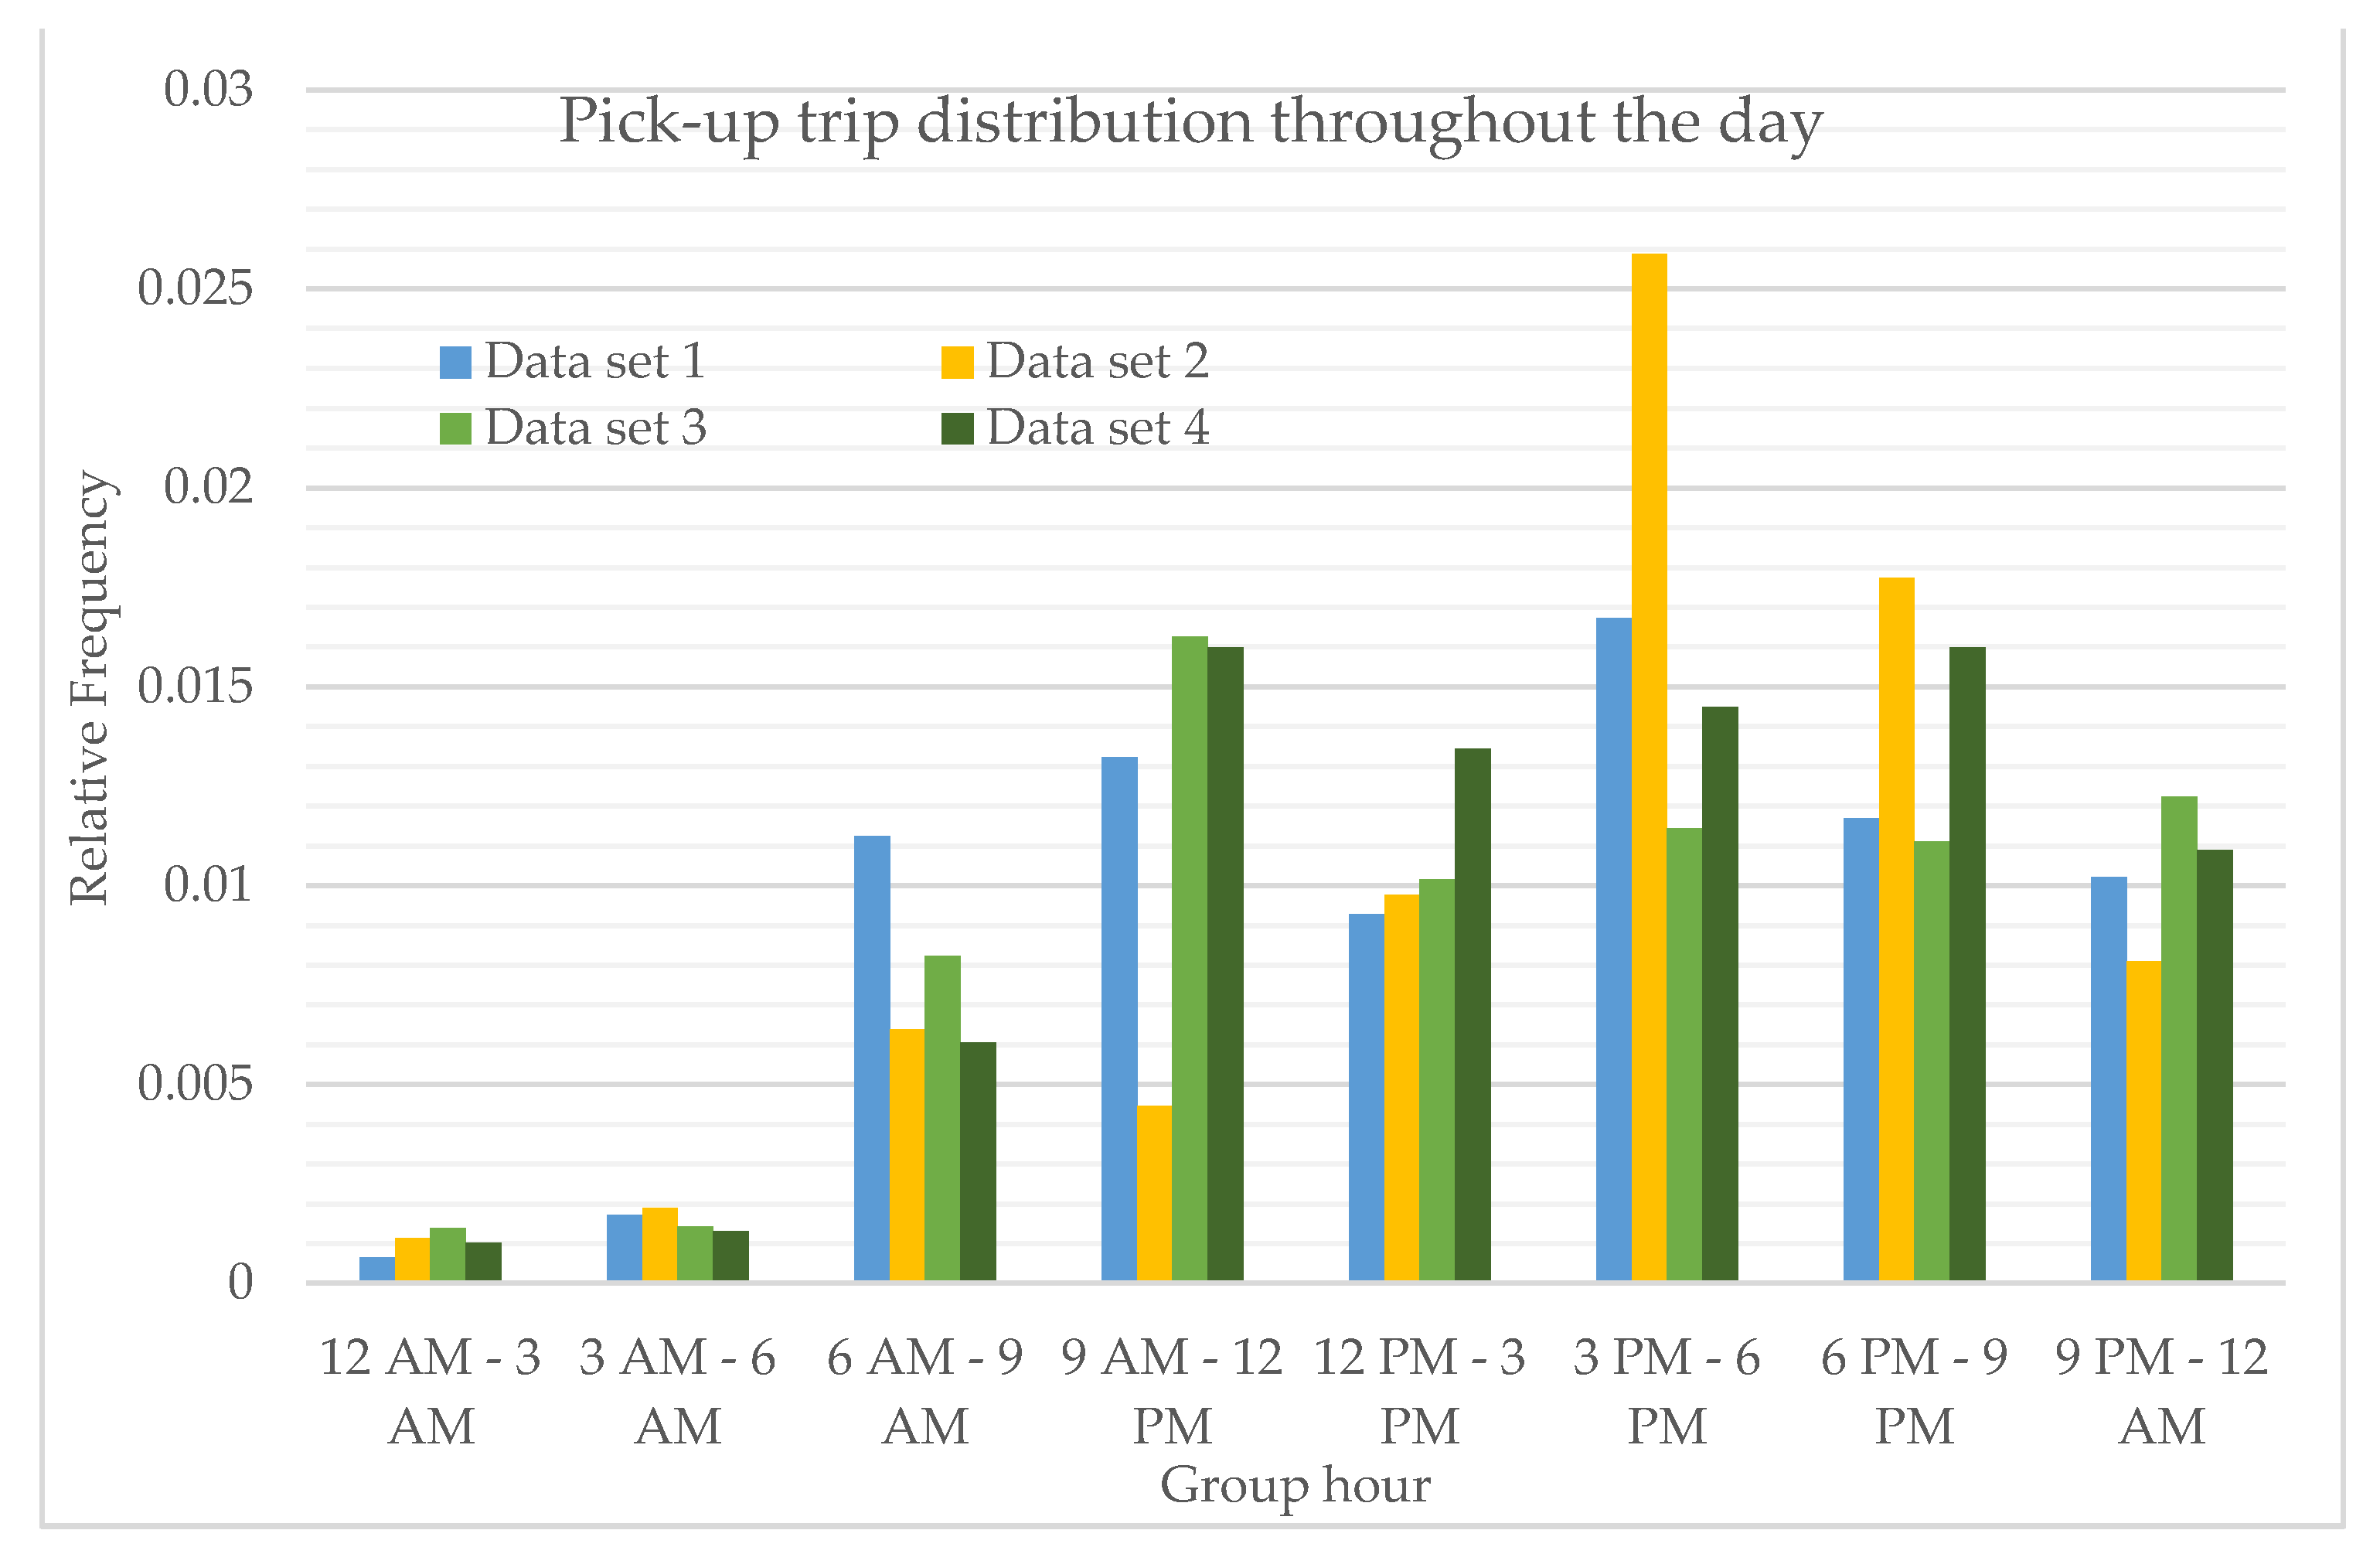
To account for the worst case scenario when trip demand is high, two highest trips in weekdays and weekends were further used to evaluate the effect of temporal trip distribution on optimum PUDO locations. In this case, the chosen data for weekdays are 16/04/2019 and 18/04/2019. For simplification, these two chosen weekday data sets are named data set 1 and data set 2, respectively, while the weekends are 13/04/2019 and 20/04/2019, which are named data set 3 and data set 4, respectively. The temporal distribution can be seen in
Figure 2.
The temporal distribution of the chosen dates are distinctively different from each other. For the weekdays, it can be seen the pick-up distribution on data set 1 is similar towards total hourly distribution shown in
Figure 1, unlike the distribution shown on data set 2. The cause for this distinction on data set 2 may be due to the presence of a public holiday on 19-04-2019 (Good Friday). Since 19-04-2019 is a public holiday, some people might decide to take a leave day on Thursday 18-04-2019 so they may enjoy a long weekend, causing low trip data recorded on the morning peak of 18-04-2019. High trip data recorded on the evening peak of data set 2 may be due to a similar reason of a public holiday resulting in people starting to go out for recreational activities. The pick-up distribution on weekends (data set 3 and data set 4) differs very much from each other as, similar to the explanation for the distinct temporal pick-up distribution on data set 2, 20-04-2019 is still part of the long weekend caused by the public holiday on 19-04-2019, susceptibly making people travel more in the afternoon for leisure activities.
Due to the high irregularity of the temporal pick-up distribution, the study area chosen for this study was located in the combined area of Central and South Jakarta with the time period selected based on previously selected weekday and weekend dates. A further breakdown of trip distribution was carried out based on the morning peak, off-peak and evening peak. The morning peak hours were selected to be from 6 A.M. to 9 A.M. The evening peak period was selected to be from 4 P.M. to 8 P.M., while the off-peak period was from 11 A.M. to 2 P.M. (based on the lunch period).
3.3. Genetic Algorithm
The genetic algorithm is a metaheuristic search algorithm inspired by biological evolution [
36,
37]. The algorithm candidates go through a series of evolutionary processes (selection, crossover, mutation) to converge the algorithm in finding a near-optimum solution. Another important aspect of the algorithm is the fitness value. Each candidate solution has a specific determinant value that represents their overall strength in the evolutionary algorithm. The identification of their overall strength in the population is based on a specific set of requirements determined previously during problem identification. Based on these parametric requirements, a suitable fitness function can be developed that appropriately assesses the candidate’s capability to solve the problem into a single quantitative value, named fitness value. Choosing and developing appropriate fitness functions is critical, as a well-constructed fitness function may substantially increase the chance of finding a solution and reaching higher coverage.
3.3.1. Chromosome Representation
In this work, stations were encoded as coordinates (latitude, longitude) and taken as a gene within a chromosome. The length of a chromosome represented the maximum number of PUDO stations to be generated for the given study area.
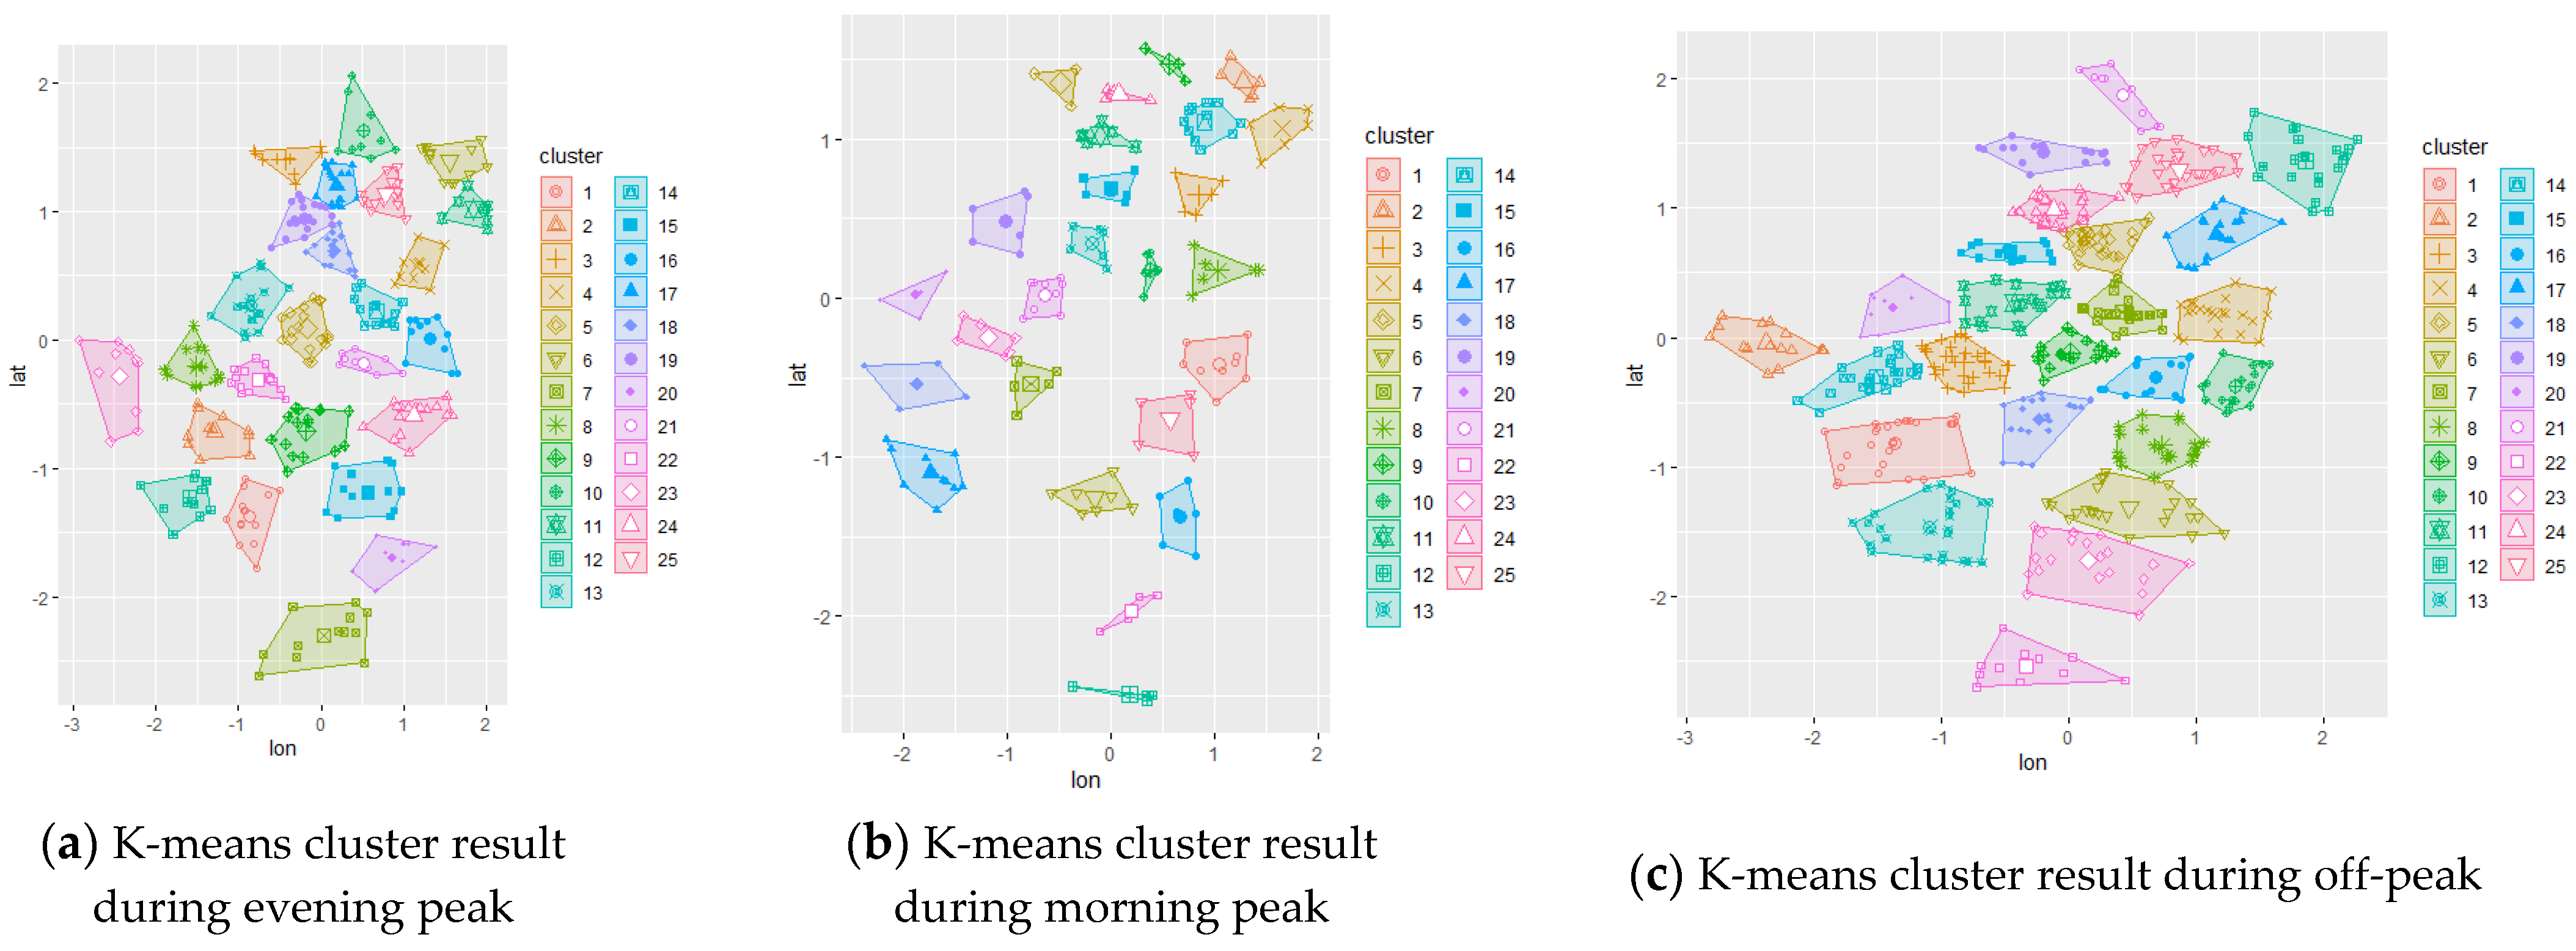
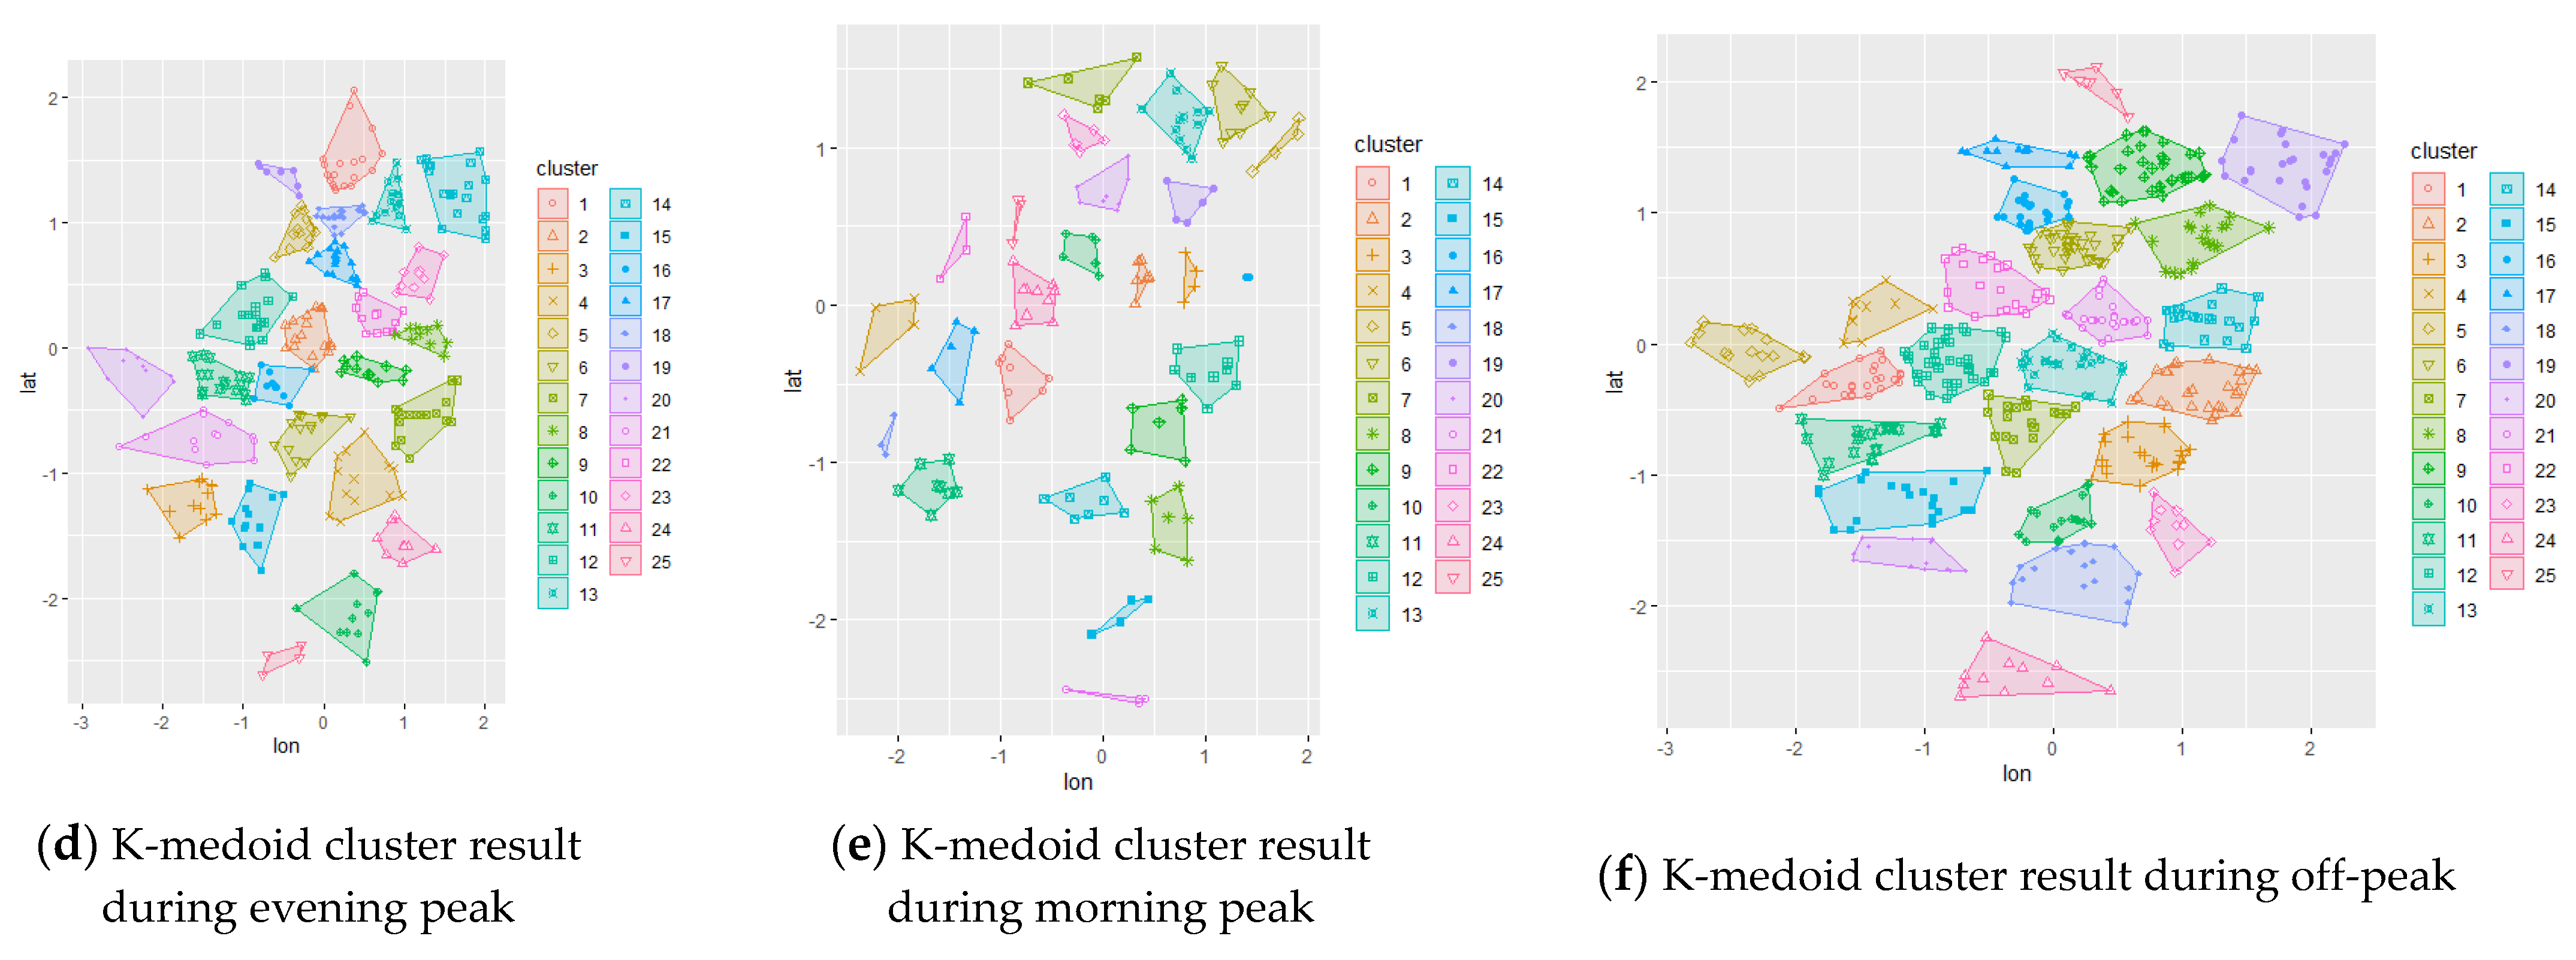
3.3.2. Initial Chromosome and Population
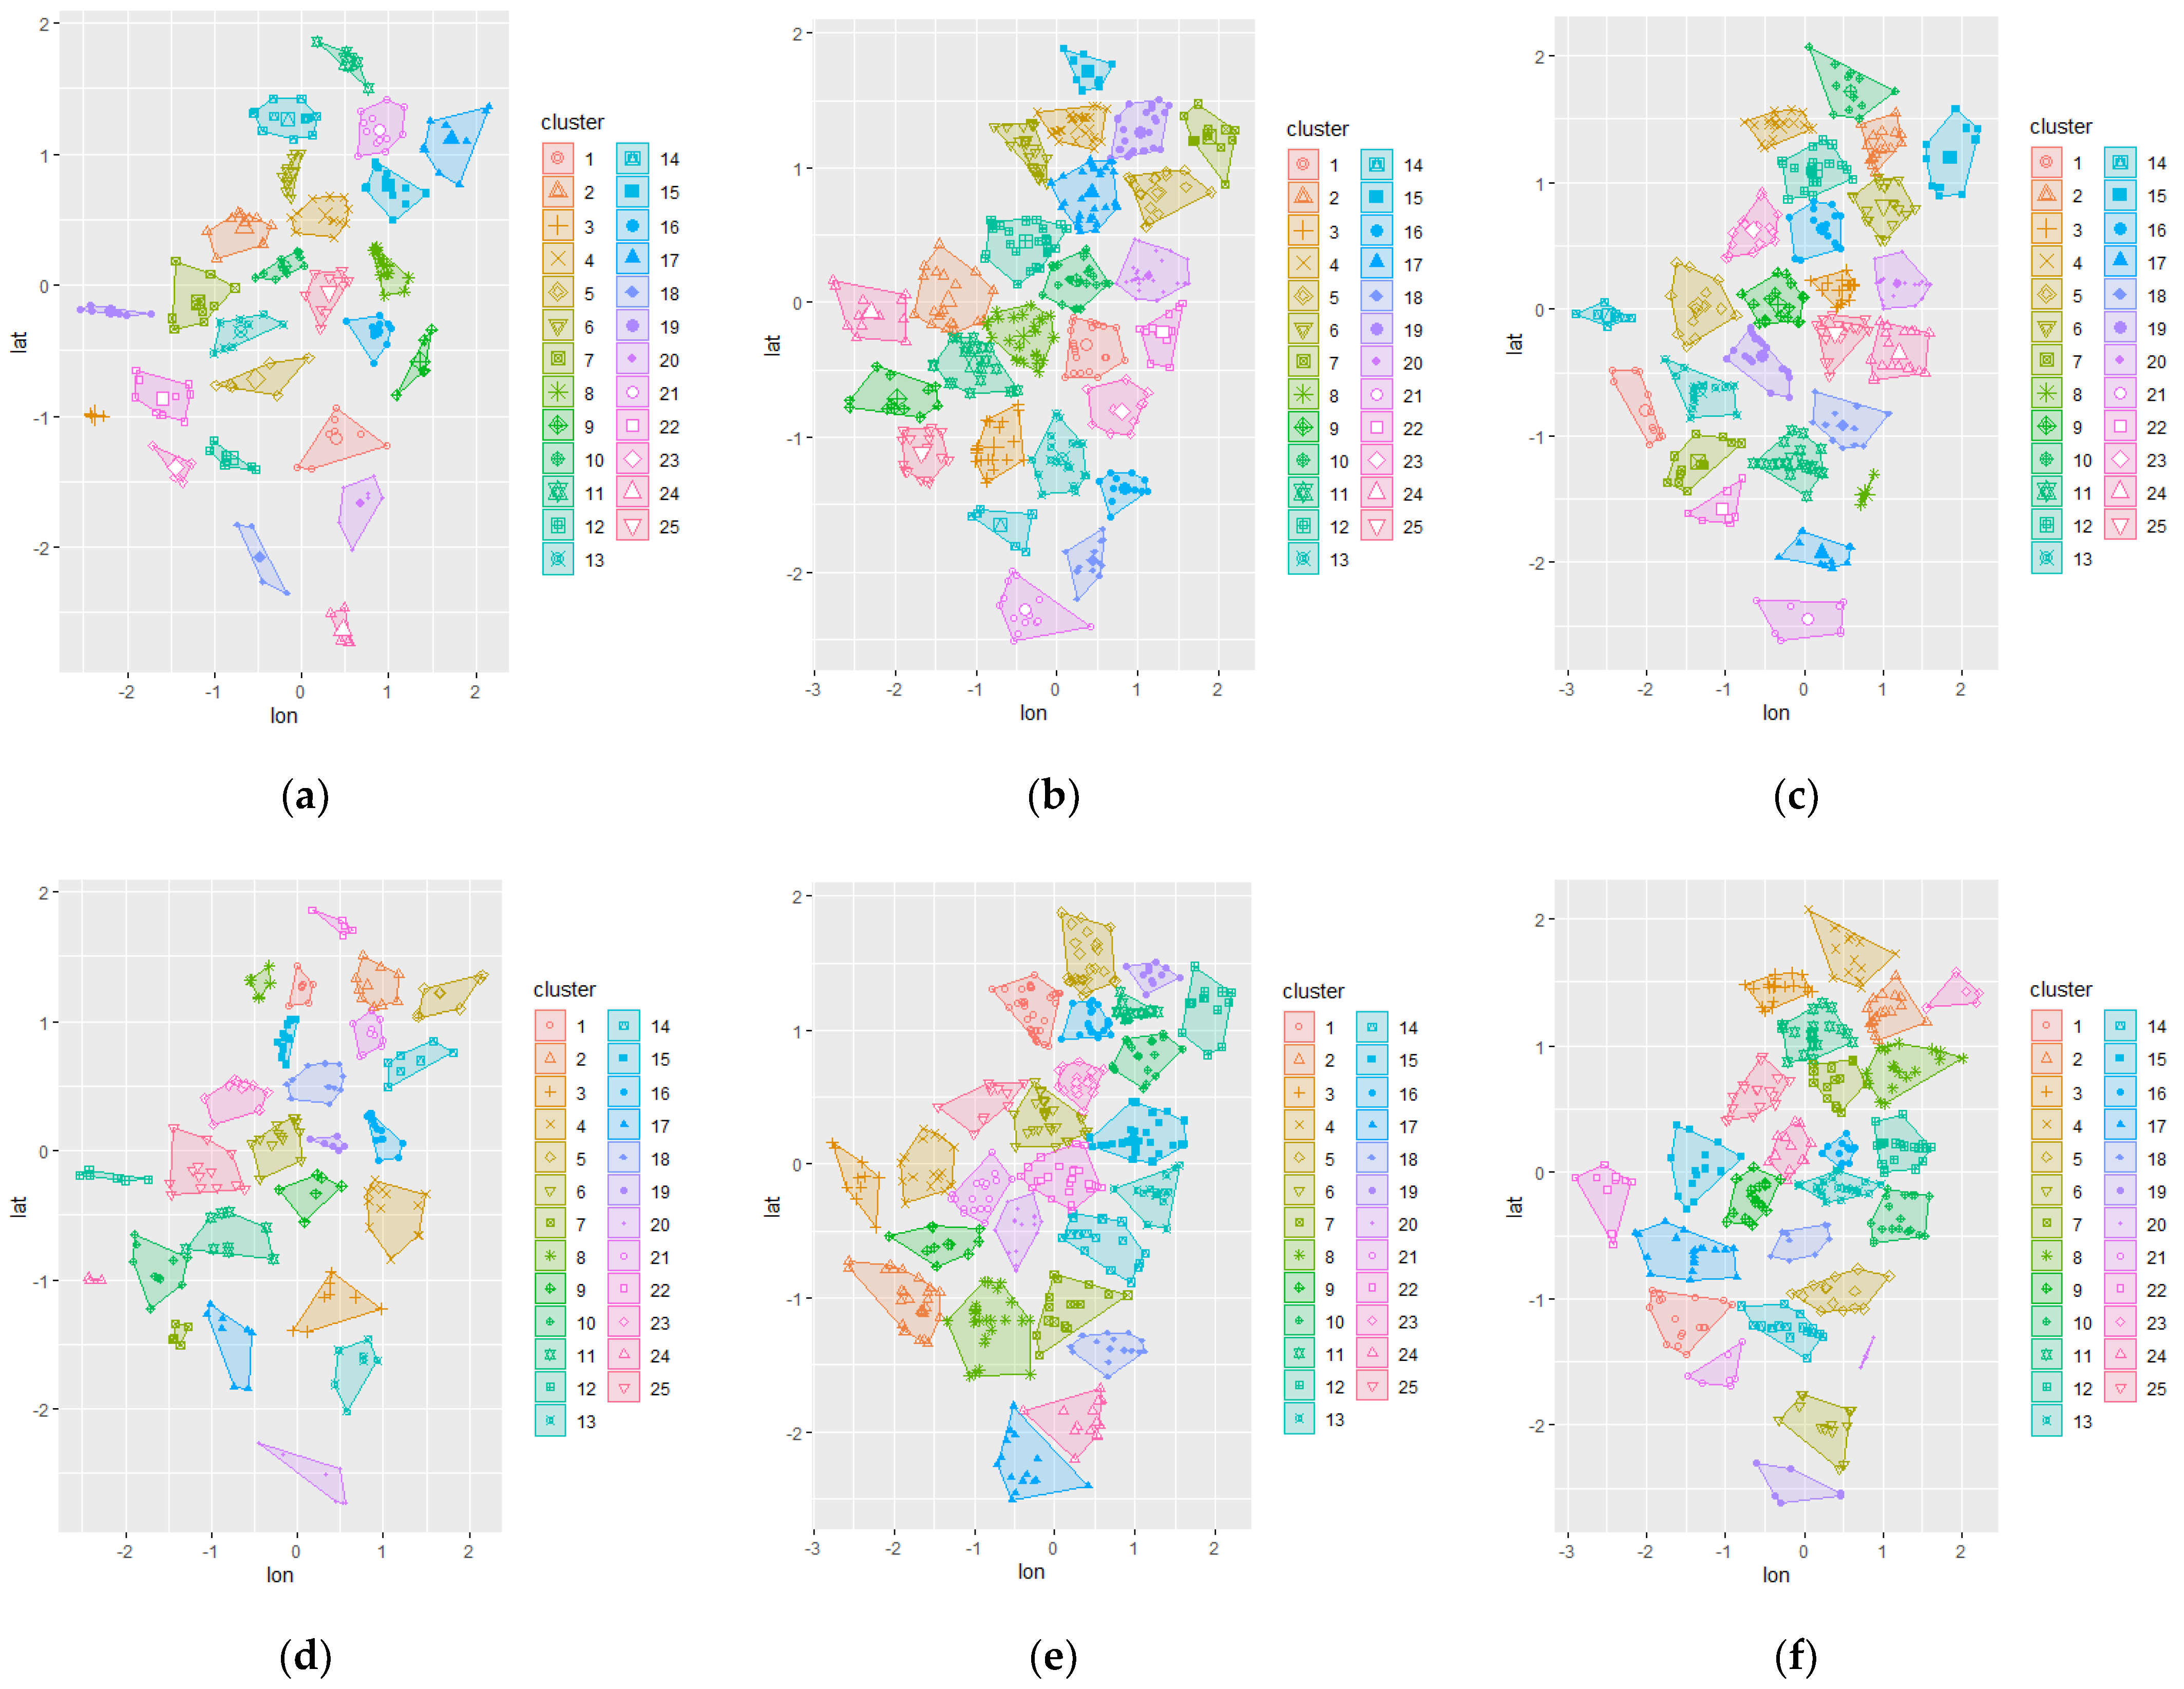
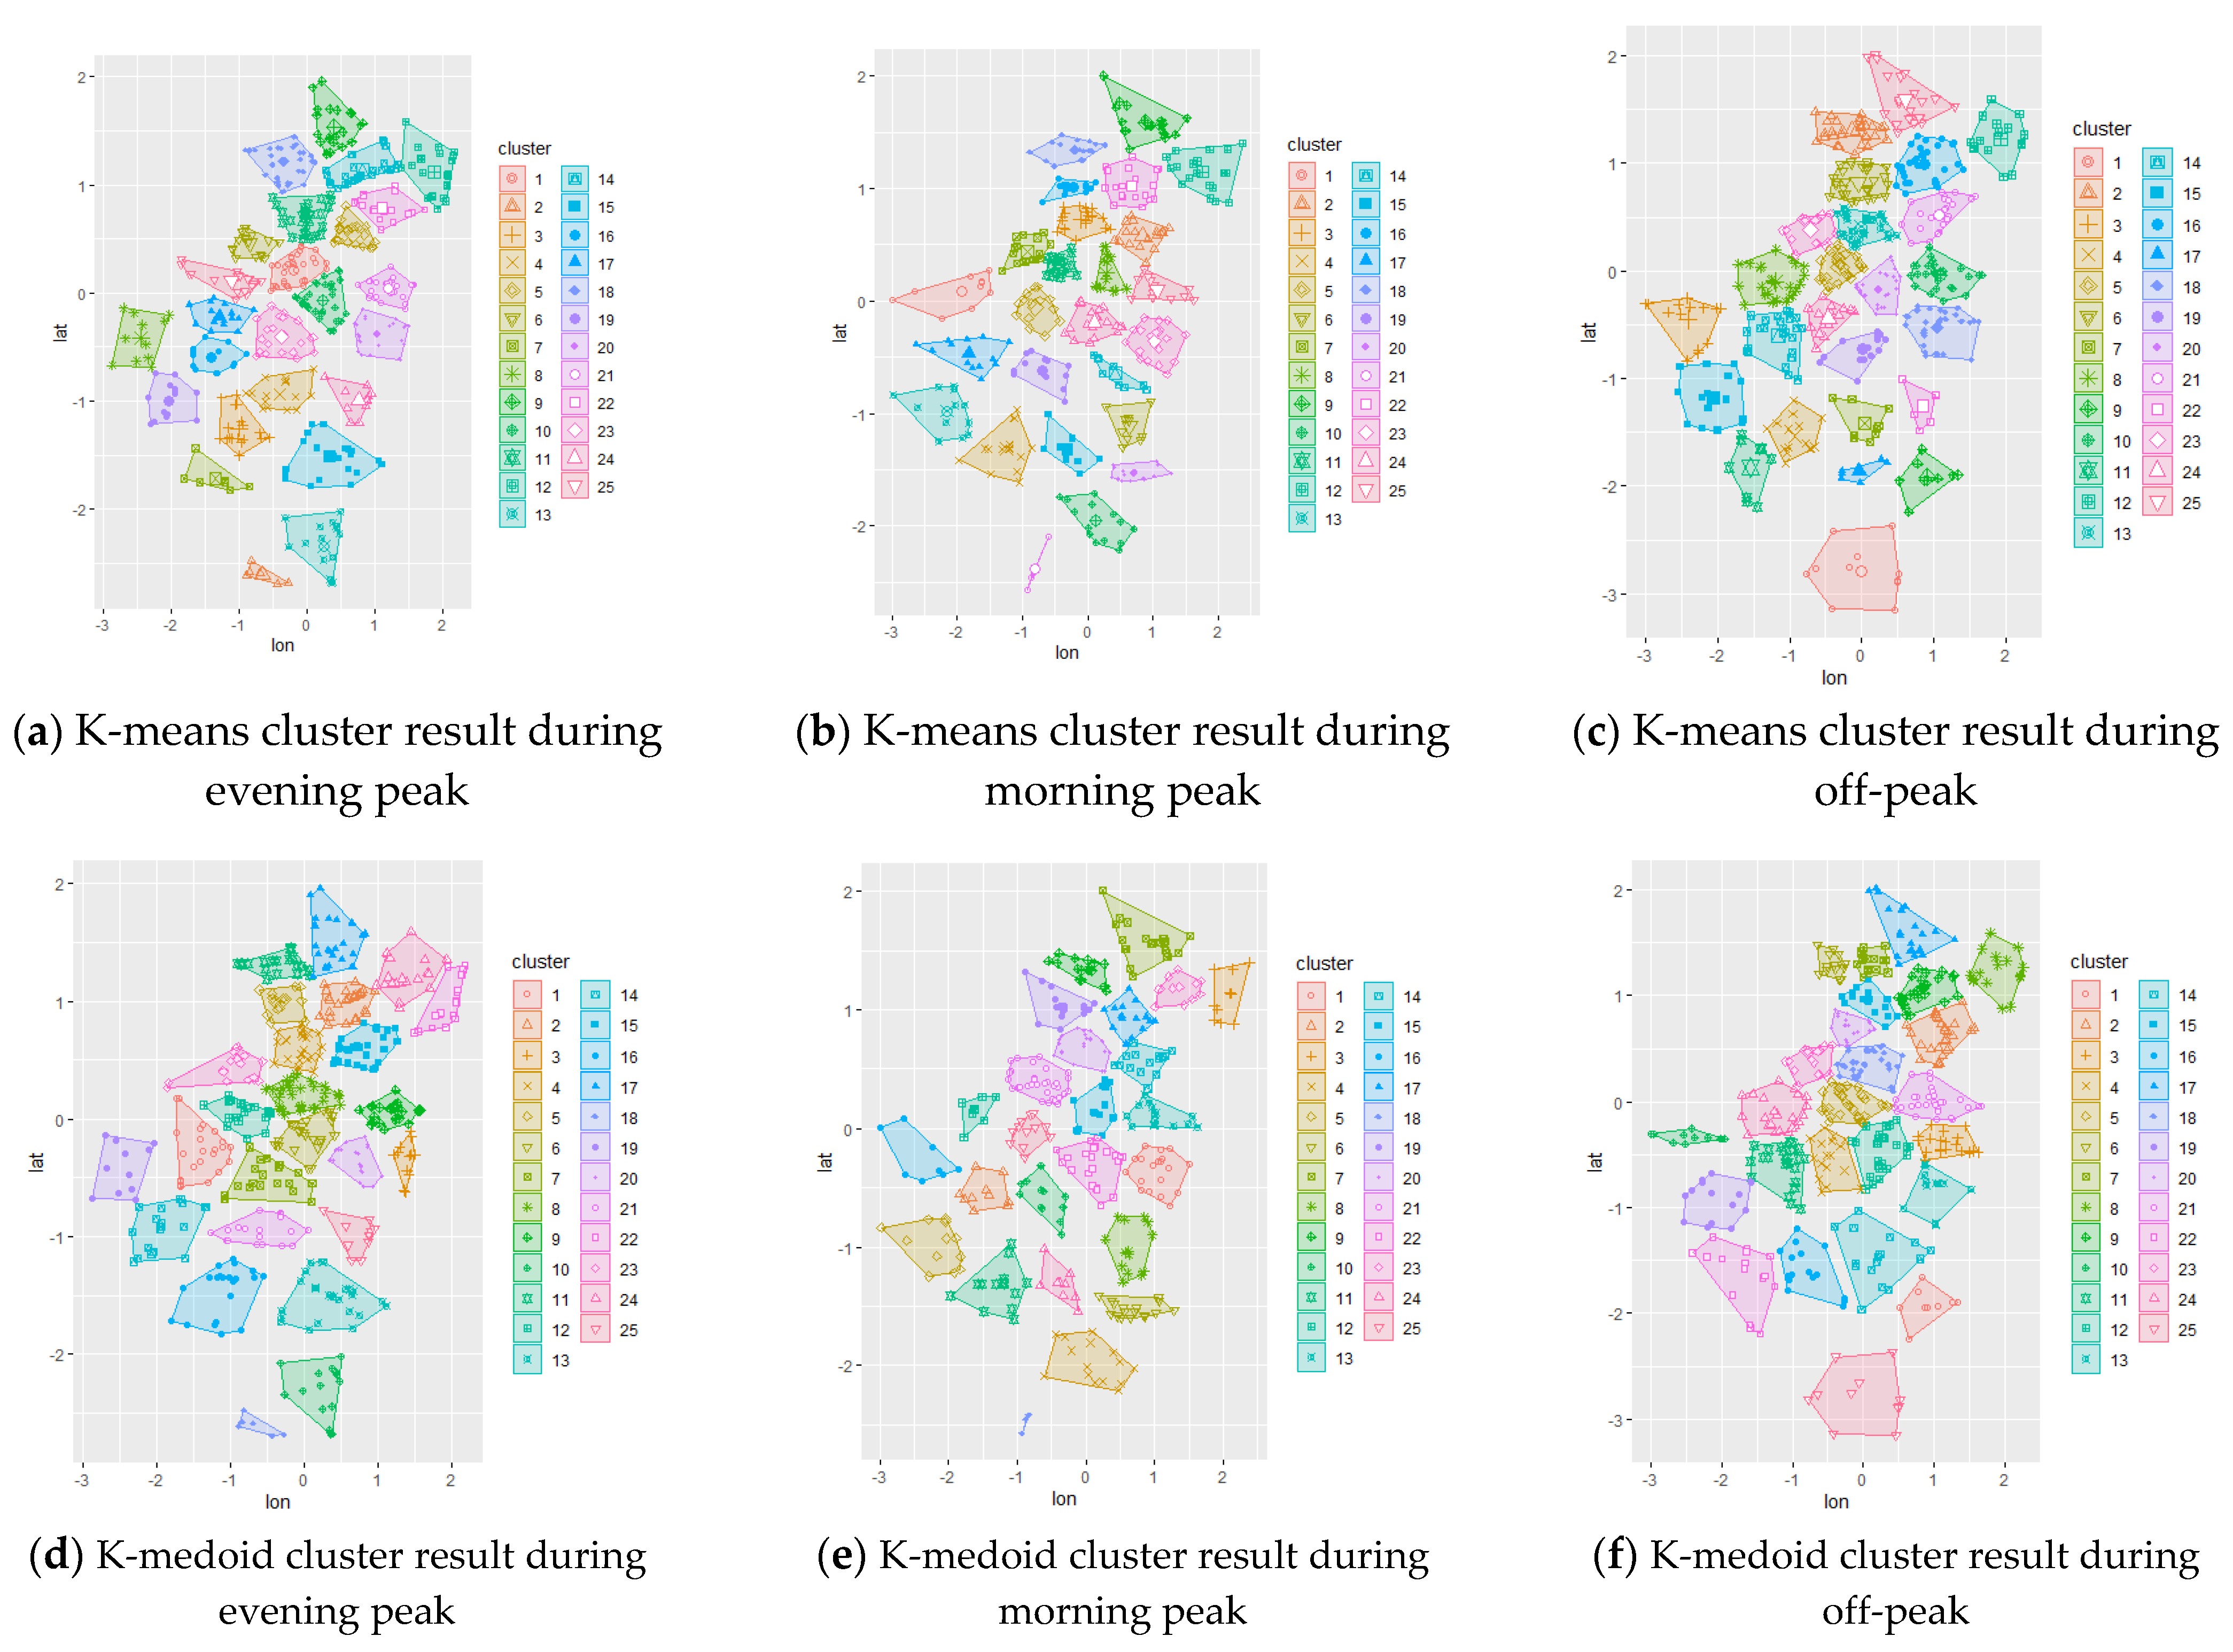
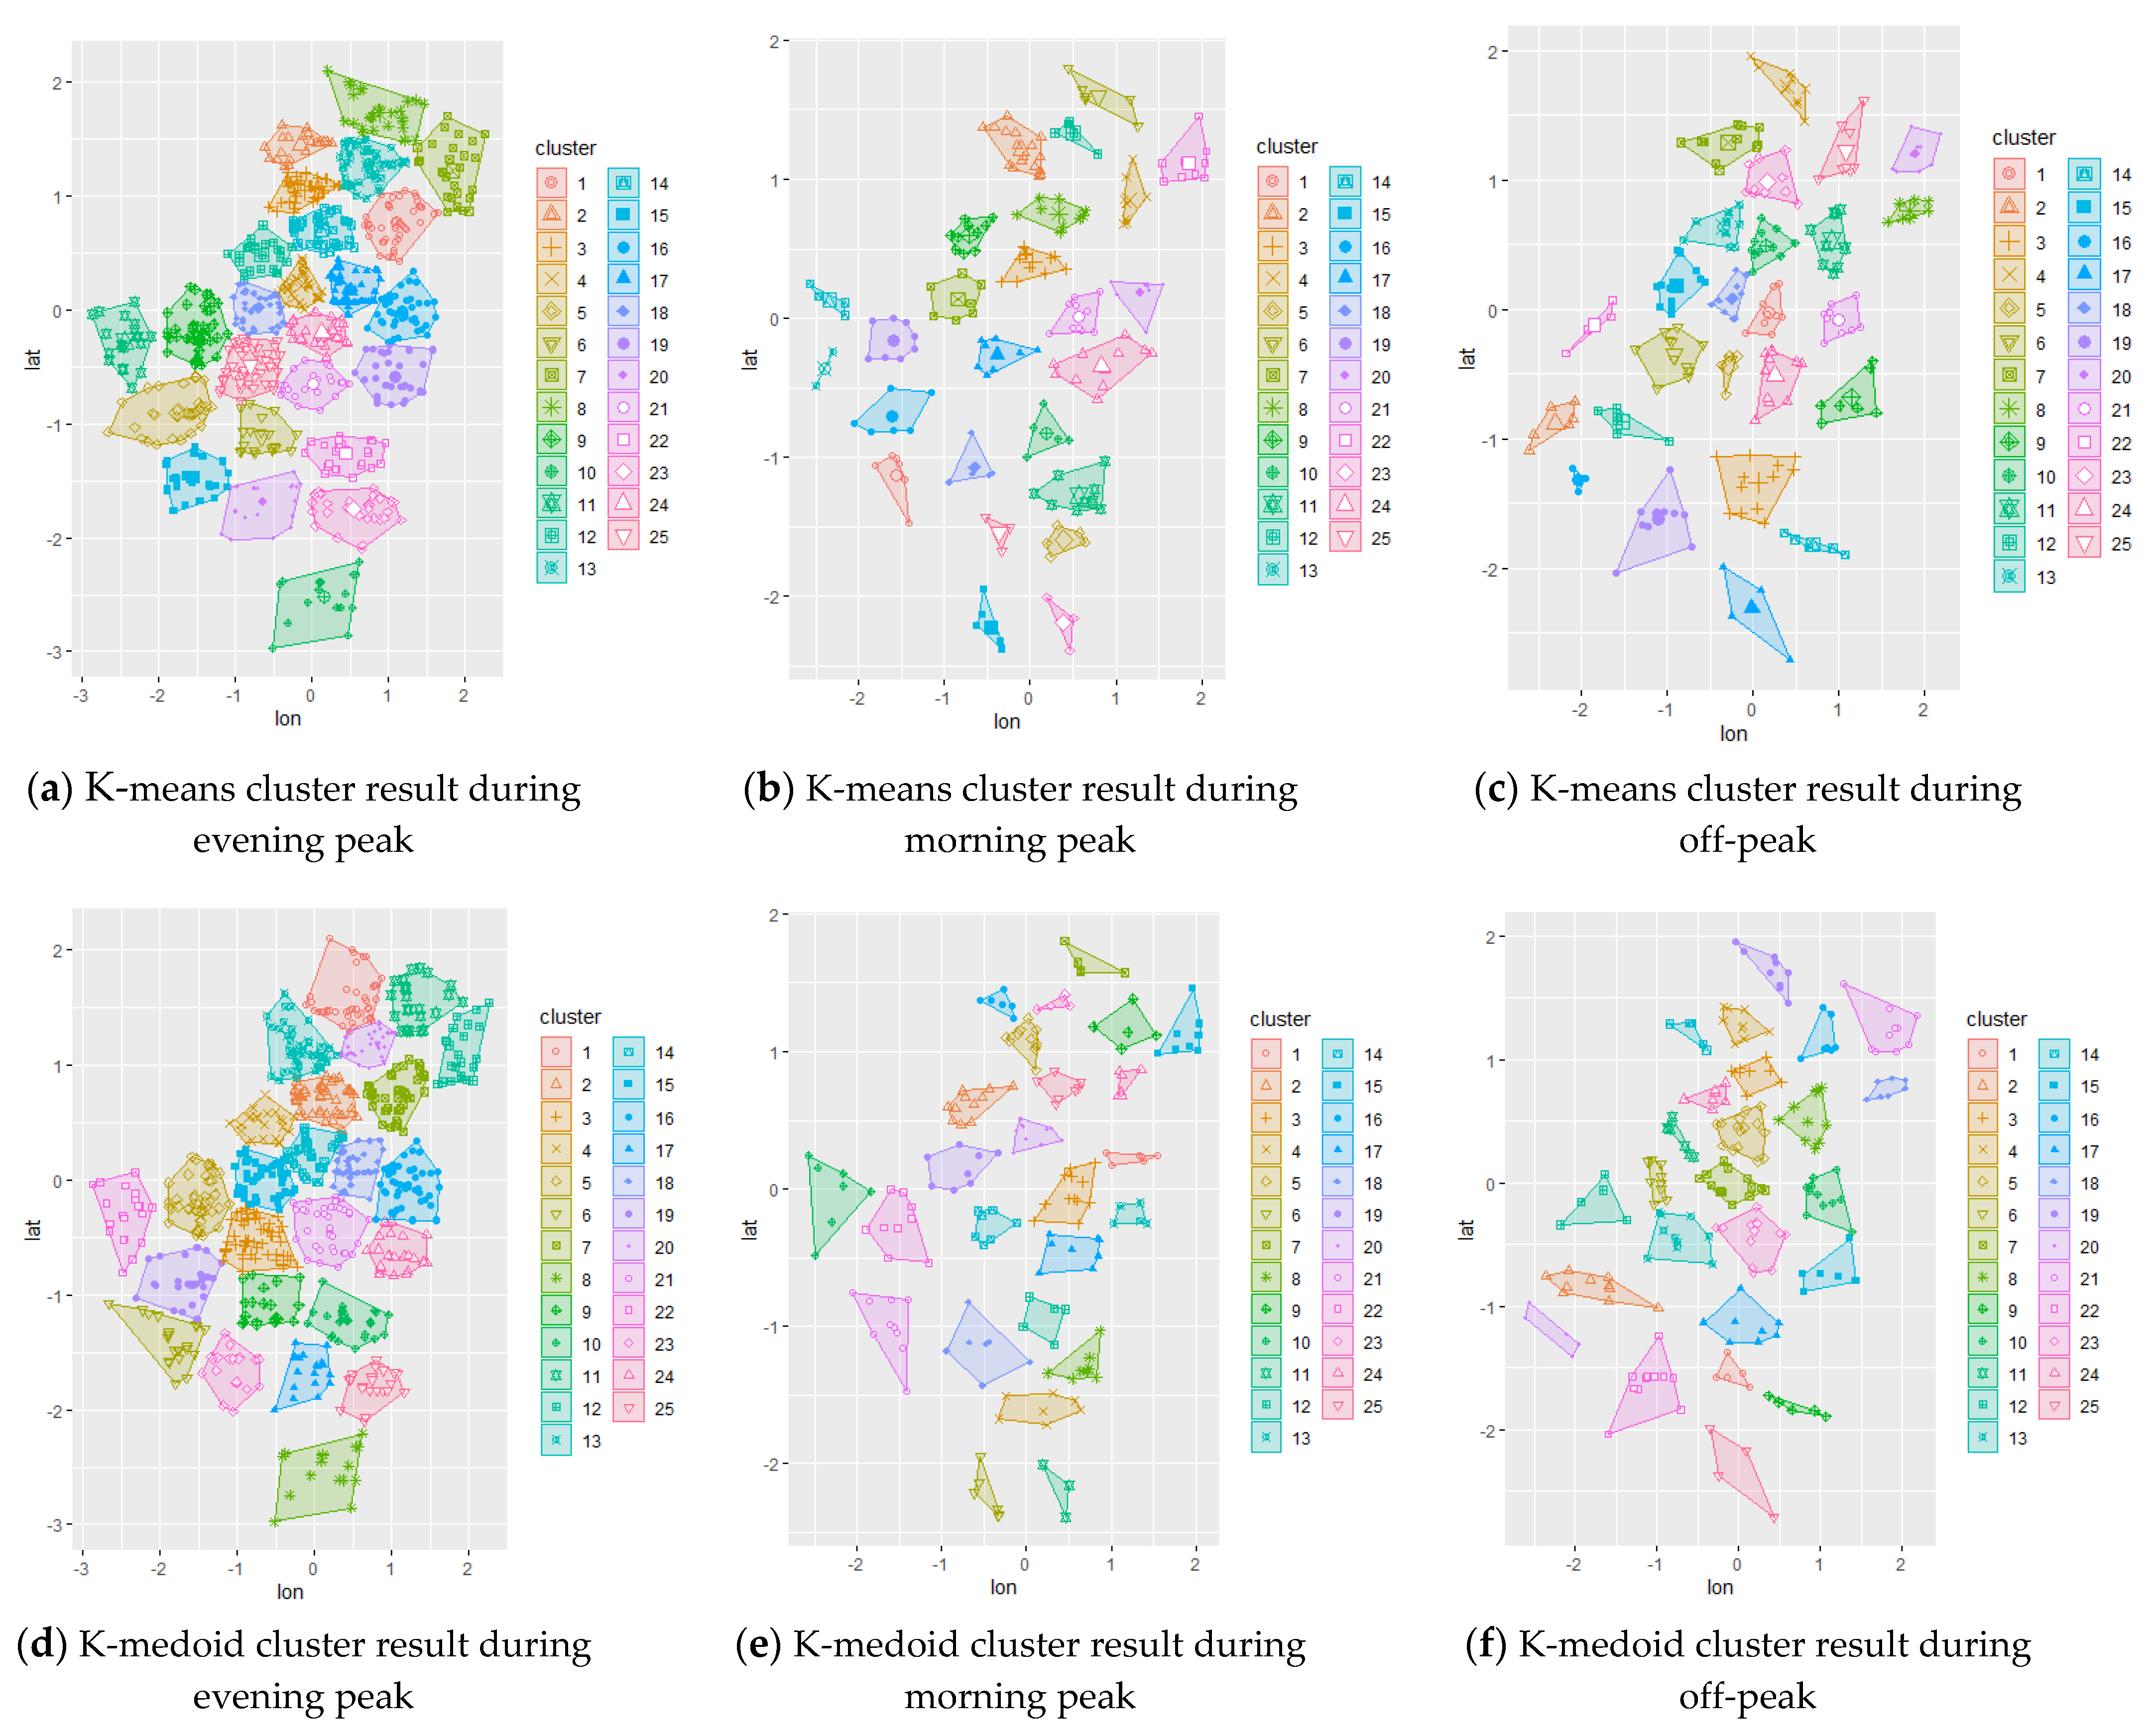
The initial chromosome was set to be the result of different clustering methods applied to the study area. By applying this result, the algorithm was expected to converge faster to the optimum solution while also comparing each initial configuration. The initial representation of the trip demand can be visualized using the clustering technique; hence, spatial clustering techniques via k-means and k-medoid were used to represent the initial chromosome. The resulting clustering are shown in
Figure 3 for the data set 3, while others are presented in
Appendix A. A random initial chromosome was also created for comparison purposes.
3.3.3. Fitness Function
The fitness function consists of the combination of applied constraints of distance and coverage as well as a modified potential interaction gravity model. The potential interaction gravity model is one of three basic spatial interaction models that measure interaction between locations. In this particular model, the interaction of the proposed station needed to be measured against overall demand points within the coverage of that station. The accumulation of demand points assigned to the proposed station was the final fitness value of that station. The algorithm’s objective was to locate the appropriate installation of PUDO stations that maximized the demand points in the study area while considering the walking distance limit and minimum demand point serve per station. Based on those considerations, assumptions were created and listed as follows:
A maximum walking distance of 500 m is established. The 500 m walking distance was suggested a comfortable walking distance in ridesharing studies. If the distance between the demand point and the nearest PUDO station is above the established limit, the demand point will not be serviced.
Minimum demand points serviced by a PUDO station is 5 points in order for the station to be constructed. The minimum of 5 demand point has been selected to ensure that the proposed method can pool and serve the given number of passengers while maintaining the minimum fleet size [
38].
The distribution of a certain time period only allows a small number of stations to be developed. Taking into consideration the size of the study area as well as PUDO distributions, the assumption of maximum 25 stations constructed is implemented in this study.
Not all demand points need to be serviced. The goal is to maximize the demand points, while considering the above constraints.
Therefore, the fitness function of a single station/gene can be determined using Equation (1) subjected to predetermined constraints mentioned previously.
Table 1 shows the notations used in the mathematical formulation.
Once the evaluation of each station was computed, the fitness function of one chromosome was simply then the summation of the fitness function of the individual station/gene.
3.3.4. Selection Procedure
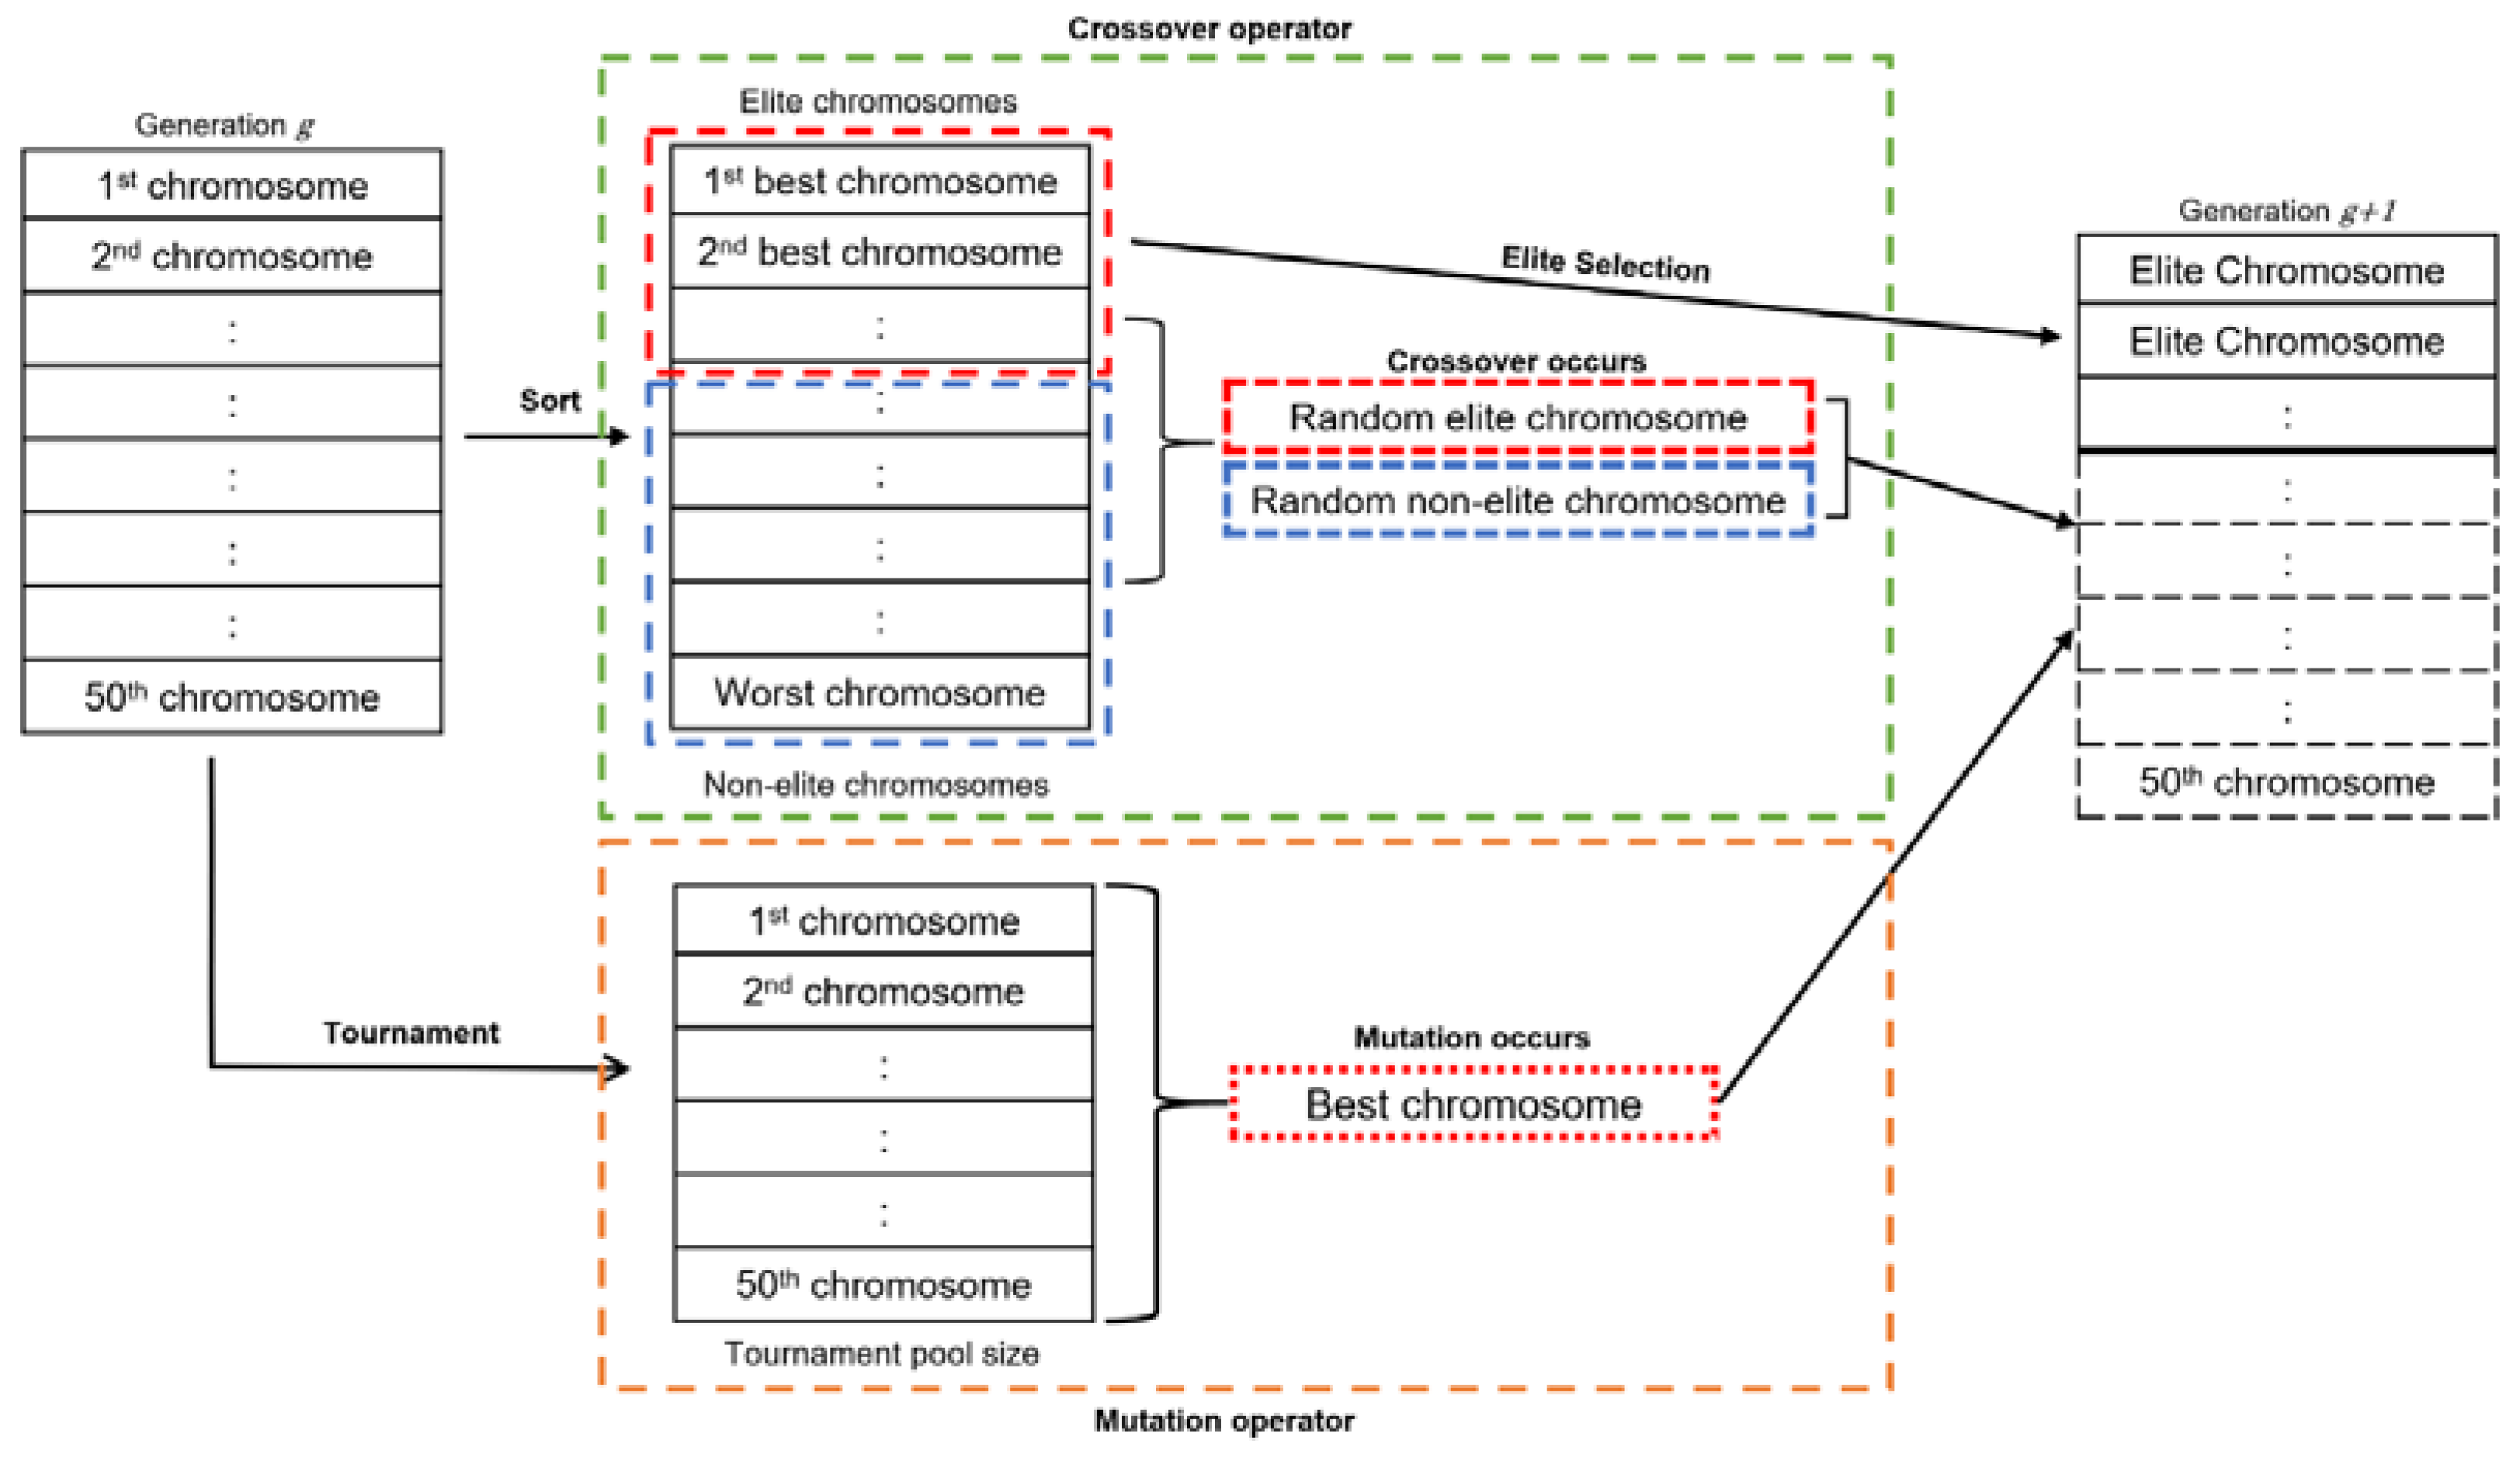
After evaluating the fitness value, the chromosomes inside the population were sorted in descending order according to the fitness value. The particular reason for this stage is to partition them into subpopulations: elite chromosomes and non-elite. The elite chromosomes were retained for the next generation, and the remaining chromosomes needed for the next generation were determined either through crossover or mutation procedure.
3.3.5. Crossover Procedure
A crossover operator was initiated between arbitrarily chosen elite and non-elite chromosomes, as determined previously, to produce the subsequent generation offspring.
Figure 4 shows the elitist chromosome selection and the crossover procedure. Uniform crossover was chosen for this study as it generally produces better recombination compared to traditional one-point and two-point crossover [
39]. When the crossover procedure occurred, each gene was evaluated and had a 50% chance of having crossover until the procedure reached the last gene and produced two offspring for the next generation.
3.3.6. Mutation Procedure
The mutation operator was initiated based on the probability of mutation rate. A high mutation rate of 0.3 was chosen to encourage stochastic search in the study space while preserving the algorithm’s ability to converge to the optimum result. The selection of a chromosome was determined using tournament selection, where only the best chromosome prevailed and was selected for mutation. The tournament participant pool size was selected randomly based on the predetermined tournament size, which was 40% out of the current generation population. Once the selection chromosome was determined, and mutation occurred, each gene had a 50% chance of being mutated until the procedure reached the last gene and produced one offspring for the next generation.
3.3.7. Termination Condition
The algorithm was run for a series number of generations to ensure convergence of an optimum solution. The number of generations used in this study started from 0 (initial population) to 100 with the increment of 5 generations.
3.4. Scenario Development
The data collected from local TNCs were filtered based on the determined temporal distribution (weekdays/weekends and morning peak/off-peak/evening peak) using RStudio. The resulting data were transferred to QGIS for spatial filtering based on Central and South Jakarta’s spatial area. Then, the data were further analyzed by means of the clustering method. K-means and k-medoid clustering was used for all scenarios, resulting in 25 clusters for each scenario. These cluster centers were then fed to the genetic algorithm as initial chromosome representation (initial PUDO stations) for further optimization based on the potential interaction gravity model between stations and demand as well as incorporating the distance requirement and minimum capacities.
4. Results
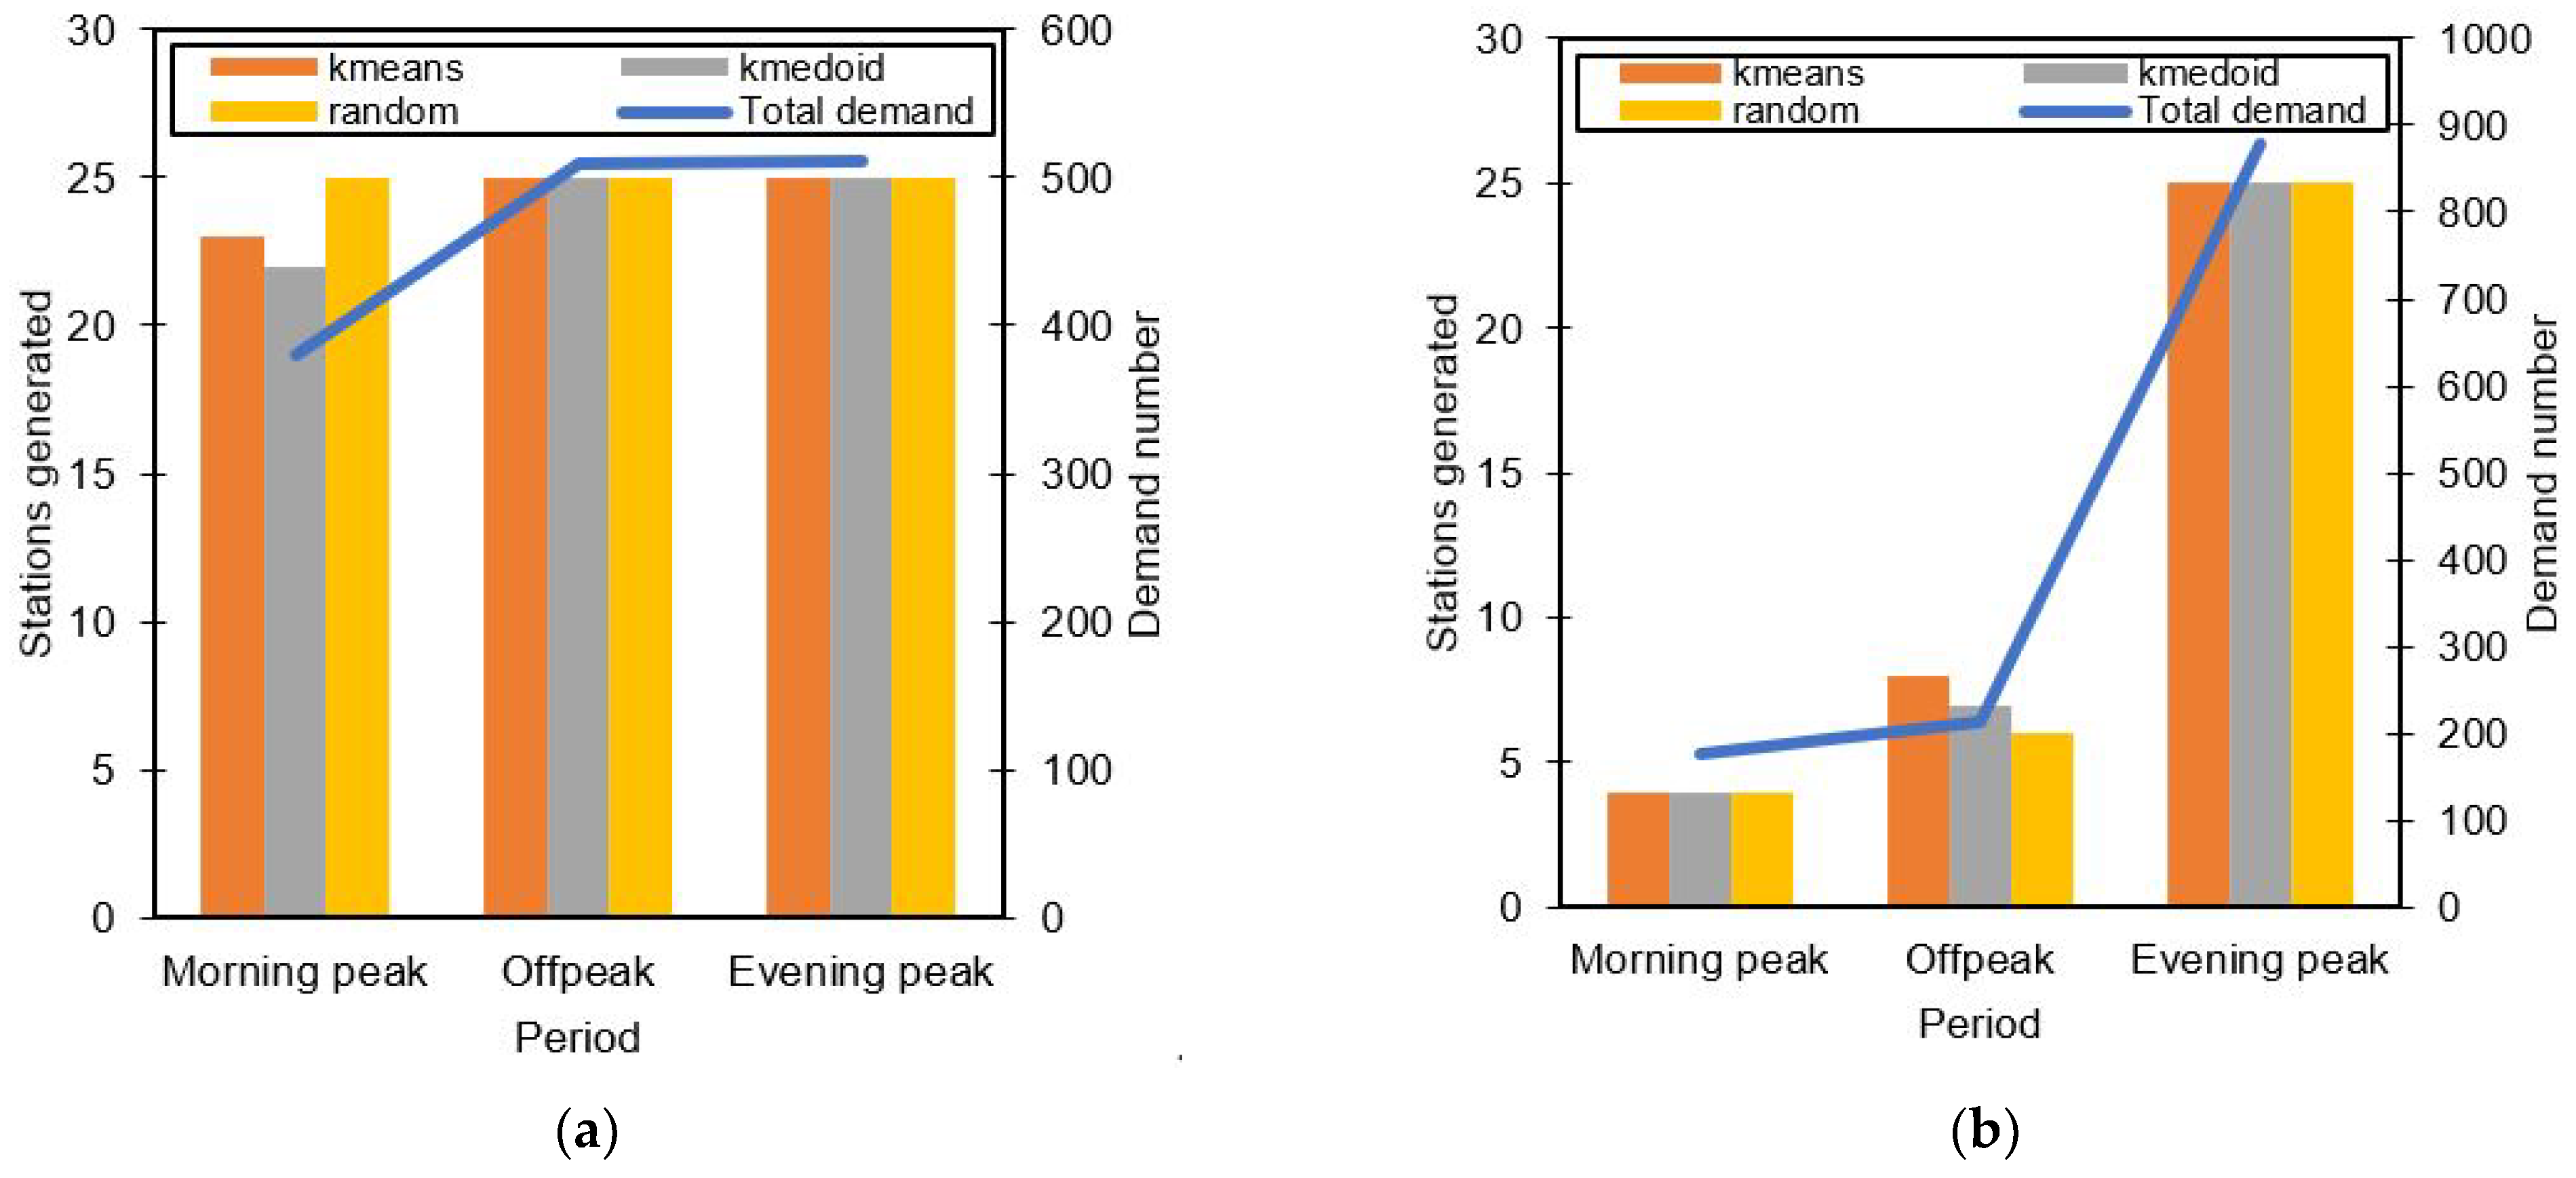
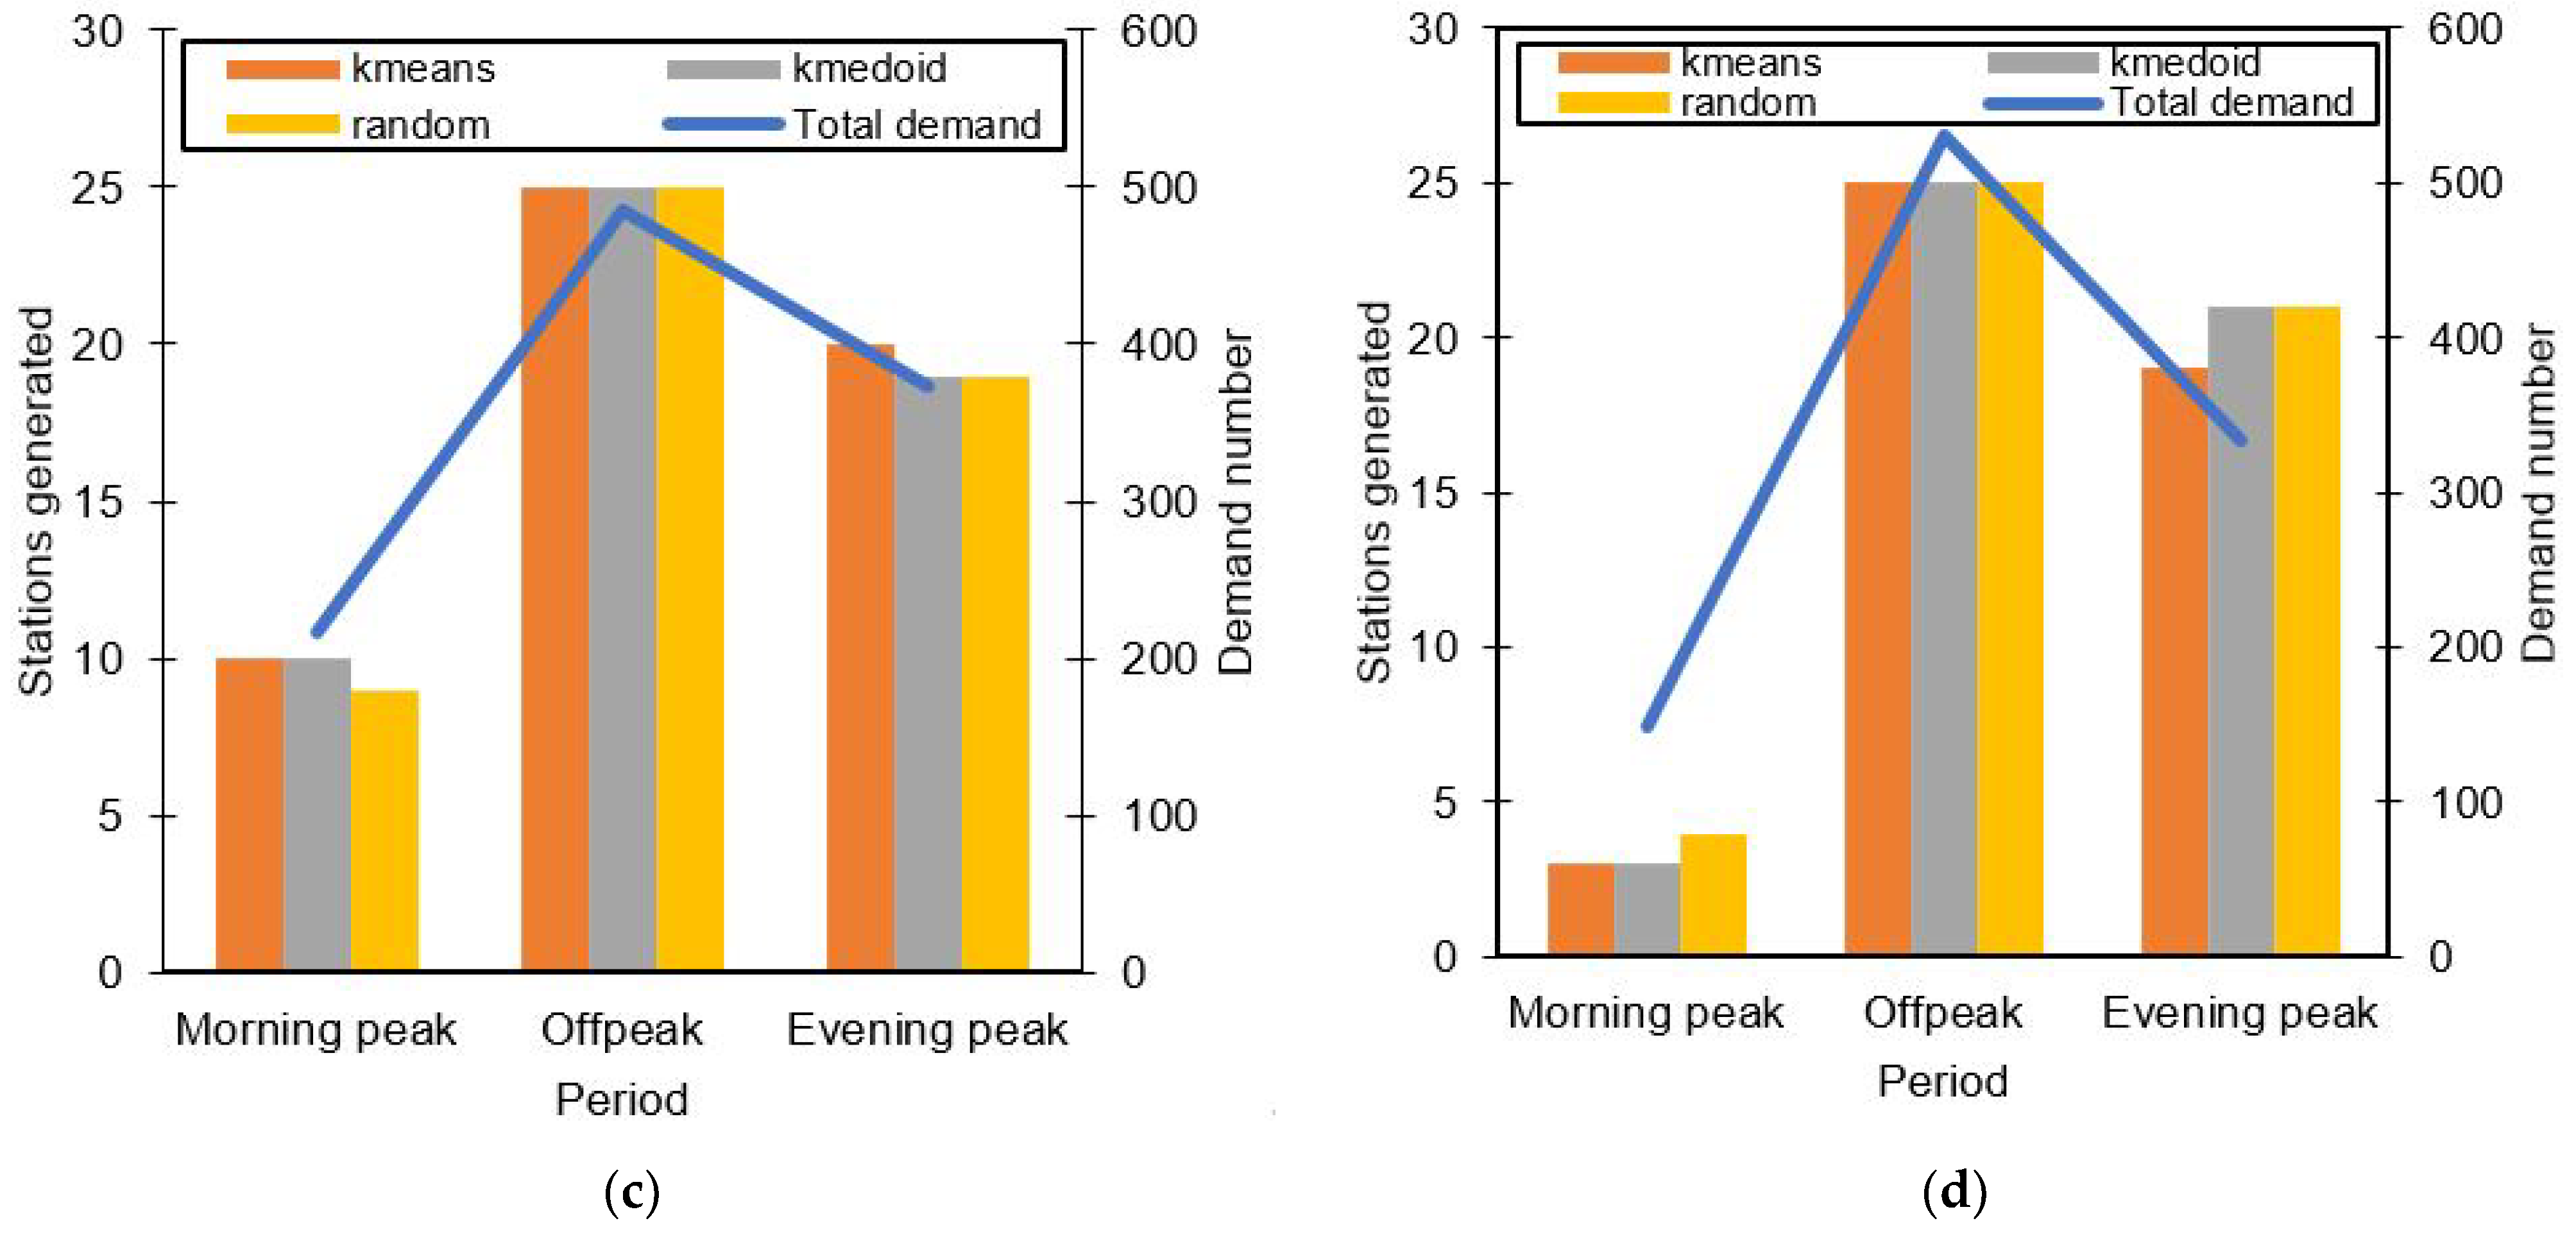
Figure 5 shows the stations generated for different dates and different time periods in comparison with the total demand analyzed during those periods. A clear distinction can be seen in all the graphs, in that when the demand is low, the algorithm generates fewer stations to meet the demands effectively. Other factors may play into mainly how distributed the raw PUDO demand is in the study space. For all different initializations (k-means, k-medoid, and random), there seems to be not much difference in the number of generated stations as well. More distinction between all initialization is shown in their resulted fitness value.
The number of PUDO stations generated for different initial chromosomes resulted into similar numbers. A randomized initial chromosome seems to be able to provide similar results compared to a k-means or k-medoids initial chromosome. The algorithm was able to adapt well in determining the number of stations based on the prerequisite requirement even though the initial chromosome was randomized thoroughly.
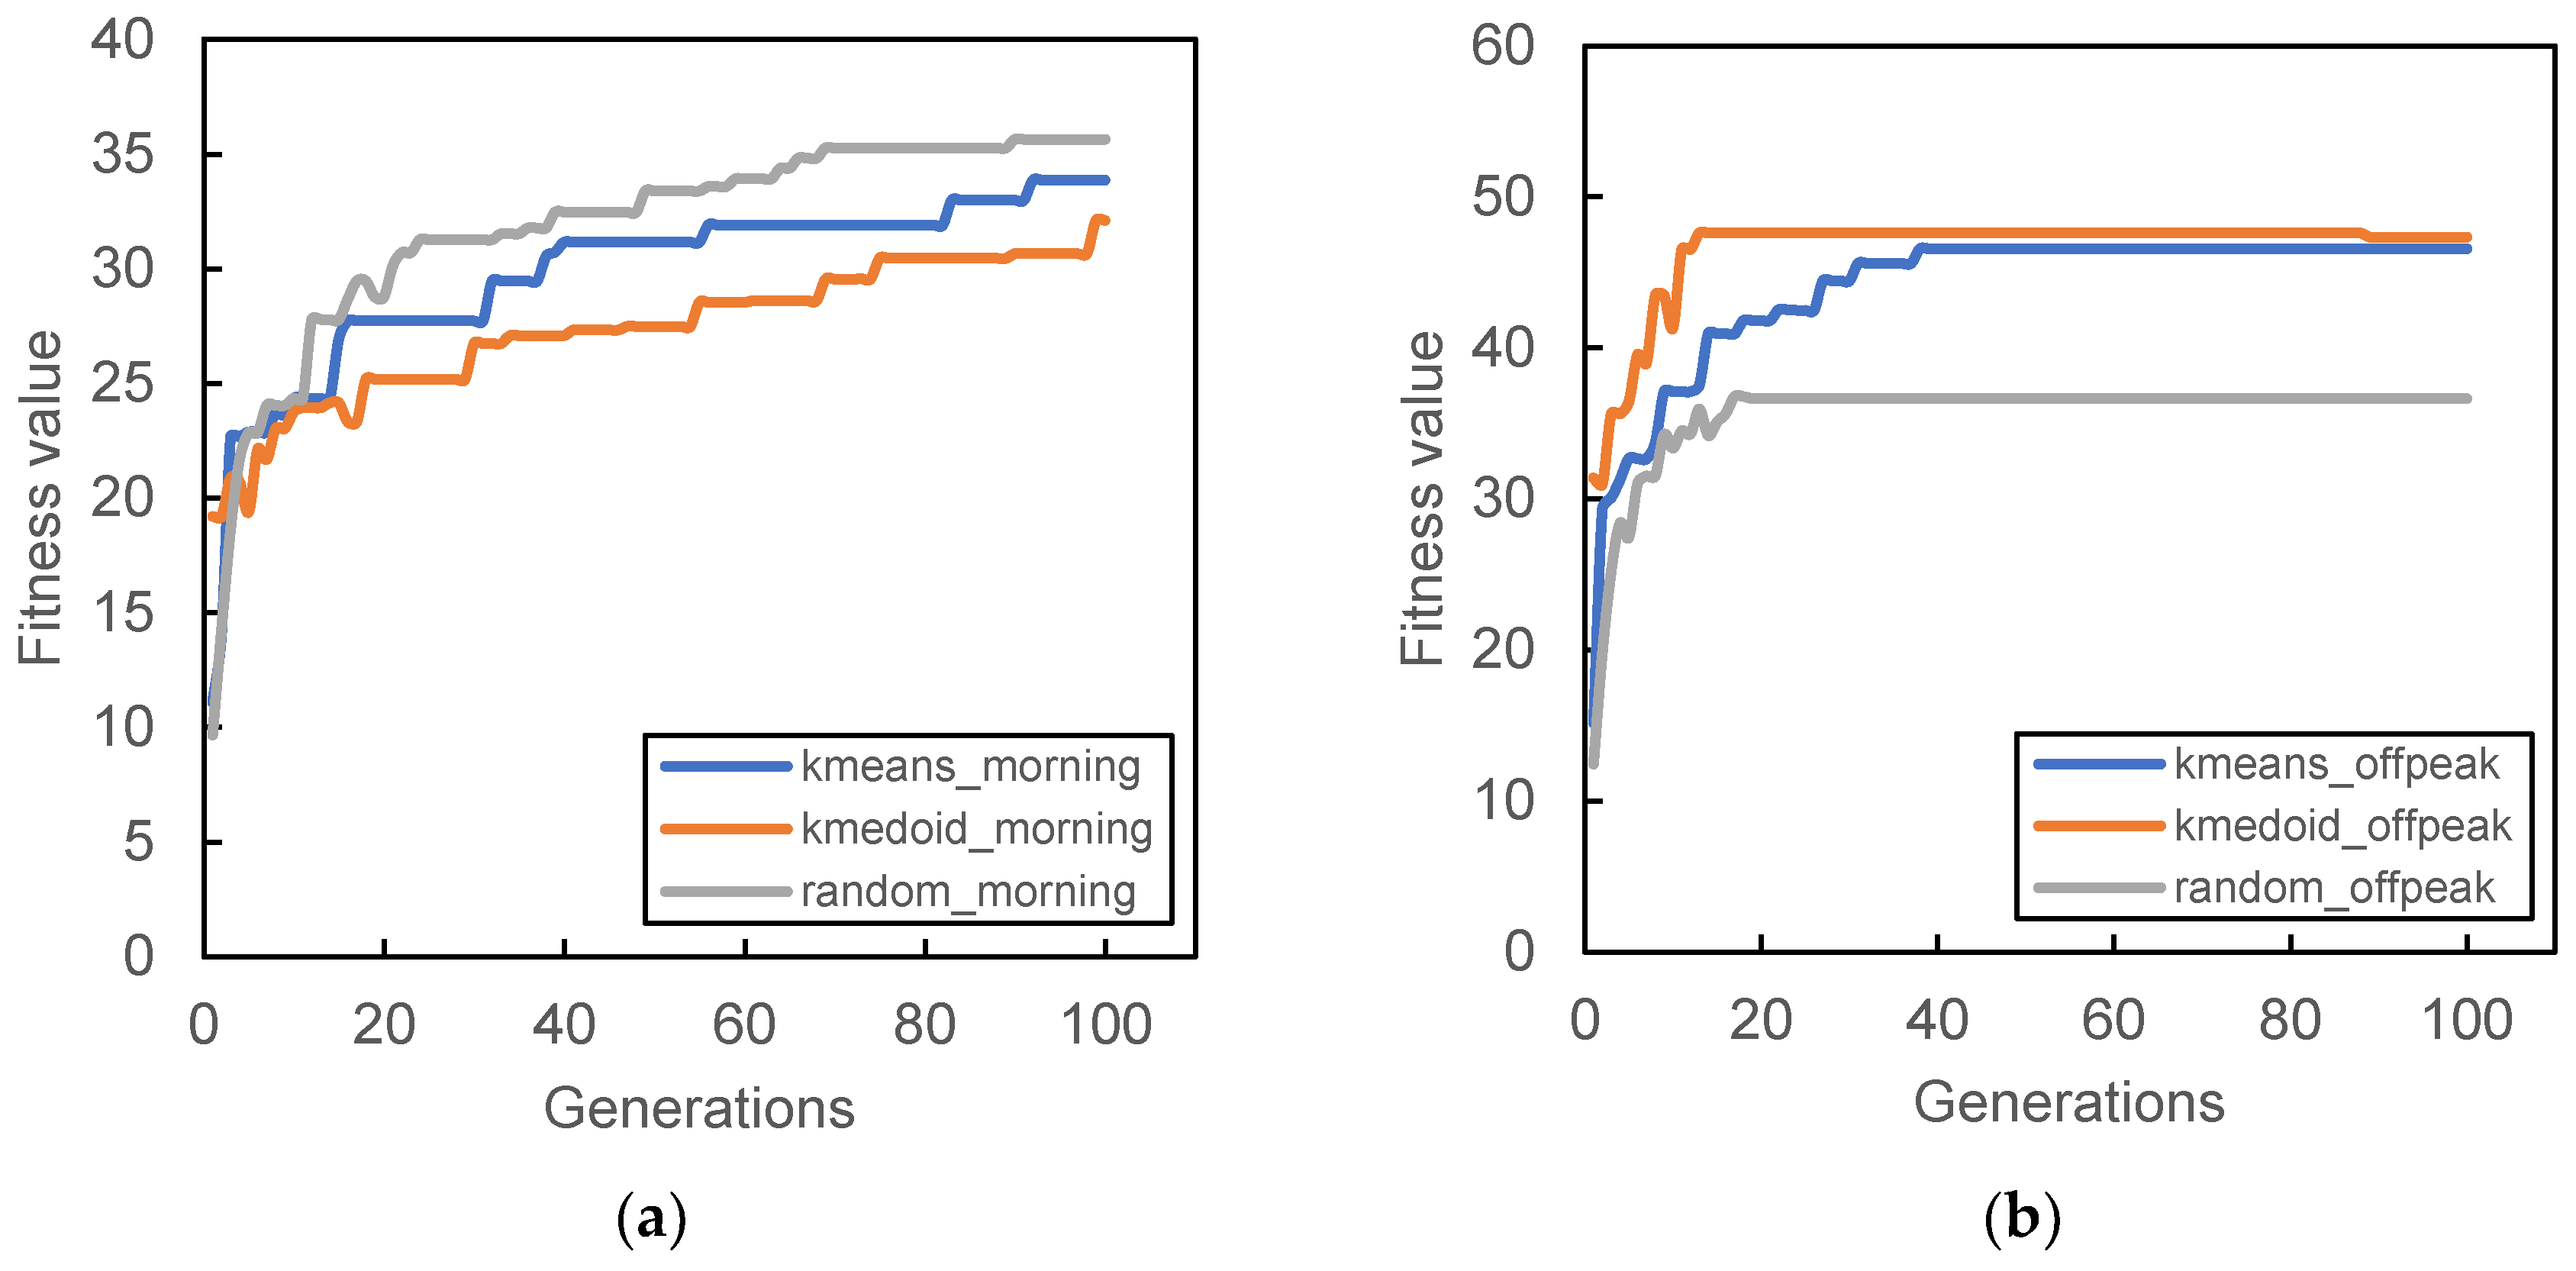
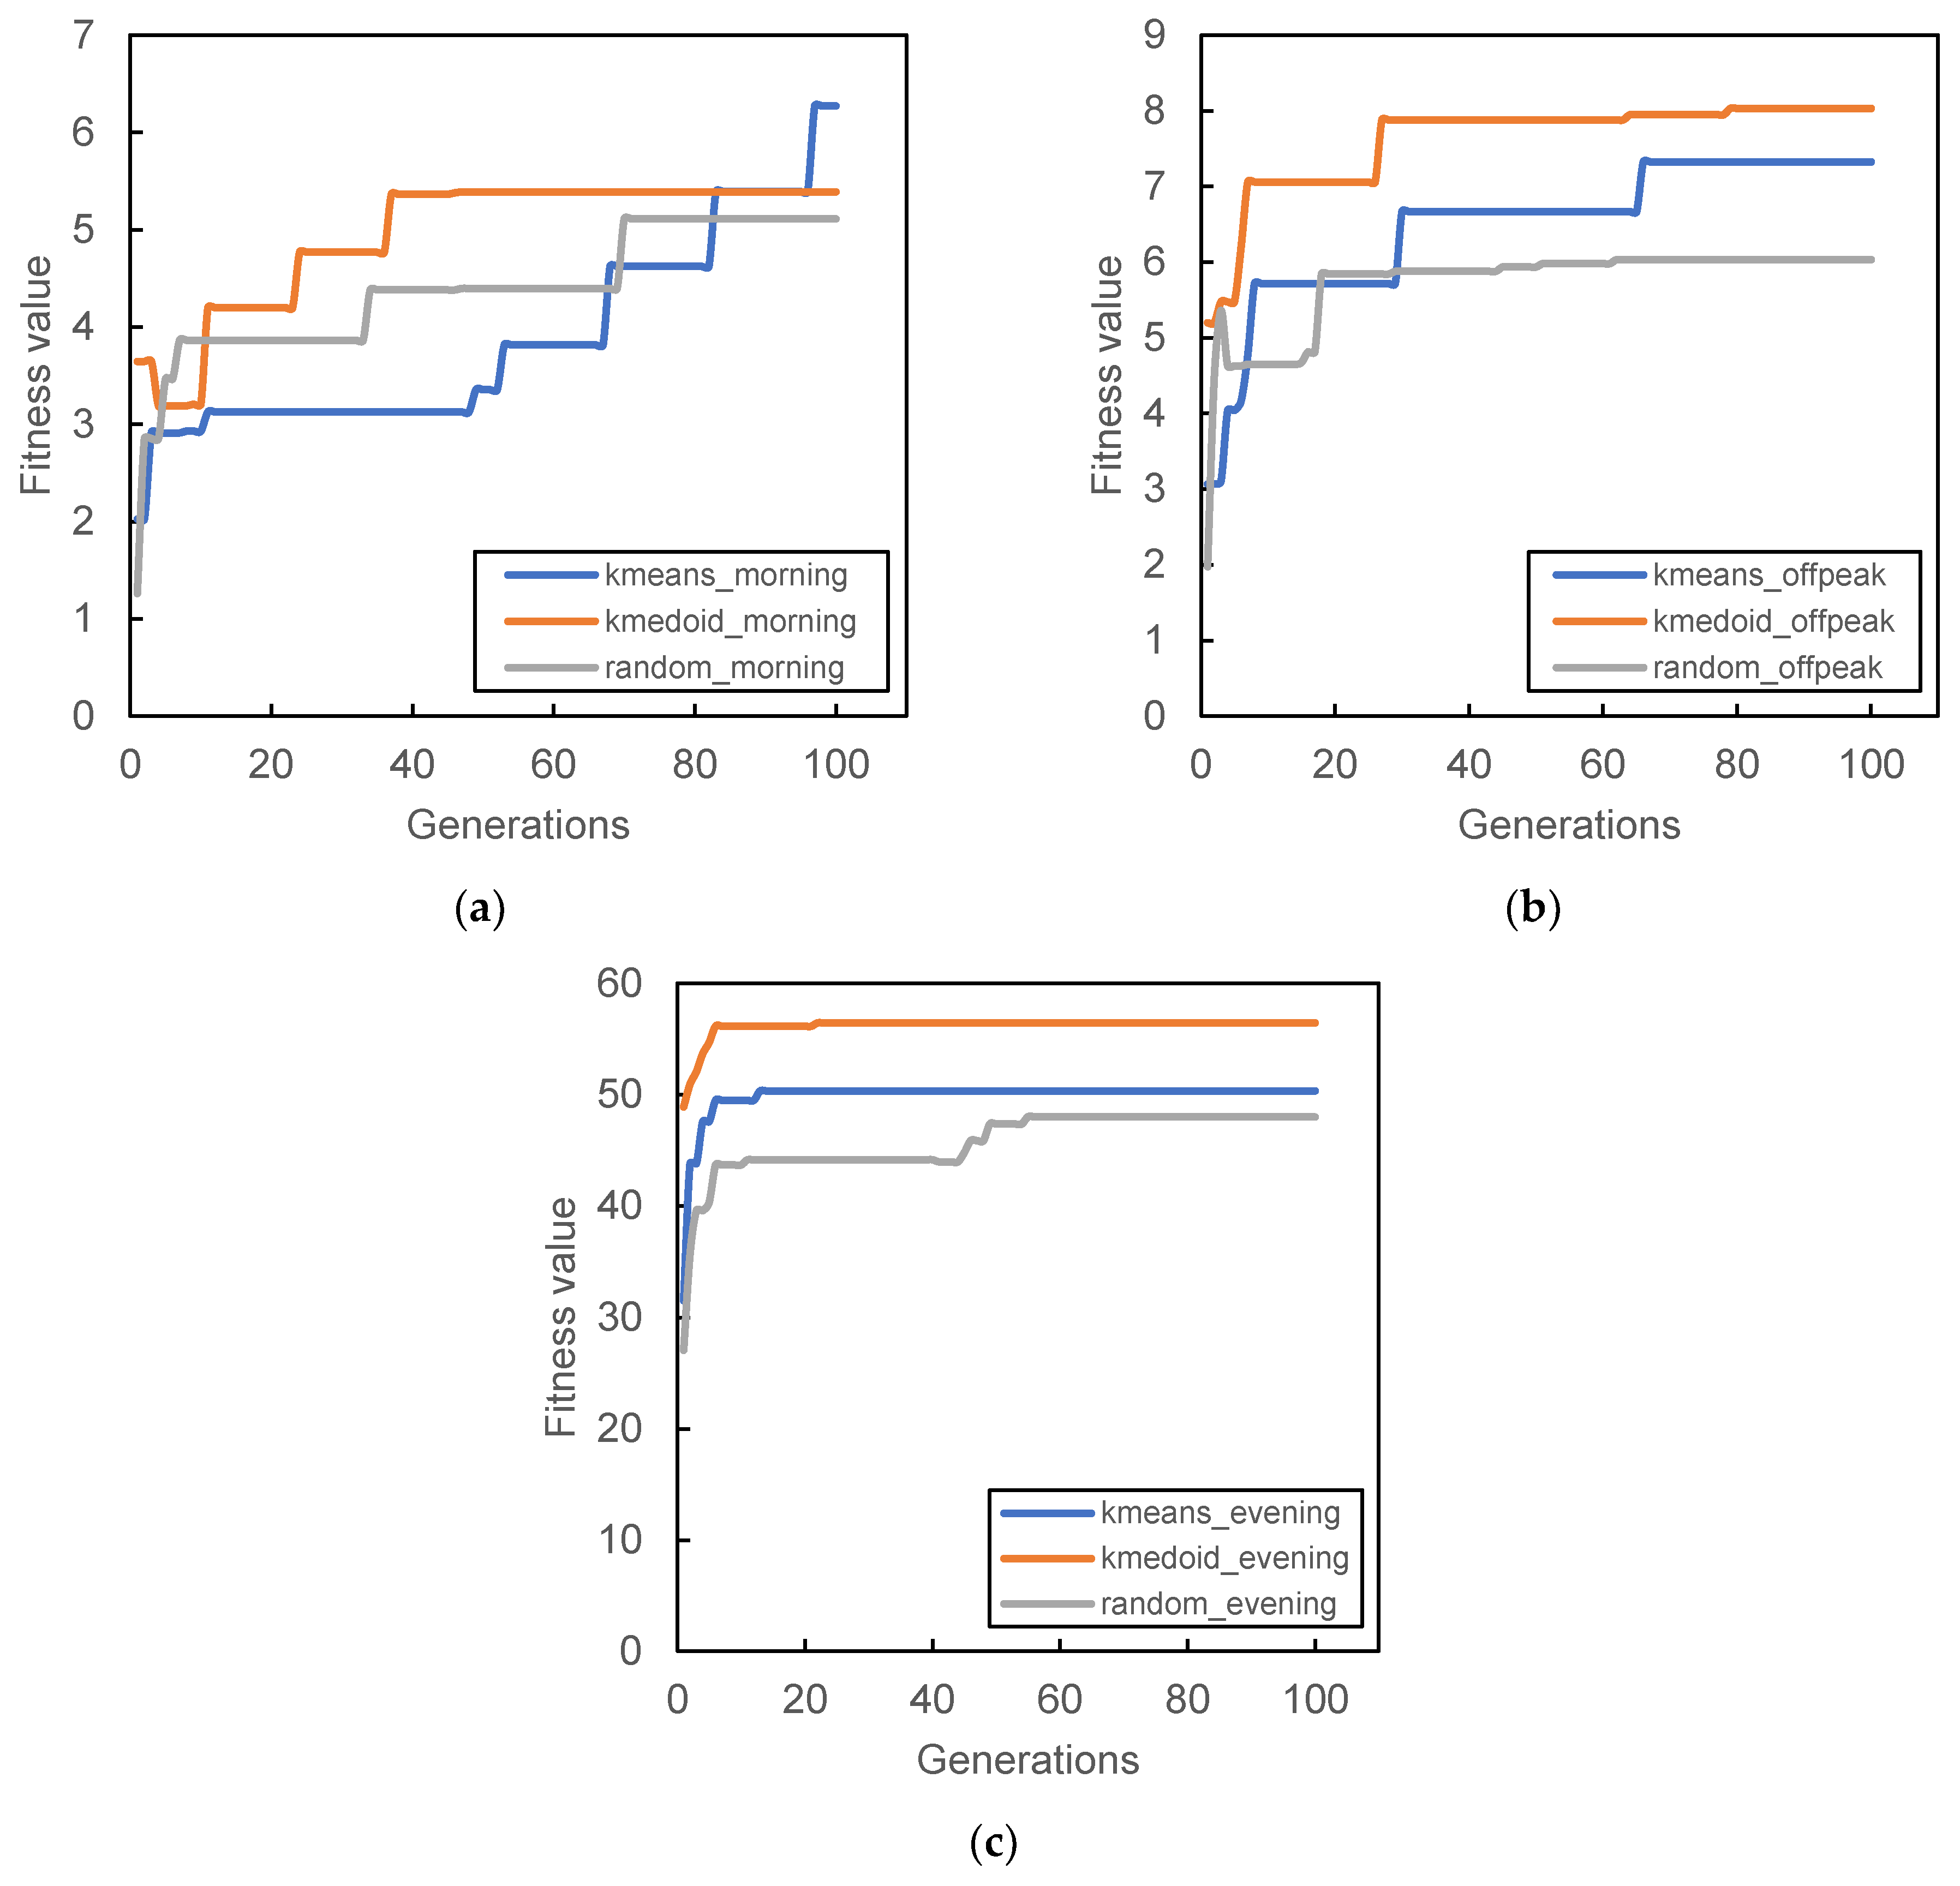
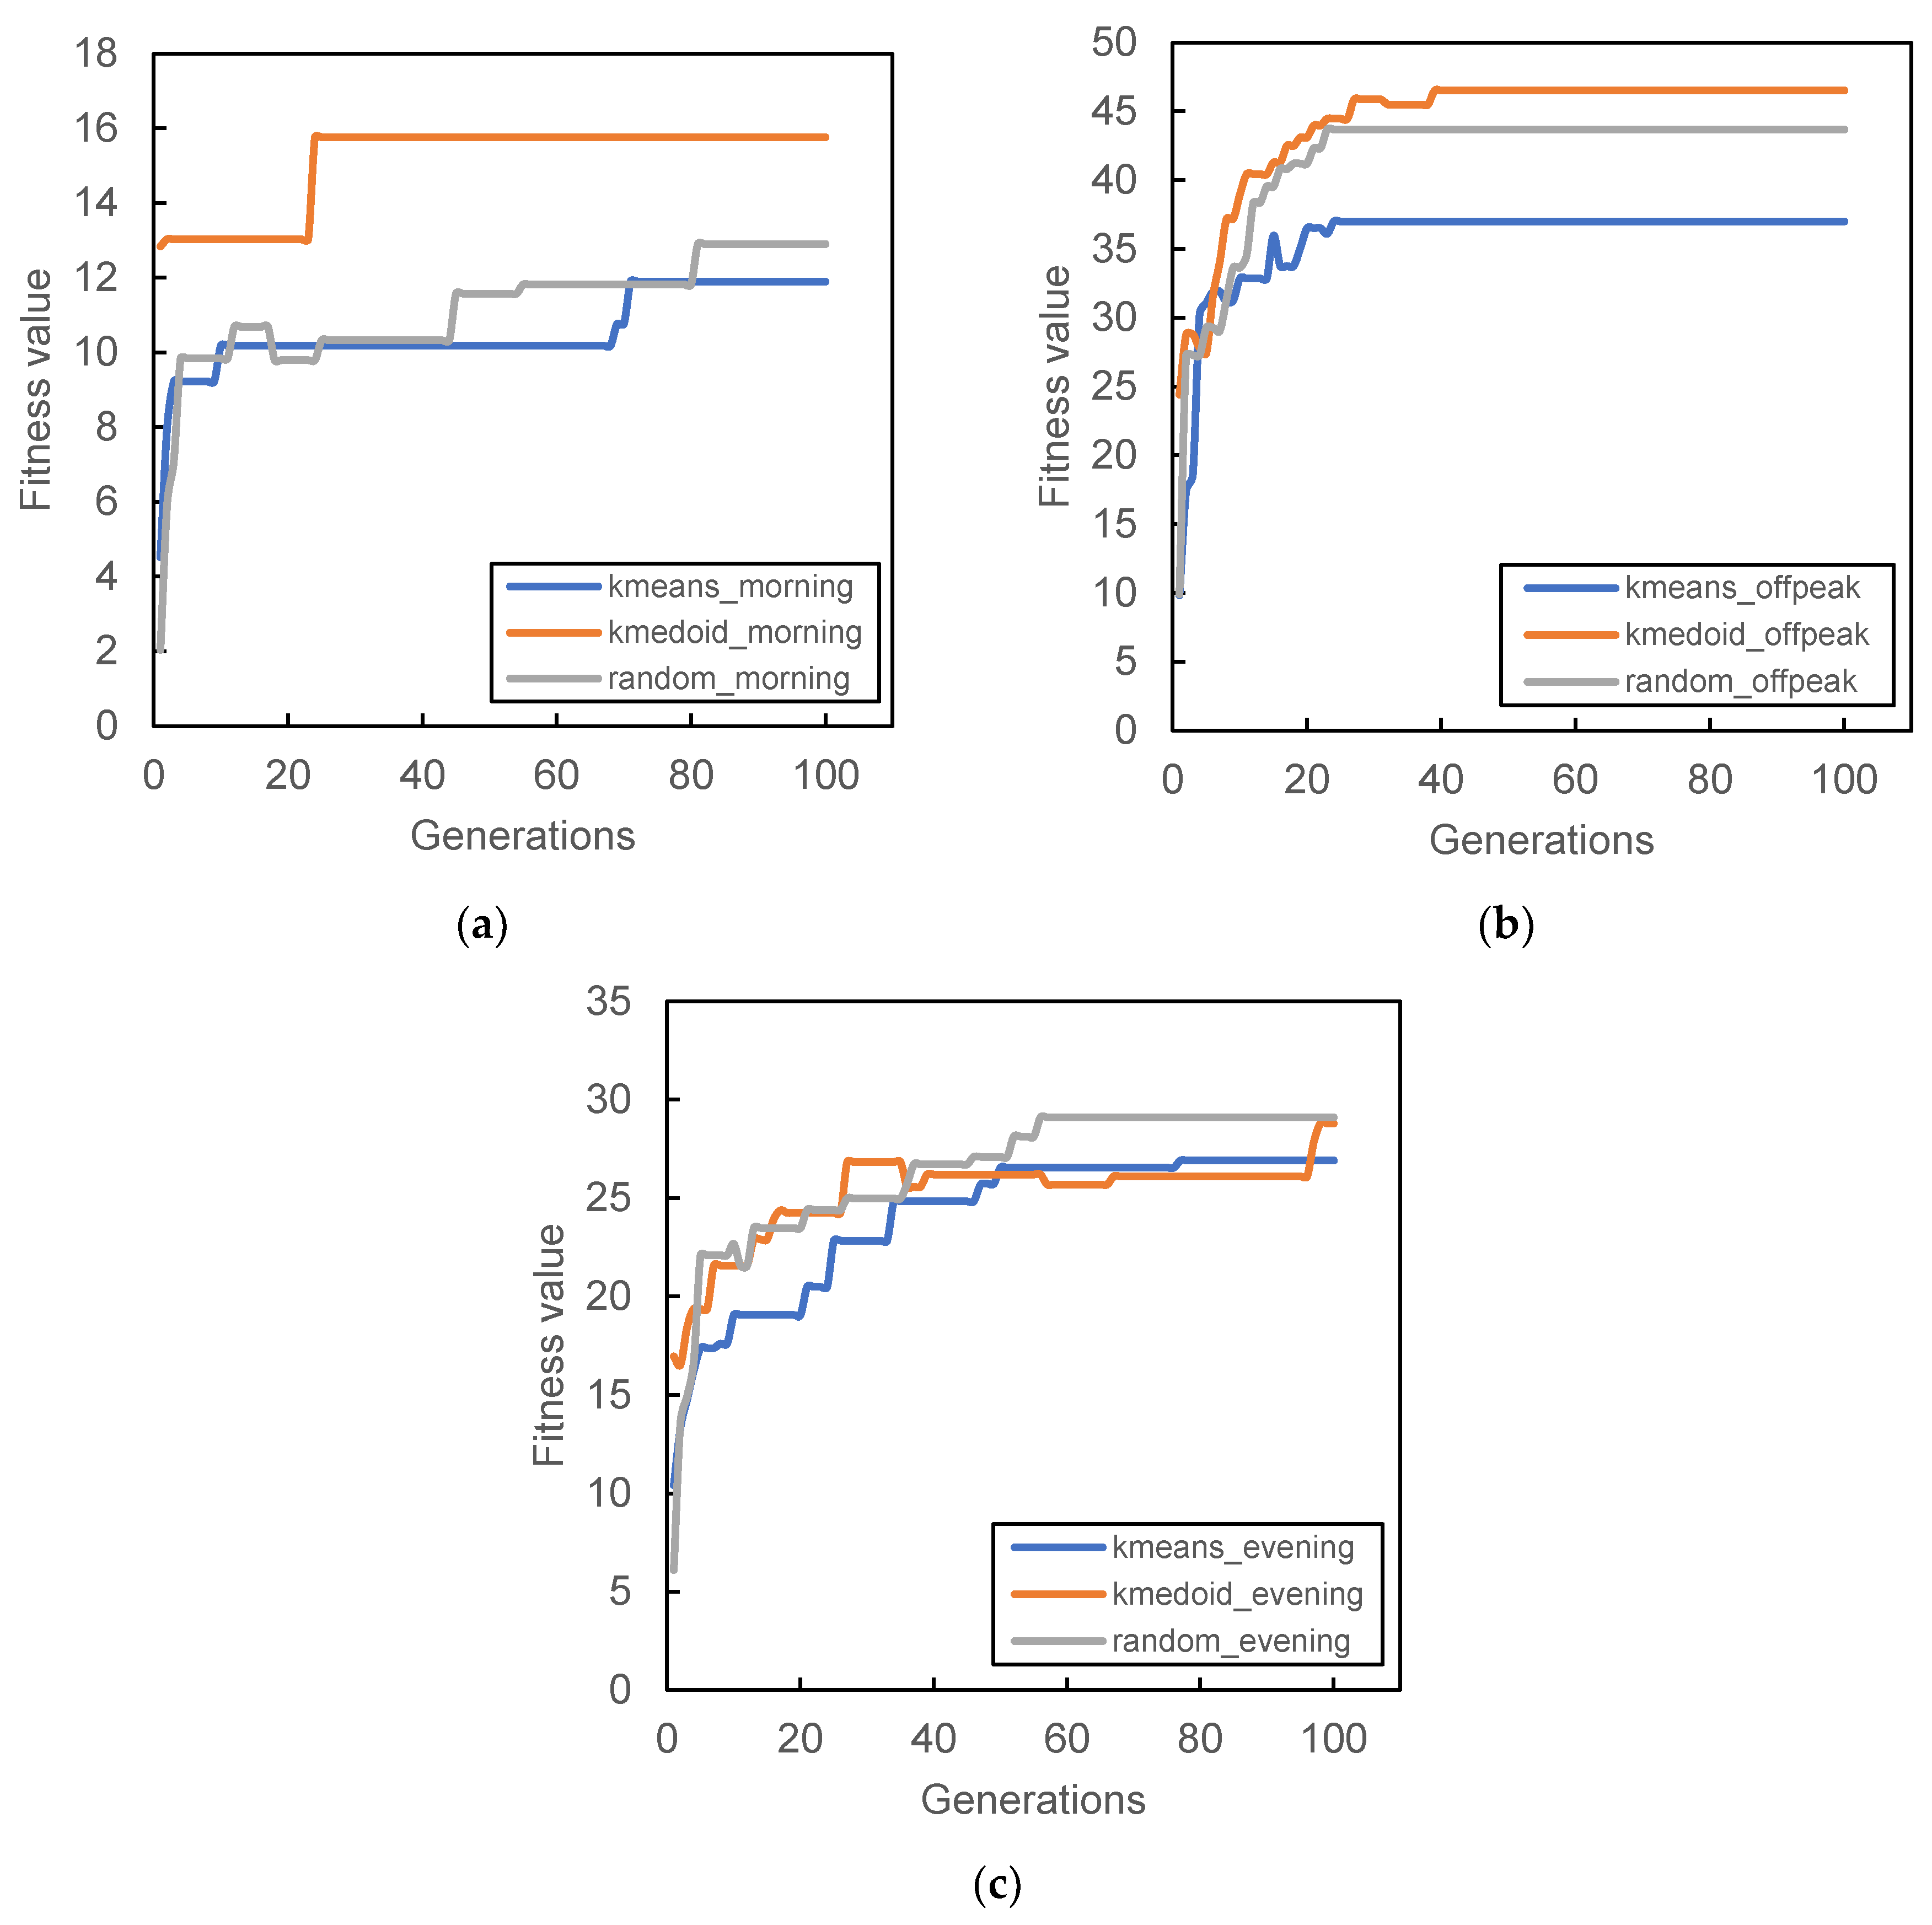
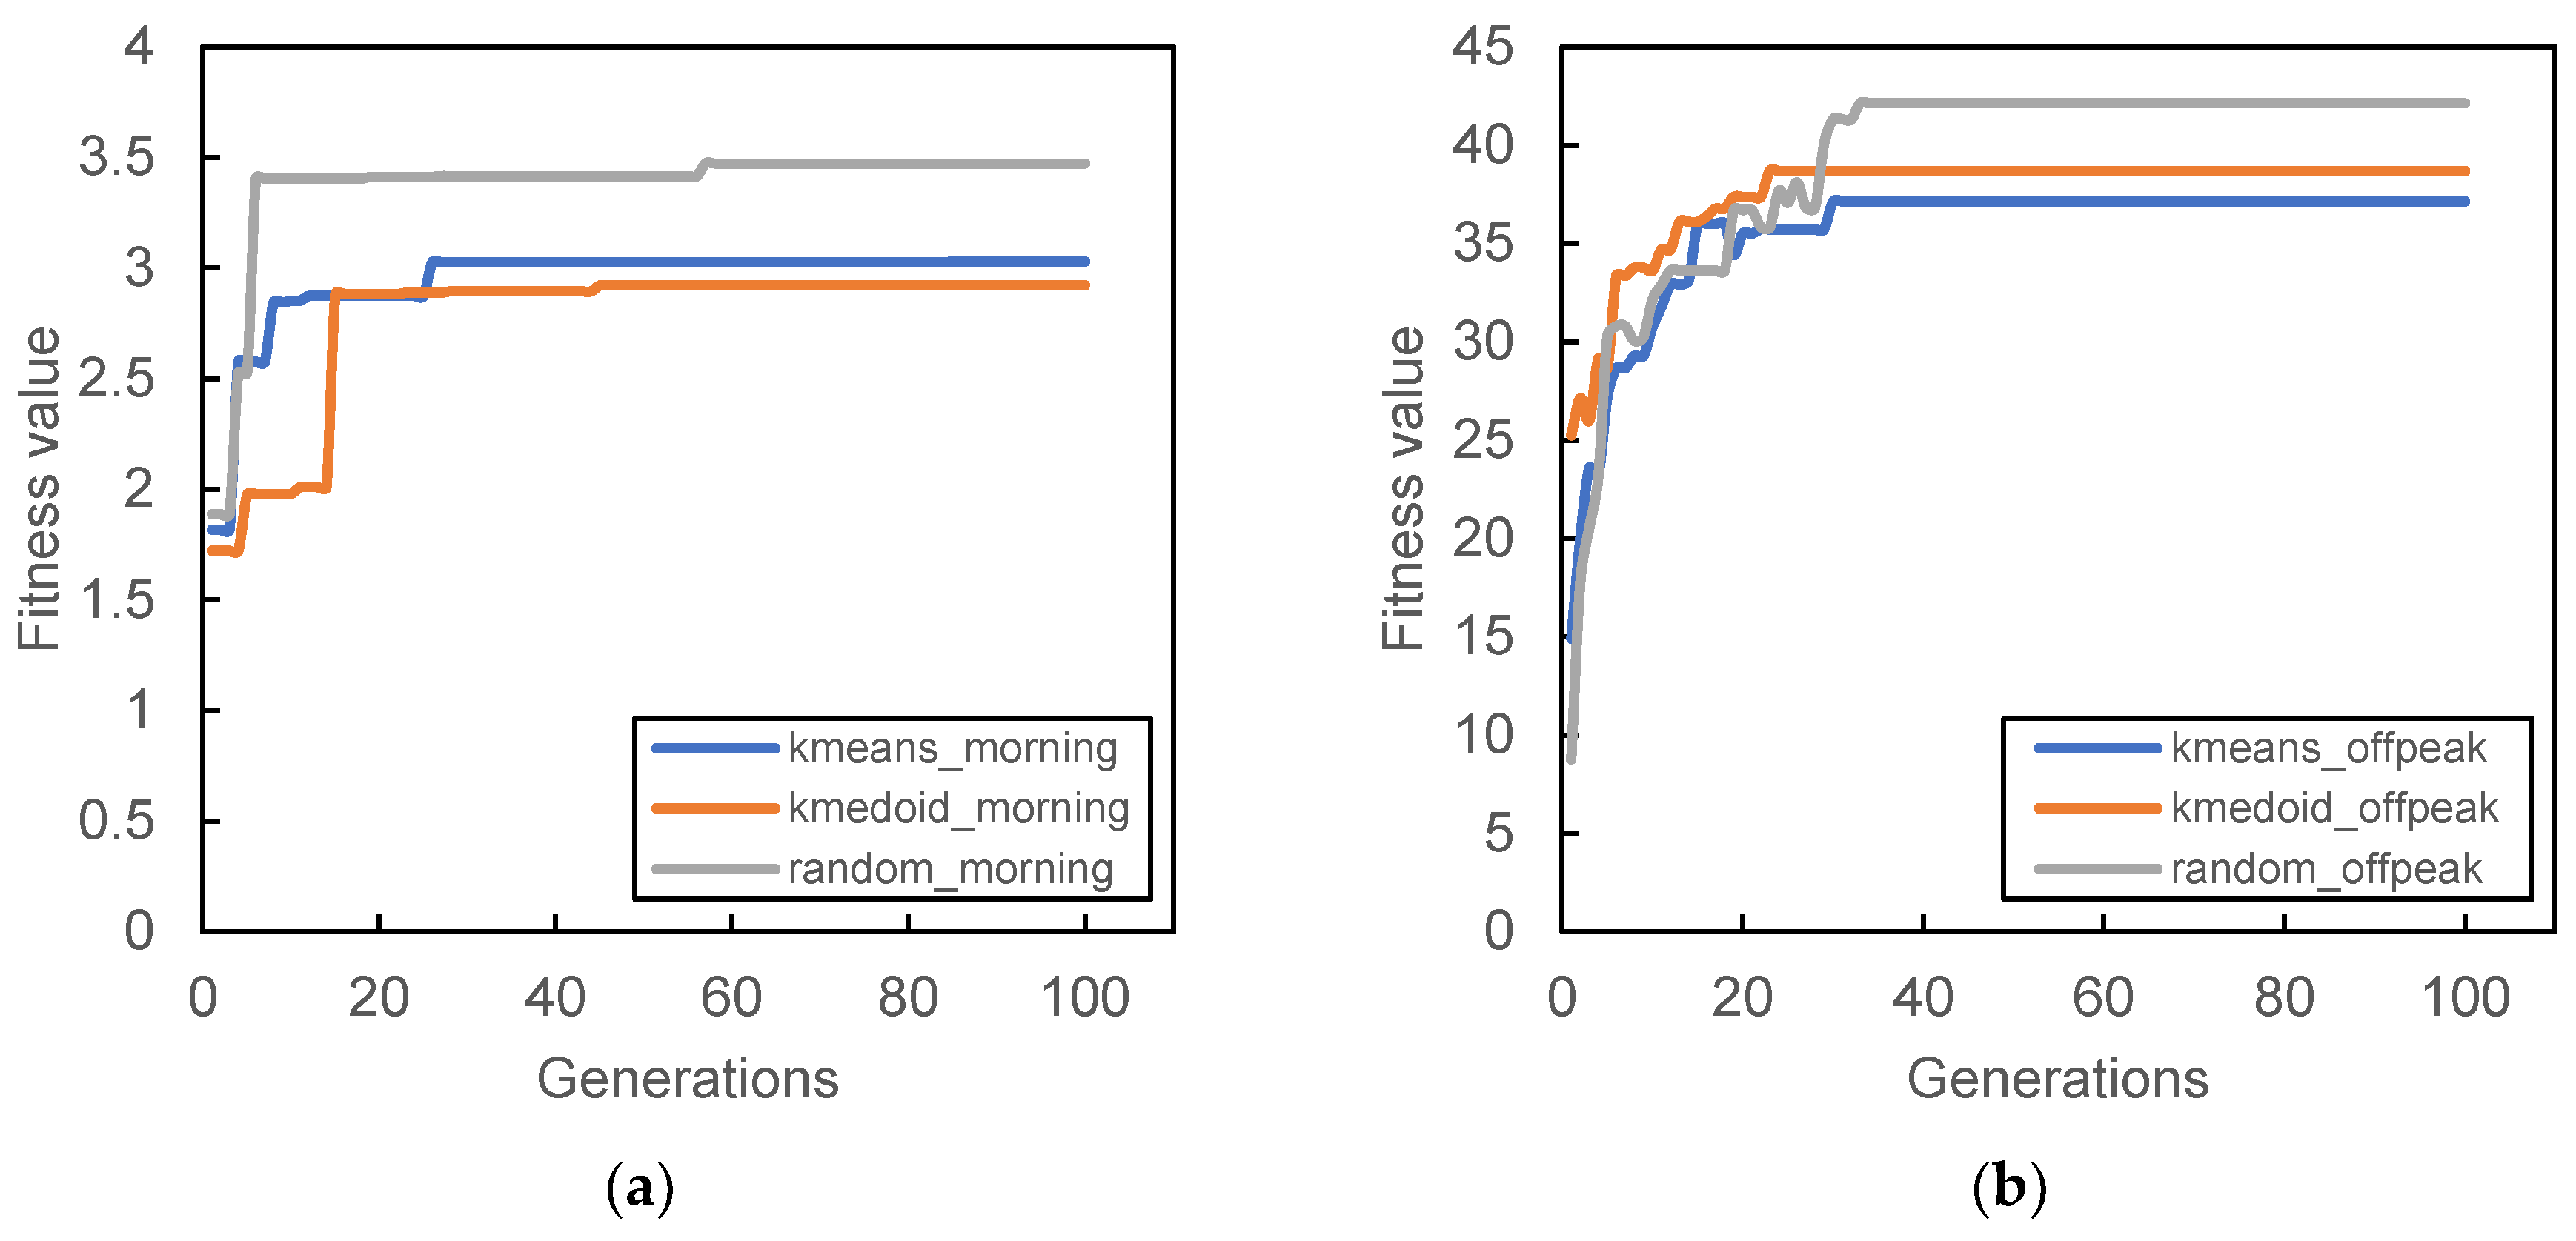
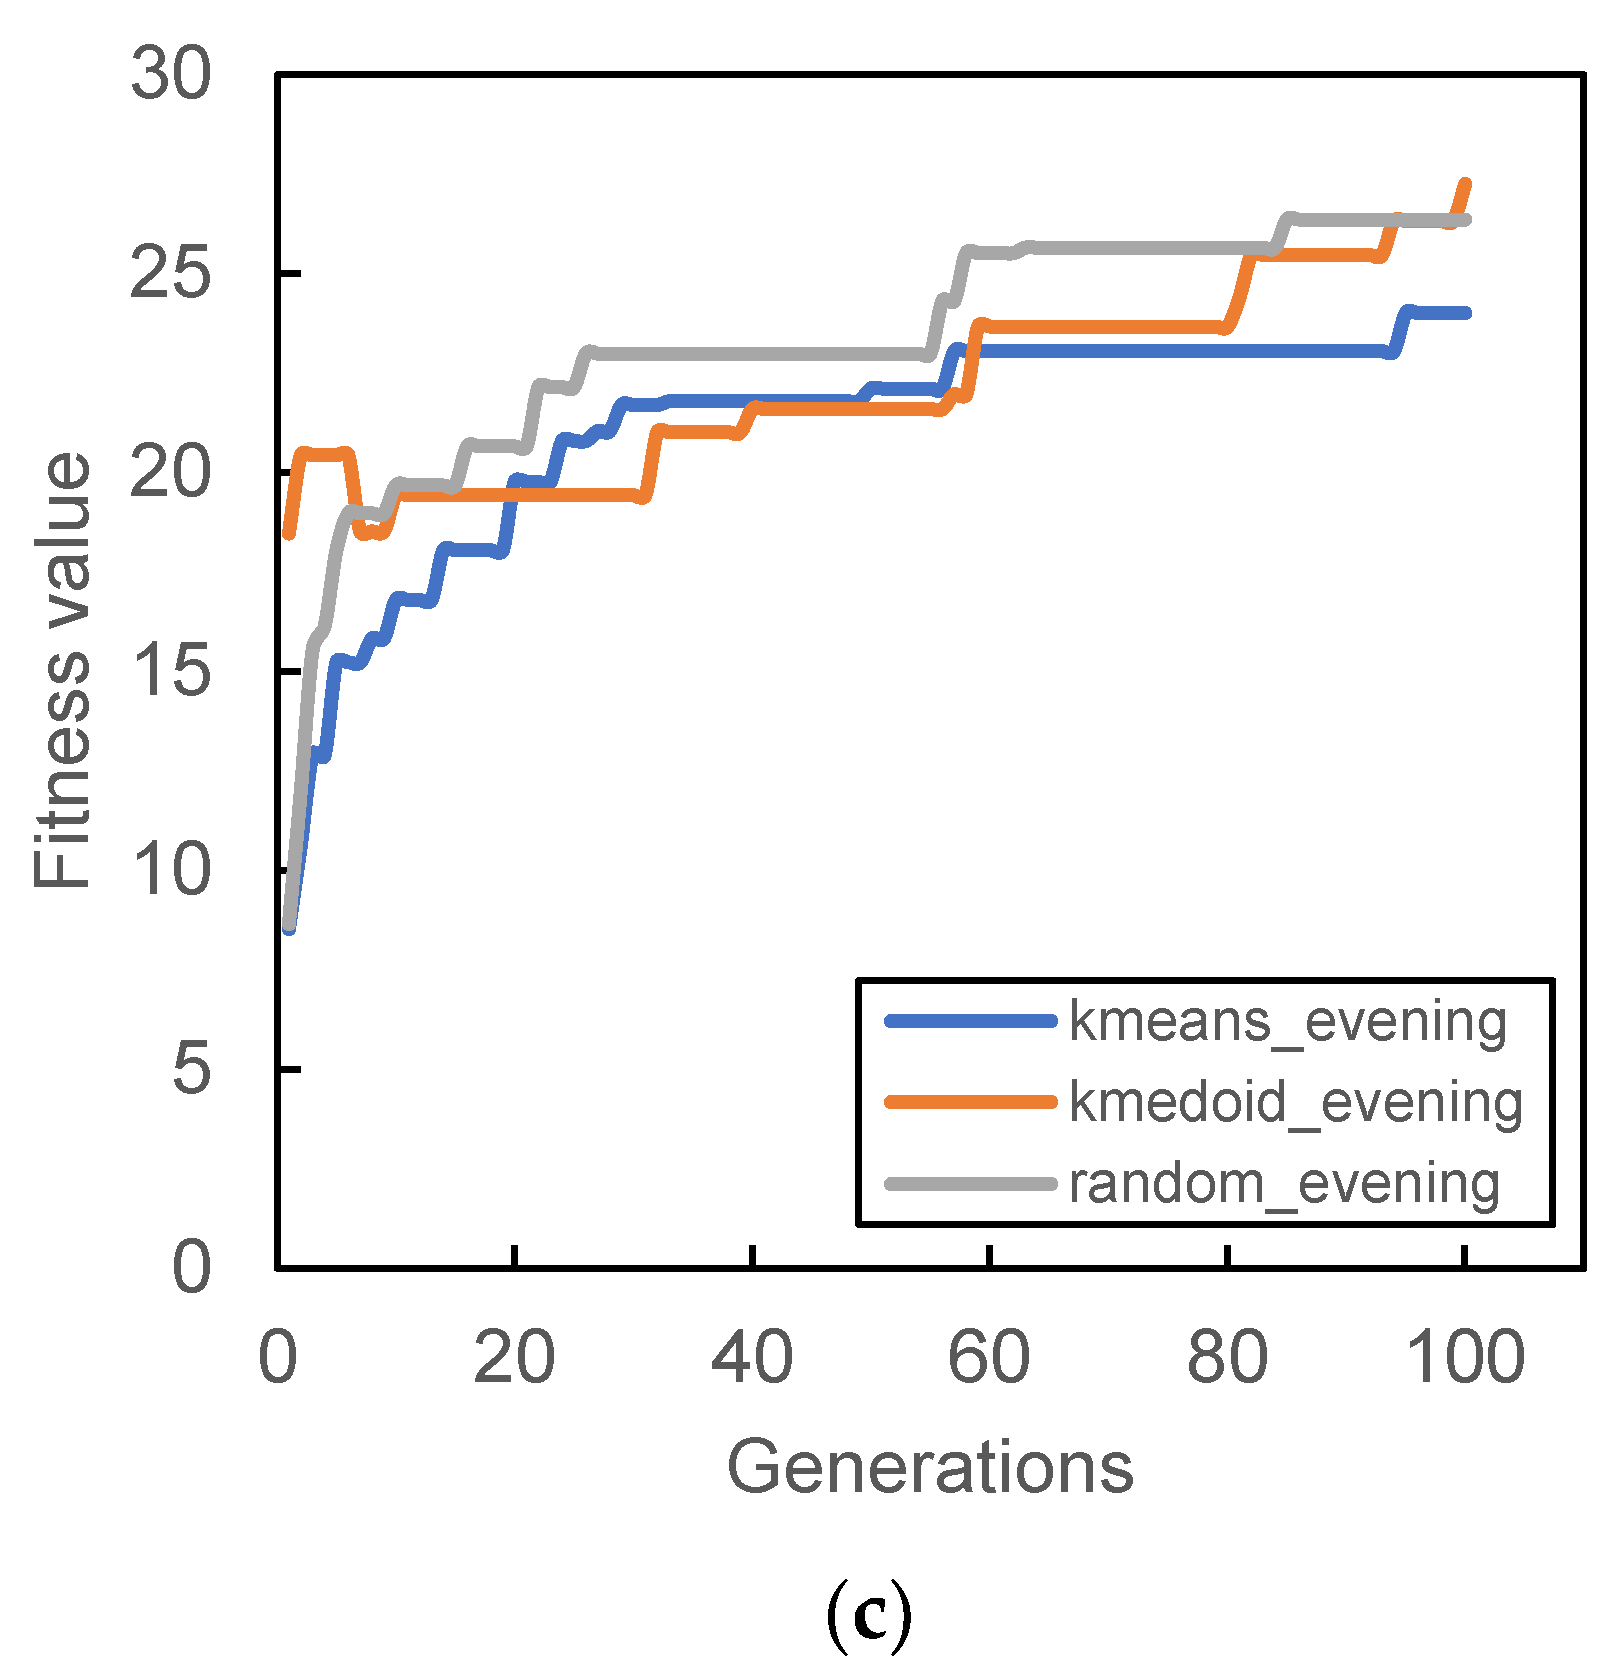
Figure 6,
Figure 7,
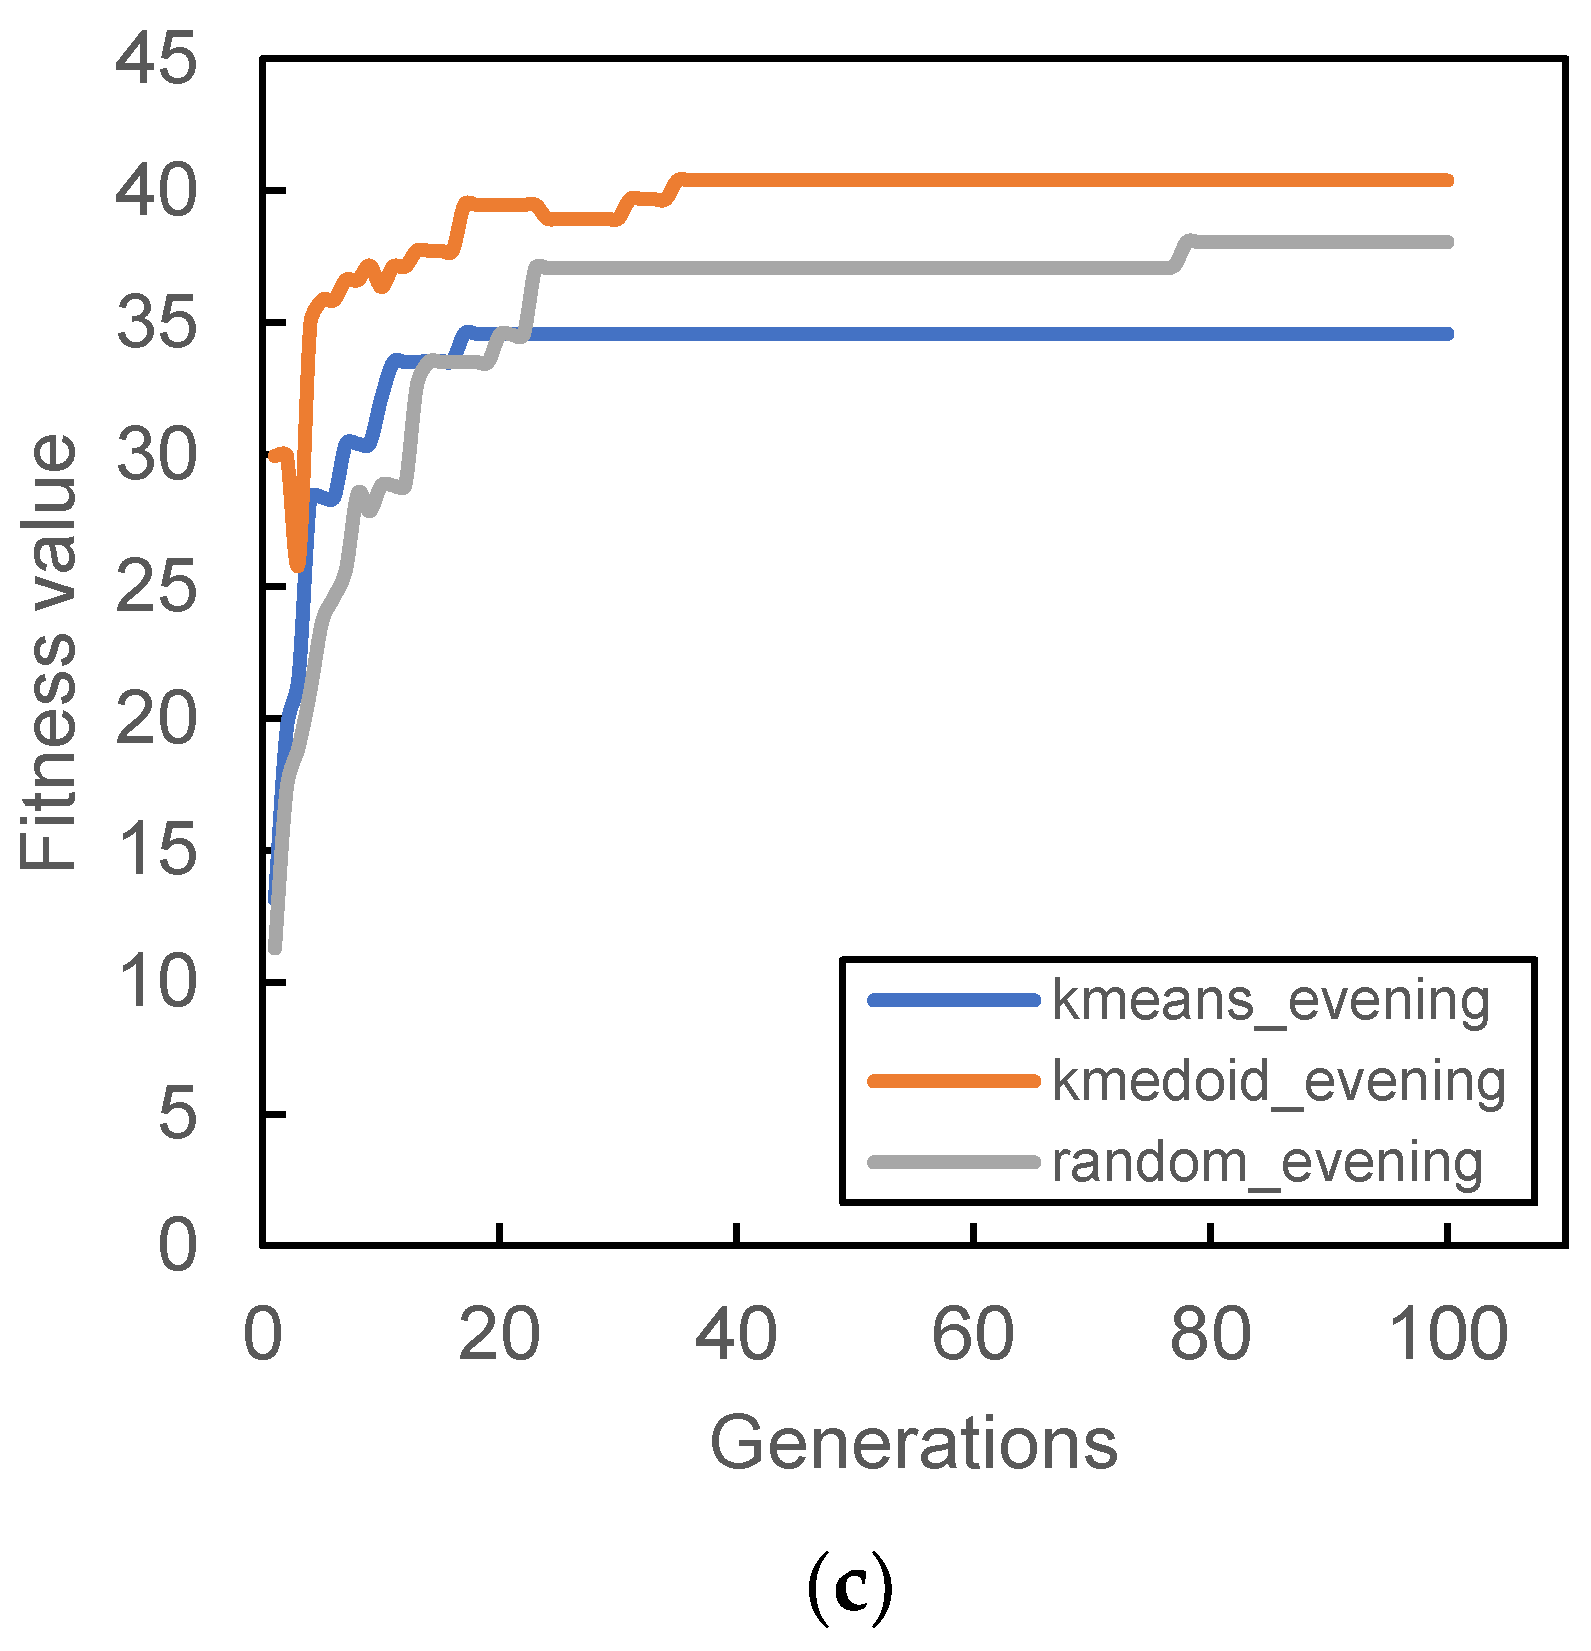
Figure 8 and
Figure 9 show the result of the different initial population’s fitness value for different demand periods. All three initial populations converge rapidly as generation increases, with k-medoid providing the best fitness for most of the period. This result is contributed from the nature of k-medoid, where it partitioned the data using the actual demand data and allows greater interpretability of the clusters’ centers compared to k-means. Although it is worth noting that the difference in final fitness value for all cases, when compared only the initialization, does not differ too much.
Randomized initial population performances are inconsistent throughout all case studies. In some cases, it performs better than other initial populations (
Figure 7a and
Figure 9a,b) while in some cases, it provides the worst fitness value (
Figure 7b and
Figure 8c). The stochastic nature of the station search process may contribute to such results, along with its inability to search all the required spaces in time. The mutation process can only occur within the probability limit set at the beginning of the algorithm, and the limitation of the number of generations also prevented the algorithm from converging to better solutions.
It is also worth noting that some cases provide relatively lower fitness values compared to others; for example,
Figure 8a and
Figure 9a. The particular reason for that occurrence is connected to the total demand analyzed within that period. Lower demands were recorded during that time period; hence, the algorithm was not able to search more PUDO stations that could cater to the demand, which is reflected in
Figure 5c,d during the morning peak where a only few PUDO stations are generated.
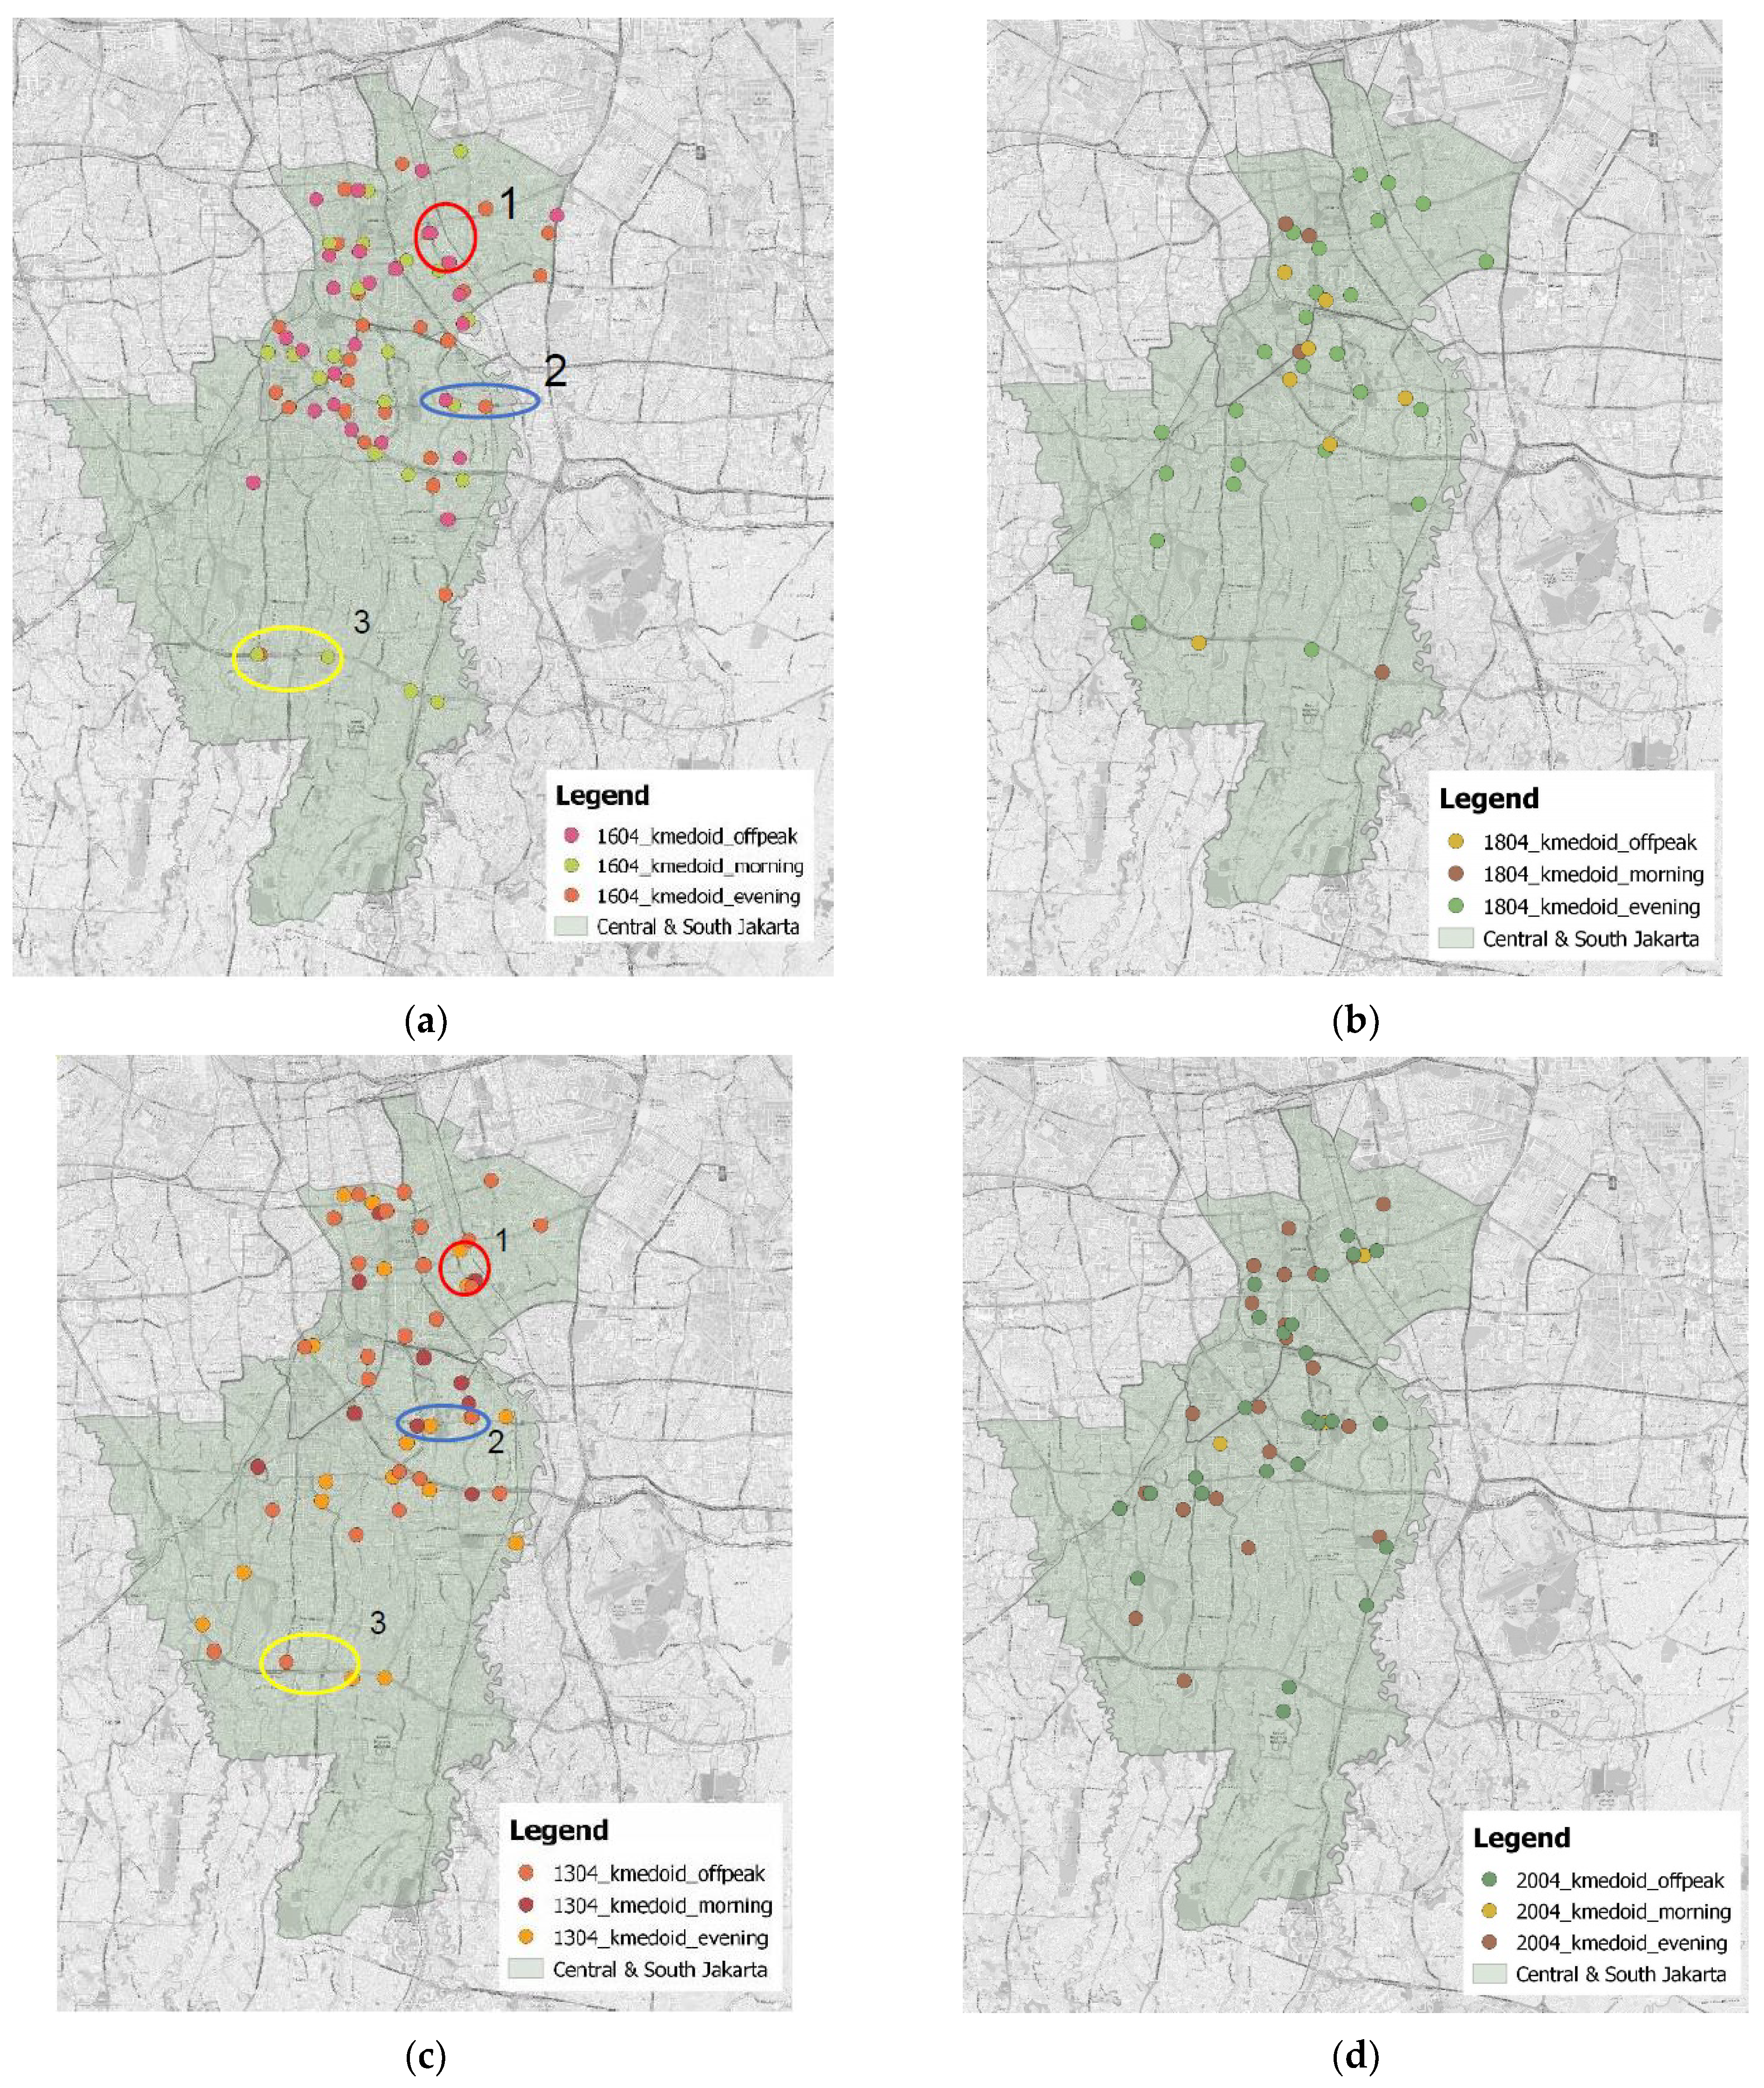
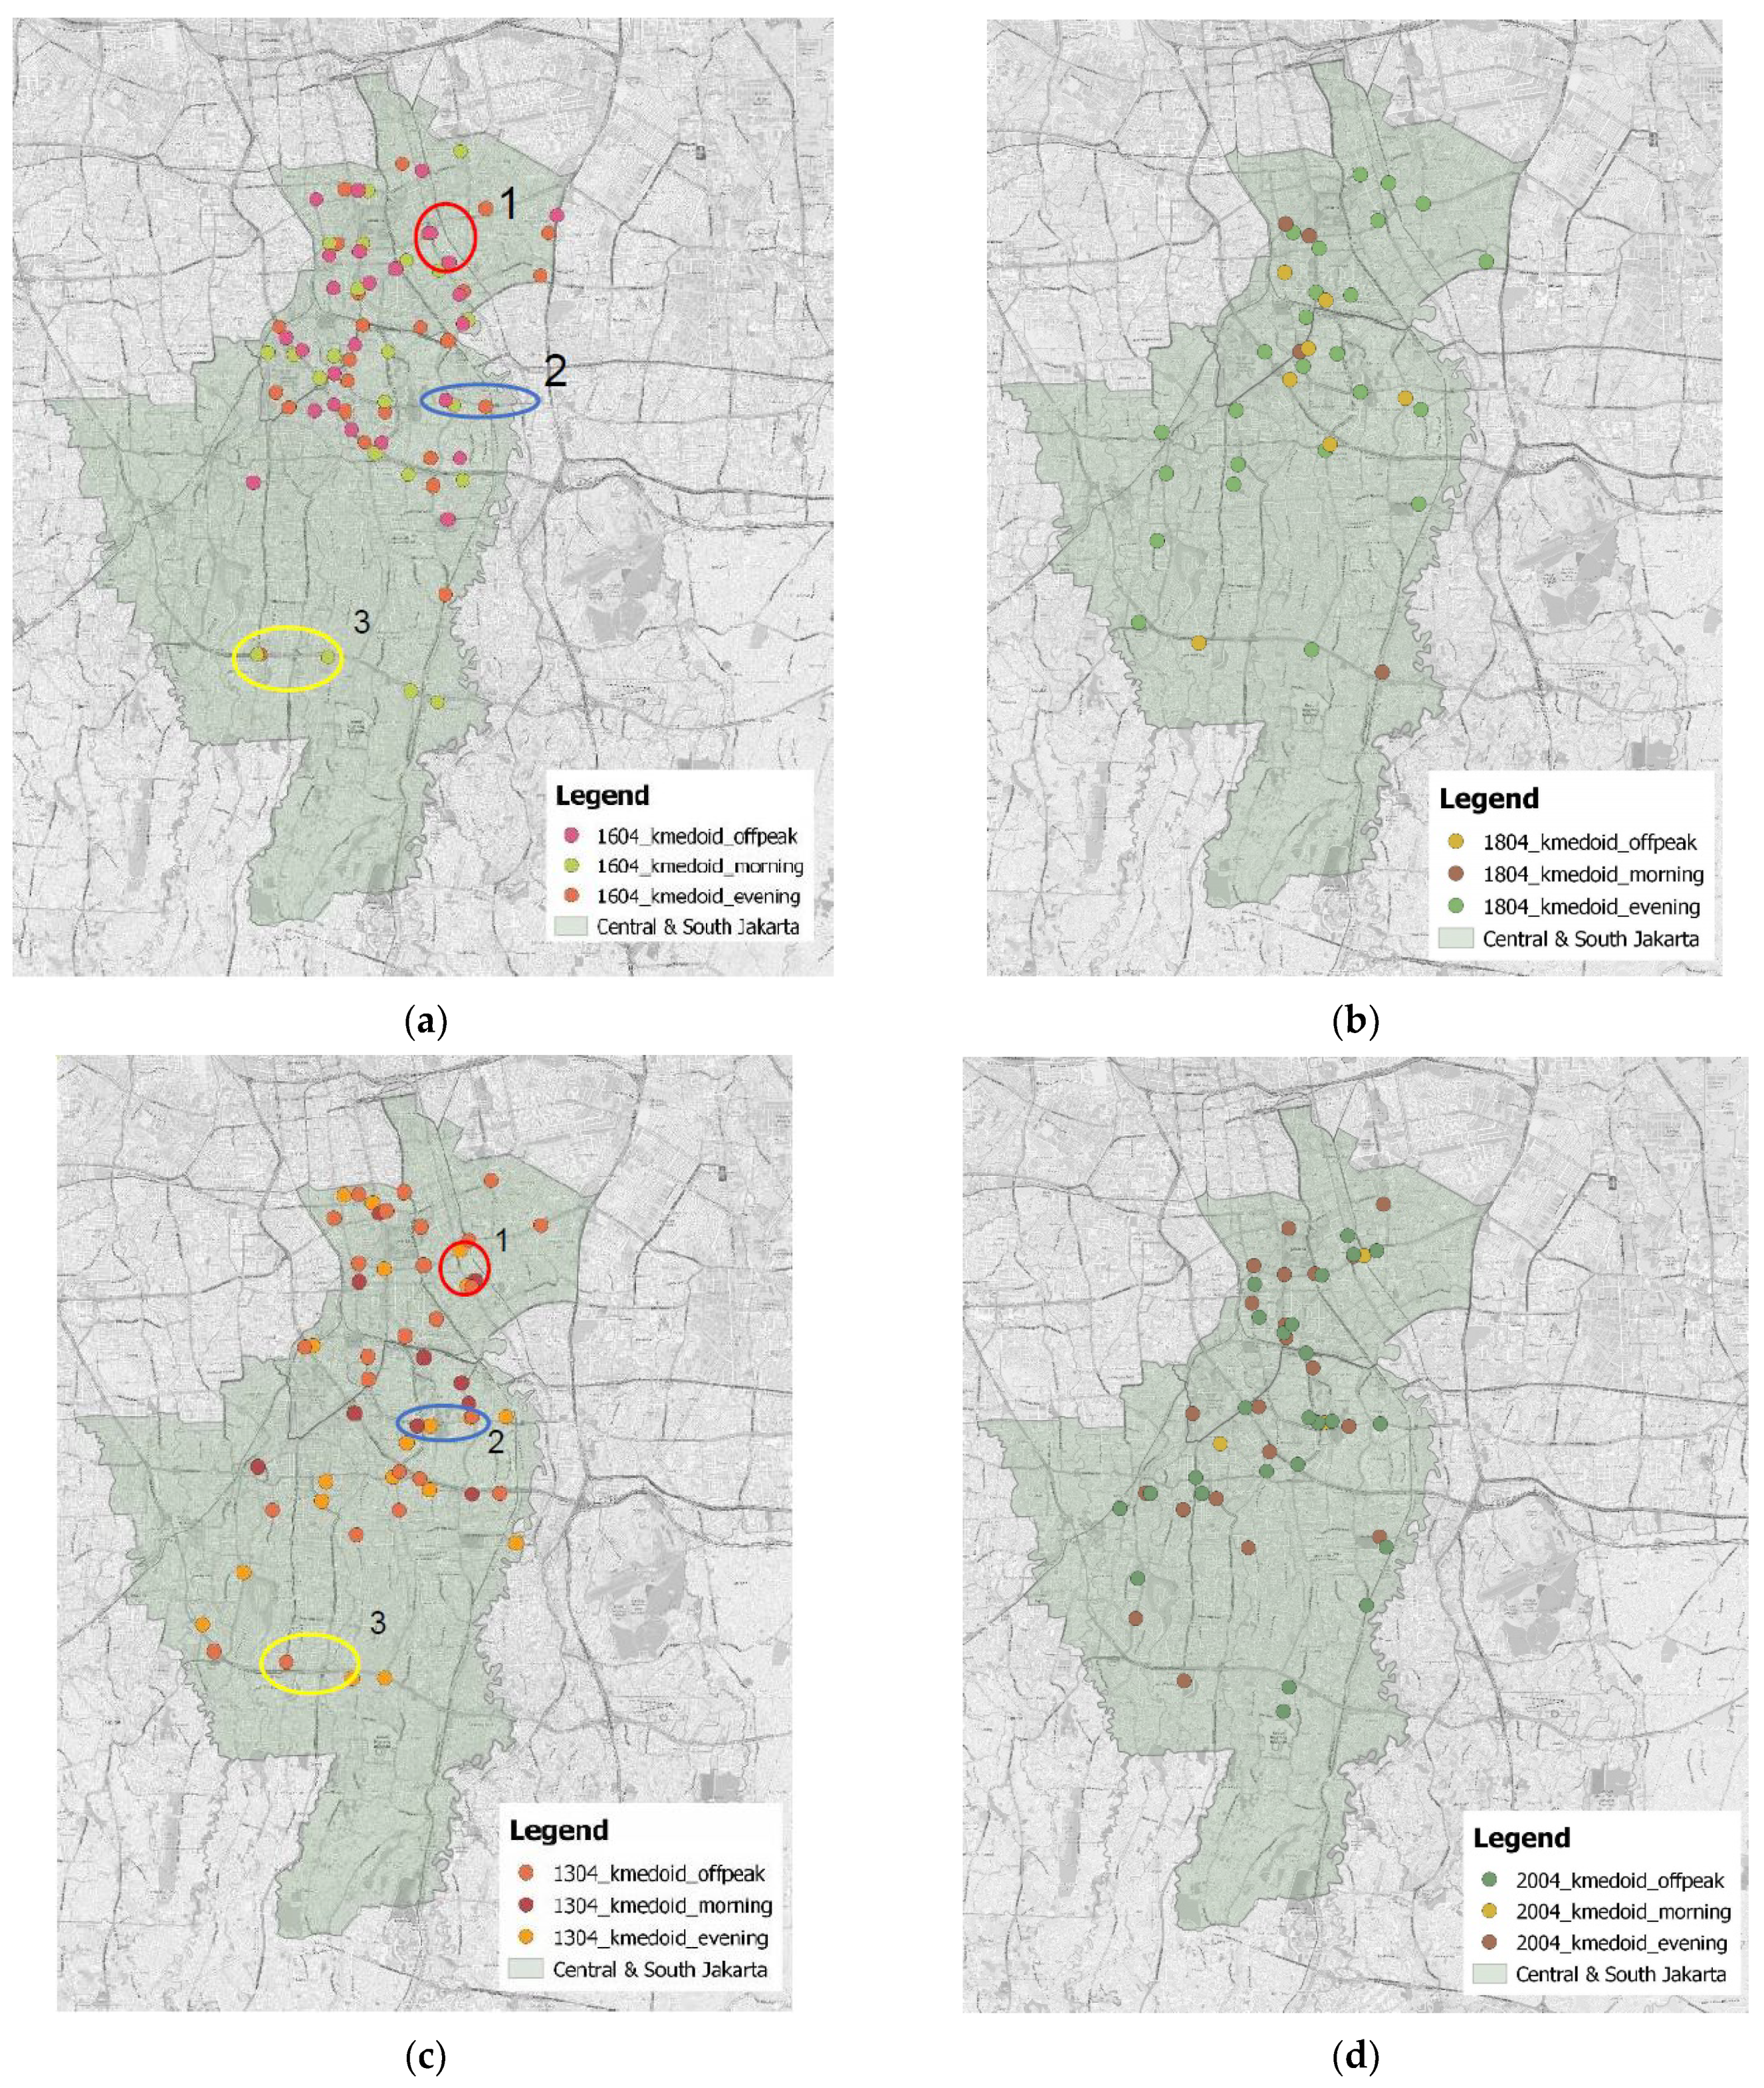
A visualization of PUDO stations in the study area can be seen in
Figure 10. Only k-medoids are shown here since it generally provides consistent good results. Close observation from all the figures shows that the distribution of those PUDO stations often overlapped regardless of the time period. For example, the highlighted areas 1, 2 and 3 of data set 1 and data set 3 suggest similar trends of PUDO points.
Figure 10 also shows that the PUDO points were consistently scarce at the bottom part of the area and clustered at the upper part of the study area. This variation in the spatial distribution of PUDO points is because the upper part of the study area is the central business district, while the bottom part of the study is mainly residential areas. As such, as shown in data set 3 and data set 4, more PUDOs were observed in the bottom part of the study area, which indicates that more trips were made in the residential areas during the weekends, while during the weekdays, PUDO points tend to be located at the upper part of the study area. This finding suggests the similar demand hotspot on some areas throughout the time period. This similarity in demand pattern can also be seen across the observed days.
5. Conclusions and Future Directions
This paper addressed the use of spatial–temporal ride hailing trip data as a potential determination of PUDO stations within a study area. The distribution of traffic demand within the targeted study area can be carried out based on ride hailing data available from local TNCs. The advancement of mobility-on-demand has proven to be invaluable for traffic engineers in developing overall traffic distribution in the area. For further clarification, the provided data were used in developing appropriate PUDO stations within certain constraints. A genetic algorithm was used in identifying the optimum locations and incorporating distance and minimum capacity constraints. Unlike the traditional fitness function that used basic functions such as the sum of a set of calculated parameters related to the problem domain, in this study, a refined fitness function was developed. It consists of the combination of the applied constraints of distance and demand coverage by modifying potential interaction gravity model. This refined fitness function takes into consideration the walkable walking distance and the minimum demand that can be served by the suggested PUDO points. These constraints benefit both riders and ride-hailing operators, particularly in maximizing the total saved travel time and travel cost.
The findings suggest that the algorithm was able to successfully adapt in finding the appropriate number of stations according to the observed demand. The initial population of the genetic algorithm in this location optimization only provides miniscule contribution to the final fitness value. Subsequently, the location placement of those PUDO stations often overlapped with each other throughout time period, suggesting that the demand hotspots within the study area do not change significantly throughout the day. In addition to that, the proposed algorithm was able to adapt to find appropriate placement based on observed demand that assisted in determining optimum pick-up and drop-off (PUDO) zones to improve taxi and ride hailing operation management.
Further implementation of such a system can be used for the deployment of autonomous vehicle (AV) and shared autonomous vehicle (SAV) systems and their fleet management [
16]. Forthcoming mobility-on-demand may incorporate AVs as primary vehicles and utilizing appropriately placed PUDO stations could improve their travel performance while possibly relieving overall traffic issues. Additionally, examination on the effect of such stations towards a possible SAV-PuT system, where a shared autonomous vehicle (SAV) provides FMLM transport connectivity to public transport line (i.e., train, mass rapid transit, and light train), can be carried out as well [
40]. Additional recommendations can be considered to further improve this study, that include considering a wider range of constraints to add to the complexity and adaptability of the algorithm. In this study, generated stations are restricted to 25 stations; however, it is possible for the algorithm to create more stations to better serve the total demand. However, it is clear that the selection of the number of stations used in the algorithm plays a critical role in the location optimization algorithm; hence, the future studies can further investigate the effect of increasing or decreasing the number of stations on clustering results and optimum PUDO locations. Due to certain limitations, the current study uses a simplistic haversine formula to determine the distance between demand data and nearest station. The next consideration will be to take real walking distance into consideration with actual infrastructure within the study area. This allows for better accuracy in calculation as well as improvement in the algorithm process. Another limitation shows some of the resulted PUDO stations located too close to each other and subsequently, their area of service overlapped too much towards each other. We need to spread them out more while taking into consideration the catering of more demand.


