1. Introduction
The EU´s climate and energy framework for 2030 targets at least 40% cuts in greenhouse gas emissions from the 1990 level [
1]. In the energy supply sector, this means decarbonization, and in the demand sector, like the building sector, this means energy efficiency improvements. Energy efficiency requirements for new and existing buildings are set by directive (EU) 2018/844 (EPBD), which is an amendment to the Directive 2010/31/EU on the energy performance of buildings and Directive 2012/27/EU in energy efficiency [
2,
3,
4]. The amendment [
4] emphasizes smart automation and the interaction between buildings and the energy system.
One form of this interaction is a Demand Response (DR). The relevance of the DR concept is supported by several recent studies [
5,
6]. Applications of electrical energy-related DR have been carried out in research and in practice for a long time and several studies have focused on DR in buildings with electric space heating [
7,
8,
9,
10]. For example, the studies by Rautiainen et al. [
7] presents two DR case studies in an electric heating system, which shows that DR has a positive economic potential for some customers, especially for medium to large actors. Their study [
7] also noted that the benefits of DR for consumers are not only direct monetary benefits but also improved reliability of the power system, avoidance of price peaks, improved economic efficiency of the electrical energy system, etc.
Whereas most of the introduced studies have focused on DR in buildings with electric space heating, few studies have investigated the potential of DR from the perspective of space heating in buildings connected to District Heating (DH) systems. This is likely because DH is not relevant in many parts of the world. District heating currently covers 10% of the total heat demand in Europe. However, it is above all widespread in North, Central and Eastern Europe, where its market share can be 50 to 70 percent. Compared to other European countries, in Finland the share of DH in the residential heating market is high, especially in large apartment buildings. In 2019, the market share of DH in apartment buildings was 88% [
11], as DH is used in cities and suburbs. In total, about 2.7 million people in Finland live in buildings heated by DH [
12]. Like within an electrical system, DR could balance the DH energy demand and supply at the building level as well as at the network level. Based on studies, e.g., [
13,
14], the techniques most worthy of consideration for implementing DR in DH are the following: heat control by time, prioritized Domestic Hot Water (DHW) demand, thermal energy storages, hybrid systems and influencing consumption behaviors.
Although DH-related DR is not as well researched and even less put into practice, Romanchenko et al. [
15] have studied the potential for flexible space heating demand as well as its effects on the heating demand in a case study in Sweden. The study [
15] stated that DR from buildings connected to DH is identified as being the most effective during the period when daily heat demand variations are the greatest (spring and autumn months). It is clear that this causes changes in the space heating demand profile during a couple of days. Heat demand variations in DH systems, however, produce problematic conditions for efficient heat generation. Therefore, a number of papers have concentrated on buildings’ potential for storing heat in district heating systems [
13,
16,
17,
18,
19,
20,
21]. Several pilot projects with DH DR have been conducted in Finland or Sweden. For instance, Kensby et al. [
13] studied five residential buildings in Sweden and evaluated the buildings’ thermal storage potential, while keeping indoor temperature changes as stable as possible resulting in significant storage potential with minimal indoor temperature-related consequences. The adjustment method for keeping the indoor temperature stable was based on the time-controlled periods of peak shaving and charging. Kärkkäinen et al. [
21] studied two Finnish buildings with concrete body and found that a maximum heat load reduction of 20%–25% can occur during two- to three-hour DR events, while a less than 2 °C temperature drop was experienced in the indoor space. However, when Kärkkäinen et al. performed an identical test in Germany, only a 4.1% peak heat reduction and a 14% increase in total heat consumption were achieved due to the deployed preheating [
21].
More pilot tests were conducted in a residential area in Sweden, where Wernstedt et al. [
22] used an agent-based model for optimizing the heating of the entire residential area. Pilot tests indicated 2%–6% variations in heat load reduction potential on average during one day [
22,
23]. The same agent-based model was utilized in a proof-of-concept pilot study in three different DH systems in Sweden. Johansson et al. [
24] presented that pilot study and showed 7.5% savings in total energy consumption with 20% peak load reductions in groups of buildings and with further system improvements; the study showed this figure could possibly increase to an estimated 10%.
Furthermore, a few studies concentrated on economic benefits [
17,
21], as well as on energy flexibility and DR’s impact on indoor temperatures, although these were based on simulations. For example, Koponen et al. [
25] studied the DR demand response in a seven-floor blockhouse connected to district heating using the IDA-ICE building simulation software model [
26]. However, this study showed that by manipulating the outdoor temperature signal by ±7 °C, the room average temperatures did not vary significantly, and there was no notable change in the yearly energy consumption for space heating, which resulted in the possibility of more aggressive actions and improved flexibility. As a result, the study noted that new field tests would be required.
Whereas most of the above-mentioned studies, which investigated the potential of DR in buildings connected to DH systems, have concentrated mostly on thermal storage potential as a DR method or simulations, there is a gap in the current knowledge regarding the field testing of DR in DH using the methodology of prioritizing Domestic Hot Water (DHW) for peak shaving. To the author’s knowledge, only Eriksson [
27] has studied the DHW prioritization in practice. In his study, the connection was set to be activated immediately when the temperature of DHW dropped by 1 °C from the set value. The peak shaving of heating power stopped when the temperature of the DHW was returned to the set value. With this method, all DH power peaks were reduced by approximately 8% during the test period. However, the control of the heating power was often stopped earlier than planned, which caused unreliability related to the identification of peaks [
27].
This study demonstrates the potential of DR and its feasibility in apartment buildings connected to DH by using saved energy, emission cuts, peak load control, and saved energy costs as indicators. These indicators have been performed in order to find an optimal DH production profile and beneficial options for the energy user. To fill the knowledge gap mentioned above, this article presents the results of the field test on a typical Finnish DH network using the DHW prioritizing methodology developed in [
28].
The article is structured as follows:
Section 2 describes the research question and provides justification for the study. In
Section 3 the developed method, the technology used and the cases are presented.
Section 4 describes the findings of the field test and presents the available data.
Section 5 analyzes the data and experiences of the case studies affecting the development and use of DR in the future, and presents future work proposals. Conclusions are made in
Section 6.
2. Research Question
The main objective of this field test has been to test the feasibility of DHW prioritizing as a DR method in apartment buildings. Against the given background, the following sub-objectives are constructed: (1) Can DR cut the greenhouse gas emissions of district heating production? (2) Does the DR system support cooperation between buildings and energy systems? (3) Is DR a sufficiently interesting business opportunity from the stakeholder point of the view?
1. Can DR cut the greenhouse gas emissions of district heating production?
DH systems in Finland experience significant variations in heating demand such as seasonal and daily variations [
28]. This demand profile of DH usage causes peaks and defines the need for different types of heat production plants [
13]. In Finland about 75% of district heat is produced in Combined Heat And Power plants (CHP) [
29,
30,
31]. They have the best power- and cost-efficiency when they are running continuously at maximum power. Smaller production units, which are not so efficient and use only fossil energy carriers as energy sources, are typically used to meet the high winter demand [
12,
29]. The demand profile also includes systemic variation within the day and between the weekdays. Demand peaks during the days are mostly caused by the energy need of the DHW [
32]. Large variations in heat consumption result in the frequent starting and stopping of peaking units, which are often fossil-fuelled boilers. By cutting the peaks in consumption, the need for activating peak power plants could be diminished. At the same time, the utilization rate and the active time of power plants could be improved in basic power plants.
2. Does the DR system support cooperation between buildings and energy systems?
The European Commission has provided the revised Energy Performance of Buildings directive [
4]. The most important changes concern automation. The automation commitment comprises the non-residential buildings, where the heating and air-conditioning systems’ nominal output is more than 290 kW. For residential buildings, automation requirements are currently voluntary [
4].
The Directive [
4] demands the establishment of a Smart Readiness Indicator (SRI) for buildings. A SRI rates the capability of buildings to adapt in response to the needs of the occupant and to the situation of the energy grid [
4,
33,
34]. DR could be one way to fulfill the EPBD demands regarding the use of smart technologies and SRI.
About 30% of the Finnish building stock is from the 1960s–1970s, and a significant proportion is undergoing renovations. In general, it is profitable to increase the energy efficiency at the same time as the other renovations [
35]. However, not all the old buildings can be upgraded at a reasonable cost. Buildings can, for example, have special architecture, which makes additional insulation impossible. To enable energy savings in these kinds of buildings, new technologies are needed.
3. Is DR a sufficiently interesting business opportunity from the stakeholder point of the view?
DH customers are encouraged to limit their energy usage during peak hours, when the cost of energy production is the highest. DH companies are pricing the fixed part of energy based on the power need: the lower the power usage, the lower the energy price [
21,
36,
37]. Is it possible to design an interesting business concept despite the challenges?
3. Development of the Field Test
3.1. Applied DR Method
There are several methods to reduce heating power peaks caused by tap water. For example, there could be a water accumulator installed on a heating system. Another approach is to decrease tap water flow by installing pressure limiters on each faucet. These kinds of actions, however, require building owners to make an investment and it is quite difficult to calculate the benefits.
If we consider continuous and real-time-based methods to identify tap water usage, there are at least three approaches in addition to the approach chosen in this project. The first study was implemented by Eriksson [
27] in Sweden. In this study, triggering was based on the supply temperature of DHW, which is compared to a set value, and when the water temperature falls below the set point, peak shaving is activated. However, the method was discovered to be unreliable and inaccurate, and needed more parameters for the timing and duration of the peak shaving [
27]. Another approach is to use the water flow amount available from the district heating energy meter as a trigger, and set limits for DH power and flow. This approach requires co-operation with the local DH energy company, as they own the meter. The challenge with this approach is to define the right limit for peak shaving, as the meter is also commonly used for space heating and domestic tap water heating measurement. A third alternative would be to add a water meter to the DHW supply pipe and to measure the water flow amount. Once the flow hits the set limit, peak shaving would be activated.
All three of these alternative methods include some reliability issues that set some limits on their usability, especially in such networks where the fixed fee is based on the few absolute measured peak hours. For these reasons, in this field test the developed DR method is based on a continuous and real-time monitoring of tap water usage level and on using an algorithm that can reduce the power in heating radiators when tap water-based power peaks occur. In order to effectively reduce the power peaks, the algorithm uses a trigger, which monitors the DHW valve position and district heating supply temperature, to turn peak shaving on and off at exactly the right moments. This kind of approach has been tested and has been shown to be a reliable method [
28] resulting in significant peak power reductions without any separate instruments or connections, as can be seen in
Figure 1 [
28].
3.2. Technical Scheme of the Smart DH
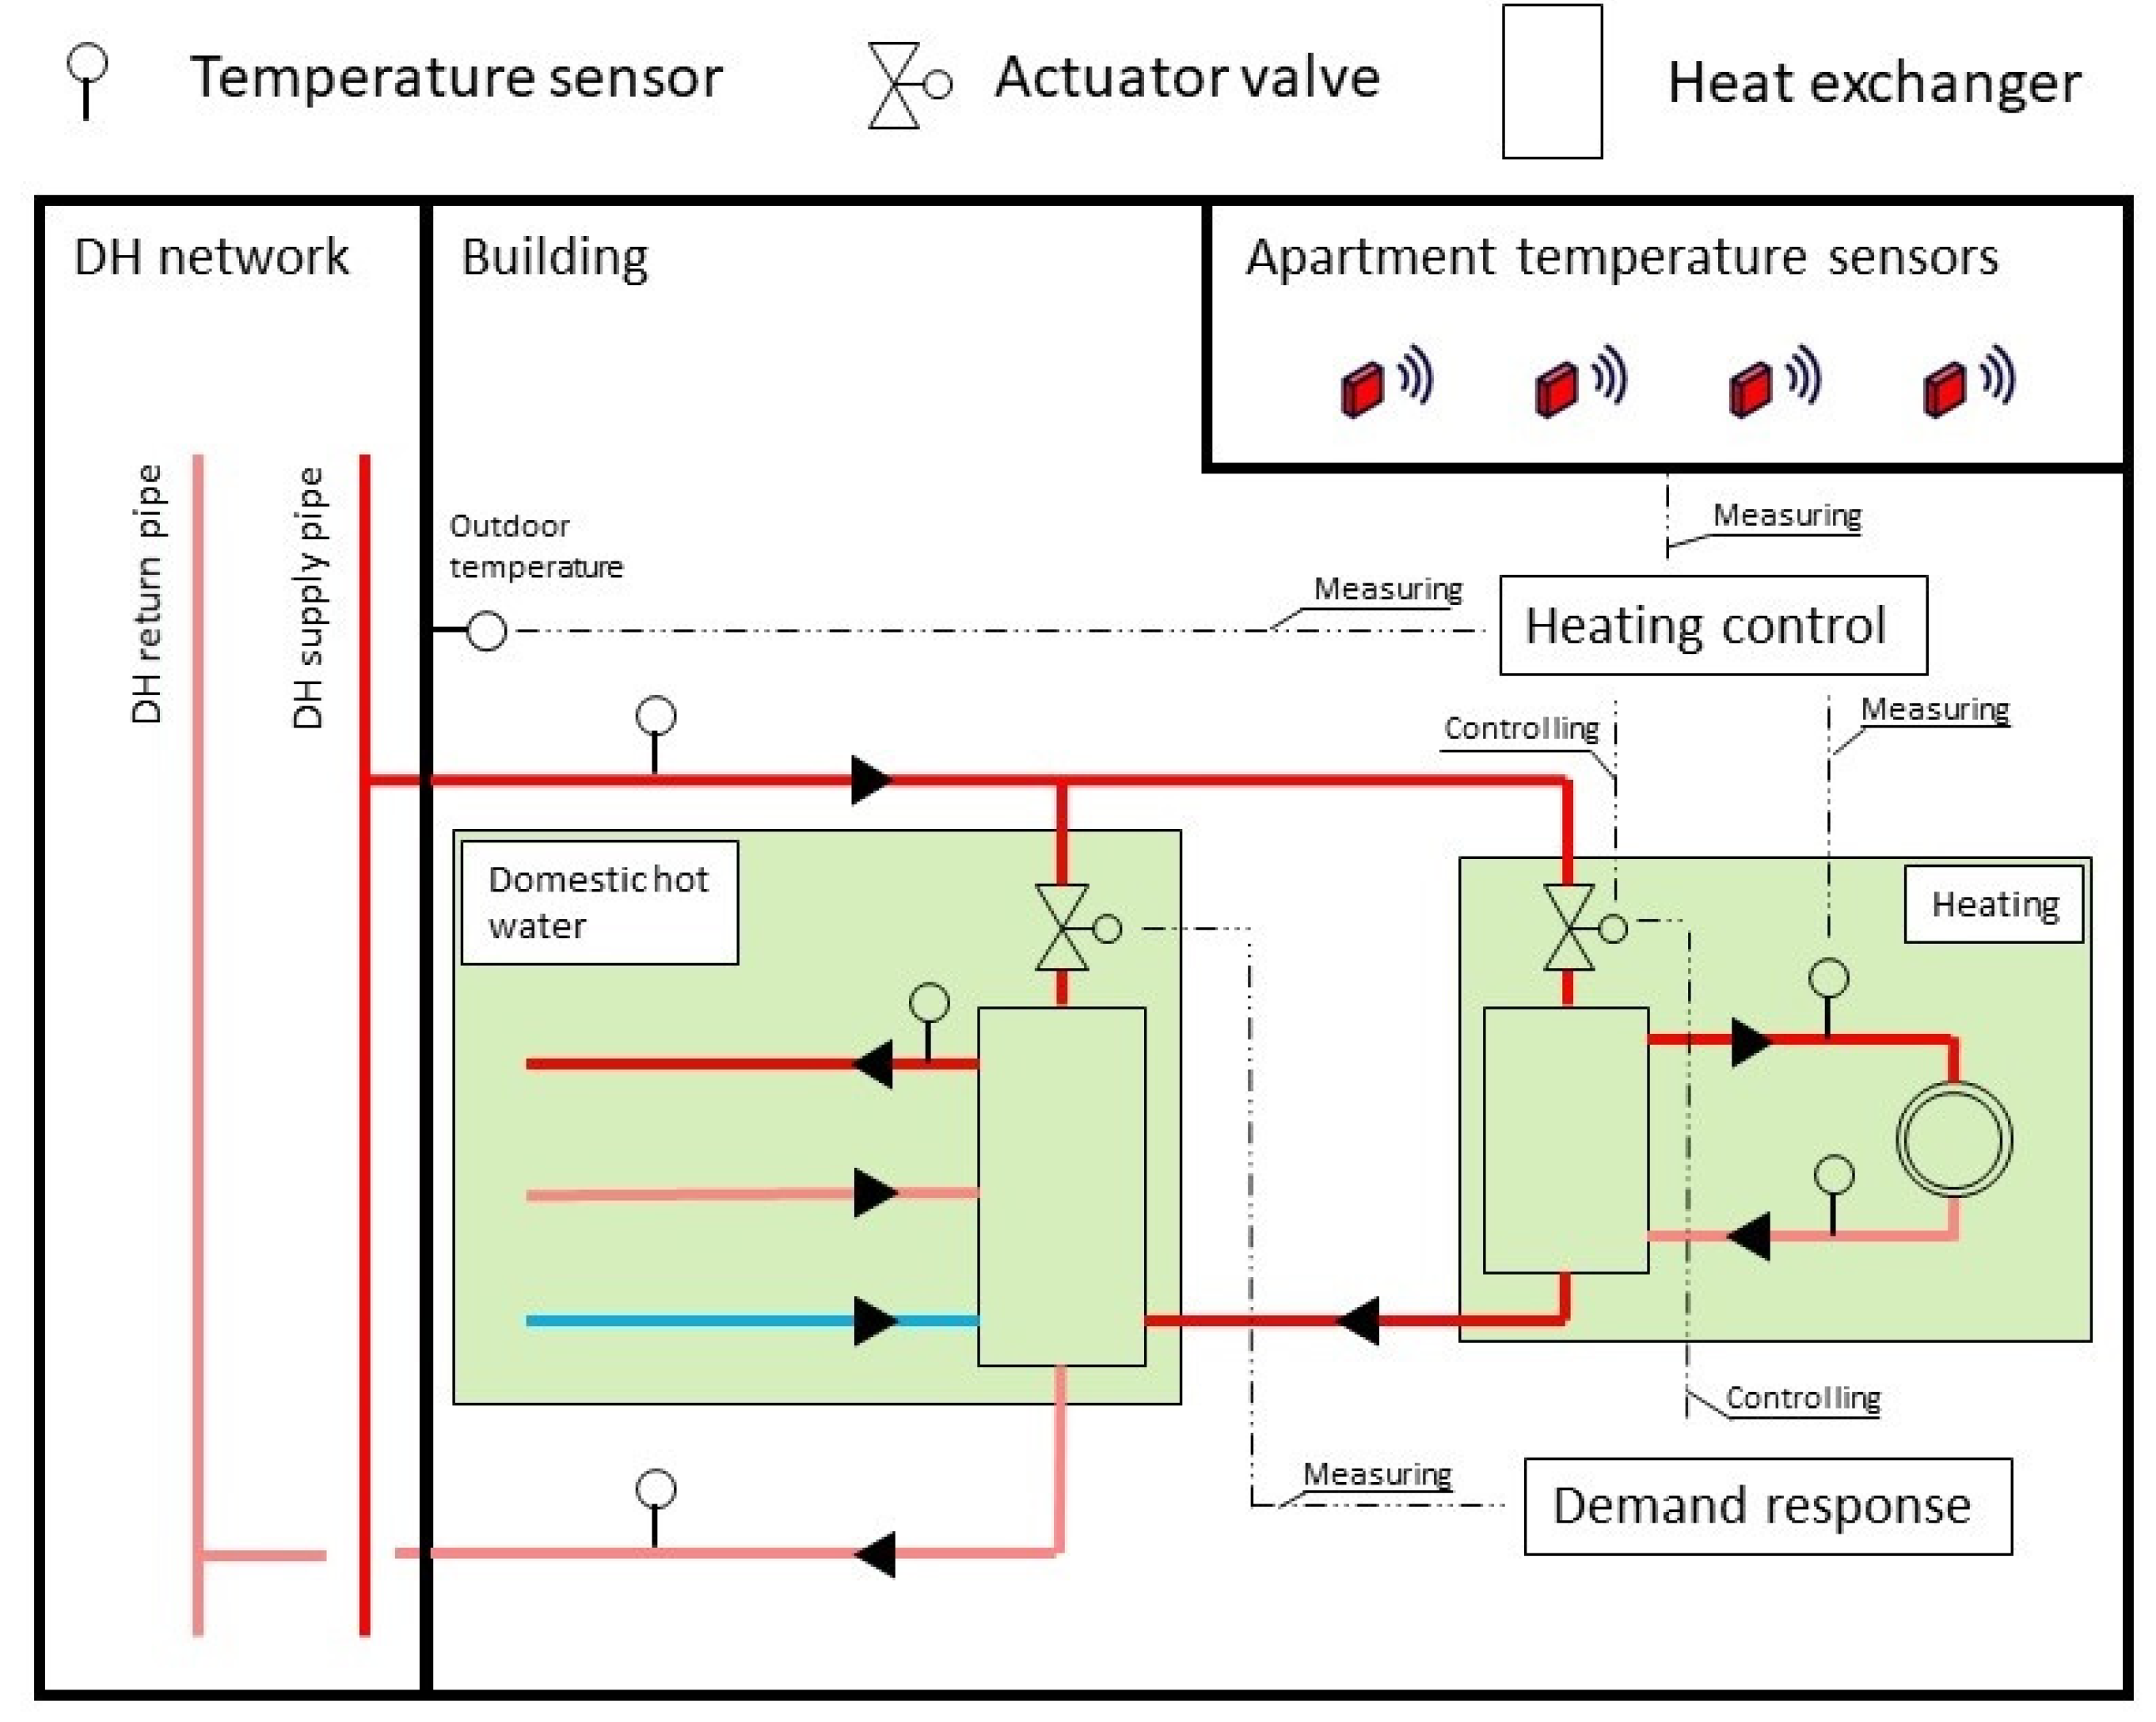
Space heating systems in Finnish apartment buildings are typically based on centralized heat distribution pipelines with radiators and are connected to a district heating network [
38]. Since the heating power demand of the building is dependent on the temperature difference between outside and inside, supply temperature to the radiators is tied to the outside temperature. The typical temperature levels of water supplied to radiators varies from 20 to 75 degrees Celsius, where corresponding outside temperatures are +20 to −30 degrees Celsius. Adding temperature sensors to apartments provides a much preferable value for controlling the heating needs of the building, producing a situation where the heating is constantly being driven by the desired indoor temperature (
Figure 2).
DH is also used for heating DHW. Since the heat is transferred from the DH network to radiators using a heat exchanger without any buffering capability, power peaks always occur when tap water is used. In addition, when there is high tap water use, e.g., many people are showering at the same time, there is a high power peak. These power peaks typically occur in the mornings and the evenings, but they may also occur at any time of the day, depending on inhabitants’ living profiles. Therefore, the DR is based on the sudden increase of DHW usage. The state (0%–100%) of the actuator valve for DHW is monitored and after a certain threshold value is passed, the energy for heating is reduced by restricting the actuator valve.
Both of the mentioned functionalities are used at the same time. Apart from that, the measured indoor temperature is also used as a safeguard to avoid any unnecessary cooling in the building.
Generally, the basic idea of the DR in large apartment buildings is to use a suitable method that is capable of reducing these power peaks, without negatively affecting the tap water temperature and the temperature level inside the building. Building owners who pay the energy bill can gain financial benefits if power peaks are reduced. The energy bill includes two main components: one is the amount of energy consumed and the other is a fixed fee that is based on DH power used and some other parameters.
There are several different pricing models to calculate the fixed fee, but from the DR point of view, they can be divided into two main categories. In the first category, the fee is based on the absolute measured peak hours, for example during the 3–5 highest peak hours of the year. The second category defines the fee using the linear regression method. In the latter case, all hours during the heating season are used to determine the peak power. Benefitting from DR, the used methods should include elements from both categories.
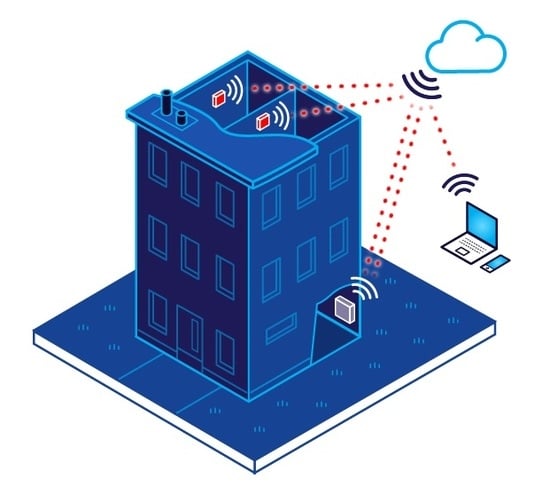
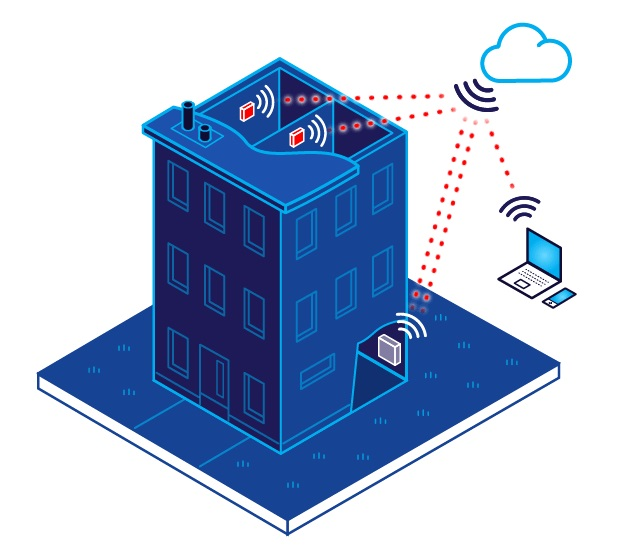
3.3. Field Test Technology
Continuous and real-time tap water monitoring, as well as installed indoor temperature and humidity sensors, are connected to the Talotohtori cloud service. The service is vendor-neutral and can interact with different kinds of building automation systems and Internet of Things (IoT) devices [
39]. The service includes indoor conditions monitoring and analysis, remote building automation control, smart heating control, and energy consumption monitoring.
As Talotohtori is a cloud-based Building Management System (BMS), its core is a standardized data model (
Figure 3). This means that every building is modeled against the same data model and all functionalities, user interfaces, and REST (Representational State Transfer) APIs (Application Programming Interfaces) are using the same model, which makes the BMS scalable and easy to operate.
The BMS architecture includes the following modules:
Module 1 offers a unified, responsive HTML 5 user interface and mobile-friendly views (Android, iOS) based on a standard data model. The user interface (UI) is based on a standard data model, including Operational Technology (OT) and Internet of Things (IoT) tags and system templates, such as process views. This module also offers a comprehensive alarm management system, data history and reporting functions.
Module 2: If BMS is used under the SERVER license model, it is delivered as a white label version allowing customers to use their own brand.
Module 3 gives an interface language options.
Module 4: BMS supports the majority of automation brands and protocols available on the market. When the individual building automation is connected, its OT tags are mapped against a standard data model.
Module 5: BMS also offers an Access Point Name (APN) solution to connect buildings to the Internet in a secured way. An APN solution is provided by the GSM Mobile operator DNA [
40].
Module 6: In case the building is already connected to a 3rd party cloud service, then the connection is made using the Internet Protocol Security/Virtual Private Network (IPSec/VPN) connection.
Module 7 offers connections to various data sources that are needed in smart heating solutions. These are, for example, weather forecast data and electricity spot prices.
Module 8: When using smart heating algorithms, it is essential to know the indoor air conditions, such as temperature. IoT sensors are a cost-effective way to gather that kind of data in real-time. This module offers interfaces to all common IoT standards such as LoRa, Sigfox, and NB-IoT.
Module 9 offers interfaces to other cloud service providers and Module 10 is a web store where customers can find and purchase necessary services and products.
As mentioned in Module 8, the monitoring of indoor conditions is based on the IoT sensors using Sigfox radio technology [
41]. Sensors send measurements to the cloud at ten-minute intervals. The BMS calculates the average temperature of all sensors and compares it to the desired room temperature. If the actual average temperature is lower or higher than desired, then the building automation is instructed to adjust heating to the target level. The capability to keep the room temperatures constant and at the desired level is one of the benefits of monitoring indoor conditions. This is the foundation service running in the background.
On top of this foundation service, the power peak shaving algorithm is executed. The algorithm is allowed to run under a predefined average indoor temperature range. Typically, this range is plus/minus 0.5 °C. For example, if the desired average temperature is 21.3 °C, then the allowed range is from 20.8 to 21.8 °C. As far as peak power cuts are concerned, there is a lower limit for reliability, which prevents the cut of the heating power if the indoor temperature is too low. In addition to these algorithms, the weather forecast-based algorithm is applied to prevent overheating, especially in spring when the nights are typically cold and days are sunny and warm. In such conditions, it is important to adjust heating based on the forecast. These algorithms are based on the trigger system explained in
Section 3.1.
3.4. Case Buildings
The field test was conducted in 27 residential buildings, owned by the Tampere Student Housing Foundation (TOAS). The oldest building was built in 1928, five of them in the 1950s and the newest building in 2009. With the exception of the oldest building, the buildings are all multi-story concrete element buildings. Three of the buildings have in/out-ventilation while the rest only have mechanical exhaust ventilation and one building has an exhaust air heat pump. Before the DR test, buildings were already equipped with a smart automation system, which controlled heating according to the weather forecast. All these installations are considered to be DR systems. Since some of the buildings are connected to the same heating system, they are compiled into eight cases. In this study, the cases are named Building 1–Building 8 (
Table 1).
4. Results of the Field Test
The active test period was February 2018–March 2018. During these months the algorithm continuously controlled the space heating of the buildings. The weather-corrected normalized energy consumption of eight buildings was reduced from 2601 to 2311 MWh, which represents an 11 percent reduction, as shown in
Table 2.
The test demonstrated that DR could reduce energy consumption even when there already is a dynamic weather forecast control in use. In eight case buildings, the total cost saving in February and March was over 26,000 euros (
Table 3).
February and March are the winter months when space heating is needed the most. Typically, these months account for about 25 percent of all heating needs. This has to be taken into account when annual energy and cost savings are assessed. The baseline is the situation when only the fixed heating control based on outdoor temperatures is used. The test result is the outcome of the smart DR system, which takes into account in heating control weather forecasts, indoor temperatures, and DHW consumption. As we can see in
Table 4, savings were not equal in all the buildings. The best impact of the smart building automation was in Building 8, which is the newest. Good impact can also be achieved in old buildings, like in Building 2, which is the oldest case building, built in 1928.
During the intensive test period, the peak power was reduced by 14%–15% on average as seen in
Table 5. The lowest reduction was only below one percent (Building 5 in February) and the highest was nearly 30% (Building 4 in February). The effective cut time ranged from one hour (Building 5 in February) to 200 hours (Building 4 in March). Case Building 5 consists of a cluster of seven buildings. The tested technology is not as feasible for a cluster of buildings compared to a single building, i.e., to a simpler heating system.
Four case buildings were equipped with indoor monitoring for two reasons. Firstly, to control the heating, and secondly, to monitor the level of indoor comfort. The background algorithm was running to keep the average temperature at 21.3 ±0.5 °C. The indoor temperatures were monitored every ten minutes. During the period of January 2019–March 2019 there were 12,835 samples in four buildings. 99.4% of them were in the targeted range. The energy savings achieved by active DR control did not diminish the level of indoor comfort.
The DR service of the heat provider, developed side by side with the field test, is enabling the use of energy-efficient DH during the heating season by optimizing heating needs in buildings. DH customers are wasting about 10% of their consumed district heat, which shows that there is plenty of potential for energy savings, especially through indoor air temperature optimization. The price of the basic service in this study is 199 euros per month or 2388 euros per year, which includes only DR features like energy saving by peak load control. It also offers customers a digital tool to follow and control the usage and costs of DH. Besides the basic service, the extended service with a wider amount of sensors can be purchased apartment-specifically for 5.5 euros per month. The purchase of the service is included in the resident´s maintenance fee. This study has shown that a monthly payment seems more suitable for customers, as it is challenging to guarantee repayment time before acquiring the deeper data of the initial situation. It also highlighted that the service provider itself needs to significantly invest in the description and demonstration of the service, as it is still unfamiliar and may be a bit uninteresting for customers. From a customer point of view, the profitability of the DR service depends strongly on the size of the building (
Table 6).
5. Discussion
As with the results of Koponen et al. in [
25], new field tests are required to investigate the changes in yearly energy consumption of spaces. Among other things, this study answers that need by investigating the DR capability in apartment buildings connected to DH for saving energy, cutting emissions and controlling peak loads. This study also examines profitability from the perspective of the district heating operator and the service user.
The tested DR method used sensors (which were installed in at least 30% of the apartments) to measure room temperatures, weather forecasts and tap water consumption, and adjustments were made to room temperatures in the field test buildings based on this information. Three sub-objectives were set to determine the feasibility of the tested DR as a tool: (1) Can DR cut the greenhouse gas emissions of district heating production? (2) Does the DR system support cooperation between buildings and the energy system? (3) Is DR a sufficiently interesting business opportunity from the stakeholder point of the view?
5.1. Reduction of Greenhouse Gas Emissions
Demand peaks result in frequent starting and stopping of the peaking units, which causes the largest marginal emissions and costs, as peak power plants mostly operate using fossil fuels. By cutting the peaks in consumption, the need for activating the peak power plant is reduced and the utilization rate and active state are improved in the basic power plants. As illustrated in the results of this study, the peak load of the case buildings was decreased by 14%–15% on average. The study showed a clear variation between buildings, presenting the highest peak power reduction of nearly 30%. The results were similar to Johansson et al., who displayed a 15%–20% potential for reducing peaks [
24].
The field tests have demonstrated that DR shifts the peak hours to other hours, thus leveling the consumption of energy to a more flat profile and eliminating the need for secondary power plants. By doing this, energy production is more stable and the amount of renewable energy production can be increased by 1%–2%, which qualifies for the EPBD directive (EU 2018/844) commitment to increasing the proportion of renewable energy consumed.
5.2. Smart Interaction between Buildings and Energy System Emissions
These case buildings were already applying modern heat optimization services and had executed several energy saving tasks when the tested DR system was integrated into the existing automation system. The combination of several systems and services naturally makes the comparison and measurement of the impacts quite challenging. Although these buildings already had heat optimization services in use for several years, the tested DR was still able to increase efficiency.
This study pointed out that the buildings´ potential for storing heat is one significant factor for enabling pleasant indoor climate conditions. Kensby et al. got similar results in their study, stating that pleasant indoor climate conditions are easier to reach if the structures and indoor air has a high heat storage capability, since the building serves as a short-term energy storage [
13]. There are also plenty of practical demand side management methods studied concerning the building´s capability to store energy [
22,
23,
24,
41,
42,
43].
As many references, theories, or examples of distribution of consumption show, the DH consumption peaks of residential buildings are mainly caused by the high momentary wattage used for DHW [
32,
44]. The momentary heating wattage used for DHW is not possible to be restricted or temporally moved without a separate water accumulator. The building, however, can be used as a short-term heat accumulator, which makes DR possible by cutting down the heating wattage while there is a high and fast increase in the wattage used for DHW. To achieve some effect in heat production by controlling the DR, there must be a lot of power within the DR, which means there is a need for a number of buildings using a DR service. A redeeming feature is that the DR usage level can be quite high as the residential buildings store heat well, which means that the mass of the building cools down slowly [
13,
16,
17,
18,
19,
20,
21]. It can be seen in the field test that a couple of hours without heating do not have any notable effect on indoor air conditions, and with the help of DR production can be optimized during as much as 33 percent of the day without causing discomfort to customers. Similar results were also reported by Kärkkäinen et al. in [
21], where the heat load reduction in 2–3 hour DR events could even be 20%–25% on average, while the simultaneously experienced temperature drop in the indoor space was less than 2 °C.
The technologies to moderate heat production are DR and DH battery. DH battery, a large hot water buffer, is a centralized solution, whereas the DR is a decentralized way of leveling the fluctuating consumption of the heat energy. While DR and DH battery can be used simultaneously and are technically complementary in relation to one another, from an economic point of view these methods reduce marginal utility.
5.3. Economic Feasibility of the Studied DR System from Stakeholders’ Point of View
From the service user’s point of view, the most significant issues are the availability of hot water and pleasant indoor climate conditions at all times. The costs of these commodities have an important role as well.
Energy bills in Finland include two main components: the amount of energy consumed and a fixed fee, which is based on the DH power used and some other parameters. There are two main pricing models to calculate the fixed fee. In the first category, the fee is based on the absolute measured peak hours, for example the 3–5 highest peak hours of the year. The second category defines the fee using a linear regression method. In the latter case, all hours during the heating season are used to determine the peak power. The recommendable method should contain elements from both categories. However, the producer´s pressure to increase the heating energy prices is also pushing the customer to find ways to reduce the costs. An adequate amount of economic incentives provided by producers is important for creating a firm foundation for DR among their customers [
28].
There are doubts about the profitability of DR. Finnish companies have estimated that the total commercial benefits of DR are 1–3 percent of the annual costs based on the current solutions and experiences [
45]. There are also studies implicating that the value of the demand side management for DH companies remains low. Kontu et al. claim in [
46] that the value would be less than 2% in cost savings, having an effect mostly on medium loads without any significant decrease in annual peak heat loads. However, they stated that the findings also reflect the need for development of DH pricing models to make the demand side management more attractive to DH customers. Similar results were also reported by Romanchenko et al. in [
18], where the cost savings achieved were approximately 1%, and Salo et al. in [
17], whose simulated results showed that even in the best case, heat production costs can be decreased by only 0.7%. All studies mentioned above have reported cost savings to be low. This field test implicated similar results with about 0.2%–0.7% in cost savings at best. Nevertheless, Salo et al. clarified that by implementing hot water thermal storage in the system, DR can become more profitable, resulting in 1.4% cost savings. Kontu et al., however, noticed that the value of DR would change if energy savings were included. As other studies outlined [
21,
24,
41], an energy saving potential of 5%–10% is noted, which is similar to the 9% energy saving of this study case.
According to this study, the cooperation between the energy provider and the service user has significant importance when developing energy efficiency and automation systems around it. The study also showed that even though there may be energy efficiency tools already in place, the tested DR was still able to increase efficiency. However, energy reductions would be much greater in a usual apartment building where no efforts toward energy efficiency have yet been made. As a further development, the study pointed out that DR should be part of the basic building automation system included in every building, including the room sensors. The benefit of this for a service user is that there are no service fees at all. Dominkovic et al. stated in [
20] that in 2029 the benefits of using short-term Thermal Energy Storage (TES) is greater through the increased amount of intermittent generation that can be integrated into the DH system, which implies that the demand for DR implementations may rise in the near future. There is an existing need for further studies, especially in the integration of the available building automation systems and field-tested DR.
6. Conclusions
This study investigated the potential of the prioritization of DHW demand at the expense of the heating in apartment buildings connected to DH through three sub-objectives. The study was conducted as a field test in a northern climate in Finland. The results were evaluated on the basis of four impact indicators: reduction of annual energy consumption, greenhouse gas emissions, peak load, and energy cost saving.
Overall, this field test is a step forward for the techniques for implementing DR in DH, especially in prioritizing DHW demand and plain simulations. While there are several methods to reduce power peaks caused by increased tap water use as mentioned in
Section 3.2, all studied methods included some reliability issues that set some limits on their usability, especially in such networks where the fixed fee is based on the few absolute measured peak hours. This study demonstrated in the field test that by using the methodology developed in [
28], significant peak power reductions are gained with reliable methods and without any separate instruments, connections, or close co-operation and synchronization between the service user and DH supplier. Additionally, the fact that the case buildings had already used heat optimization services gives reason to believe that the reductions in peak load would be even larger if the buildings had not applied any modern heat optimization services before.
When developing automation systems to maximize energy efficiency, cooperation between the energy provider and the service user is significant and important, as demonstrated in this project. In addition to that, by using a building-specific DR system and the heat storage capacity of a DH network, it is possible to moderate heat consumption so that the need for energy from peak power plants is diminished.
As a conclusion, decision makers should see DR technology as a viable way to save energy and reduce greenhouse gas emissions. As a measure, we recommend that DR requirements are included in energy efficiency requirements. Additionally, more building automation education is needed to realize the full benefits offered by these technologies.


