Abstract
Meeting the needs of increasing environmental and systematic pressures in urban settlements requires the use of integrated and wholistic approaches. The Urban Systems Design (USD) Conceptual Framework joins the metric-based modeling of rationalized methods with human-driven goals to form a combined iterative design and analysis loop. The framework processes information for the fundamental element of cities—humans—to large-scale modeling and decision-making occurring in district- and ward-level planning. There is a need in the planning and design profession to better integrate these efforts at a greater scale to create smart communities that are inclusive and comprehensive in aspects from data management to energy and transportation networks. The purpose of this study is to examine the applicability of this method as it pertains to a model and design integrated approach. Northern Sumida Ward, located in Tokyo, exemplifies the contextualized needs of Tokyo, and Japan, while forming a coherent internal community. Focusing on methodology, our process explores the creation of typologies, metric-based analysis, and design-based approaches that are integrated into modeling. The results of the analyses provide initial evidence regarding the validity of the USD approach in modeling changes to complex systems at differing design scales, connecting various qualities of the built environment, building and urban forms, and diagnostic comparisons between baseline and change conditions. Because of some inconsistencies and the need for further evidence gathering, the methods and processes show that there is much work to be done to strengthen the model and to continue building a more productive field of USD. However, in this framework’s continuing evolution, there is increasing evidence that combining the planning and design of urban systems creates a more resilient, economically viable, sustainable, and comfortable city.
Keywords:
urban planning; resilience; sustainability; economics; human factors; Tokyo; Planning Support System; GIS 1. Introduction
In 2018, urban areas accounted for 55% of the world’s population, and these are expected to grow to 68% by 2050. This growth will shift 2.5 billion people into urbanized areas [1,2]. Cities and their urbanized surroundings consume 60–80% of the world’s energy and produce 70% of all greenhouse gas emissions, based on 2012 estimates [3,4]. Public and private awareness of the potential effects of climate change has been steadily increasing globally prior to and since the signing of the Paris agreement in 2016 by nearly every nation globally, as evident by cities reducing their total carbon emissions by 2020 [4,5]. In response to this agreement, developers, communities, cities, governments, and others have set goals to decarbonize cities and local areas. These endeavors may focus on the creation or implementation of smart buildings and cities, focusing on the role that technology and innovative systems must have in alleviating carbon dependency [6]. Conceptual design and smart city-oriented processes are employed as a means of metric objectification to inform designers and stakeholders about the intended effects a plan may have. Both terms—conceptual design and smart cities—have wide global definitions that change depending on locality, but all share common themes: the integration of new technologies, innovative design process, systematic approaches, and a community-centric design [7].
However, both of these methods are still fundamentally tied to traditional planning and development methods due to the common approach of approaching each individual project, aspect, or condition in a separate and disconnected way. Traditionalist planning and design approaches examine projects and urban innovations on a project-by-project basis, not as segments of a larger, emergent system [8,9]. This approach results in less efficient urban systems and places a lower priority on collective humanistic driven planning and design.
Urban environments are constructed out of a nexus of complex and interconnected systems that use a mixture of objective and subjective means to make decisions [10,11]. Through technological and experiential methods, Urban Systems Design (USD) seeks to merge the objective (analysis) with the subjective (sensory) to create better long-term resilient communities and systems. It is possible to connect systems together to study their combined effects when System-of-System (SoS) integrated planning is employed [12]. There are examples of models which have been already developed and are in use that integrate the management of urban systems under one framework, generally referred to as Planning Support Systems (PSS), but these systems are used only to support future decisions based on current conditions and information available from data in the PSS, not on evidence of the positive (and negative) impacts that will come from a current decision under future conditions [13]. There is a need to build upon this model by integrating more smaller-scale decision-making with the greater goals of the community—the early steps of this integration are shown in this case study using the proposed USD framework.
Using the northern section of the Sumida Ward in Tokyo, Japan, this study examines the creation and application of the Urban System Design (USD) Conceptual Framework as an initial proof of concept. This proof of concept examines the process, methods, models, and outcomes of the basic Urban Systems Design approach as it currently stands.
2. Background
The USD Conceptual Framework arose from the convergent expansion of technological methods in planning and design, the increased complexity of urban systems and the need to investigate them using an interconnected methodology, and the role citizens must have in shaping the development of their cities. Additionally, since the role and importance of citizens in shaping urban space has been discussed in the literature (e.g., McFarlane, 2011), planners must investigate how to make or cultivate urban communities using developing technological innovations such as the Internet of Things (IoT) [14].
Challenges to traditional planning theories and methods have been growing since the 1970s, with McLoughlin’s book “Urban and Regional Planning: A Systems Approach”, which expresses the need to consider cities as a set of systems and controls, not as a series of one-off iterative designs [15]. One of the first pioneers in the realm of planning, Geddes, struggled with these concepts and questioned how cities were as much an emergent property of humanity as an organism in and of itself [16]. Earlier pioneers’ work in planning would be hampered and hamstrung by the failures and over-reliance on data and rational methods, specifically inside the United States of America. The group’s concerns led to the rise of alternative, more human-focused design and development strategies found in advocacy planning and community development theories [17]. Despite these early failings and a now divergent and mixed field of wildly disparate methodologies, system complexity has begun to attract additional attention. As new technologies offer new insights and capabilities to planners and designers, researchers such as Michael Batty, Juval Portugali, and others are attempting to tackle these challenges [6,18,19]. Central to these new attempts is that contemporary theories need not be considered in complete contrast or opposition but as ends of a multi-layered spectrum. Through careful and sensitive applications of data, systematic approaches, and community involvement, a humanistic complex system can be developed. This consideration yields the four pillars which are the cornerstones of the proposed USD model: resilience (social and ecological), economics, sustainability, and human well-being. Combing these aspects requires not only the use of big data and sensor technology, but also a change in the way planners view information and data. Shifting from solitary interventions to a model of continuous design requires planners and communities to employ computer-aided design techniques; however, ultimately, citizens are the basis of design and decisions.
Design is an important part of urban planning as it involves the interaction of humans with their respective systems—a discipline and set of theories which have changed dramatically since the 19th century. Peter Hall’s book, “Cities of Tomorrow”, serves to demonstrate this evolution and the role new technologies and design theories have had. Designs have risen from cultural bedrock and have become merged with technological innovations in the 20th to 21st century [20]. Design serves as the link between what are often cold and tactless data with the sensory world that human beings inhabit. The failures of design in planning and data-driven solutions can be seen in the open-application and singular focus to use only data-driven solutions, without also taking a humanist approach. Humans do not conceive of space and systems in the same calculating manner that models often depict. They are stochastic when compared against others, or even at times themselves. Examples of the early failures of singular-focused data application can be seen in the planning profession’s early phases in the United States of America, during the 1950–1970s, when rational planning created objects that failed to account for humanity [17]. Much of these failures were due to bad, incomplete, or unknown consequences that we are more aware of now; however, some focus areas of the profession, such as transportation planning, still overuse these methods today and display the results in a simple objective [21]. Looking toward the future, it is important that we use technology effectively and continue to prioritize humane design in planning our future cities, as models do not give answers to complex problems of urban planning but to the questions asked that are used to inform designs and plans constructed for humans.
The combination of design with critical and metric-based evaluation is the point at which the theory and technical objective qualities of the strategy meet the subjective and flexible unknowns of reality. It is in this combination when the data science and expertise of models are used with the intuitions and design sense of those regularly working on subjective qualities. With the given knowledge and the importance of flexible design, this process seeks to apply the iterative qualities of modeling and design to develop the “best” plan. It is the role of modeling results and metrics to inform the design and act as a design window, or bounding box, for the purposes of creating equal solutions which meet the statistical and humanistic quality needs of the study area.
Prior to exploring the methodologies and content of this initial case study, it is important to clarify three core assumptions upon which the entire framework hinges: urban systems, community-level design, and abstractions.
2.1. Urban Systems
Urban Systems Design is constructed around the nexus of individual urban systems’ relationships to each other and the mutually exclusive decisions that are involved in creating designs. “Urban systems” is defined as a nested term in and of itself, as the systems are the building blocks upon which more complex systems are constructed or upon which they are constructed on their own complex systems. In this way, an urban system can parcel out from larger wholes or can be aggregated together to form larger, more complex urban systems. In their simplest state, as a result of human or natural processes, the systems (social, spatial, physical, aspatial, etc.) are actively, or passively, involved in the function of cities and urban environments. Urban systems can be further aggregated and subdivided amongst themselves depending on the level of granularity required for the specific study or context of the inquiry. Urban systems design is the process by which urban systems are planned and developed in concert with analytical and design-orientated principles to facilitate the creation and maintenance of resilient smart communities. These smart communities meet and exceed human and natural needs through the application of technological and humanistic interventions, utilizing the four pillars of needs (R.E.S.H) that are proposed in the USD Conceptual Framework believed to be required for smart communities and cities (Figure 1).
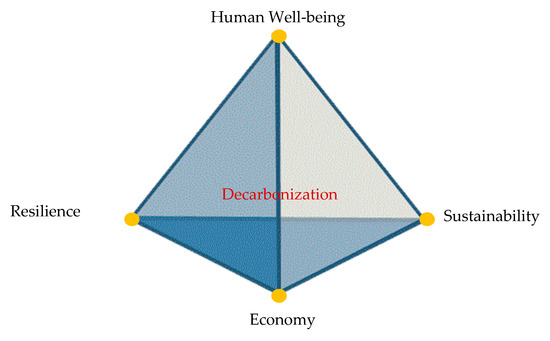
Figure 1.
The four pillars of urban systems design and trade-off matrix of scenario planning: resilience, economics, sustainability, and human well-being (R.E.S.H).
2.2. Community-Level Design
The foci of community-level designs, core to urban systems design, are to seek to create smart communities and to solve problems with humanistic solutions. Simply, a smart city is defined by following one or all three of these perspectives: technological, people, or community [7]. The technological perspective is defined through its implementation of ICT technologies [22]. These technological strategies must also be conjoined with a focused expression of related terms such as “digital, intelligent, virtual, and ubiquitous” [7]. The foci of the people perspective revolve around the understanding that individuals are the key driver of cities and must be its fundamental focus. Finally, communities form the last perspective and are most associated with the concept of Smart Communities [7].
Based on these understandings and existing literature, we define a Smart Community as an integrated synthesis of humanistic qualities, data collection, and monitoring, technological integration and contextualization which seeks to balance human experience with technical models. Smart Communities employ the use of technological innovations as the means of improving system responsiveness (i.e., wayfinding, power supply, warnings, etc.) to humans interacting within its confines. The inclusion of humanistic qualities into planning was a phenomenon that grew out of the first backlash against rational planning in the 1950s and is a quality that must be maintained in the new era of data science and systems understanding [23]. Thus, by utilizing the Internet of Things (IoT), it is possible to better understand and respond to quantitative problems in qualitative ways through systematic planning and design. Core to these principles are that computers are to serve as a tool in aiding in the design and problem identification and that humans are the fundamental element in the design of cities.
2.3. Abstraction
Two layers of abstraction are employed in the USD model: typologies (buildings and neighborhoods) and scale. Typologies refer to both the classification of buildings and of neighborhood elements placed into discrete bins. Scale notes the granularity or resolution of the data or study that is being employed for the purposes of aggregation, complexity, and defining specific typological elements.
Typologies concerning buildings and neighborhoods have four key components: form, context, use, and structure (FoCUS). Form—or urban form at larger scales—is defined by its delineation of external physical properties that are tied to a building, block, or neighborhood. In buildings, this often refers to the height, shape, and window-to-wall ratio present from external properties. Neighborhoods and blocks rely on the density of buildings, the bounding edge, and the morphology of the area. Context pertains to all aspects outside of the object of study that provide insight into the role, meaning, and patterns affecting it. Contextualized information often refers to surrounding buildings, zoning, transit lines, forest, parks, or major attractions that modify people and building behaviors. Use, or land use, investigates the interior use and occupancy of the building or space and is most commonly divided into specific use categories: residential, office, mixed-use, governmental, commercial, or sports facilities [24]. Structure, expressed as materials, products, or specific characteristics (U/R-Values, transmission, specific heat, etc.), denotes the physical interior composition of a building.
Abstraction of scale concerns the granularity of the object being examined and the resolution to which each element is being studied. These scales in the USD Conceptual Framework are divided into eight levels: individual agents, households, buildings, blocks, districts (superblocks), neighborhoods, communities, and cities. Individual agents are the principal agent in all analysis and the basis of all upper scales of study. Households are the agglomeration of individual agents into households generating the supply and demands in urban demand modeling. Buildings range from single household units (or offices) to hundreds of aggregated households (offices), while the fundamental unit of modeling stems from individual agents and households and buildings (parcels), and are generally the lowest scale that is modeled in changing designs. Blocks are composed of one or more buildings in a coherent bounded area, either by nature or infrastructure. Districts (superblocks) are the collection of similar blocks, often defined using administrative boundaries. Neighborhoods are the community or administrative-based grouping of districts. Communities are currently the largest scale of design intervention. Cities and larger scales are abstracted and act as an umbrella over which other scales are associated.
In studying problems and applying metrics, boundaries serve the purpose of focusing and providing restrictions to what otherwise can be edgeless systems. Boundaries can be categorized into five types to be imposed or used: study-based, infrastructure, administrative, community/social, and procedural. Study-based boundaries focus on studying the area based upon the restraints of a study or system itself. Infrastructure boundaries use the infrastructure or nature to form the boundaries of areas, such as roads, rivers, railroads, etc. Administrative boundaries use the bounds set by administrative agencies to segment space, census tracks, or districts. Community/social boundaries use the criteria by which communities and social areas self-identify to set conditions of the study. Procedural boundaries automate the above method(s) to generate more localized conditions of boundaries (Figure 2).
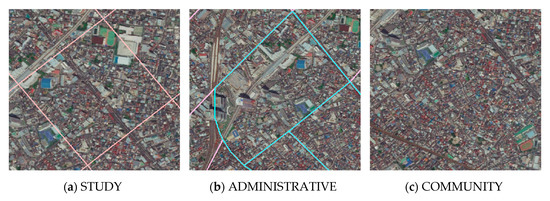
Figure 2.
Different approaches to establishing the boundaries of a study: (a) based upon infrastructure and study goals, (b) defined by administrative boarders, and (c) how communities self-identify.
3. Methods
Our initial investigation into the applicability of the Urban System Design Conceptual Framework is predicated on understanding that examining an entire area—rather than a myopic specific site exclusively—aids in comparative analysis across competing and mutually exclusive metrics. Utilizing the Internet of Things (IoT) with typological data, analyses are focused on identifying key areas of intervention, design optimization, and current condition evaluation. This led to the creation of guidelines and design scenarios. Initial testing focused on energy consumption and how interventions would yield the best results when considering both buildings and transportation networks. The outline of this methodology is presented in Figure 3.
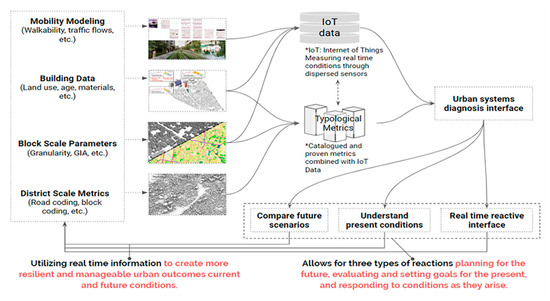
Figure 3.
Urban System Design study methodology. GIA: gross interior area; IoT: Internet of Things.
Our study methodology is separated into four components: data, aggregation, evaluation/design, and an iterative loop. Data concerns the type and nature of data to be included in the urban system evaluation. Segmented into basic building, transportation, or mixed metrics and modeling, they serve as the big data sets upon which all analysis is constructed. Contained within each subset are a myriad number of data points, not all of which were pertinent to this study. Aggregation joins these datasets together based upon IoT measurements and quantifications and/or catalogues them into discrete typology-based aggregations. It applies binned data up to a scale (building to block) or directly to the study boundary (superblocks). The three key objectives of evaluation/design are to understand the present conditions, the development of future scenarios, and the real-time evaluation of site conditions. Evaluation for all of these scenarios is conducted using ArcGIS, Rhino, Grasshopper, and statistical modeling software. Designs are then created and tested to note how human-driven choices would impact the system. The iterative loop denotes two forms of iteration: internal and external. Internal loops refer to the process of changing, redesigning, and evaluating scenarios while the planning process is underway. External loops manage the process once implemented and prior to new problem detection—a part of the methodology that was not examined during this phase.
Data availability in the study area, the northern section of the Sumida Ward, is prevalent using several buildings attached with IoT sensors, detailed road link information, and a high resolution of building and use characteristics. (Table 1) Within the study area, a total of 32 districts, 1395 blocks, 5672 road links, and 31,676 individual buildings are observed. Studying each individual element, with respect to all adjoining neighbors across the conjoined transportation and building modeling methodologies, was too intensive for the exploratory nature of this study. Further, not all characteristics were important for studying the interdependent effect of energy on these systems.

Table 1.
Data characteristics.
Examining urban issues at the district-scale, or larger, required the use of a system boundary for which data can be aggregated together for the purposes of district-scale metrics. As previously mentioned, system boundaries are set by the nature of the project and follow one or more boundary categories. Originally, the scope of the project was a gradient approach, using super block typologies (study defined) and district (administrative defined) system boundaries (Figure 4). However, due to constraints placed on this initial study, the district-based boundary model was pushed back until the generic and general superblock analysis was completed.
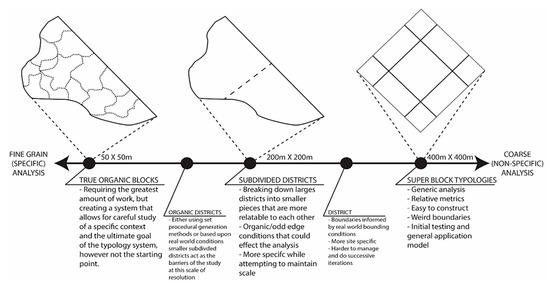
Figure 4.
Different resolutions of boundary definition and the pros and cons of each.
Evaluations of existing conditions and the new designs were run through the standardized analytical methodology (Figure 5) and segmented into five components: setup, modeling, typology, iteration, and final design. Setup contains two parts, related to the Urban Systems Design Conceptual Framework: background information (context), and the scaler system (change). Background information concerns initial data acquisition, community engagement, and developing an understanding of the history and context of the study area. The scaler system examines the study area, the type of boundary to be employed, the analysis objectives (energy consumption and decarbonization, for this study), and the metrics to be considered. These data are used for the two-step modeling purpose of ArcGIS and Rhino modeling. ArcGIS, along with statistical methods, is used to evaluate spatial information and creating typologies. These typical study areas (master typologies) are transformed into 3D models in Rhino and run through EnergyPlus modeling for current conditions and future scenarios. Modeled typologies are modified according to four categories—no change, minor material change, material and building changes, and a complete redesign. Changes are iteratively looped back through the methodological process of modeling again. Final designs are chosen from the selected list of scenarios using further engagement with the community.
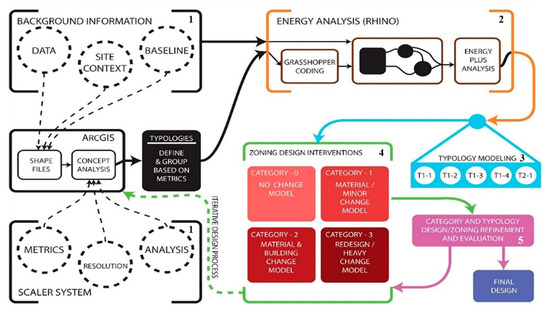
Figure 5.
Sumida study methodology separated into five stages: (1) background and study definition, (2) three-dimensional modeling and current condition analysis, (3) typology generation, (4) scenario interventions, and (5) retesting, acceptance, and iterations.
The external iterative loop was not included in this initial testing of the USD methodological process with North Sumida as the test case. Due to the current theoretical nature of this project, an external iteration process was undertaken later.
4. Case Study: North Sumida
The study area was set as the northern half, as defined by the canal, of the Sumida Ward located in Tokyo, Japan (Figure 6). Surrounded on all sides by the Sumida and Arakawa rivers, and with various canals internal to the area, there is a high risk of flooding. The narrow streets formed by the organic transformation from agrarian farmland to the dense urban core bring the risks of disasters to the area. Barring the characteristics of an older urban fabric, most of the buildings located in this area are low-rise and single-story structures. These risks leave questions about the neighborhood’s sustainability; however, there is still a tight community life with high social capital.
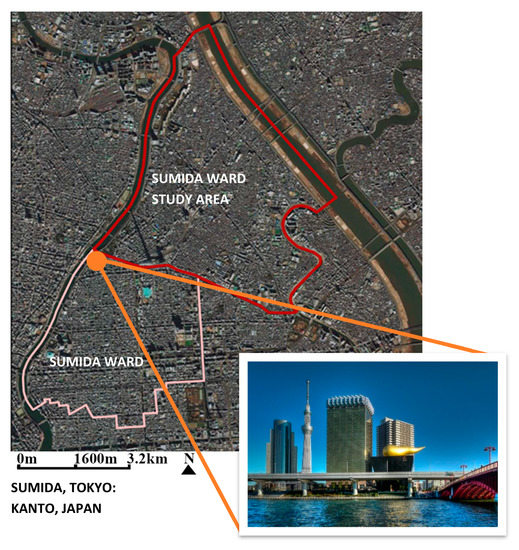
Figure 6.
Sumida Tokyo study area.
The demographics tend to include older couples and a younger, single working-class, and many of the current residential condominium units are vacant. Based on 2015 and 2018 building data acquired from AW3D and Zenrin, Co. Ltd., 80% of all buildings located in the area are under three stories, while the majority of the residential stock (55%) is contained in mid-rise buildings (6 to 15 story) that are 75% vacant. The area is a prime candidate to examine as a typical Japanese neighborhood that is suffering from depopulation and other context-sensitive issues. Contending with context-sensitive issues, while examining global challenges (decarbonization), makes the northern sections of Sumida an excellent initial test case for the Urban System Design Conceptual Framework.
According to the nature of the study, North Sumida was segmented into 400 m × 400 m squares, representing a superblock structure for the purposes of testing. In total, there were 76 individual study areas arrayed throughout the site, using the Fishnet command in ArcGIS, and aligned along the major urban axes (Figure 7). Of the 76 interior study boundaries, half were smaller than 160,000 m2 due to the irregular shape of the study area. Thus, all metric-based analysis was conducted on a relative scale, controlled by area size, to allow for normalized and direct comparison between study areas. Along the northeastern edge of the site, several squares contained nothing except water of the Arakawa River and thus were excluded from the study, reducing the total number of used squares to 67.
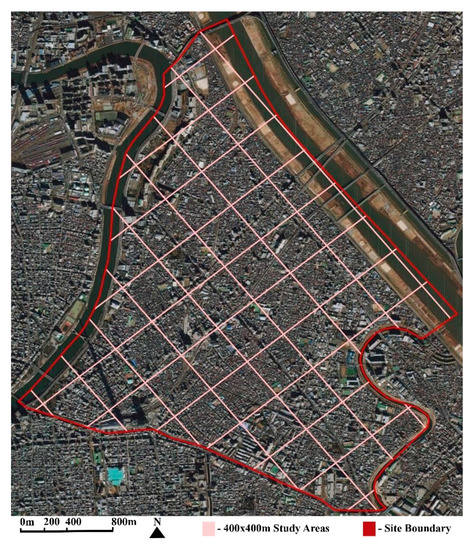
Figure 7.
Segmented study area (400 m × 400 m).
The project developed a sliding boundary scale for the purposes of classification and data agglomeration. These distinctions were created by analyzing the size, shape, and restriction of the entire North Sumida study area. Districts, the basis of the super block typology, ranged in size from 78,153 m2 to 464,347 m2, with the 42 districts averaging approximately 160,000 m2. However, the administrative shapes and boundaries were irregular and based upon historic pathways, land uses, and ownership. Thus, for the purposes of initial testing, a regularized space was chosen and 400 m × 400 m (160,000 m2) regular blocks were used as the study boundaries (Figure 8). This grid size was selected based on the averaging of all districts (CCM: cho-cho-moku, 町丁目, similar to a US Census Tract) in the study area and using 160,000 m2 as the basis for the super block typology. These gridded study areas were arranged in line with the two major urban axes that dominate the space: Meiji Street (明治通り) and National Route No. 6 (国道6号線). In total, the fish-net block development produced 76 (partial and complete) superblock study areas. A more fine-grained (specific) level of analysis boundaries was also created based on the number of major blocks in a district (two at about 80,000 m2 each) and the average size of the smallest organic blocks from which everything is constructed. These ranged in size from 12 m2 to 184,451 m2 over 1395 individual blocks and an average size of approximately 2500 m2.
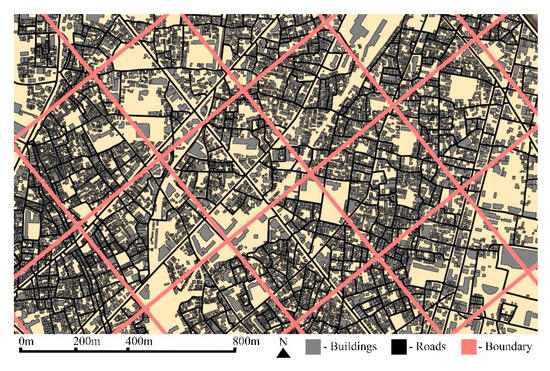
Figure 8.
North Sumida super block study (400 m × 400 m).
Next, each square had its lower properties associated with it and was analyzed, for the purposes of typology creation, in terms of three key characteristics. Although others would ideally be considered, only a select number of properties were regularly available during the time of the initial study. Table 2 contains a list of all properties and characteristics that were to be considered. Those marked by “**” were included in this study.
Table 2.
Metrics of Evaluation.
Road type, granularity, and gross interior area were the three primary urban form-based characteristics employed to develop study area typologies. Road type was originally divided into a total of 16 unique road groupings based upon width, number of lanes, purpose, speed, and location. However, given the compact nature of the study area and the relatively large scale of the interior superblocks, a coarser system was employed. Road type (road index) marked the weighting of the major road groupings based on one of seven categories: market street (highest weight), heavy transit corridor, mid transit corridor, new development, gridded streets, historic pattern, and super block waterfront (lowest weight). Market streets (Kira Kira streets) were given the maximum weight due to their impact on the district and special importance to the area. Excluding these streets, the rest were arranged in order of traffic impact and impact on the built environment.
Gross interior area (GIA) denotes the total amount of built floor area constructed in the area. This metric is similar to floor area ratio (FAR) but is not limited to a parcel, as no parcel data was present, and includes study area roads. The GIA was determined via Equation (1):
GIA is equal to the sum of all building area () multiplied by its height () divided by the total area of the study area (). Every study area was then given a GIA ranging from 0.00 to over 2.0, segmented into five categorizations based on normal distribution: very low density (0.00–0.35), low density (0.35–0.80), average density (0.80–1.30), high density (1.30–2.00), and very high density (2.00+). The cut-offs for these five categories were selected based on three main criteria: 1) a normal distribution of the function; 2) cities’ internal density when accounting for all space (roads, alleys, buildings, yards, etc.), with the average close to 1.00; and 3) visual correction based on the local surroundings.
Gross interior area describes the amount of built space in any given area but does not measure how it is distributed. This granularity is necessary for describing the total amount of objects in any given area. A GIA of 1.00 could be arranged into several large buildings, indicating low granularity; numerous small ones, indicating high granularity; or one large building and a massive park, indicating very low granularity. Granularity was calculated using Equation (2):
Granularity () is equal to the sum of all objects in an area (), which includes the total number of individual buildings () plus the total number of intersections () plus the total number of blocks (). These are then divided by the total area (). Granularity was subdivided into four levels: extremely fine grain (0.956+), fine grain (0.616–0.956), coarse (0.277–0.616), and monolithic (0.00–0.277). The range of values for the four categories were selected based on three main components: 1) a normal distribution of the data, 2) a reflection of the number of objects present in each area, and 3) visual correction based on GIS and on the ground truthing of the experience of the area during site visits and urban reconnaissance.
Applying these three typological groups to the entire site resulted in three indices which superblock typologies could be sorted into (Figure 9). From the total possible number of combinations, only 12 unique variations of these metrics were identified and used for the purposes of analysis using Rhino and additional ArcGIS modeling.
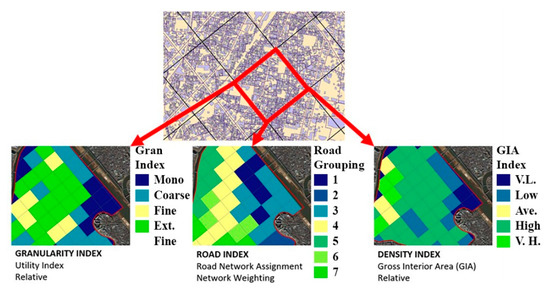
Figure 9.
Three typology grouping indices based on area granularity, road types, and density.
The 67 superblocks were not evenly distributed among the 12 typological groupings. Each grouping contained between three and eight superblocks, averaging at around six superblocks per typological grouping (Figure 10). Visually, each of the automatically associated superblocks were checked, and raw metrics were compared to ensure that they were statistically within a standard deviation of each other. Checking the standard deviation was performed to guarantee that results from one would be similar enough to the results from another. Typological grouping was the first step towards testing and evaluation, as not all buildings and current conditions could be tested given the many buildings, area, and general details. For this, a master typology would be necessary to undergo testing and design changes for each grouping. For ward-level changes at the district-scale, the focus was primarily given to large-scale changes concerning a complete system analysis rather than immediately concerning small-scale changes.
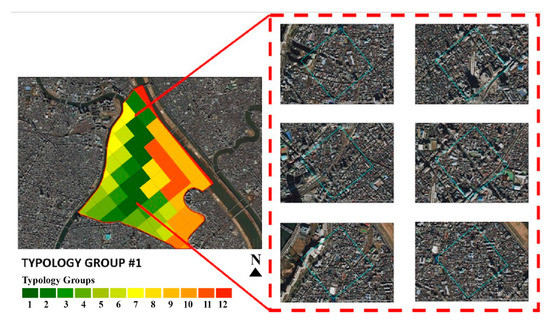
Figure 10.
Visual analysis of a type 1 typological grouping.
The master typology was determined by analyzing all the properties of the typology group superblocks in combination with visual analysis. Priority was given to two superblock characteristics: the road index, controlling for it to match most blocks contained in the group; and the size of the individual superblock, making sure it was as close to 160,000 m2 as possible. Both granularity and GIA were then used in determining the mean values and to select the superblock closest to the mean (Figure 11). This master typology would then be used for the purposes of energy analysis, design, and testing. Key aspects of these typological groupings, road typologies and the floor area ratio of buildings are displayed in Figure 11 and apply to Figure 12 and Figure 13. Road types 1 to 5 are major roads, road types 6 and 7 are general roads, and road types 8 and 9 are residential/other shopping streets.
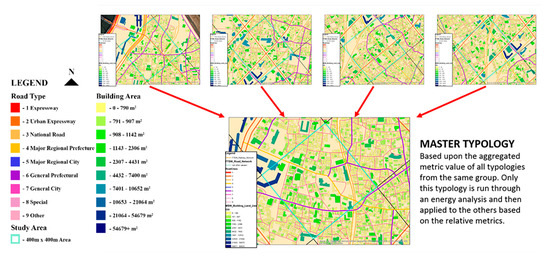
Figure 11.
Master typology methodology generation example.
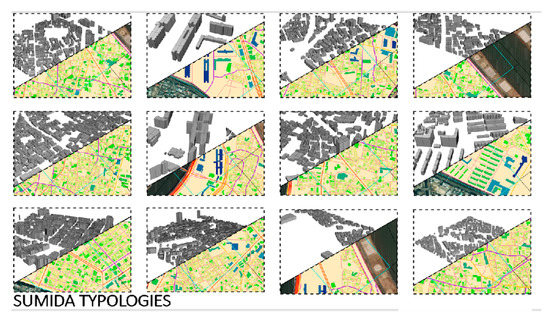
Figure 12.
North Sumida 12 master typologies.
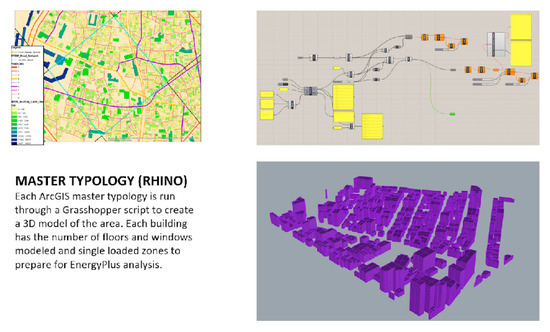
Figure 13.
Three-dimensional modeling and energy testing in Rhino with Grasshopper.
The master typology development process was repeated for all 12 typology groups, resulting in the 12 master typologies for the North Sumida area (Figure 12). Initial testing was accelerated by reducing the number of testable elements from 67 (excluding individual interior elements) to 12. Each of the 12 master typologies were then processed, and the results were applied backward, adjusting the results for each individual superblock based on its deviation from the master template.
Each of the 12 master typologies were exported from ArcGIS into Rhino, using Grasshopper for the purposes of 3D modeling and energy testing. For testing, five properties were attached to the building: height, shape, number of stories, land use, and occupancy. Buildings were created as 2D surfaces, geolocated and arrayed vertically based on the number of floors and average height per floor. Each floor was extruded to the average height and individual floors were treated as a room, while no internal walls were used per floor (each floor is a thermal zone). Buildings were then tagged with their simple zoning land use, as determined by Tokyo’s zoning code [25]. These properties were then imported into EnergyPlus and Ladybug for the purposes of energy analysis and current condition analysis (Figure 13).
Two forms of modeling were then conducted for the entirety of North Sumida: a complete 3D current conditions base model and super district energy simulations (Figure 14). For an understandable visual aid for community engagement and to track design changes, a 3D base model was created. The super district created the benchmark for energy consumption and, by extension, the current carbon emissions. Each master typology then had its corrected energy value, based on deviation from the mean, applied back to all 67 superblocks. Two change-model tests were then conducted: in-depth (on a select superblock) and district-wide (several superblocks). These simulated the types of changes and plans undertaken by urban planners with both a focused specific development design and a general long-term planning process.
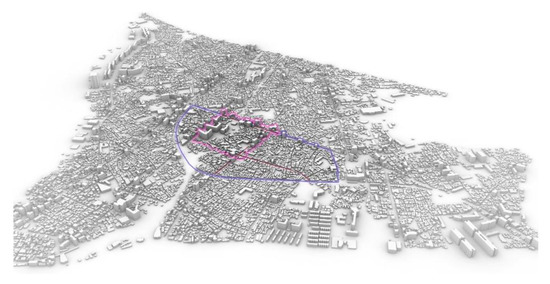
Figure 14.
North Sumida 3D model.
Based on the evaluative model creating a current conditions evaluation, a specific super block typology was selected for an in-depth redesign. The site, located near the main transit station, was altered to reduce total energy consumption, increase density, and repurpose underutilized spaces (from vacant buildings) into parks and urban farmland (Figure 15). Large-scale changes are possible in the Sumida Ward area, and in many Japanese cities in general, due to high rates of vacant units and buildings—over 20% of all units are vacant. As expected, the evaluative model showed that an increased total utilization of the area resulted in a reduction in total carbon emissions.
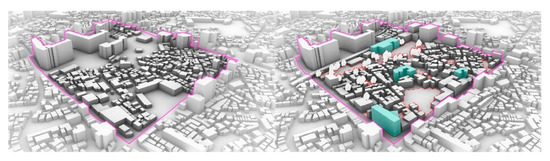
Figure 15.
Current condition (Left) and change design (Right).
Larger, multiple district-level plans were implemented based on the modifications done to a single master typology (Figure 16). Building modifications and design concentrated on material changes and focused development along primary streets. Generalized modeling was employed to compare initial energy consumption with the new alterations. The results showed a general decrease in energy consumption; however, certain superblock typologies had deviations which were too large from the master typology, making exact prediction or a change model, at this scale and resolution, difficult and inconclusive.
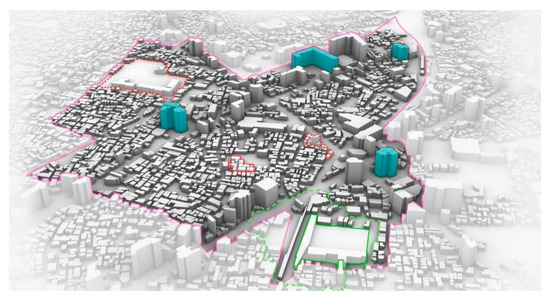
Figure 16.
Multiple district-wide changes.
5. Conclusions
The Urban Systems Design Conceptual Framework developed by our team, was tested by examining an initial application of the framework within the North Sumida Ward in Tokyo, Japan. North Sumida Ward was selected due to its unique qualities as a historic neighborhood, the prevalence of the present issues facing much of Japan, and the level of data availability. Although not all stages of the developed framework were conducted during this initial testing, as the system is still under development, the steps undertaken in this case study serve as a guide for future research endeavors. The next stage of the methodology development is the expansion of metrics, the development of the four pillars (R.E.S.H.), and finer-grain testing that relies on actual organic district areas, not 400 m × 400 m superblocks. The 400 m × 400 m super block typology may be better for studying city-wide changes rather than ward-focused redevelopments which already contain clear delineations of space.
The initial study of the proposed framework has implications for what researchers can achieve when combining quantitative and qualitative measures of analysis towards achieving broad community goals in planning. This initial study shows the significance that this new framework could have on near and long-term planning and the future of the world’s growing urban cores and how we might achieve the global goals of resilience, sustainability, economic success, and human well-being. Building from this initial case study, there is great potential in continuing to evaluate and finesse this methodology.
To make the Urban Systems Design Conceptual Framework useful at a grander scale as an enhanced Planning Support System (PSS), it should be calibrated with simulations including mobility, building energy, and human behavior and ideally with actual implementation to check the robustness, transferability, and generalization of the modeling efforts. This process only touched on energy modeling, and future iterations will expand upon this, connecting it to further transportation modeling using mesoscopic simulation and modeling platforms such as MATSIM. These next steps will expand on what has been proposed and tested in North Sumida to further prove the usefulness of combining Urban Systems Design, Smart Community-Level Design, and Abstraction under one framework driven by the goals of resilience, economics, sustainability, and human well-being.
Author Contributions
Conceptualization, M.B.T., R.B.B., T.Y., and Y.Y.; methodology, M.B.T.; software, M.B.T. and T.Y.; validation, M.B.T., R.B.B., and T.Y.; formal analysis, M.B.T. and T.Y.; investigation, M.B.T.; resources, M.B.T., R.B.B., and T.Y.; data curation, M.B.T. and T.Y.; writing—original draft preparation, M.B.T.; writing—review and editing, M.B.T. and R.B.B.; visualization, M.B.T.; supervision, Y.Y.
Funding
This research received no external funding.
Acknowledgments
Our team would like to take this opportunity to thank the administrative staff with the Global Carbon Project at the National Institute for Environmental Studies. Without their hard work and efforts, our team would not have had the opportunity to work together at the Institute in Tsukuba, Japan. Additionally, we must acknowledge the hard work of the Spring 2016, 2017, and 2018 International Design Studios from the Georgia Institute of Technology, who utilized Urban Systems Design methods in their studio, which laid the groundwork for our team’s deep look into improving their methods.
Conflicts of Interest
The authors declare no conflict of interest.
References
- UN DESA. World Urbanization Prospects: The 2018 Revision; ST/ESA/SER.A/366; United Nations: Department of Economic and Social Affairs/Population Division: New York, NY, USA, 2018. [Google Scholar]
- The World Bank. 2017 Population; World Bank: Washington, DC, USA, 2018. [Google Scholar]
- Global Energy Assessment Writing Team. Global Energy Assessment: Towards a Sustainable Future. In Management of Environmental Quality an International Journal; Emerald Group Publishing Limited: Bingley, UK, 2013. [Google Scholar] [CrossRef]
- United Nations. The Paris Agreement; UNFCCC: New York, NY, USA, 2016. [Google Scholar]
- Gurney, K.R.; Romero-Lankao, P.; Seto, K.C.; Hutyra, L.R.; Duren, R.; Kennedy, C.; Grimm, N.B.; Ehleringer, J.R.; Marcotullio, P.; Hughes, S.; et al. Climate change: Track urban emissions on a human scale. Nature 2015, 525, 179. [Google Scholar] [CrossRef] [PubMed]
- Batty, M.; Axhausen, K.W.; Giannotti, F.; Pozdnoukhov, A.; Bazzani, A.; Wachowicz, M.; Ouzounis, G.; Portugali, Y. Smart cities of the future. Eur. Phys. J. Spec. Top. 2012, 214, 481–518. [Google Scholar] [CrossRef]
- Albino, V.; Berardi, U.; Dangelico, R.M. Smart cities: Definitions, dimensions, performance, and initiatives. J. Urban Technol. 2015, 22, 3–21. [Google Scholar] [CrossRef]
- Scott, A.J.; Storper, M. The nature of cities: The scope and limits of urban theory. Int. J. Urban Reg. Res. 2015, 39, 1–15. [Google Scholar] [CrossRef]
- Friedmann, J. Why Do Planning Theory? Plan. Theory 2003, 2, 7–10. [Google Scholar] [CrossRef]
- Chen, B.; Lu, Y. Urban nexus: A new paradigm for urban studies. Ecol. Mod. 2015, 318, 5–7. [Google Scholar] [CrossRef]
- Storey, D.; Santucci, L.; Sinha, B. Water-Energy-Food Nexus: Principles and PracticesUrban; Urban Nexus, American Geophysical Union: Washington, DC, USA, 2017. [Google Scholar] [CrossRef]
- Sterman, J.D. System Dynamics: Systems Thinking and Modeling for a Complex World; Massachusetts Institute of Technology. Engineering Systems Division: Cambridge, MA, USA, 2002. [Google Scholar]
- Vonk, G.A.; Geertman, S.; Schot, P. A SWOT analysis of planning support systems. Environ. Plan. A 2007, 39, 1699–1714. [Google Scholar] [CrossRef]
- McFarlane, C. The City as Assemblage: Dwelling and Urban Space. Environ. Plan. D Soc. Sp. 2011, 29, 649–671. [Google Scholar] [CrossRef]
- McLoughlin, J.B. Urban and Regional Planning: A Systems Approach; Faber & Faber: London, UK, 1969. [Google Scholar]
- Geddes, P. Cities in Evolution: An Introduction to the Town Planning Movement and to the Study of Civics; HardPress Publishing: Los Angeles, CA, USA, 2006. [Google Scholar] [CrossRef][Green Version]
- Hudson, B.M.; Galloway, T.D.; Kaufman, J.L. Comparison of current planning theories: Counterparts and contradictions. J. Am. Plan. Assoc. 1979, 45, 387–398. [Google Scholar] [CrossRef]
- Batty, M. The size, scale, and shape of cities. Science 2008, 319, 769–771. [Google Scholar] [CrossRef] [PubMed]
- Portugali, J. Complexity Theories of Cities: Achievements, Criticism and Potentials. In Complexity Theories of Cities Have Come of Age; Springer: Berlin, Germany, 2012. [Google Scholar] [CrossRef]
- Hall, P. Cities of Tomorrow: An Intellectual History of Urban Planning and Design Since 1880, 4th ed.; John Wiley & Sons: Hoboken, NJ, USA, 2014. [Google Scholar]
- Binder, R.B.; Lancaster, Z.; Tobey, M.; Jittrapirom, P.; Yamagata, Y. Transport modeling with a purpose: How urban systems design can bridge the gaps between modeling, planning, and design. WIT Trans. Built. Environ. 2019, 186, 85–89. [Google Scholar]
- Klein, C.; Kaefer, G. From Smart Homes to Smart Cities: Opportunities and Challenges from an Industrial Perspective. Next Gener. In International Conference on Next Generation Wired/Wireless Networking; Springer: Berlin, Germany, 2008. [Google Scholar] [CrossRef]
- Davidoff, P. Advocacy and pluralism in planning. J. Am. Inst. Plan. 1965, 4, 331–338. [Google Scholar] [CrossRef]
- Ashrae. Ashrae Standard 90.1 Energy Standard for Buildings Except Low-Rise Residential Buildings; Society: Watford, UK, 2007. [Google Scholar] [CrossRef]
- Akashi, T. Urban Land Use Planning System in Japan, 2nd ed.; Japan International Cooperation Agency: Tokyo, Japan, 2007. [Google Scholar]
© 2019 by the authors. Licensee MDPI, Basel, Switzerland. This article is an open access article distributed under the terms and conditions of the Creative Commons Attribution (CC BY) license (http://creativecommons.org/licenses/by/4.0/).