Towards Smart Urban Regeneration: Findings of an Urban Footprint Survey in Port Louis, Mauritius


Abstract
1. Introduction
2. Background
3. Methodology
4. Data and Methods
- 1.
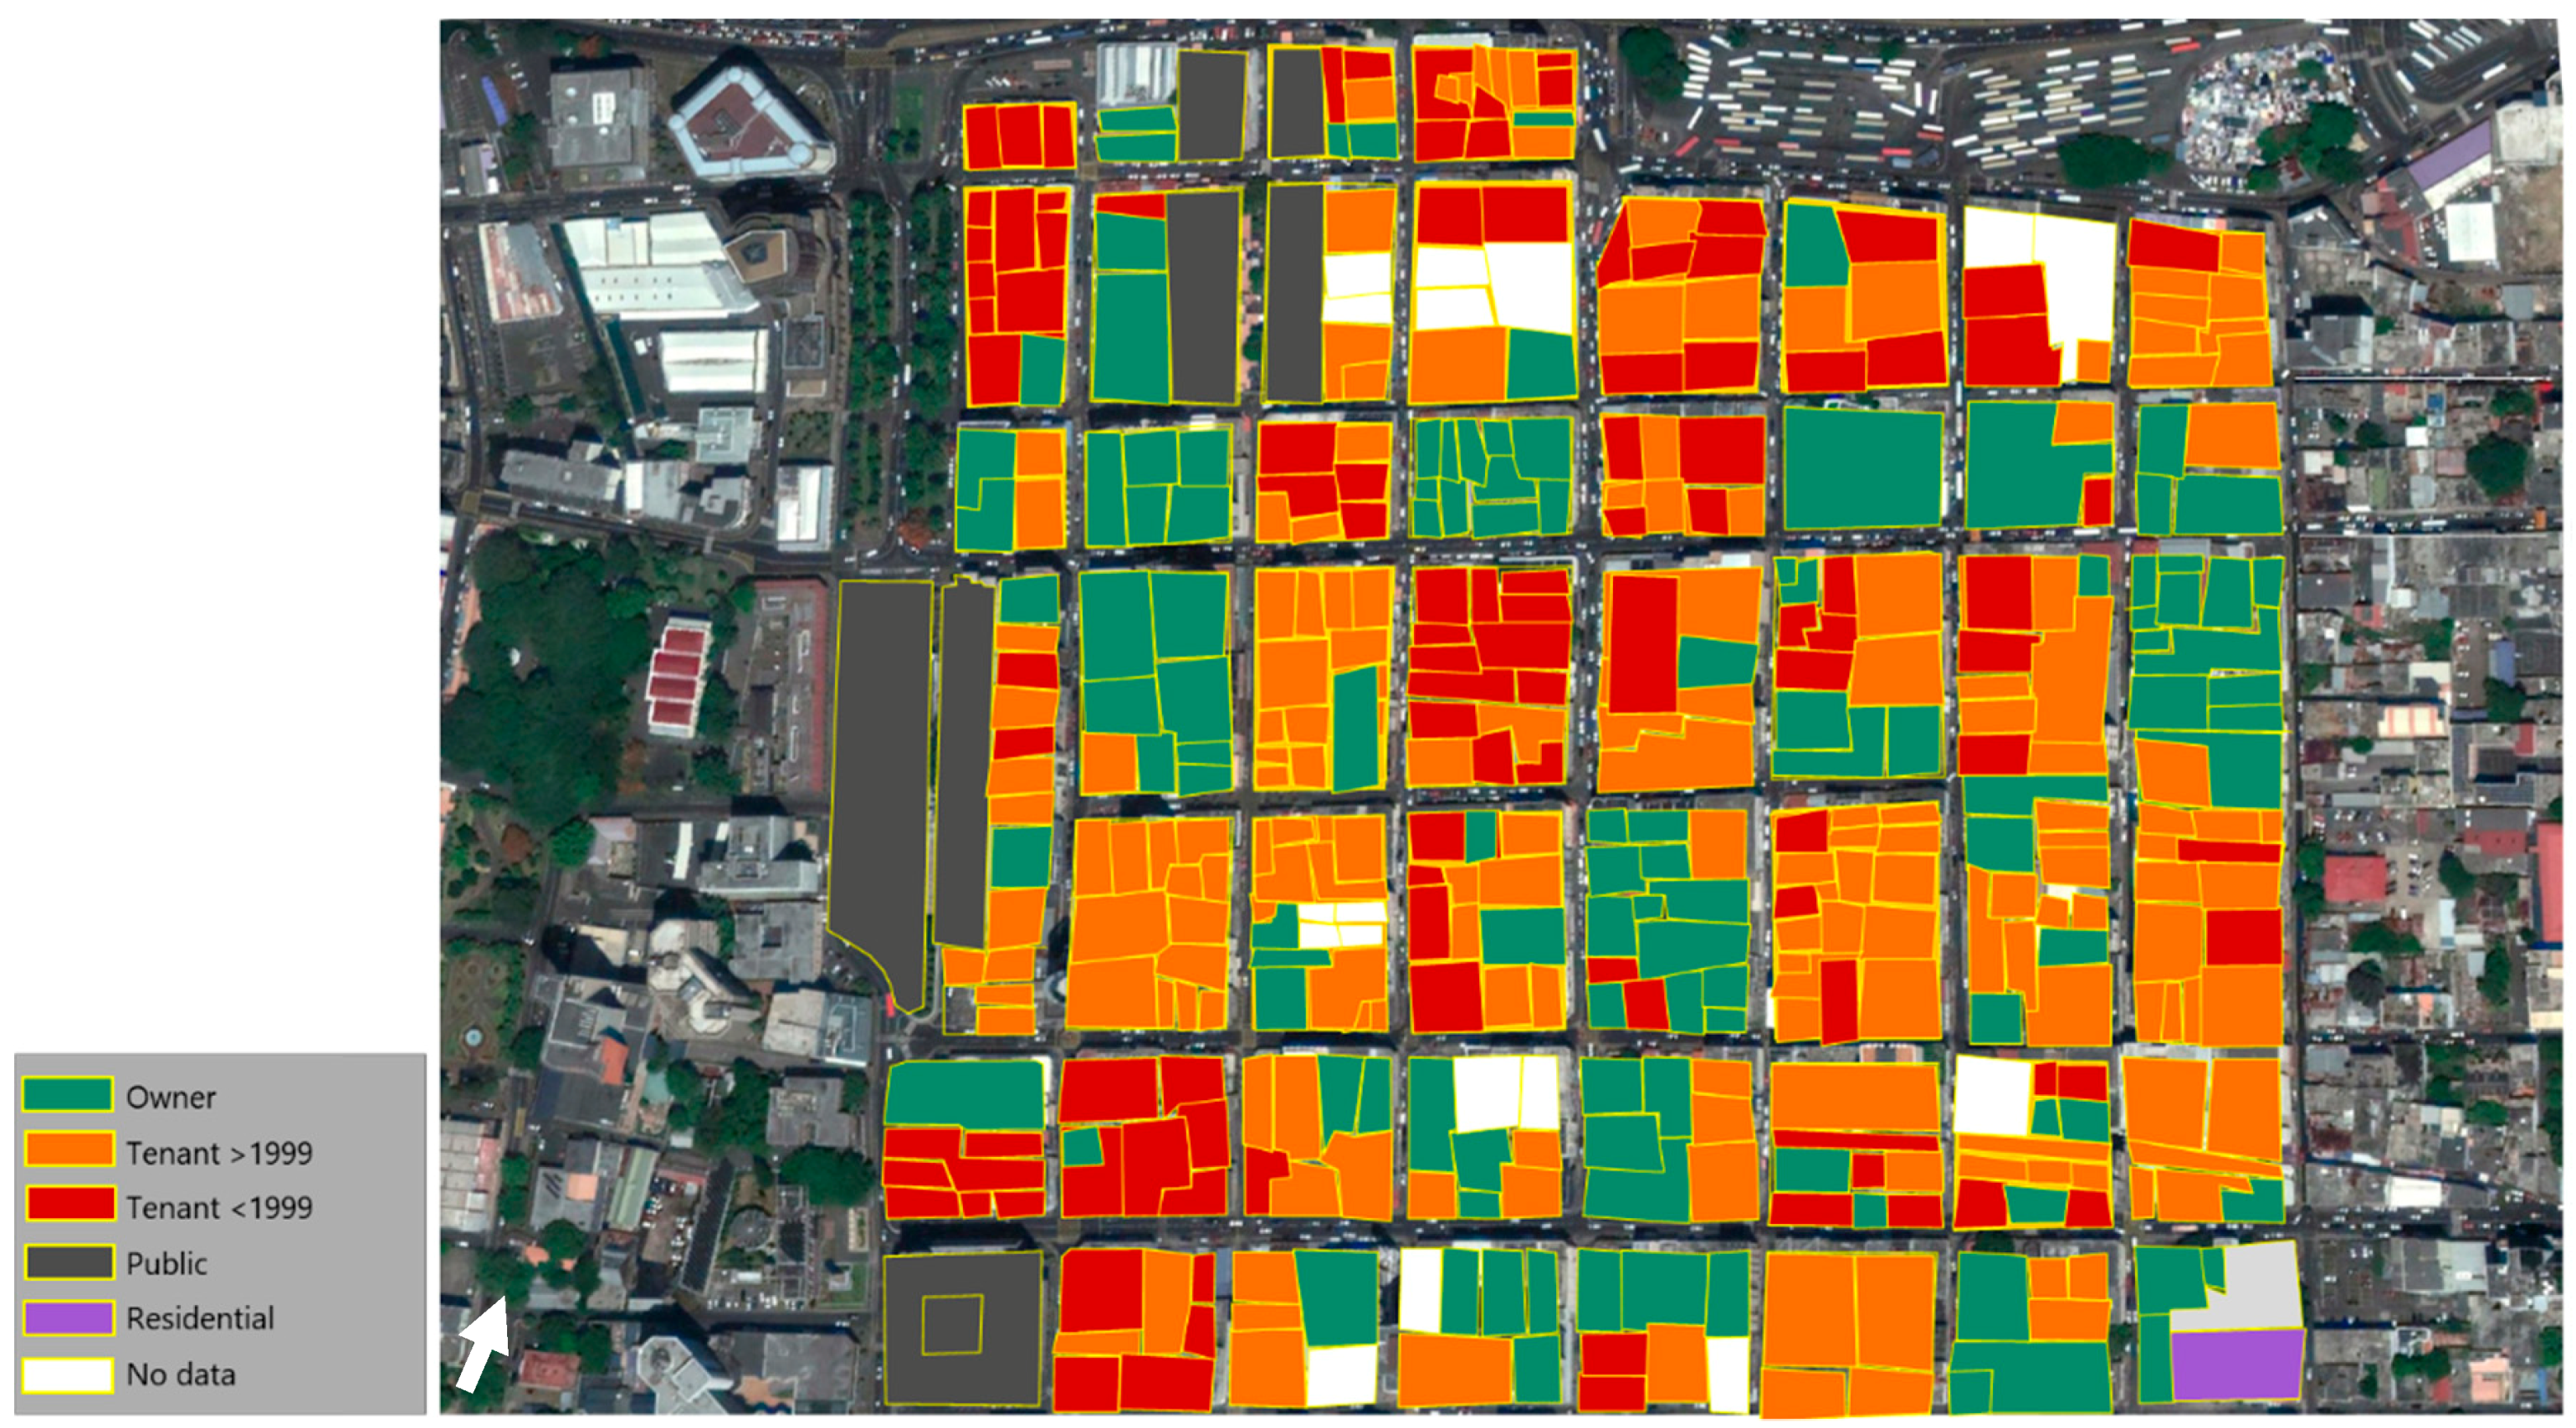
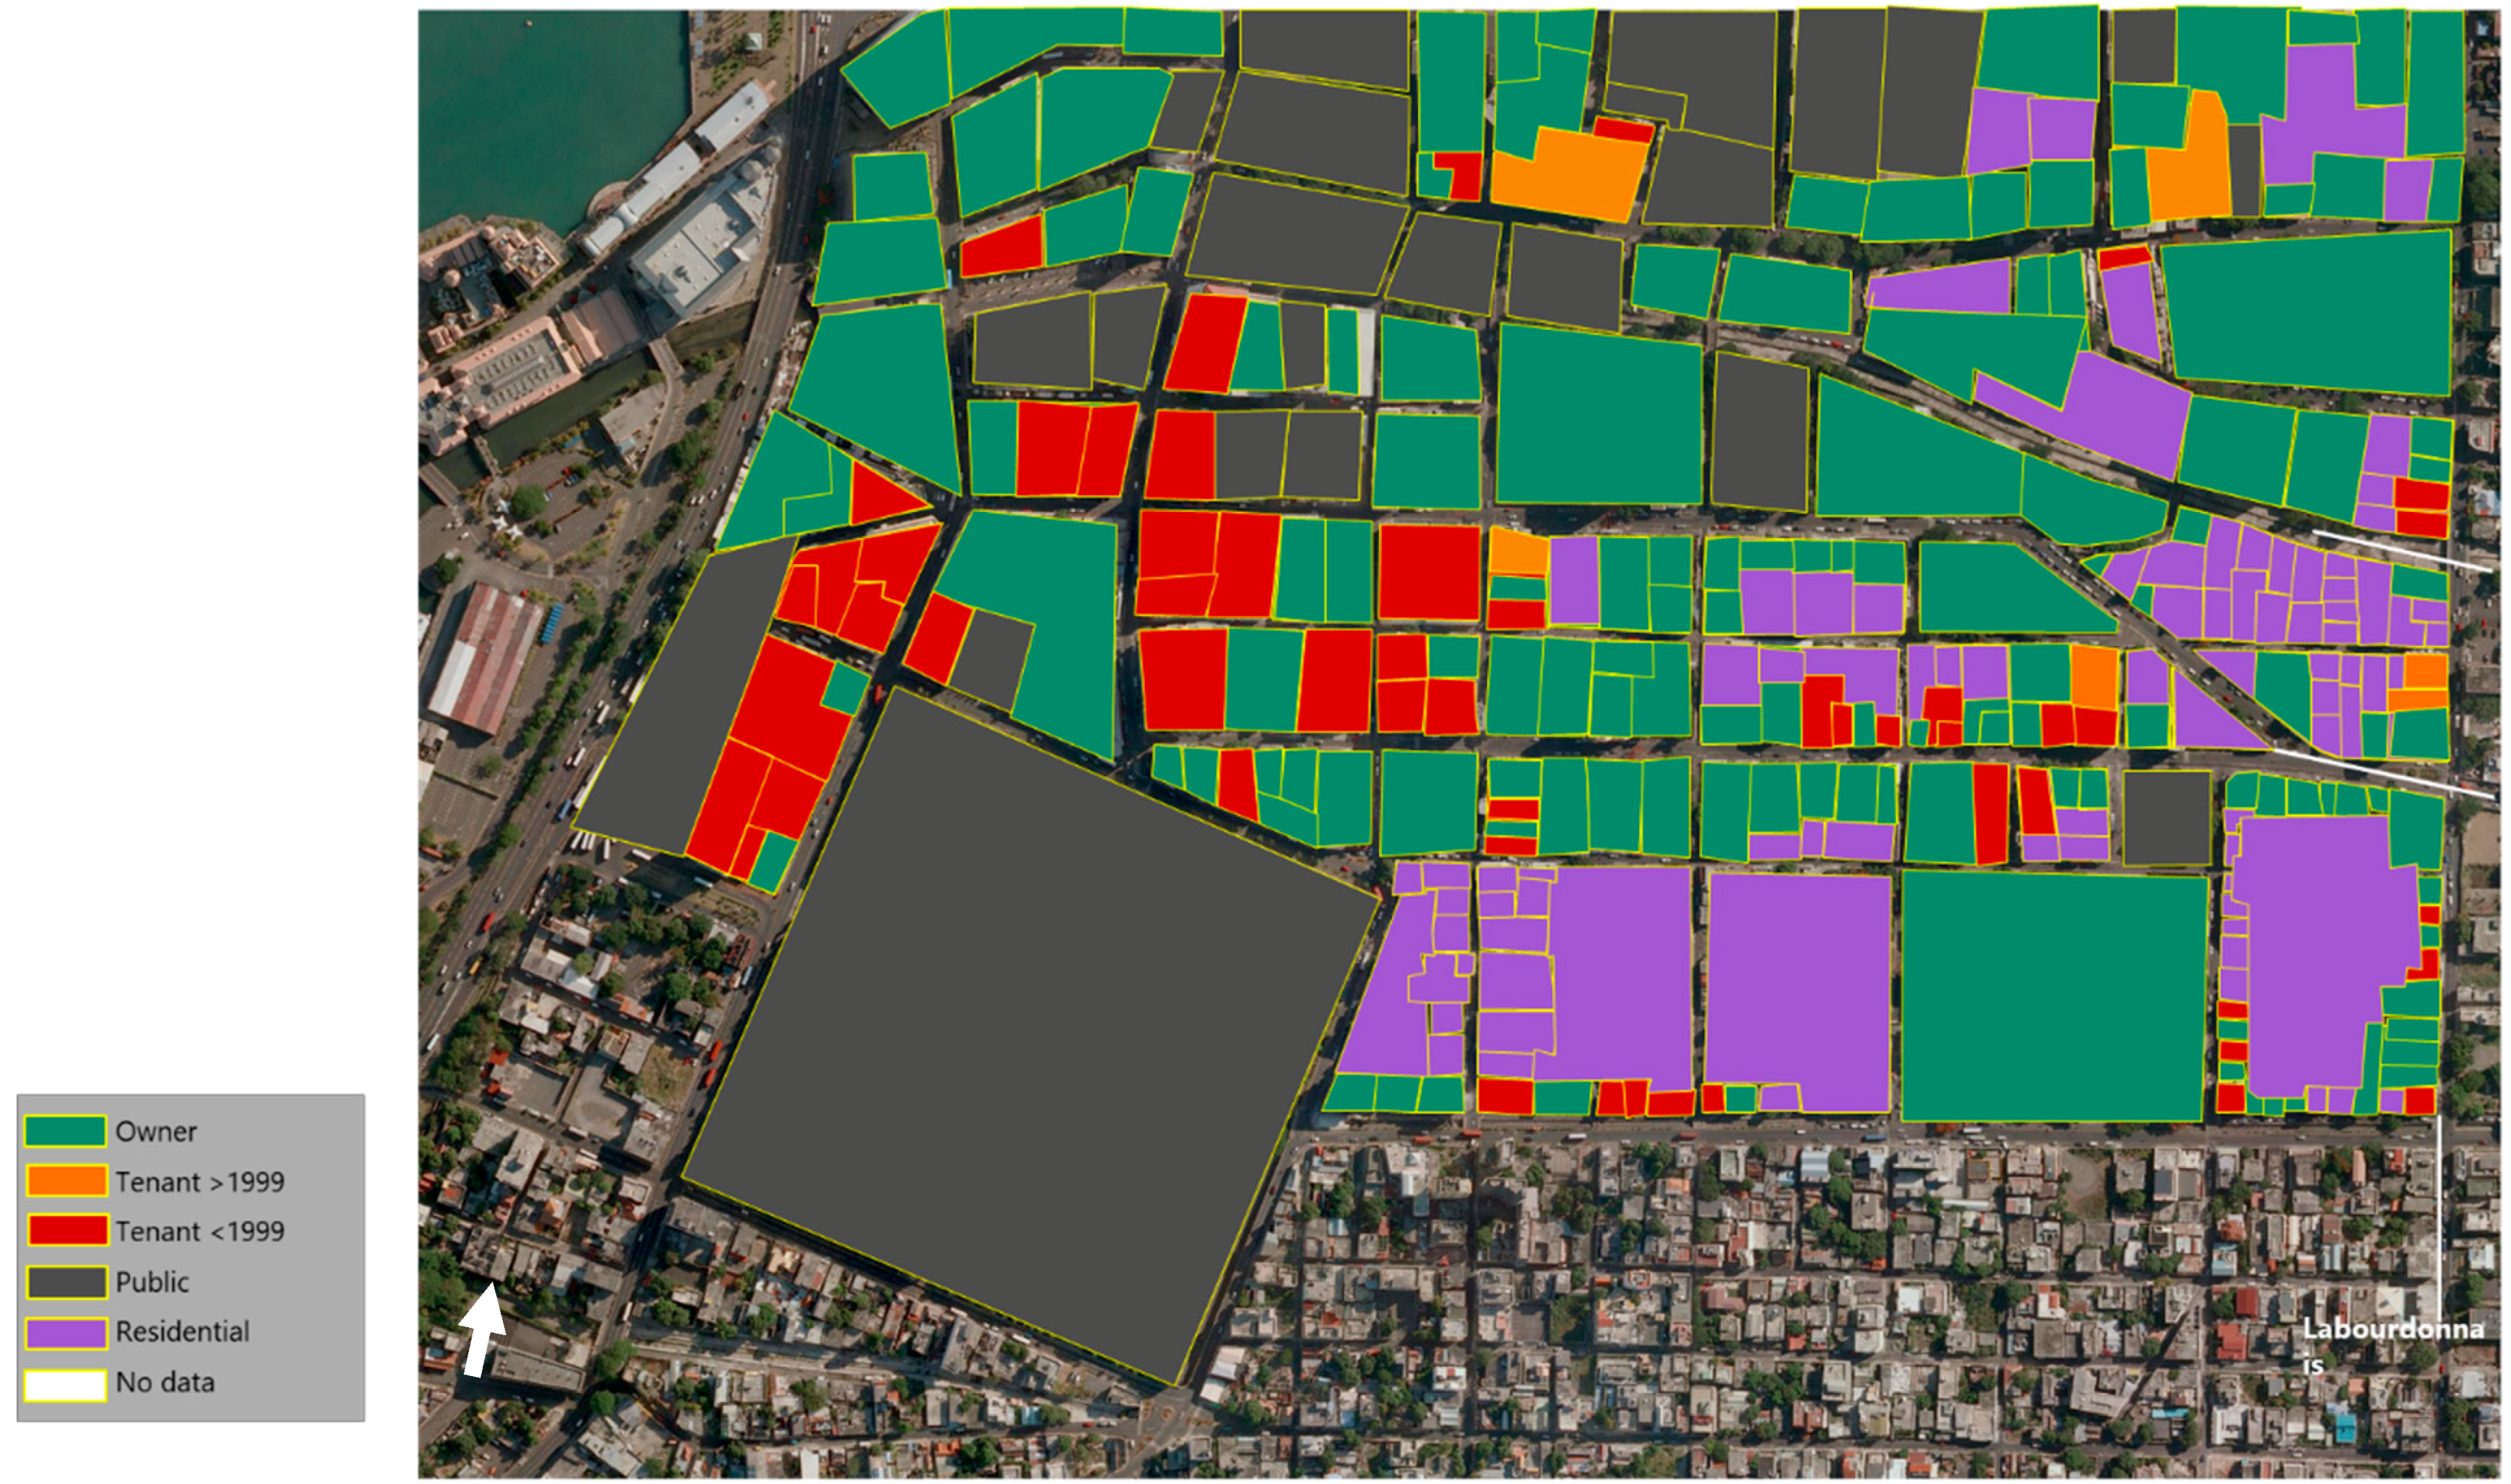
- Landlord and Tenant Act of 1999.It was noted that buildings constructed prior to 1999 are subject to the Landlord and Tenant Act of 1999, and thus may host a commercial population that enjoys a rent that does not reflect the current property market. However, there is no research that identifies the area encompassed by the provisions of this Act in Port Louis, and thus its occupant population. The authors therefore included this dimension as part of their survey research.
- 2.
- Commercial and ResidentialA specific focus in the survey research was to identify commercial and residential buildings, and whether the occupants are property owners and or residential tenants.
- 3.
- HeritageWhile there are 81 listed heritage buildings in Port Louis [29], there are many other buildings in the CBD that have high heritage values [5,12]. The official list of the Municipality of Port Louis is thus restrictive, and the characterisation of ‘heritage’ building has been criticised as being arbitrary (REF). To ensure a better inclusion, and survey, of the heritage buildings for the purpose of this study, the authors expanded from the official heritage list, and included other buildings that possessed significant historical, cultural and architectural attributes or values.
- 4.
- Government buildingsBecause this survey research assessed the urban footprint of the CBD, with an interest in understanding the ownership characteristics of property, there was a need to understand how much property was owned by State or Municipal governments or Parastatal (government corporation) owned buildings. However, for this survey research, no distinction was made between State, Municipal, and Parastatal owned buildings.
- 5.
- Green and Public SpacesTo understand the urban typology and spatial footprint, green and public spaces were also been surveyed.
- Are you a tenant or landowner of this plot?
- Did you occupy this building before, or after, 1999?
- Are you a tenant or landowner of this building?
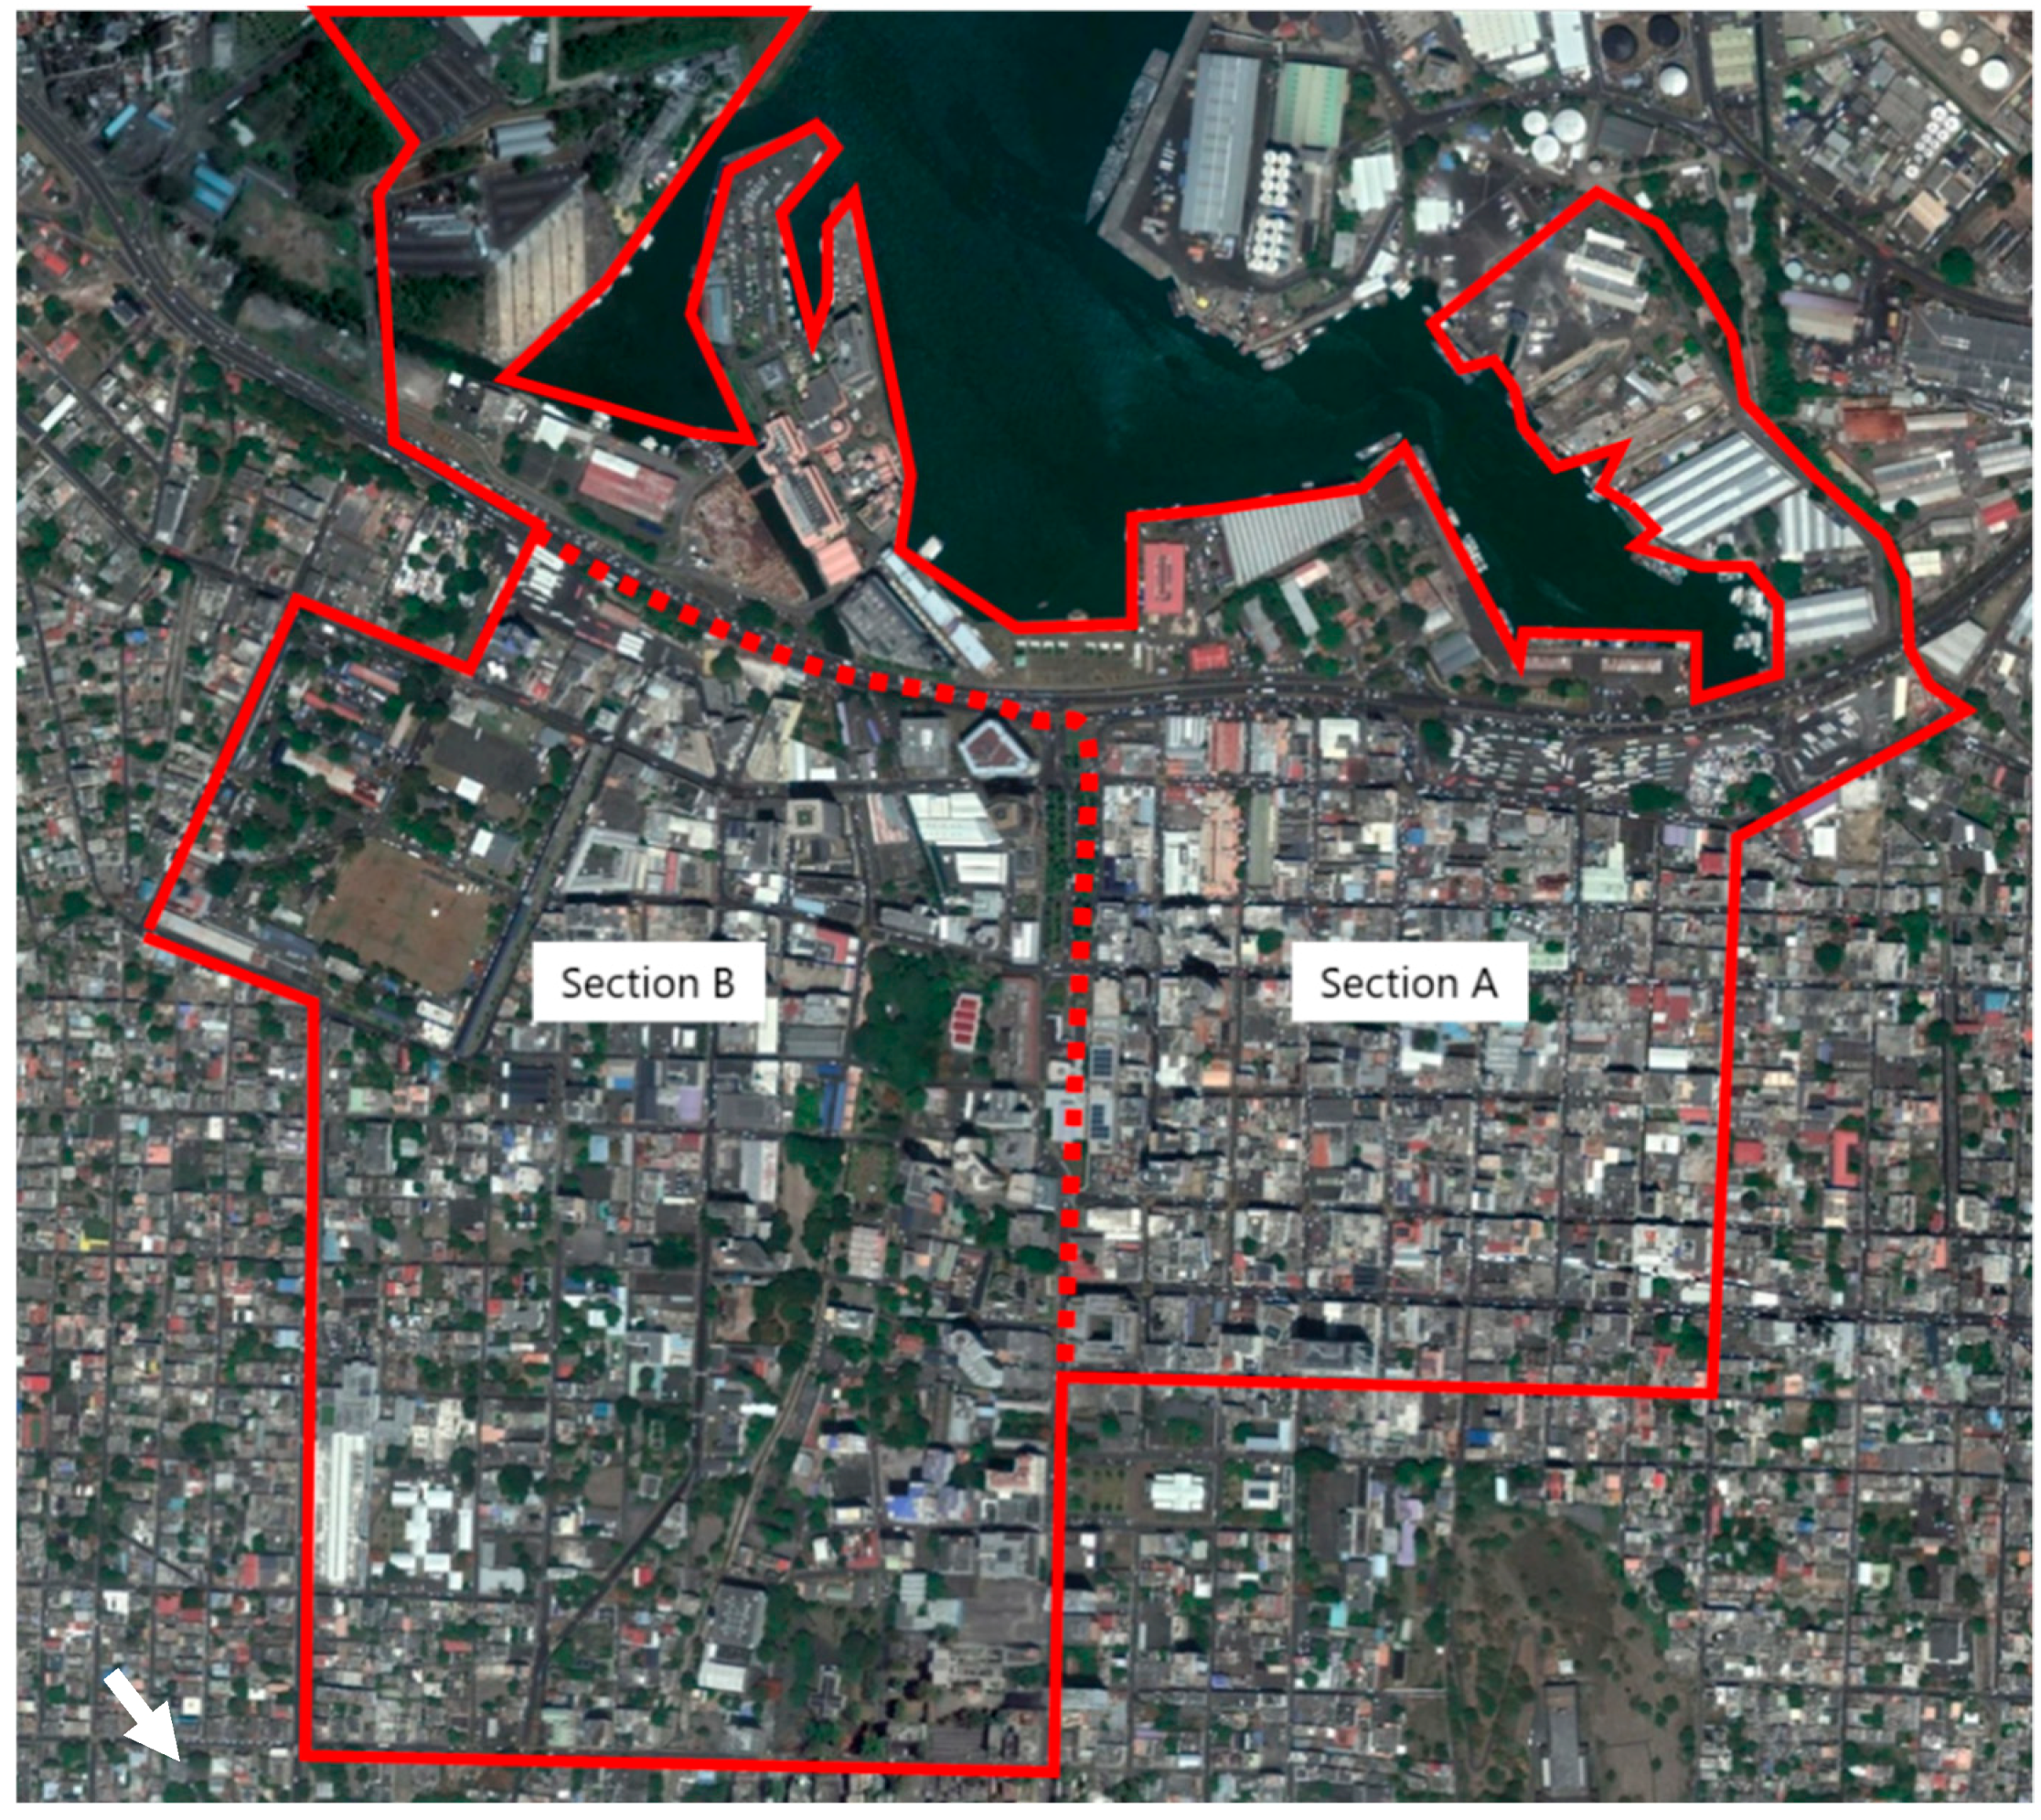
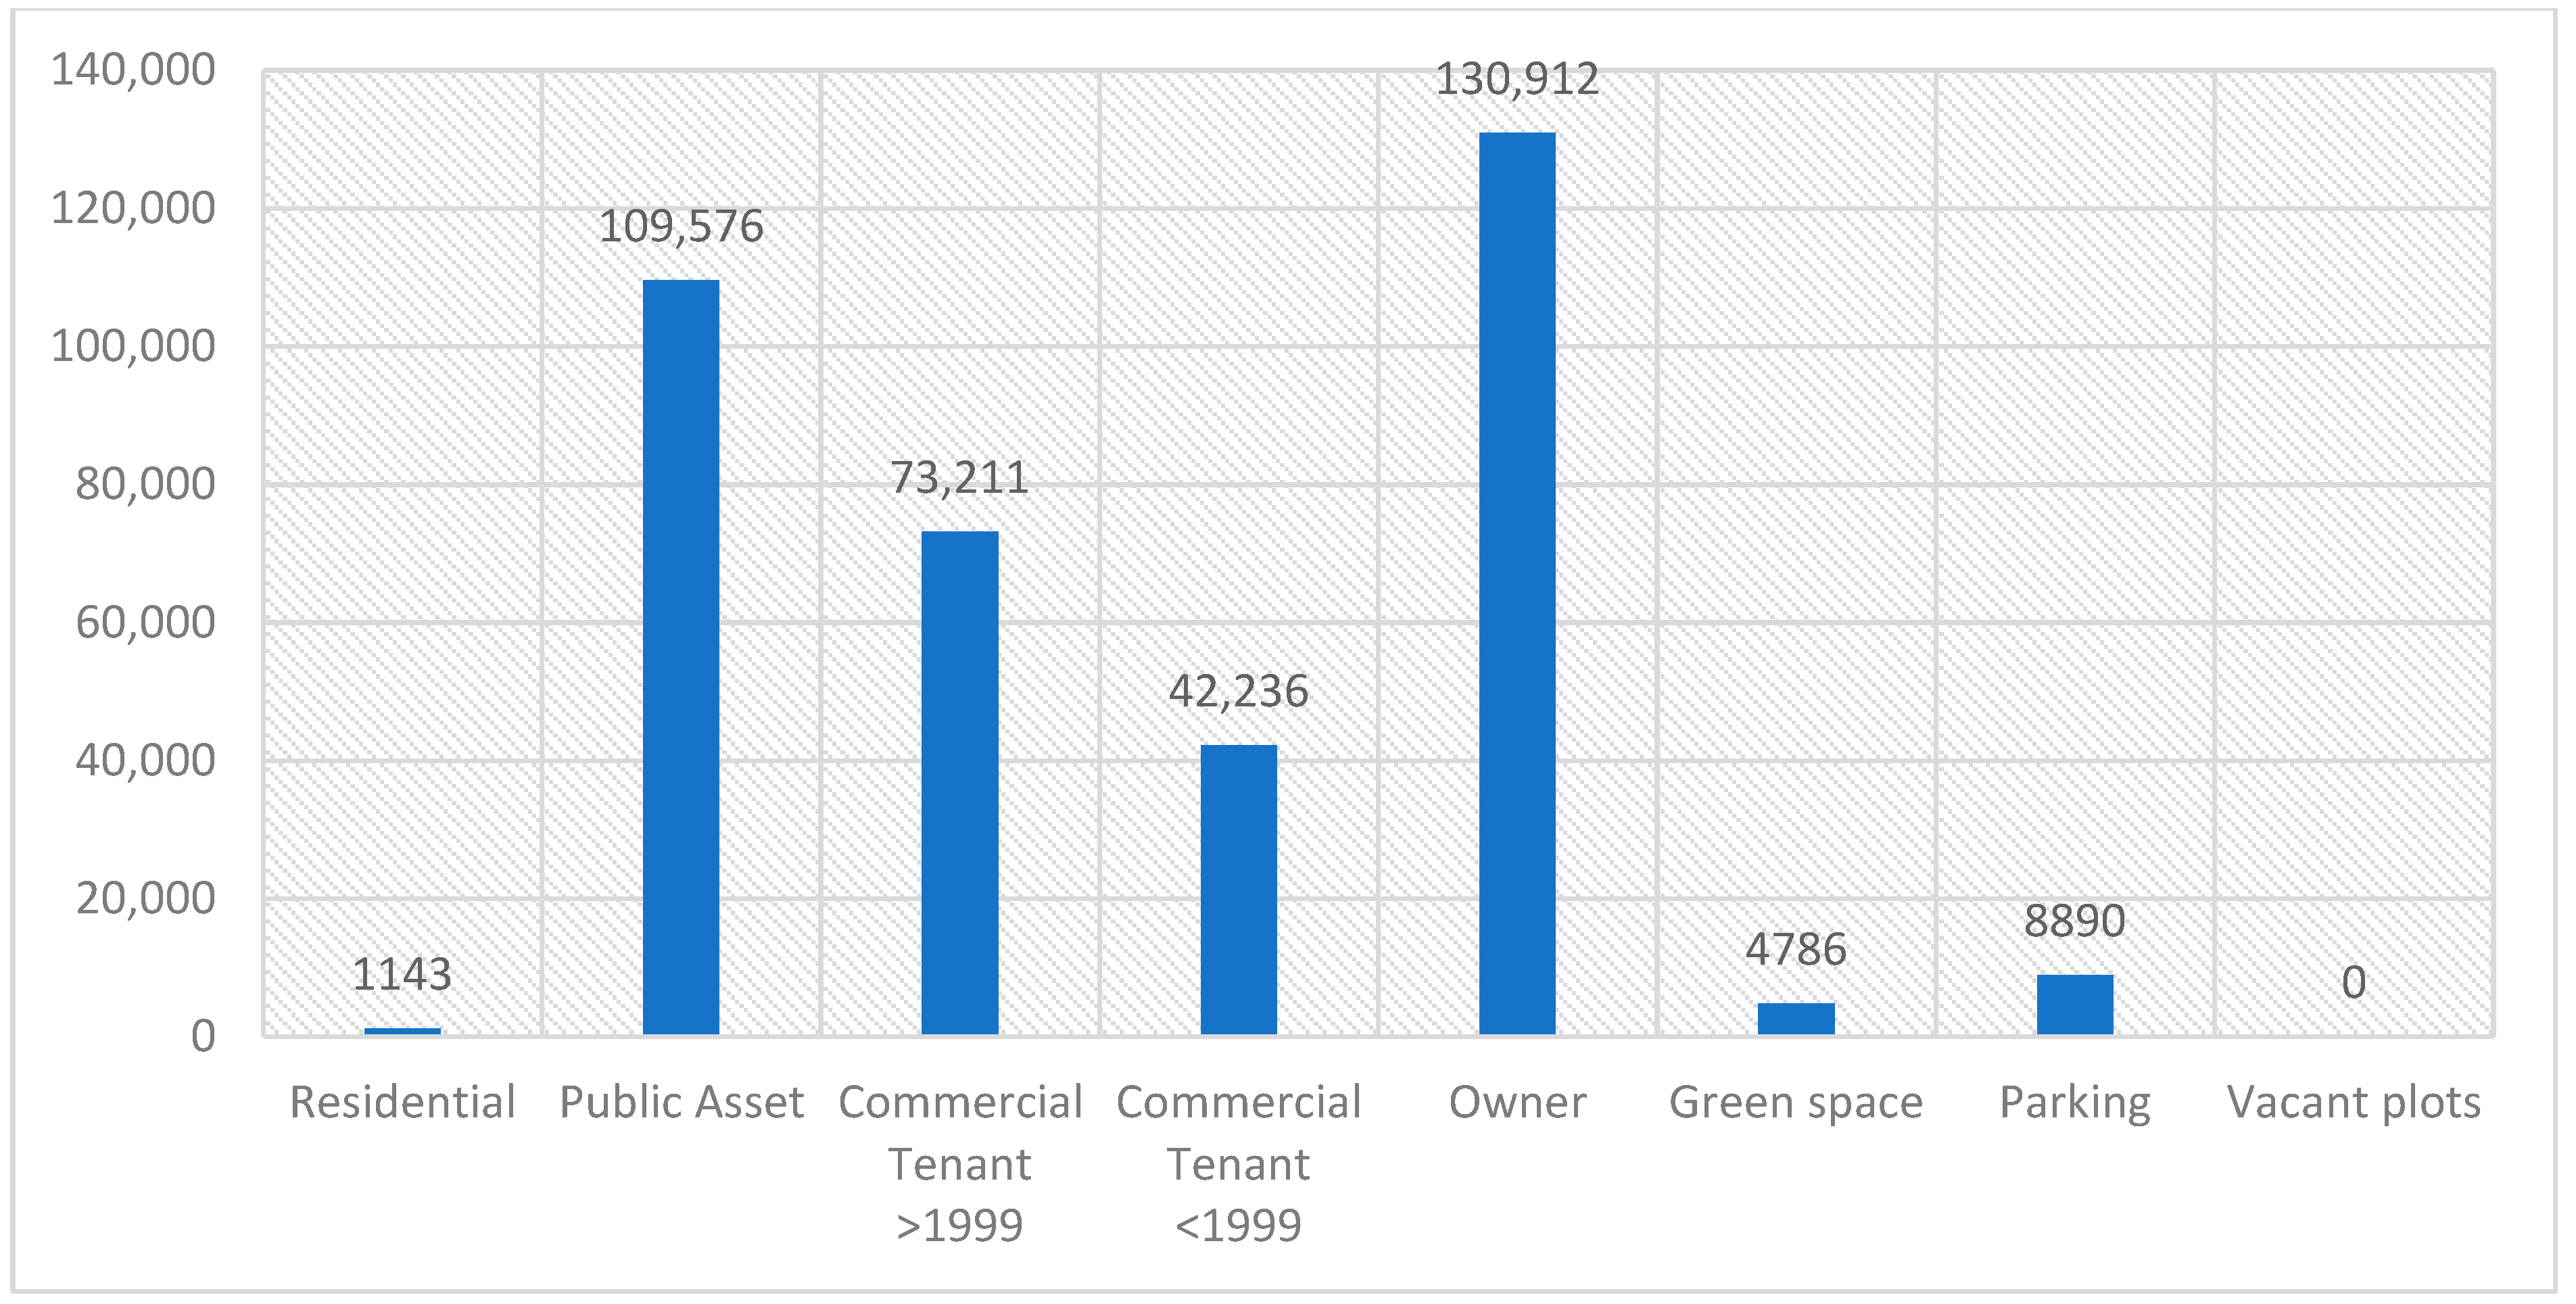
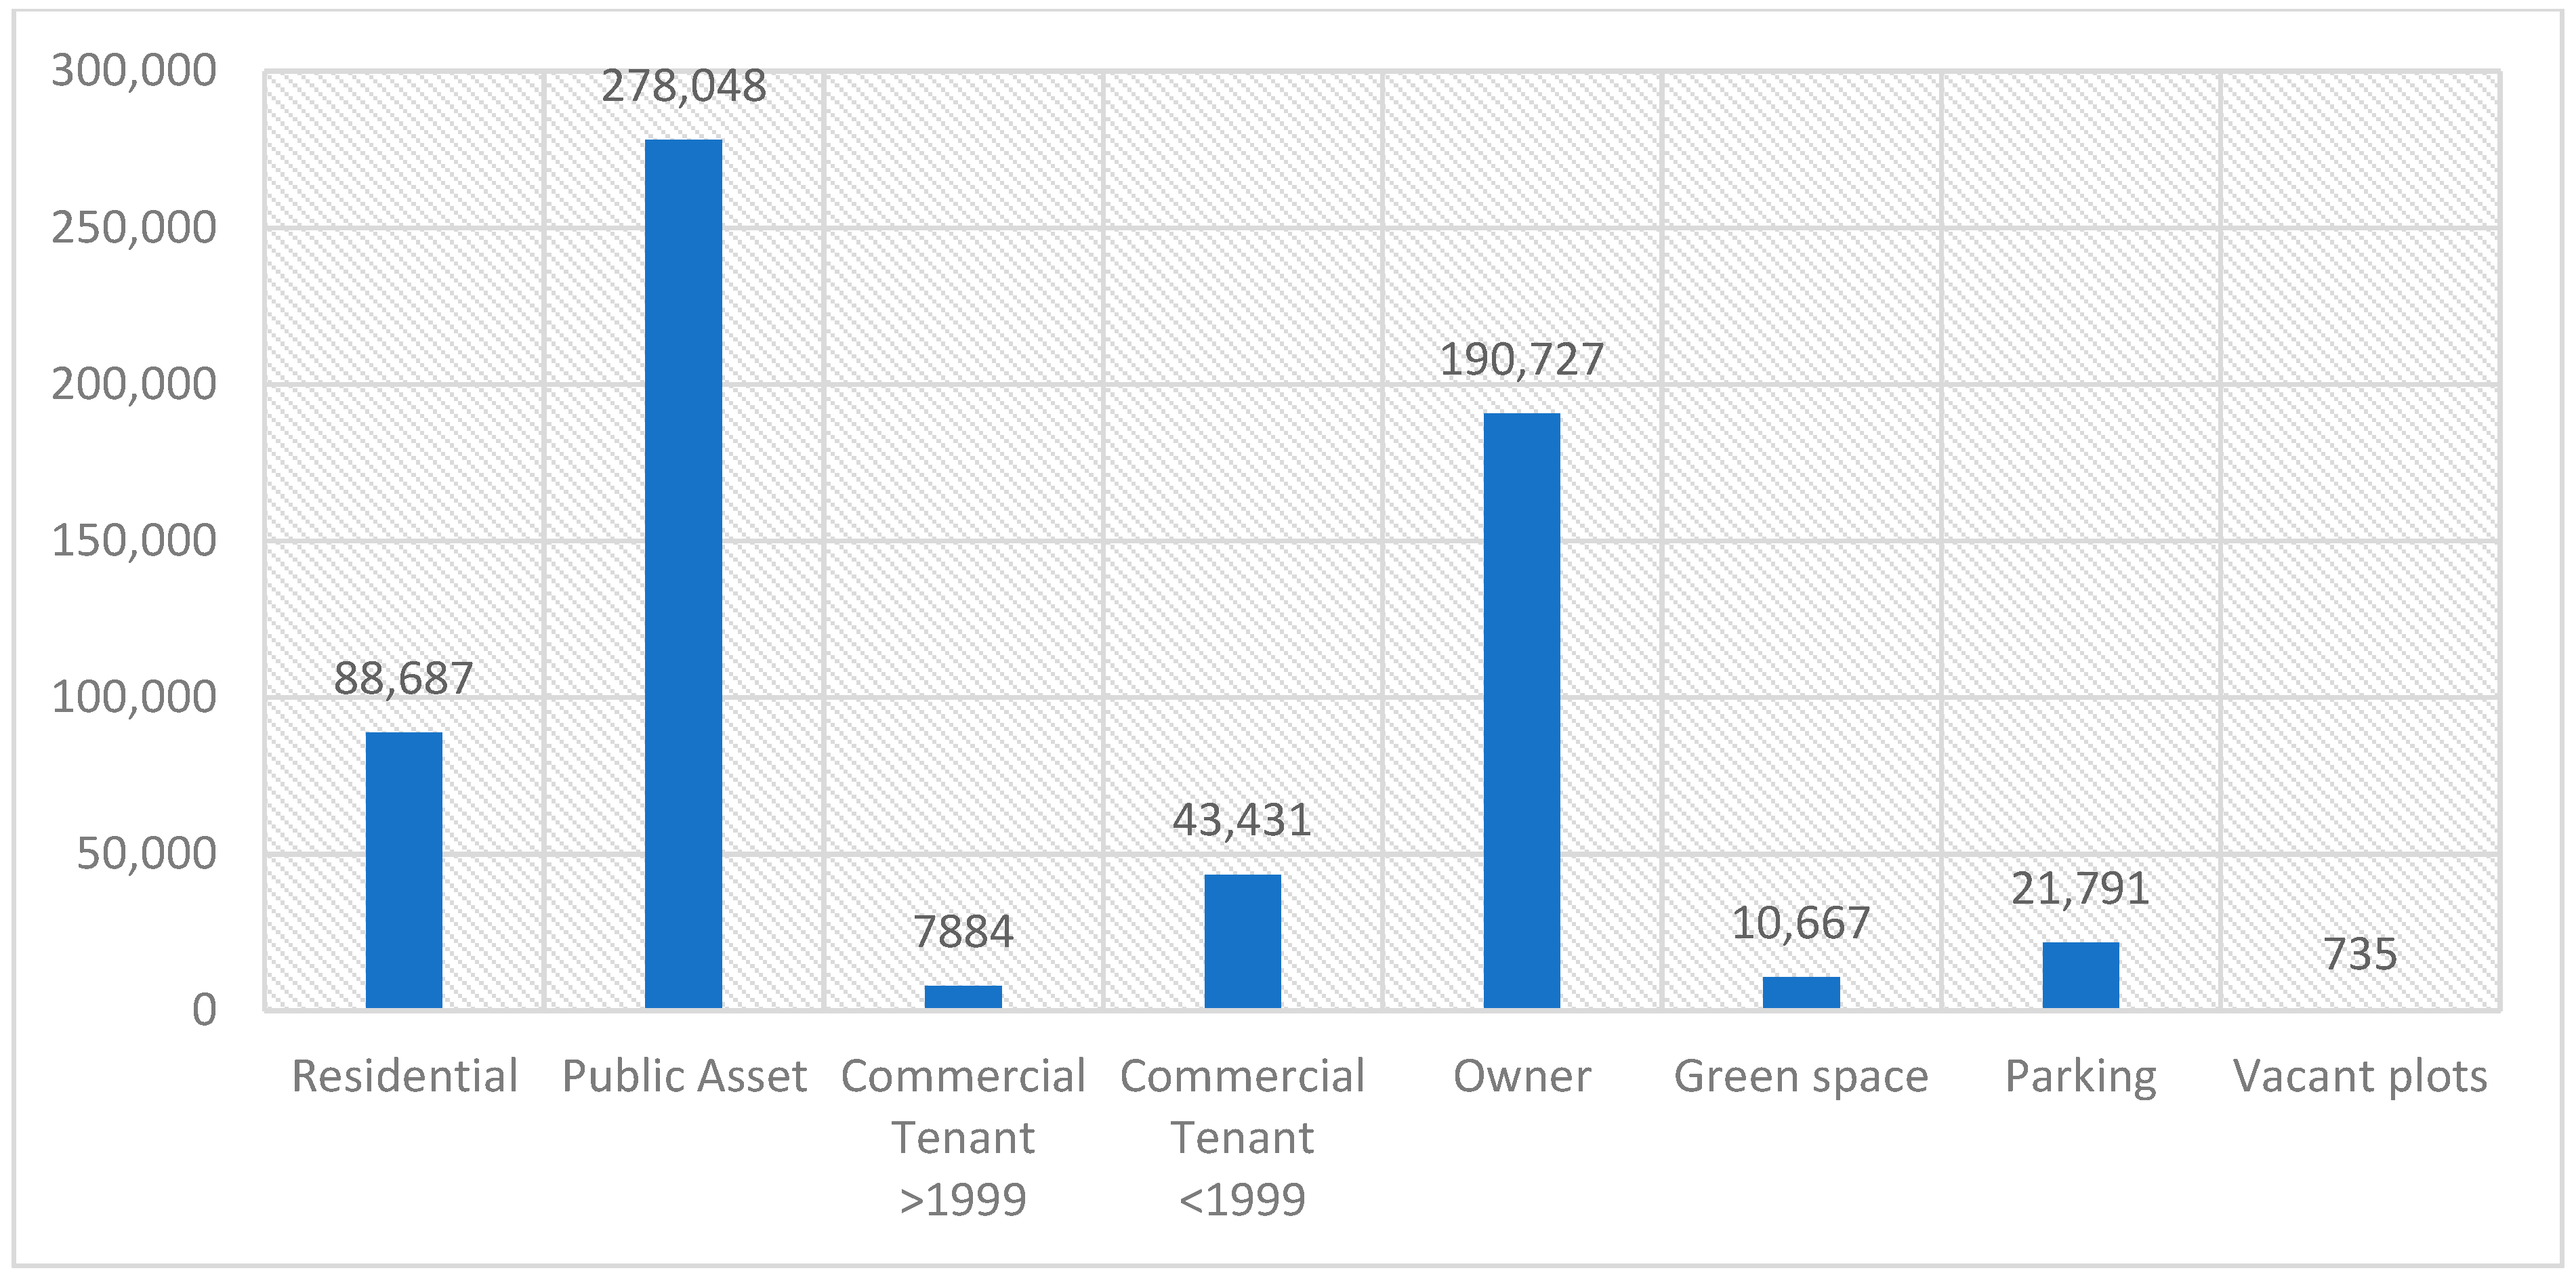
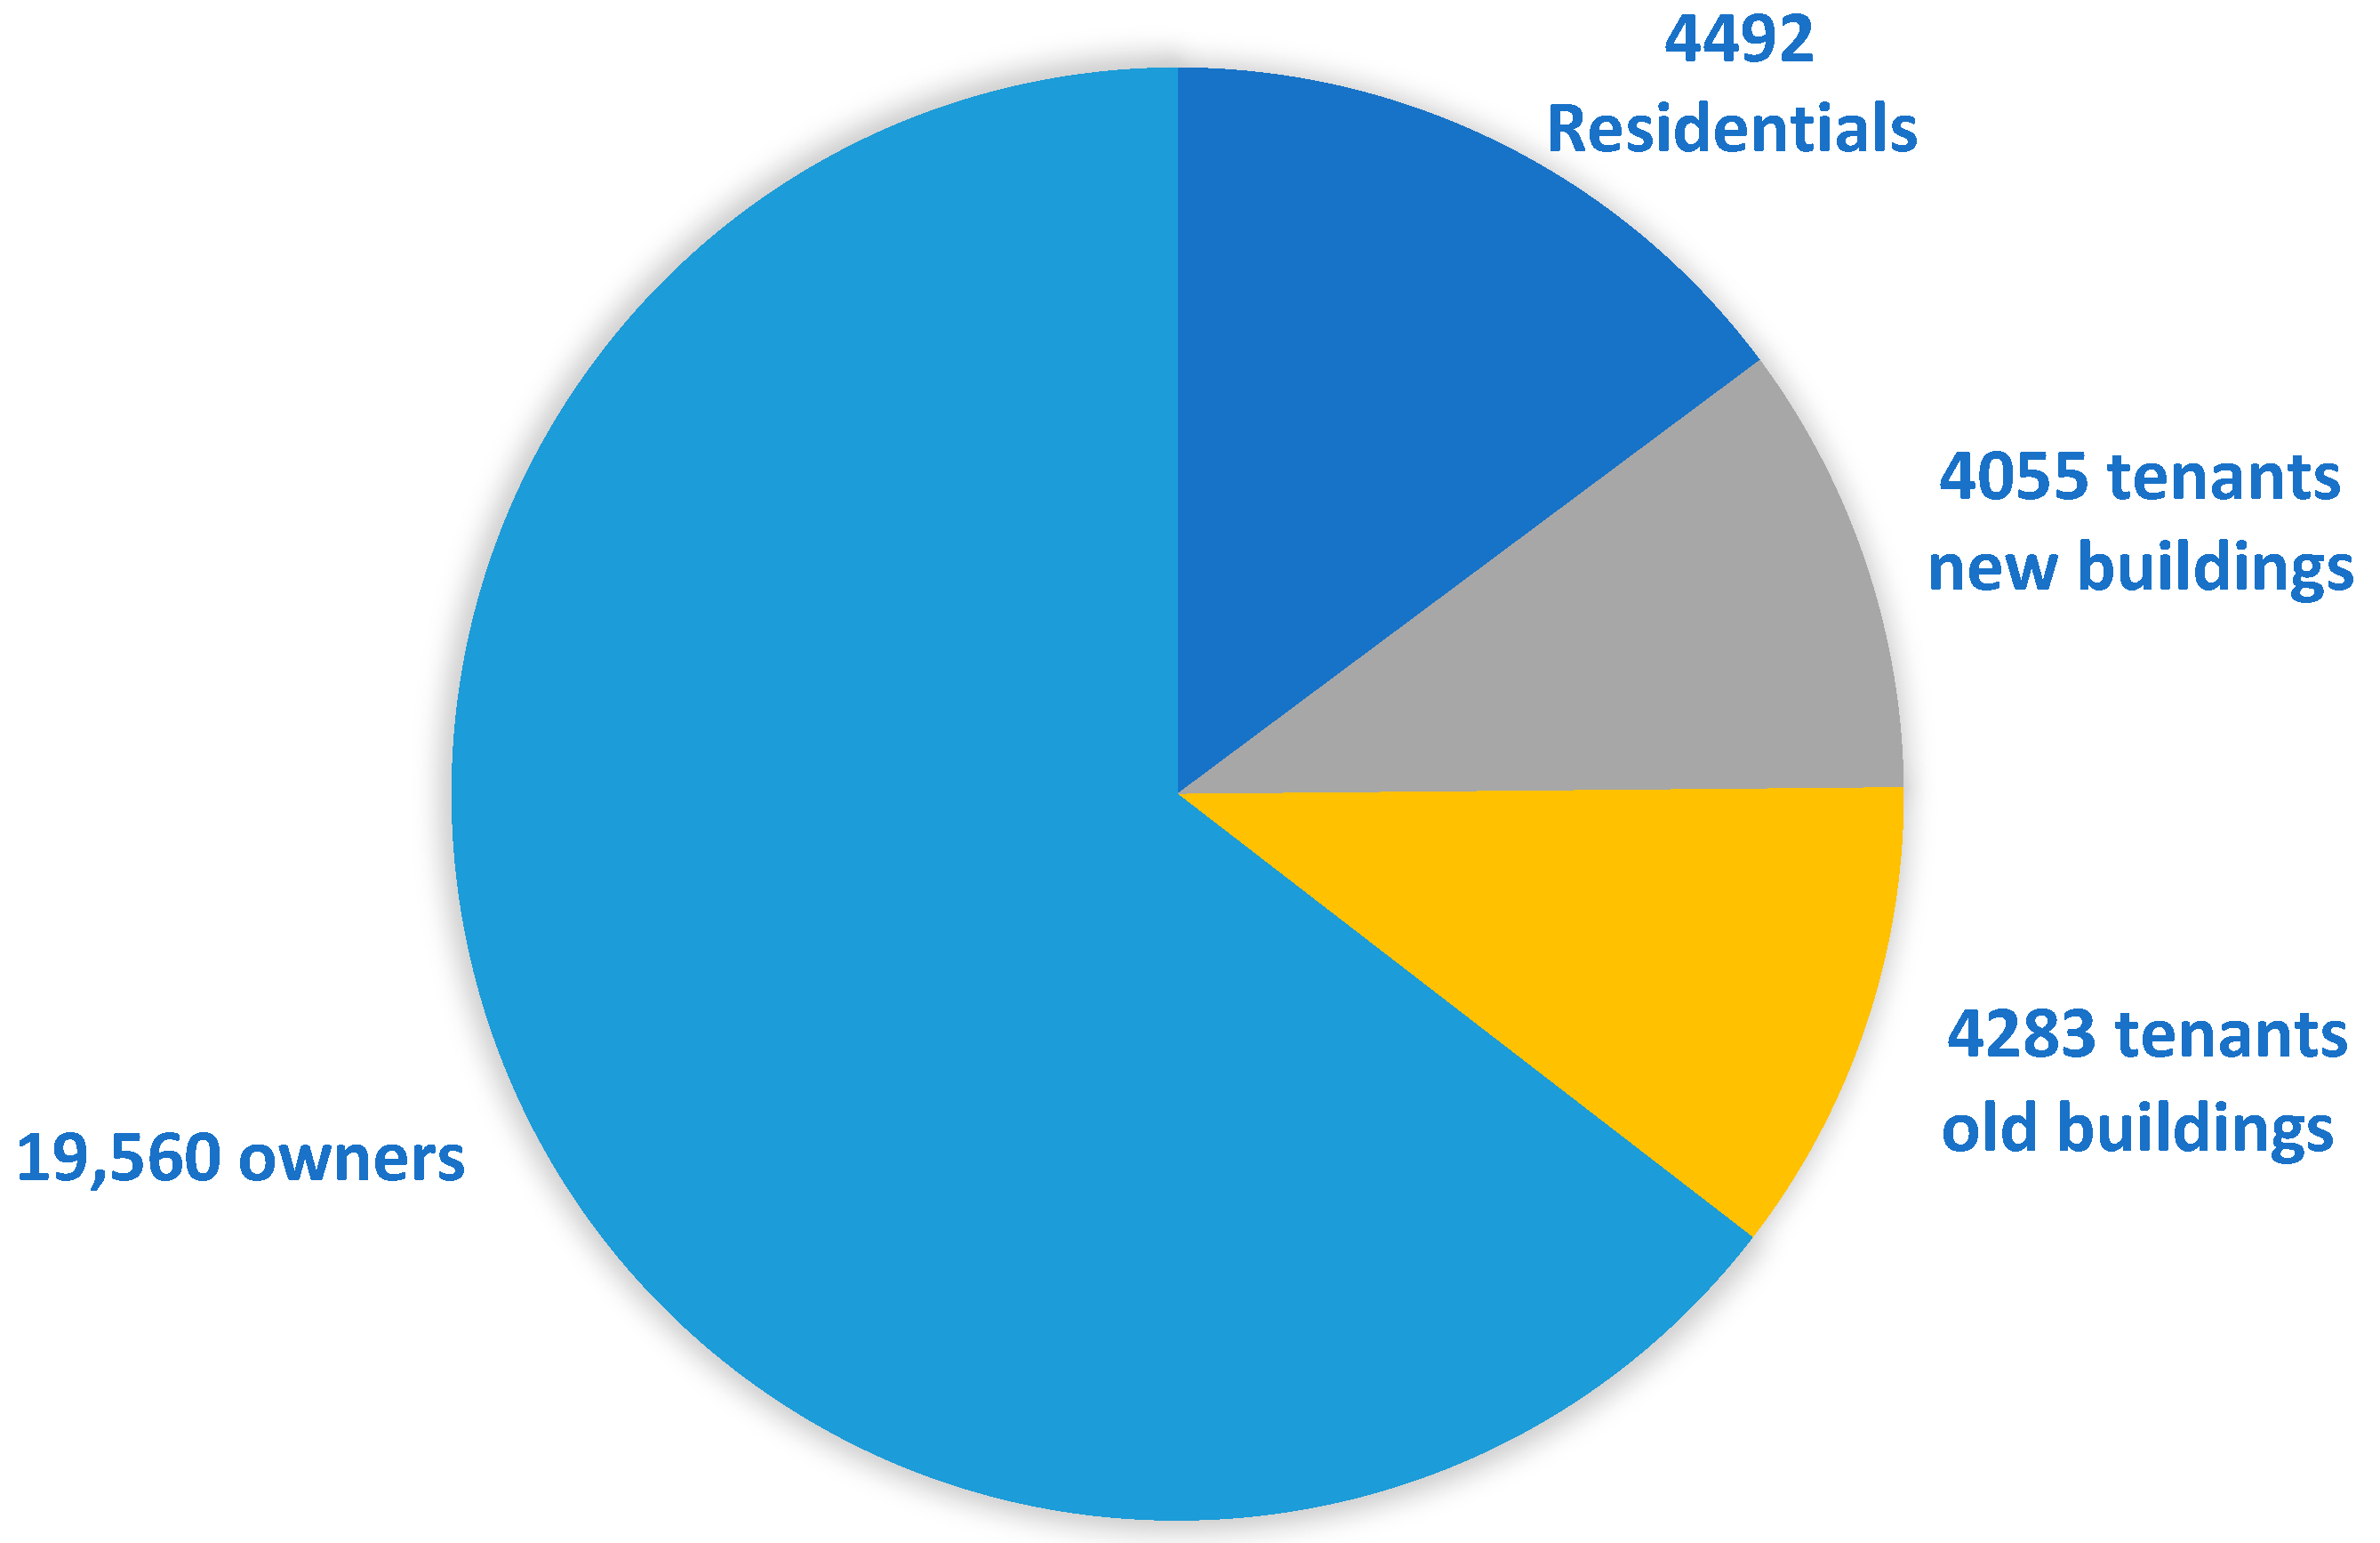
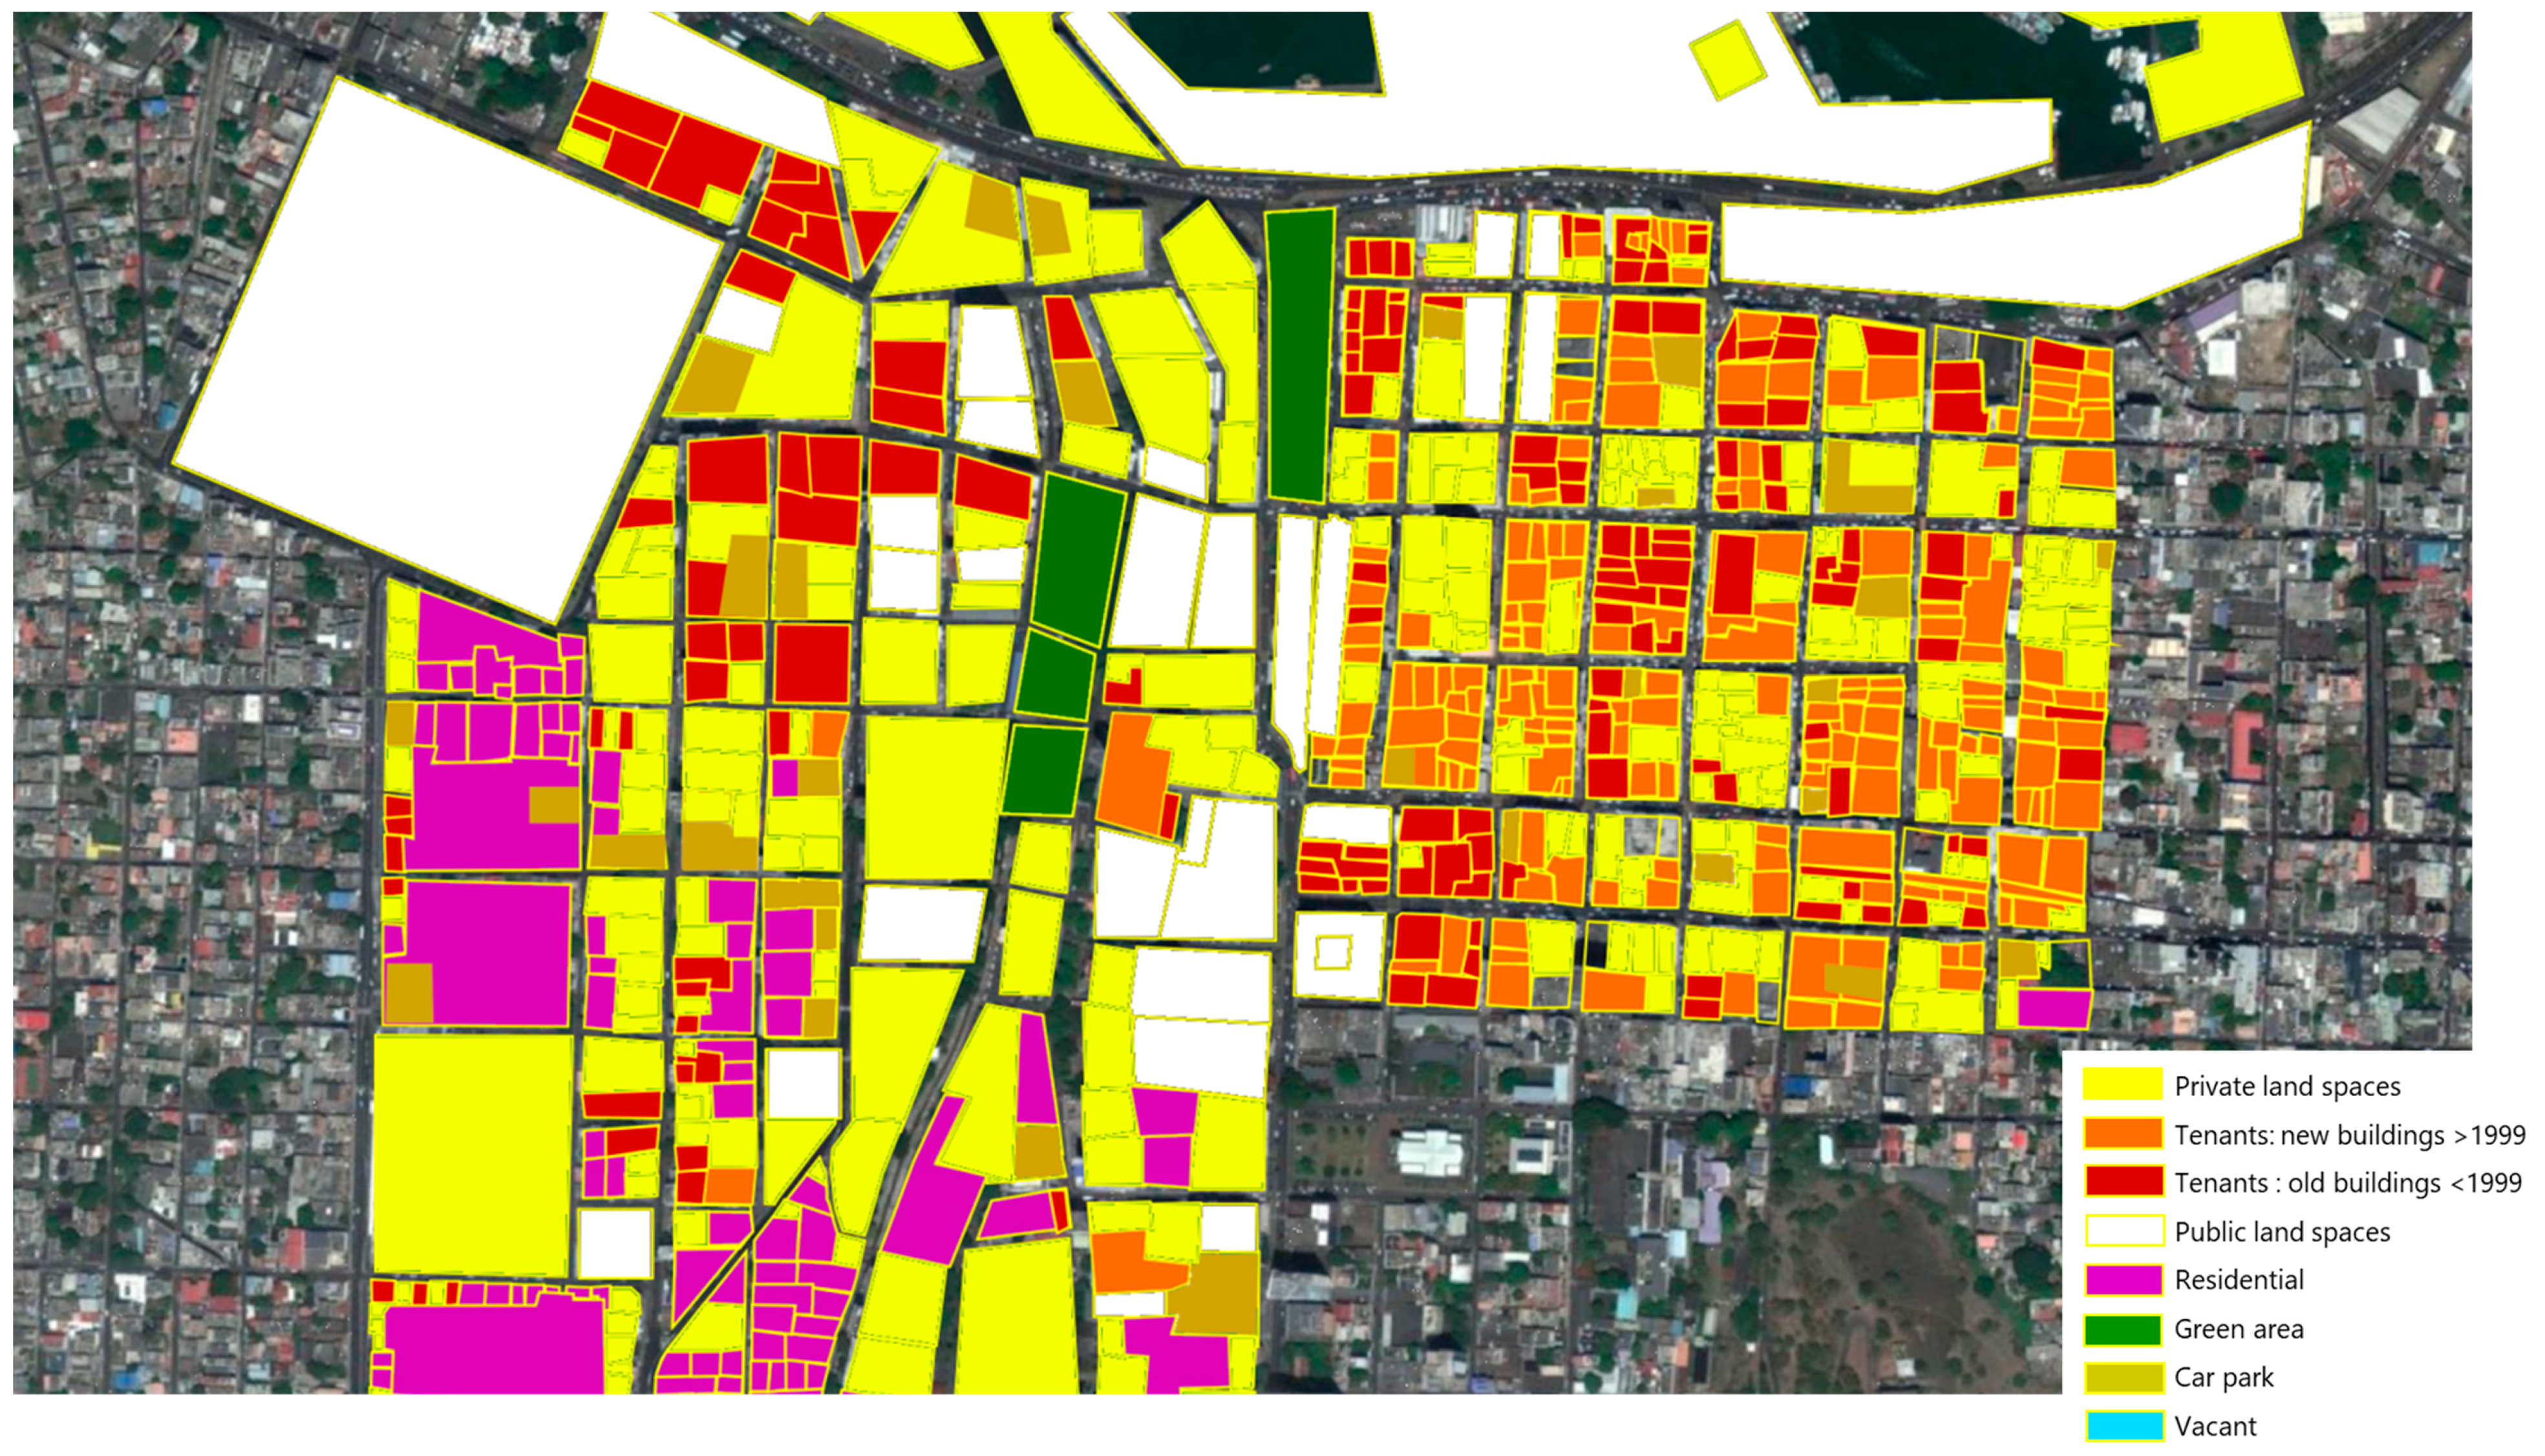
5. Results of the Footprint Survey
6. Discussion
7. Conclusions
Author Contributions
Funding
Acknowledgments
Conflicts of Interest
References
- Caltabiano, L. Investigation of the Role of Urban Regeneration in Enhancing Social Sustainability. A Case Study in Lombok. Master’s Thesis, Utrecht University, Utrecht, The Netherlands, 2006. Unpublished work. [Google Scholar]
- La Rosa, D.; Privitera, R.; Barbarossa, L.; La Greca, P. Assessing spatial benefits of urban regeneration programs in a highly vulnerable urban context: A case study in Catania, Italy. Landsc. Urban Plan. 2017, 157, 180–192. [Google Scholar] [CrossRef]
- Alberini, A.; Longo, A.; Riganti, P. Using Surveys to Compare the Public’s and Decision Makers’ Preferences for Urban Regeneration: The Venice Arsenale. SSRN Electron. J. 2006, 1–43. Available online: http://math.unife.it/economia/lm.economia/insegnamenti/economia-e-politiche-ambientali/materiale-didattico/arsenale%20alberini%20et%20al%20Choice%20exp%20ACB.pdf (accessed on 1 September 2018).
- Allam, Z.; Jones, D.S. Promoting resilience, liveability and sustainability through landscape architectural design: A conceptual framework for Port Louis, Mauritius; A small island developing state. In IFLA World Congress Singapore 2018; International Federation of Landscape Architects: Singapore, 2018; pp. 1599–1611. [Google Scholar]
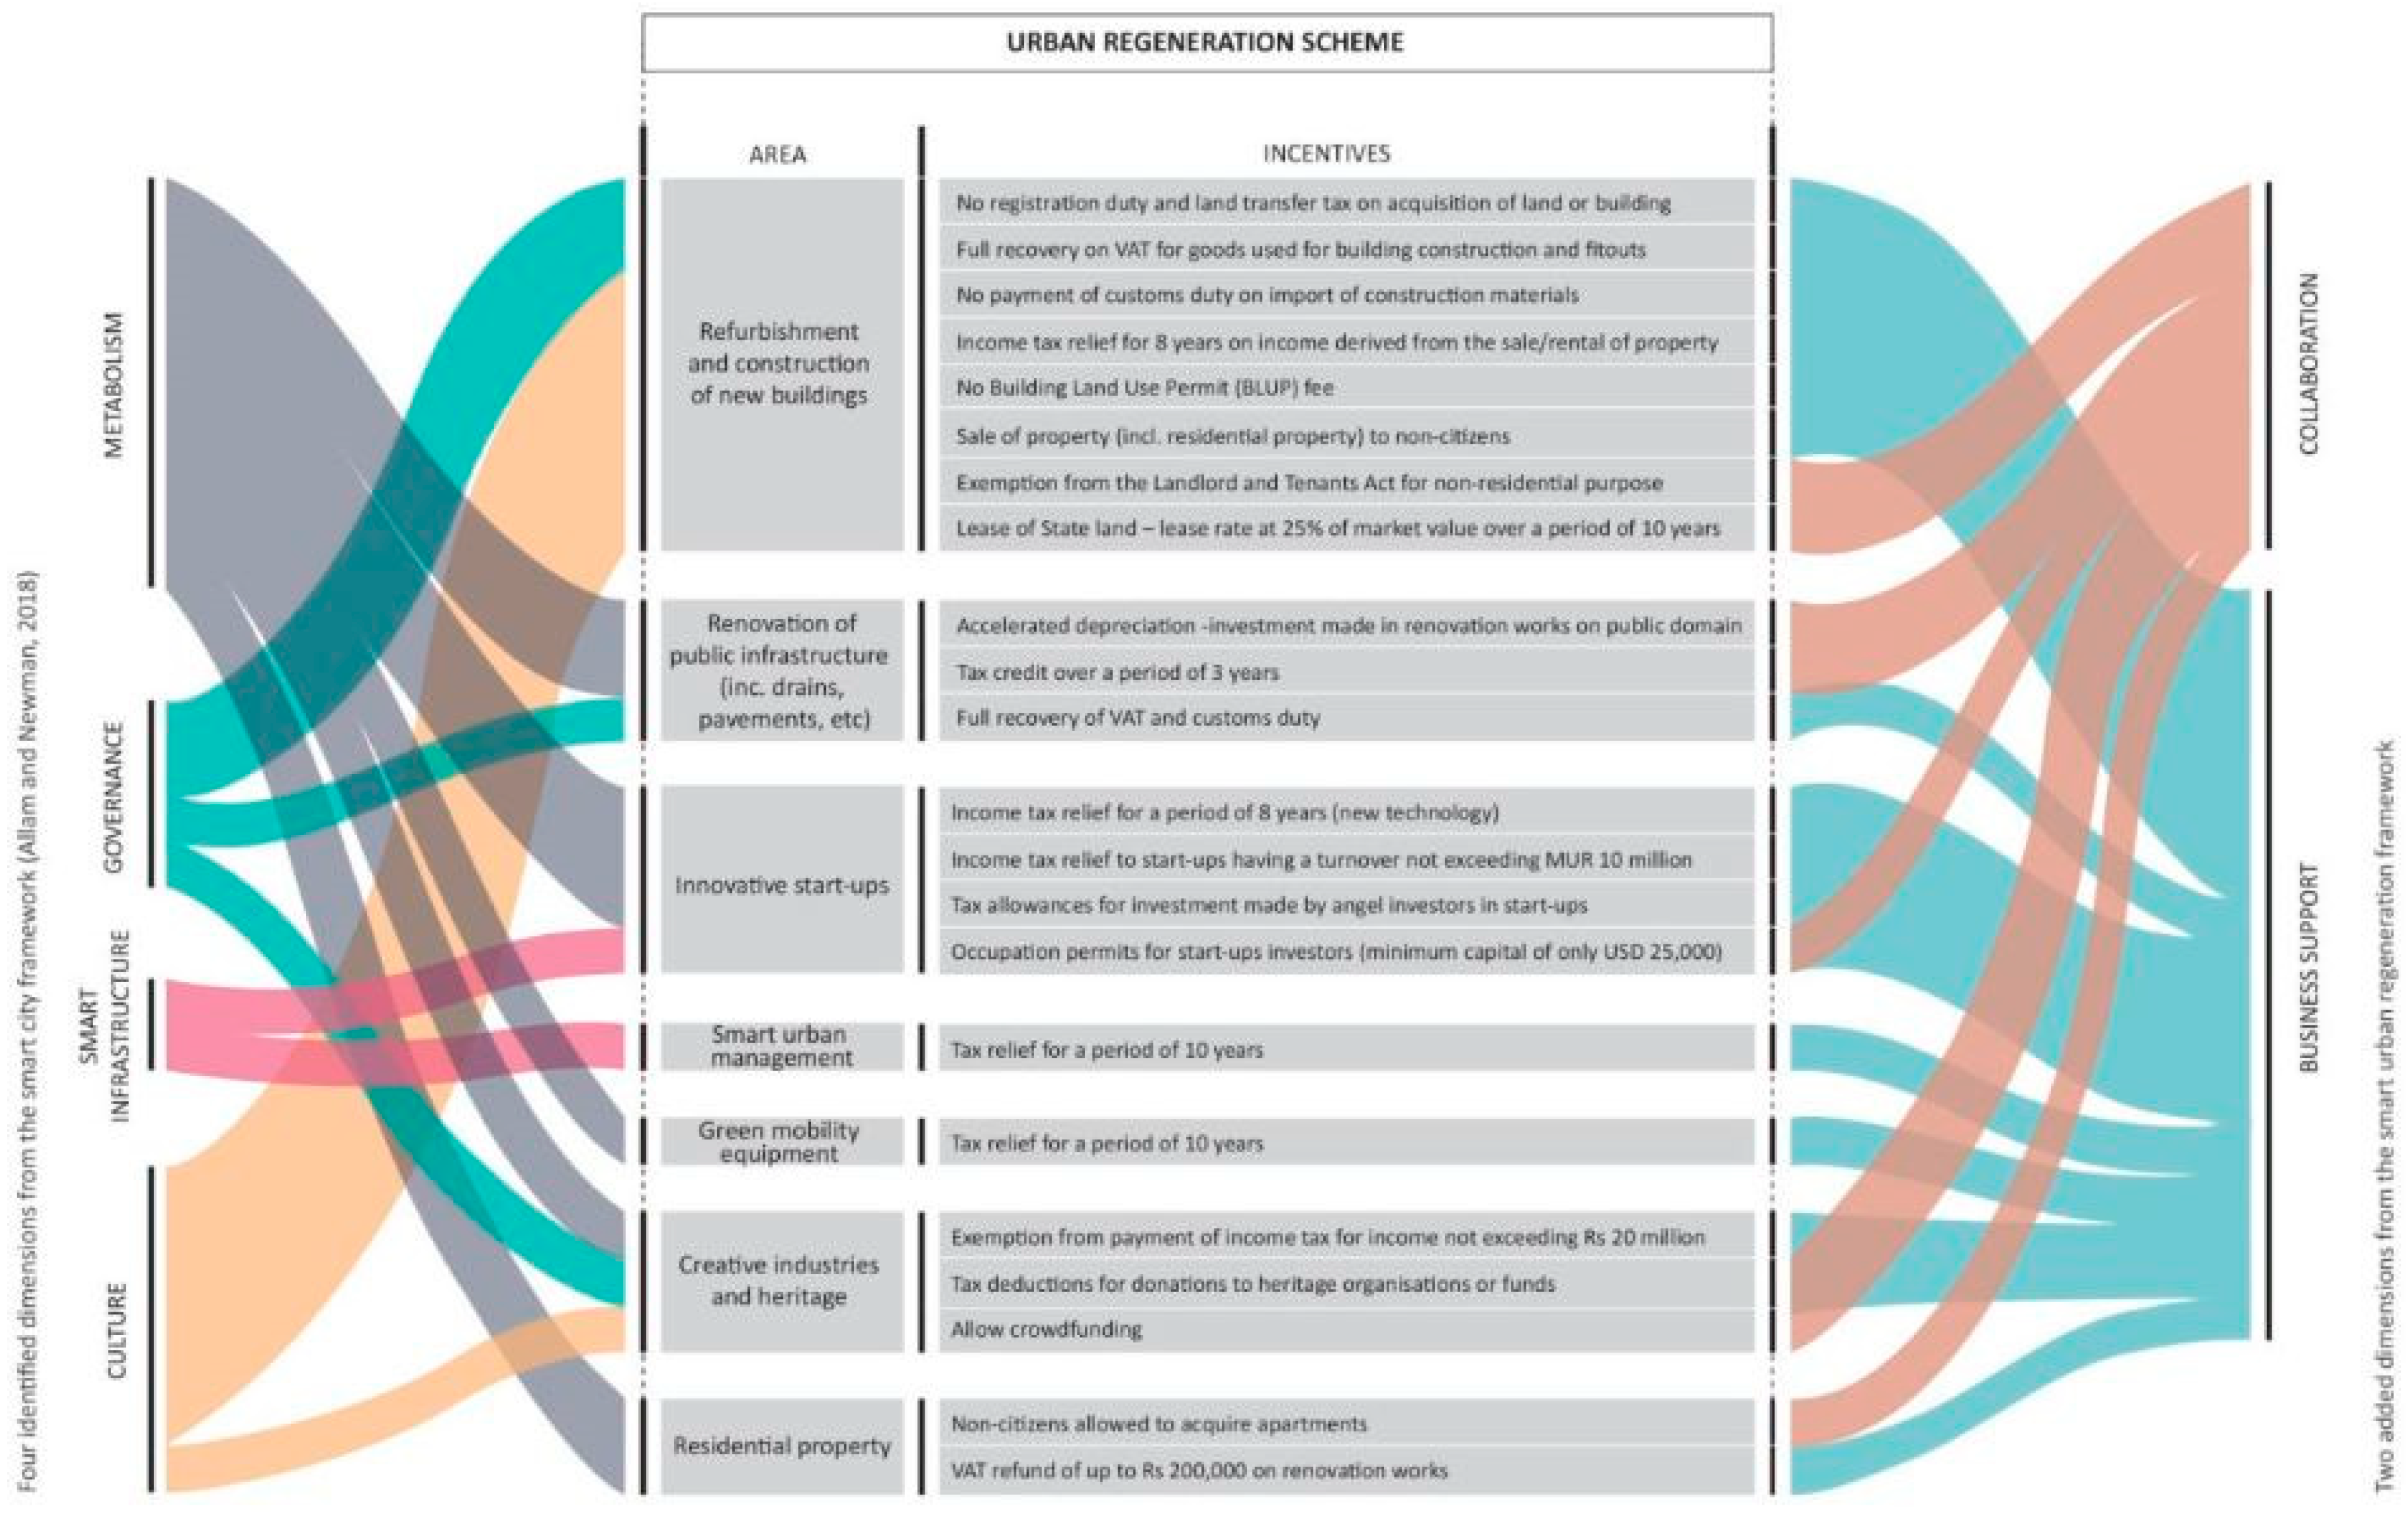
- Allam, Z.; Newman, P. Redefining the smart city: Culture, metabolism & governance. Smart Cities 2018, 1, 4–25. [Google Scholar]
- Allam, Z.; Newman, P. Economically incentivising smart urban regeneration. Case study of Port Louis, Mauritius. Smart Cities 2018, 1, 53–74. [Google Scholar] [CrossRef]
- World Bank. Urban Regeneration; World Bank: Washington, DC, USA, 2018. [Google Scholar]
- Mauritius. Digest of Demographic Statistics; Government of Mauritius, Port Louis. 2016. Available online: http://statsmauritius.govmu.org/English/StatsbySubj/Documents/Digest/Demography/Digest_Demo_Yr16.pdf (accessed on 1 September 2018).
- Board of Investment (BOI). Smart Cities Guidelines; Board of Investment: Port Louis, Mauritius, 2015. [Google Scholar]
- La Rédaction. Jean Claude de l’Estrac: «La Port Louis Development Initiative est un bureau de facilitation d’affaires». L’Express Maurice, 5 April 2017. Available online: https://www.lexpress.mu/article/303898/jean-claude-lestrac-port-louis-development-initiative-est-un-bureau-facilitation (accessed on 1 September 2018).
- Groëme-Harmon, A. Gaëtan Siew: «Ramener jusqu’à 5000 jeunes vivre à Port-Louis». L’Express Maurice, 9 April 2018. Available online: https://www.lexpress.mu/article/329431/gaetan-siew-ramener-jusqua-5-000-jeunes-vivre-port-louis (accessed on 1 September 2018).
- Siew, G.; Allam, Z. Culture as a driver for sustainable urban development. In UIA 2017 Seoul World Architects Congress; International Union of Architects: Seoul, Korea, 2017. [Google Scholar]
- Bertacchini, E.E.; Re, A. Port Louis 2030: Investing in the City’s Cultural Assets; Centro Studi Silvia Santagata EBLA: Torino, Italy, 2017. [Google Scholar]
- Government of Mauritius. Budget Speech 2018–2019: Pursuing Our Transformative Journey; Government of Mauritius: Port Louis, Mauritius, 2018.
- Reddi, K.R.; Moon, Y.B. Modelling engineering change management in a new product development supply chain. Int. J. Prod. Res. 2013, 51, 5271–5291. [Google Scholar] [CrossRef]
- Timofeeva, A.; Bulganina, S.; Fomenko, N.; Khachaturova, M.; Nekrasova, M.; Zakharova, E. Features of the implementation of integrated marketing communications: Resistance to change. Int. Rev. Manag. Mark. 2016, 6, 27–32. [Google Scholar]
- O’Halloran, J. The Effects of Employee Involvement on Intrinsic Job Satisfaction, Organizational Commitment, Trust in Management and Intention to Resign: Identifying Sources of Resistance to Change; Curtin University of Technology: Perth, Australia, 1995. [Google Scholar]
- Hultman, K. Making Change Irresistible: Overcoming Resistance to Change in Your Organization, 1st ed.; Davies-Black Pub.: Palo Alto, CA, USA, 1998. [Google Scholar]
- Barak, M. Are digital natives open to change? Examining flexible thinking and resistance to change. Comput. Educ. 2018, 121, 115–123. [Google Scholar] [CrossRef]
- Krügel, J.P.; Traub, S. Reciprocity and resistance to change: An experimental study. J. Econ. Behav. Organ. 2018, 147, 95–114. [Google Scholar] [CrossRef]
- Hon, A.H.Y.; Bloom, M.; Crant, J.M. Overcoming resistance to change and enhancing creative performance. J. Manag. 2014, 40, 919–941. [Google Scholar] [CrossRef]
- Dhunny, A.Z.; Samkhaniani, N.; Lollchund, M.R.; Rughooputh, S.D.D.V. Investigation of multi-level wind flow characteristics and pedestrian comfort in a tropical city. Urban Clim. 2018, 24, 185–204. [Google Scholar] [CrossRef]
- Avocella, I. The focus groups in social research: Advantages and disadvantages. Qual. Quant. 2012, 46, 1125–1136. [Google Scholar] [CrossRef]
- Parker, A.; Tritter, J. Focus group method and methodology: Current practice and recent debate. Int. J. Res. Method Educ. 2006, 29, 23–37. [Google Scholar] [CrossRef]
- Lewis, M. Focus group interviews in qualitative research: A review of the literature. Action Res. Rep. 2000, 2, 1–8. [Google Scholar]
- Scott, A. Focussing in on focus groups: Effective participative tools or cheap fixes for land use policy? Land Use Policy 2011, 28, 684–694. [Google Scholar] [CrossRef]
- Derkzen, P.; Bock, B. Partnership and role perception, three case studies on the meaning of being a representative in rural partnerships. Environ. Plan. C Gov. Policy 2009, 27, 75–89. [Google Scholar] [CrossRef]
- Massey, O.T. A proposed model for the analysis and interpretation of focus groups in evaluation research. Eval. Program Plan. 2011, 34, 21–28. [Google Scholar] [CrossRef] [PubMed]
- MPL. Heritage. Available online: http://www.mccpl.mu/cth_her.html (accessed on 21 September 2018).
- Morse, J.M.; Barrett, M.; Mayan, M.; Olson, K.; Spiers, J. Verification strategies for establishing reliability and validity in qualitative research. Int. J. Qual. Methods 2002, 1, 13–22. [Google Scholar] [CrossRef]
- Dovey, K.; Wood, S. Public/private urban interfaces: Type, adaptation, assemblage. J. Urbanism Int. Res. Placemaking Urban Sustain. 2015, 8, 1–16. [Google Scholar] [CrossRef]
- Kort, M.; Klijn, E.-H. Public-private partnerships in urban regeneration projects: Organizational form or managerial capacity? Public Admin. Rev. 2011, 71, 618–626. [Google Scholar] [CrossRef]
- Longa, R.D. Urban models. In Urban Models and Public-Private Partnership; Dalla Longa, R., Ed.; Springer: Berlin/Heidelberg, Germany, 2011; pp. 7–46. [Google Scholar]
- Landlord and Tenants Act–Fin du Moratoire: Des Commerçants Craignent la Fermeture. Le Mauricien, 19 August 2017. Available online: https://www.lemauricien.com/article/landlord-and-tenants-act-fin-du-moratoire-des-commercants-craignent-la-fermeture/ (accessed on 1 September 2018).
- McDonnell, B. Governor McDonnell Announces Potential Development of Air Rights over Transportation Facilities in Northern Virginia. Washington, D.C. 9 January 2014. Available online: https://www.visitroanokeva.com/articles/post/governor-mcdonnell-announces-signed-agreement-to-extend-amtrak-virginia-service-to-roanoke/ (accessed on 1 September 2018).
- Barbanel, J. Up in the air: Development Rights of New York City landmarks. Wall Street J. N. Y. 5 April 2015. Available online: https://www.wsj.com/articles/up-in-the-air-development-rights-of-new-york-city-landmarks-1428280007 (accessed on 1 September 2018).
- Lippard, D.C. Cannon street station air rights development. Proc. ICE Struct. Build. 1993, 99, 403–416. [Google Scholar] [CrossRef]
- Allam, Z.; Jones, D.S. Historic Urban Landscapes in the Indian Ocean waters: Challenges of urban heritage custodianship for the Comoros, Maldives, Mauritius, Mayotte, Réunion, and Seychelles. In Routledge Handbook on Historic Urban Landscapes of the Asia-Pacific; Silva, K.D., Ed.; Routledge: London, UK, 2019. [Google Scholar]


| Entity | Parameter | Value (in %) |
|---|---|---|
| Occupations Affected by the Landlord & Tenant Act of 1999 | Footprint | 8 |
| All Floors | 6 | |
| Ownership | Public | 37 |
| Private | 63 | |
| Occupation | Residential | 8 |
| Buildings | Heritage | 35 |
| Open Space | Green | 1 |
© 2018 by the authors. Licensee MDPI, Basel, Switzerland. This article is an open access article distributed under the terms and conditions of the Creative Commons Attribution (CC BY) license (http://creativecommons.org/licenses/by/4.0/).
Share and Cite
Allam, Z.; Dhunny, A.Z.; Siew, G.; Jones, D.S. Towards Smart Urban Regeneration: Findings of an Urban Footprint Survey in Port Louis, Mauritius. Smart Cities 2018, 1, 121-133. https://doi.org/10.3390/smartcities1010007
Allam Z, Dhunny AZ, Siew G, Jones DS. Towards Smart Urban Regeneration: Findings of an Urban Footprint Survey in Port Louis, Mauritius. Smart Cities. 2018; 1(1):121-133. https://doi.org/10.3390/smartcities1010007
Chicago/Turabian StyleAllam, Zaheer, A. Zaynah Dhunny, Gaëtan Siew, and David S. Jones. 2018. "Towards Smart Urban Regeneration: Findings of an Urban Footprint Survey in Port Louis, Mauritius" Smart Cities 1, no. 1: 121-133. https://doi.org/10.3390/smartcities1010007
APA StyleAllam, Z., Dhunny, A. Z., Siew, G., & Jones, D. S. (2018). Towards Smart Urban Regeneration: Findings of an Urban Footprint Survey in Port Louis, Mauritius. Smart Cities, 1(1), 121-133. https://doi.org/10.3390/smartcities1010007