Article

Economically Incentivising Smart Urban Regeneration. Case Study of Port Louis, Mauritius

Curtin University Sustainability Policy Institute, Curtin University, Perth, WA 6845, Australia
*
Author to whom correspondence should be addressed.
Smart Cities 2018, 1(1), 53-74; https://doi.org/10.3390/smartcities1010004
Submission received: 25 July 2018 / Revised: 3 August 2018 / Accepted: 4 August 2018 / Published: 9 August 2018

Abstract

:
Port Louis, the capital city of Mauritius, has been the preferred city for hosting the judicial, political and business activities of the country for the past two centuries. However, new policies have created nine new smart cities in greenfield locations within 10 km from Port Louis, so the capital city is facing economic decline as it is losing businesses, as well as administrative functions. This loss equates to an erosion in municipal revenue along with a reduced interest in contributing to the development of the city; all of which takes a toll on its urban economic landscape, as well as on the broader Mauritian economy. This paper builds from the findings of a focus group study to propose a smart urban regeneration model for the City of Port Louis, which could enable the old city to be restored and regenerated rather than redeveloped in modernist architecture, as has happened in the new smart cities model. A smart urban regeneration model is proposed backed by the pillars of smart infrastructure, culture, metabolism and governance. The proposed model is applied to the context of Port Louis to generate an urban regeneration scheme. The potential benefits in terms of financial outcomes, investment attraction and job creation are explored through a combined application of econometric forecasting models. The results support positive figures of both investment and job creation, and the findings of this study aim at informing and providing the governing bodies of Port Louis with a tangible solution for revamping the centuries-old capital city, as well as demonstrating to the world that smart cities can mean sensitive urban regeneration.

1. Introduction

Nested in the North-West littoral side of the Island of Mauritius and bounded inland by a mountain range, Port Louis extends over an area of 46.7 km2. With a total population of 119,333 inhabitants as at December 2016, the capital city of Mauritius is the most densely populated geographical district of the island with 2954 P/km2 [1]. Port Louis hosts the only trade port of the island and has been the main administrative centre from a judicial, political and business perspective for more than two centuries. However, within the last decade, there has been an emergence of Techno-parks and privately-owned smart cities across the island which opened a new competitive landscape for businesses and administrative functions [2]. There have been notable highlighted risks that the loss in business and administrative functions from both the state and privately-owned organisations will eventually lead to an erosion in municipal revenue [3]. Lesser financial input will trickle down to lesser budget availability not only for city development but also for its maintenance. This might lead to an increase in urban decay, as has been the case with Detroit in USA [4]. In fact, at the moment more than 95% of municipal revenue is used for administrative ends such as salaries for the employees and the government lacks funds to be injected in existing cities [5].
The potential of the city has been hailed by many [3,5,6]. In fact, Port Louis has long been a vibrant city with rich historical, cultural and multi-ethnic dimensions which cannot be matched elsewhere in the island [7]. However, the cultural dimensions have greatly suffered from the lack of public funds and numerous heritage buildings are at risk [8]. With both the public and private sector losing interest to invest in the capital city, there is a notable trend of urban decline.
To catalyse urban regeneration through private investment in the public domain, an Urban Regeneration Scheme (URS) was proposed to the Government of Mauritius by Gaetan Siew, from the Port Louis Development Initiative (PLDI), in partnership with the first author. The URS was developed built from findings from a focus group including key stakeholders who were asked how smart city technologies could be used to help regenerate an old city like Port Louis rather than build a modernist new town in greenfields as has happened with new smart cities in Mauritius. An URS was devised for the city of Port Louis with the aim to catalyse investment and job creation, and the potential application was calibrated in accordance with local regulations.

2. Methodology

This paper builds on the findings of a focus group study conducted by Allam [9] aimed at regenerating the urban fabric of Port Louis using smart city technologies and approaches. An extensive literature survey was undertaken in a previous publication [10] where a smart cities framework was proposed. The smart cities framework as outlined by Allam and Newman [10] is coupled with the interpretation of findings from the focus group by Allam [9], leading to a more inclusive model: the smart urban regeneration framework. Based on this new model, a URS aimed at regenerating the urban fabric of Port Louis is proposed using smart city concepts. The URS consists of a fiscal package of incentives applicable to a designated Action Plan Zone (APZ). An economic quantification is followed to measure the impacts of the URS on the urban economy of Port Louis through investment, municipal revenue, business and jobs’ creation. Figure 1 summarises the methodological approach for this study.

3. Focus Group Findings

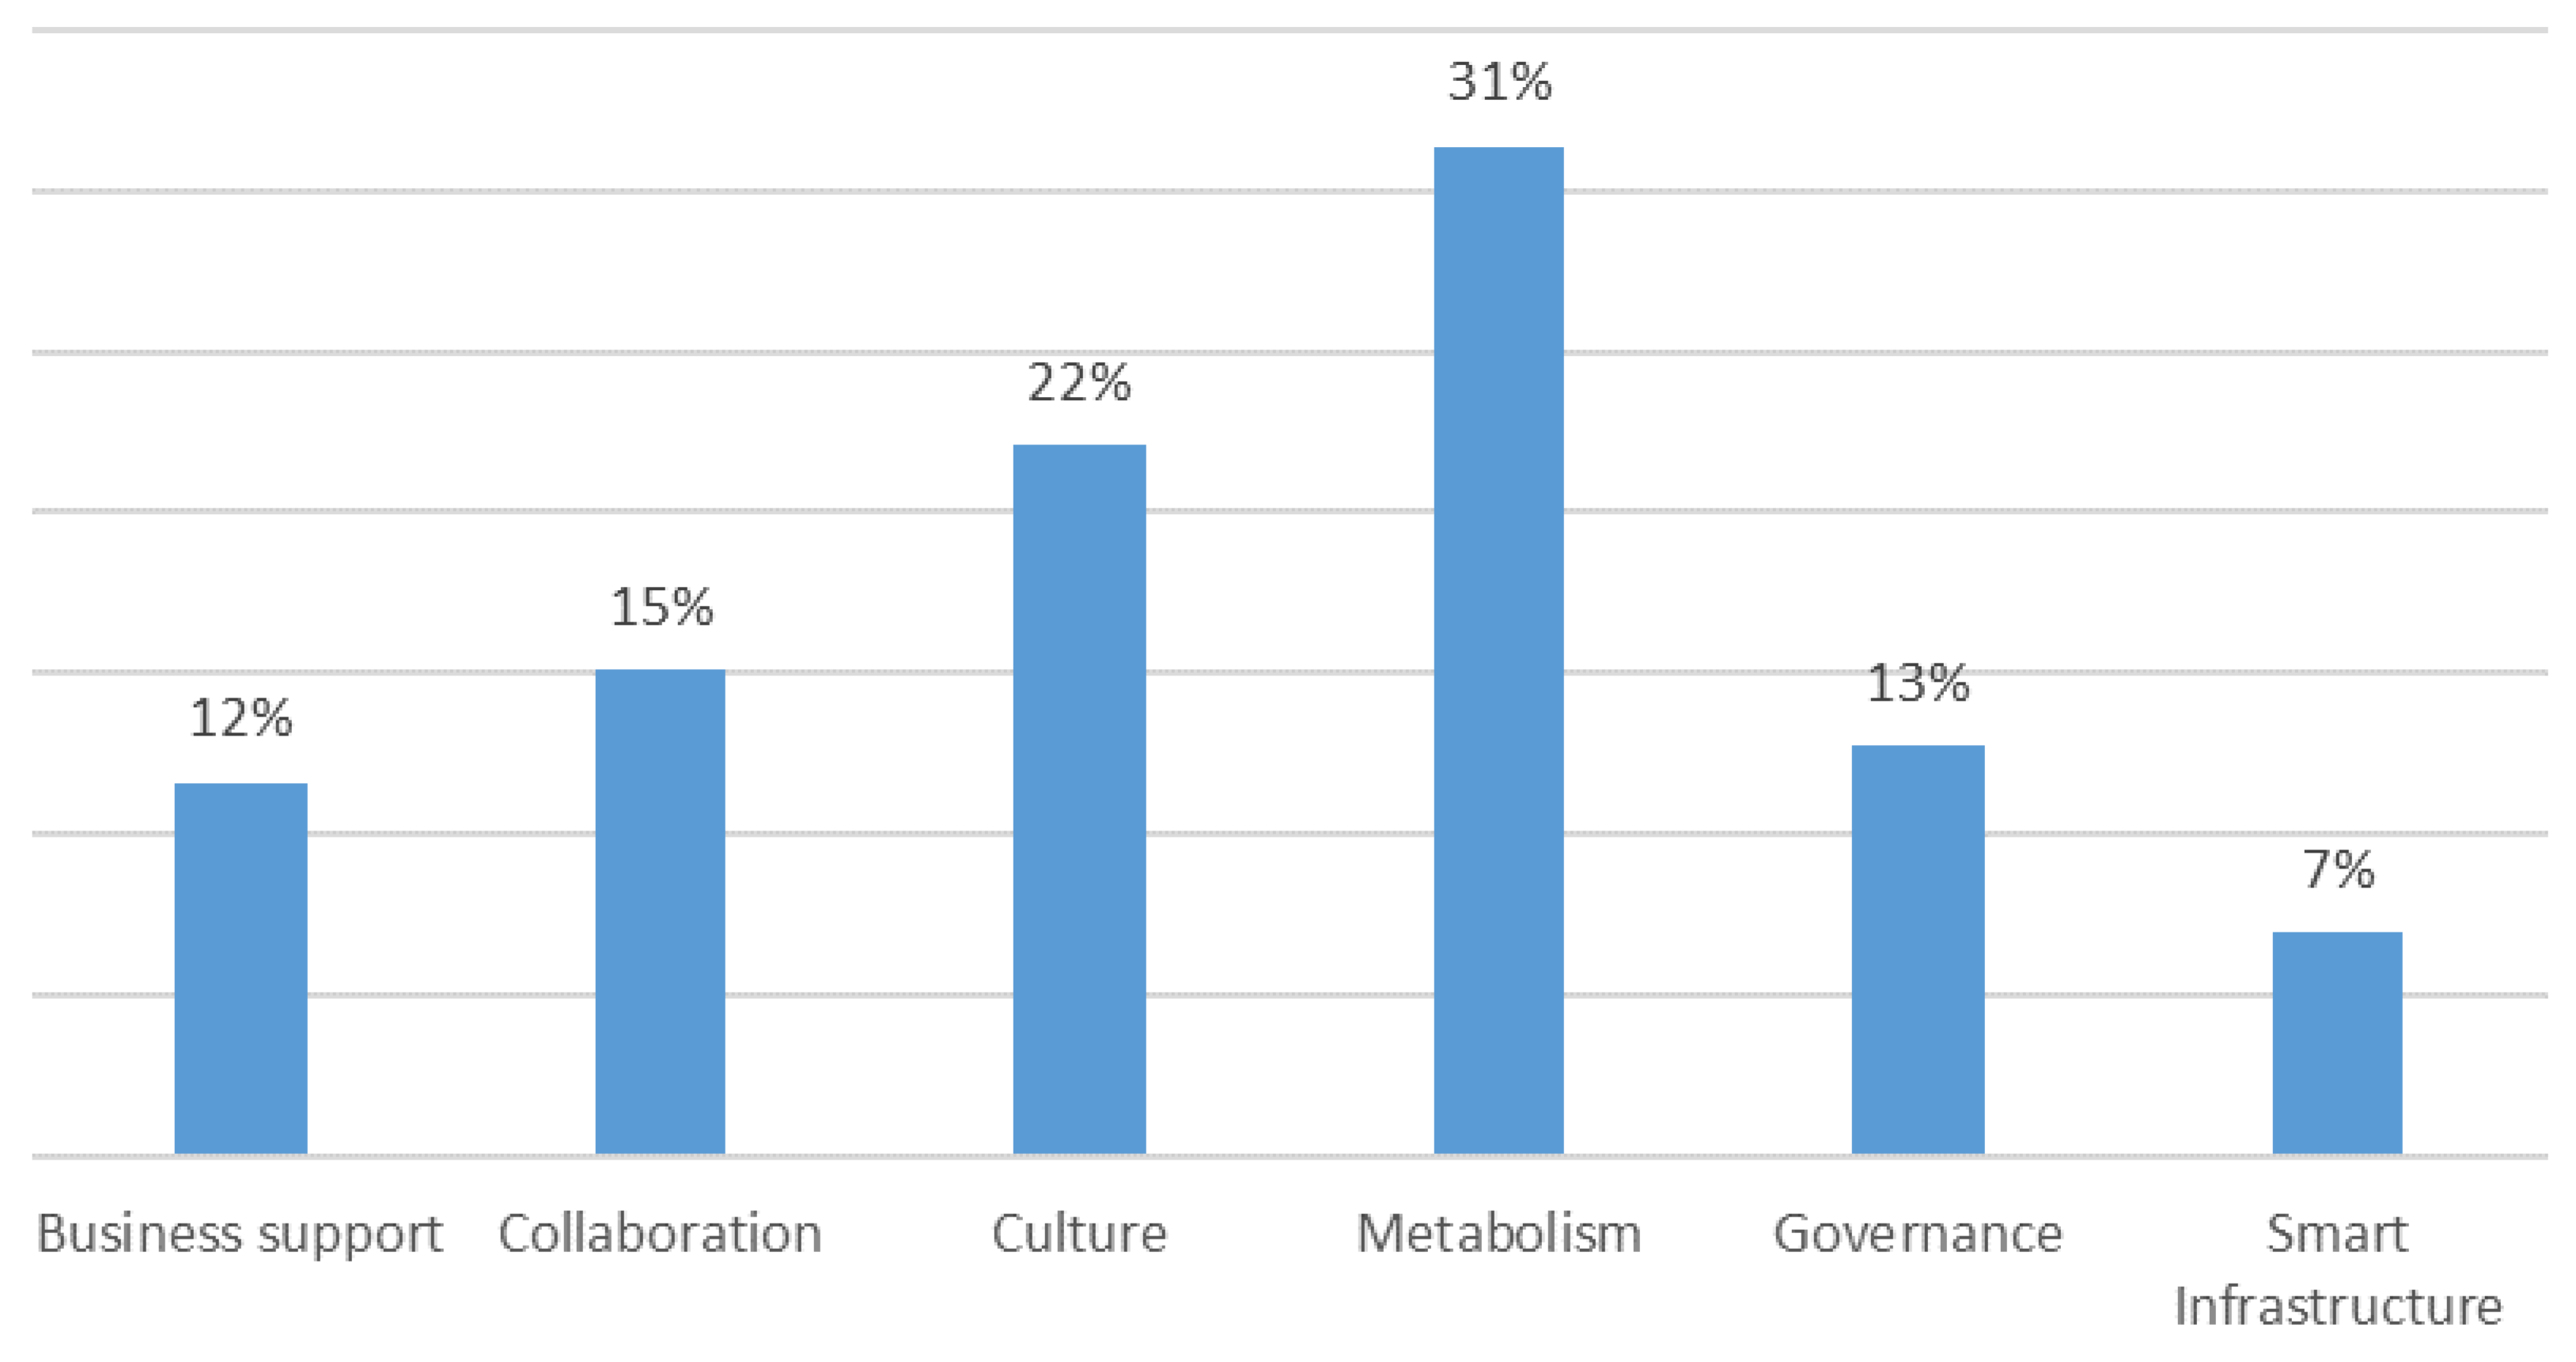
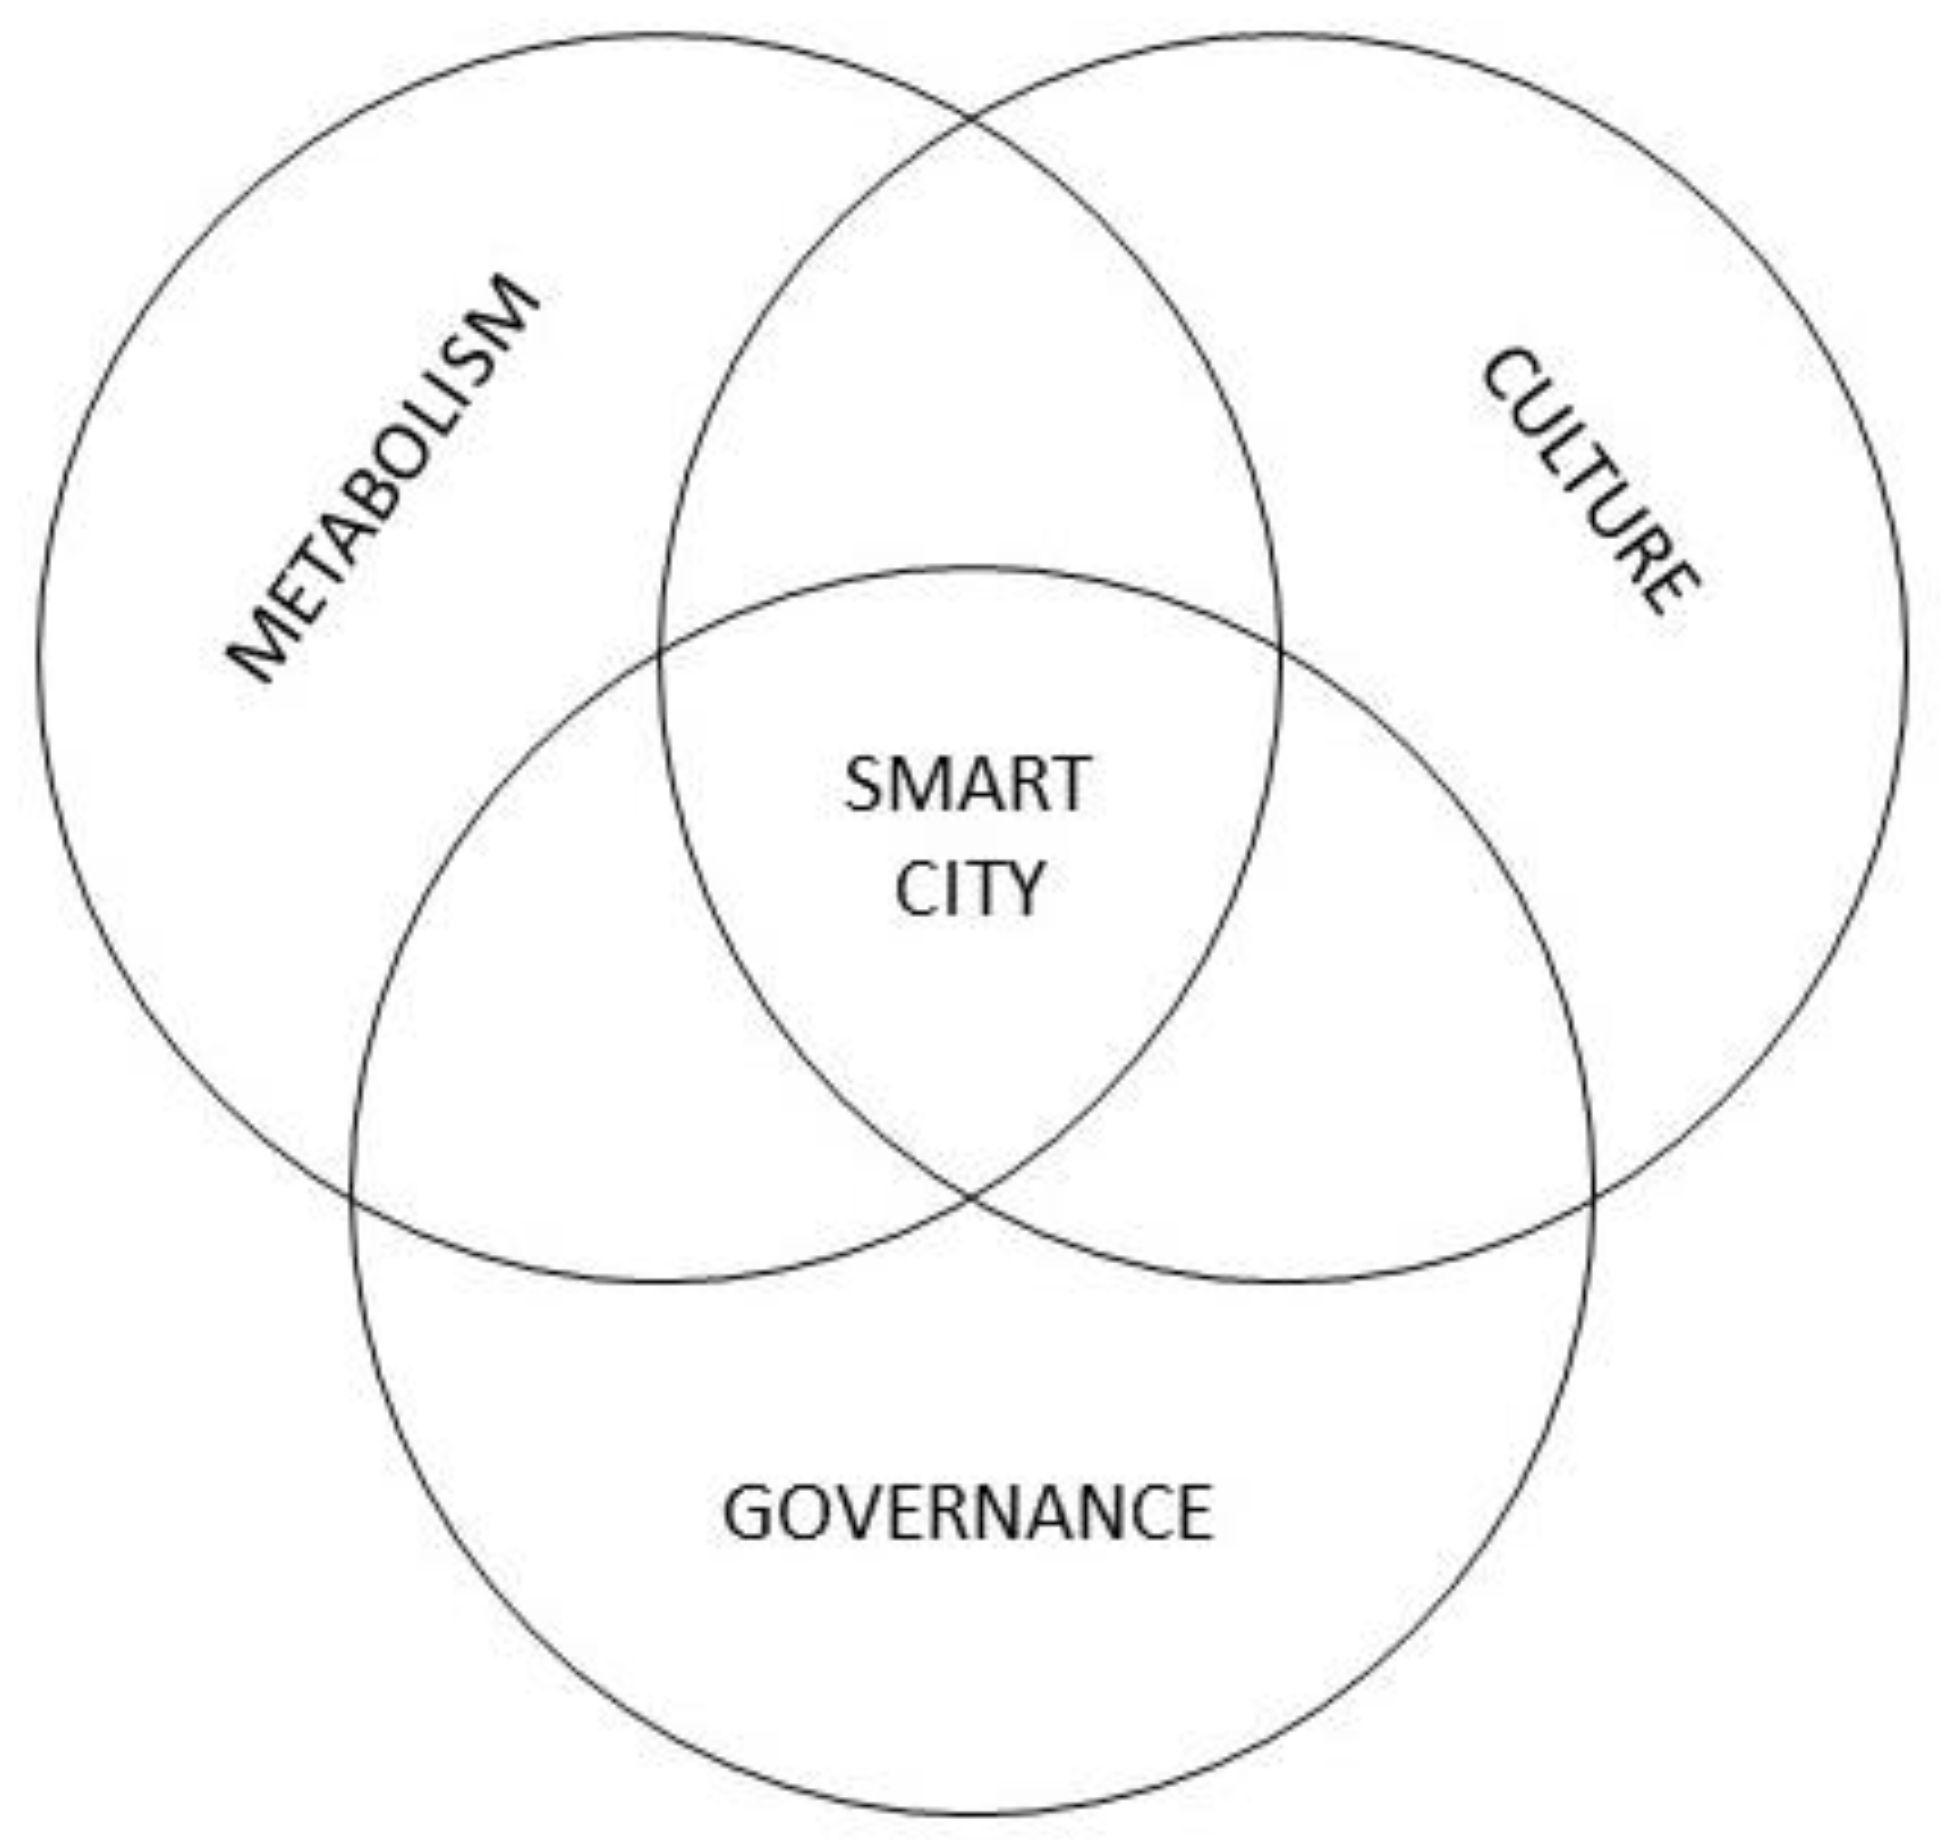
3.1. Six Dimensions for Smart Urban Regeneration
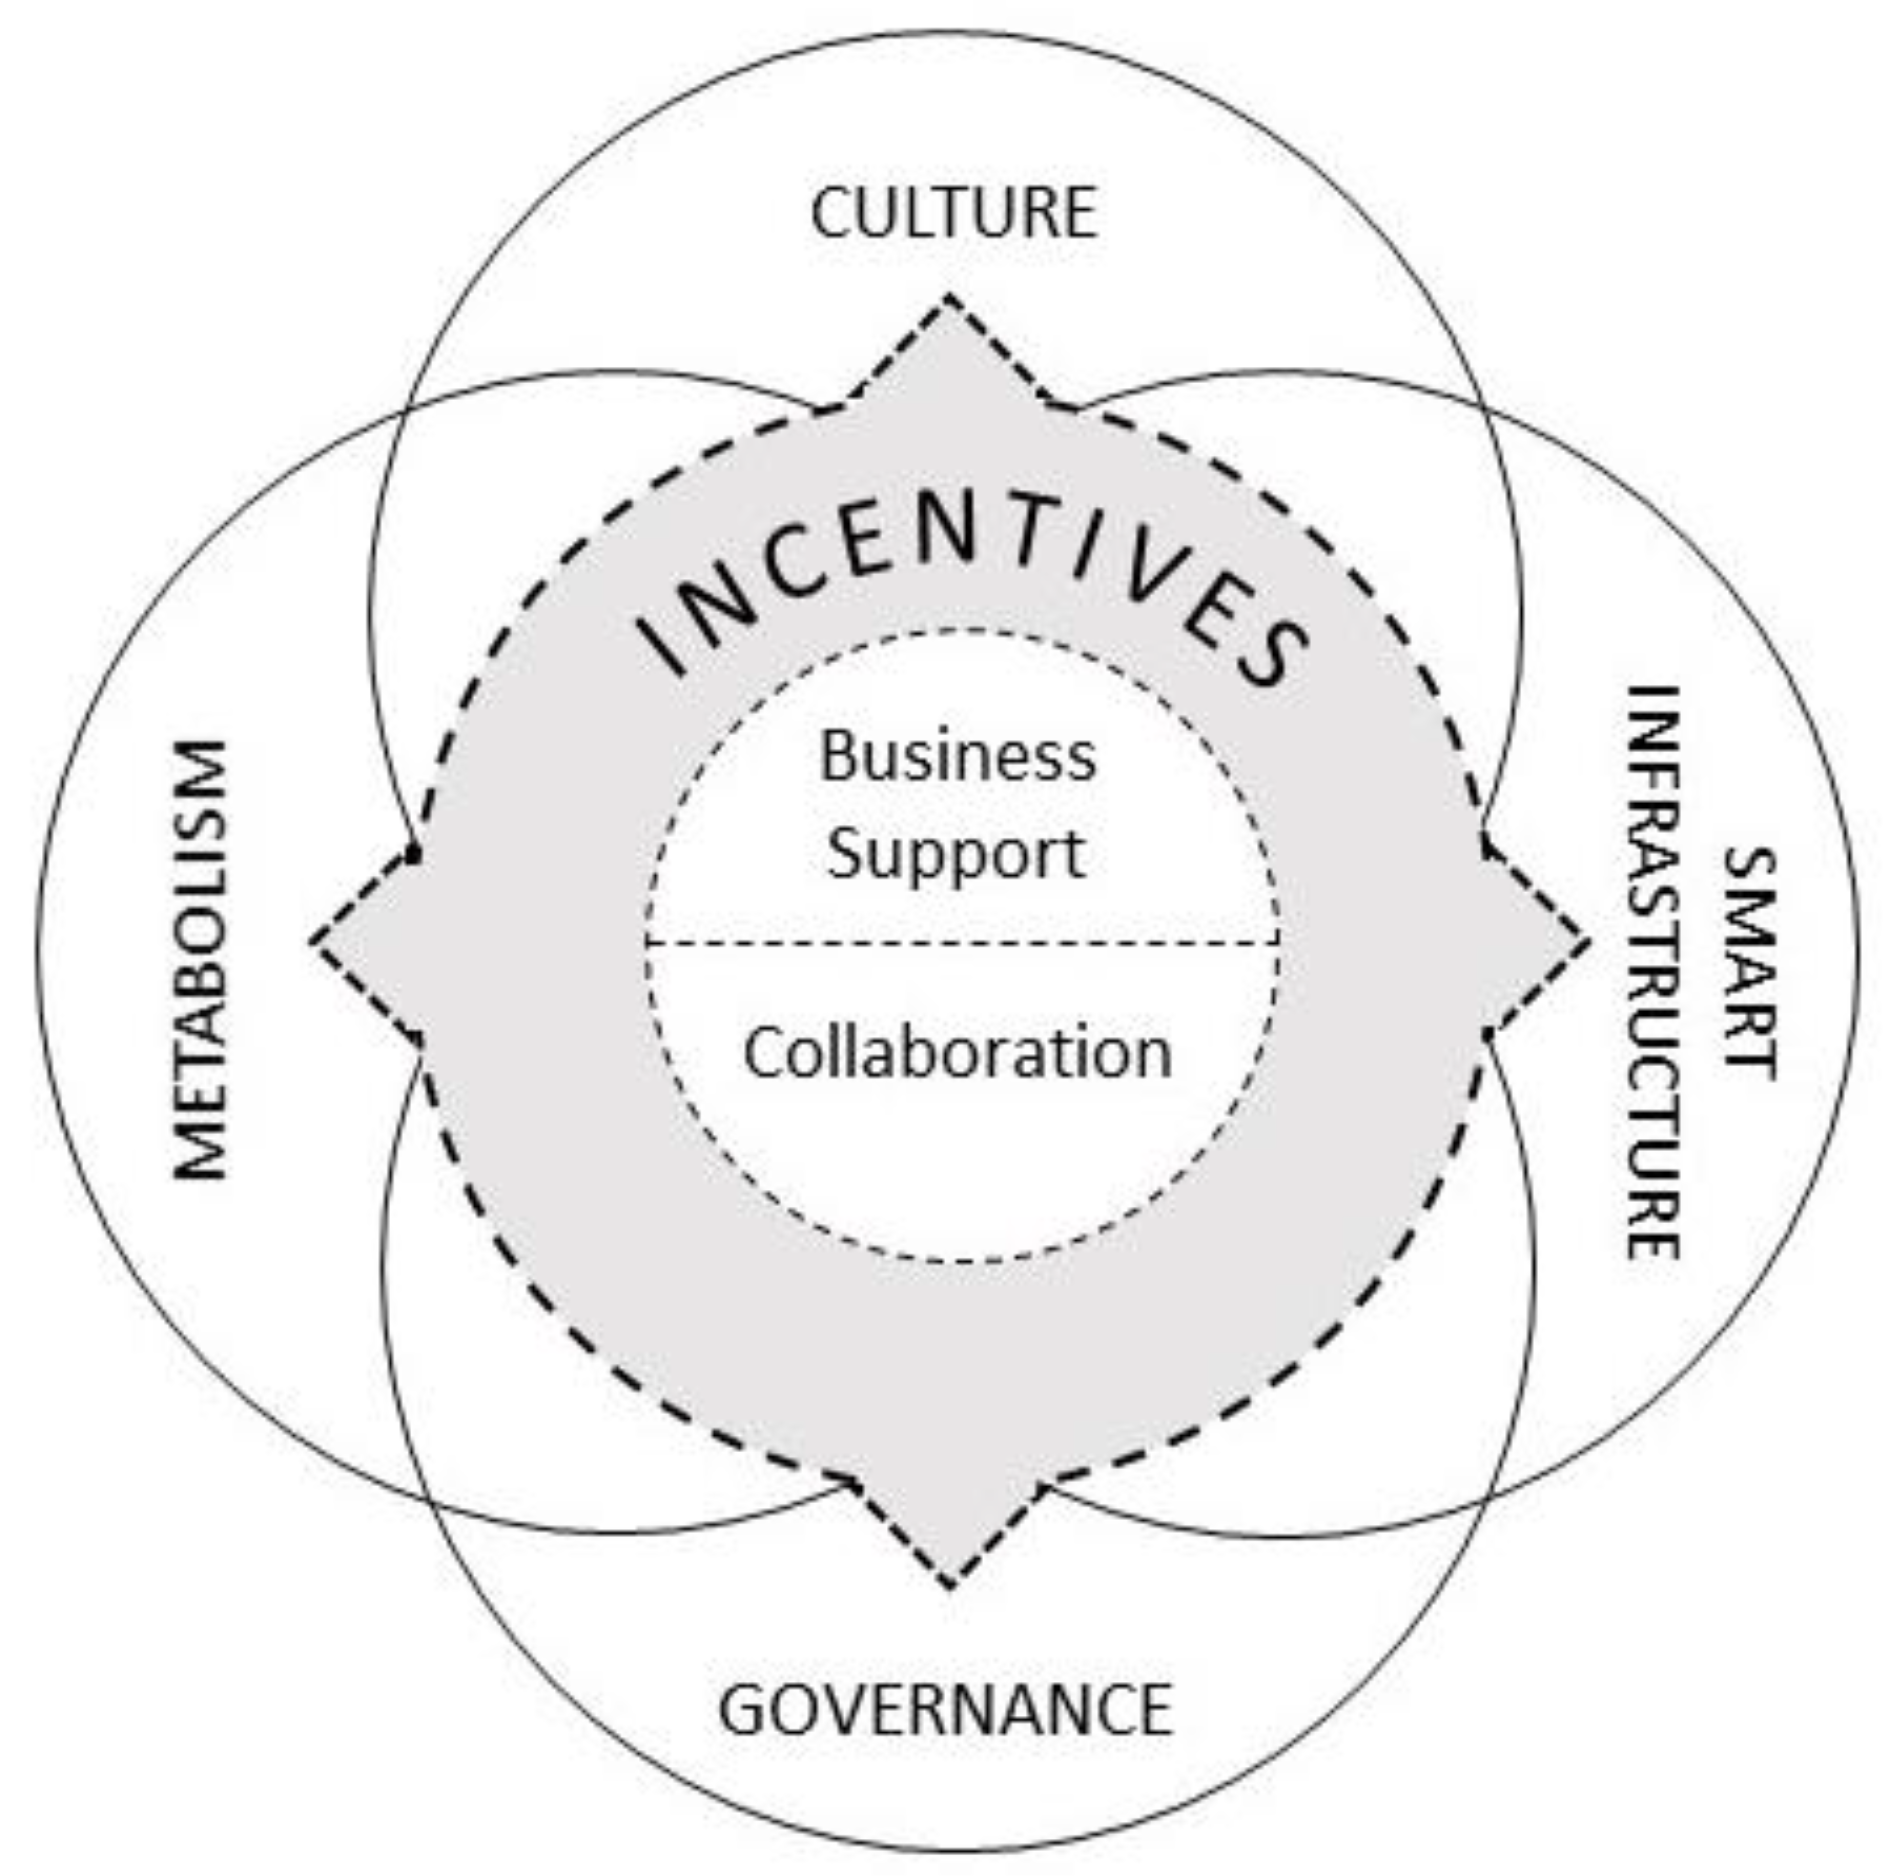
The focus group consisted of 31 participants from both the public and private sector employing approximately 24,388 people, where 52% work in the city and 73% transit through the city of Port Louis at least once per day. The group provided six dimensions for how smart city technologies and approaches could be directed towards new outcomes that could assist urban regeneration; the results were detailed in Allam [9]. The six dimensions are: (1) business support; (2) smart infrastructure; (3) governance; (4) metabolism; (5) collaboration; and culture. Figure 2 illustrates the six dimensions in their order of prevalence from the focus group discussion.

3.2. Incentives

The focus group highlighted the importance of fiscal incentives as a policy tool for economic regeneration and a business catalyst. Tax incentives are well documented through Special Economic Zones (SEZs) in various parts of the world and have been proven to attract investment and create jobs [11,12,13]. Moreover, the rapid regenerative growth can be an attractor for global entrepreneurs who are looking to take advantage of the fiscal incentives offered by government, as this adds a component of trust [14]. Global entrepreneurs have been taking advantage of the liberal tax incentives offered by the government to set up world-class units in these special zones to service the international markets [11]. In Mauritius, fiscal incentives are applicable for smart cities and the freeport, but not for urban regeneration projects, or development in existing cities like Port Louis.

3.2.1. Smart Cities

Through the National Budget of 2014, the Government of Mauritius announced the creation of a series of smart cities. Those were set with a potential to catalyse over USD 3.5 billions in investment during the following years [15]. The strategy was aimed at boosting socio-economic development of the island [16]. Such a project had typical objectives of upgrading the quality of life through innovative practices and implementation of new technologies, but it was directed at greenfields sites. Allam and Newman [10] highlighted nine smart cities on the edges of Port Louis following a modernist New Town tradition. A series of fiscal incentives, showcased in Table 1, were applicable to encourage the investment in smart city projects.

3.2.2. Freeport

Within the last two decades, several major projects, under the aegis of the Mauritius Ports Authority [17], came to light including the creation of over 100 hectares of land through reclamation works and the creation of the Mauritius Freeport Sector [17]. This promoted Mauritius (and Port Louis) as a hub for international trade, where several fiscal incentives are proposed for companies seeking state of the art facilities for storage, assembly and redistribution [18]. Table 2 highlights the various incentives as applicable to port activities.
Such incentives are backed by six main regional and international trade agreements such as: (i) the Common Market of Eastern and Southern Africa (COMESA); (ii) the Southern African Development Community (SADC); (iii) African Caribbean and Pacific (ACP)-Cotonou agreement; (iv) African Growth and Opportunity Act (AGOA); (v) Indian Ocean Commission (IOC); and (vi) Indian Ocean Rim Association for Regional Cooperation (IOR-ARC). These agreements consolidate commercial power of the Mauritian port and promote the concept of a worldwide free trade zone where trade occurs between economic blocks instead of individual countries [18]. Within such clearly-defined and well-oiled trade boundaries, the port area of Port Louis celebrates a highly efficient and business-friendly zone. This efficiency is also defined in terms of year-round 24-h logistics, emergency and security services, including value-added amenities for cargo handling [18]. However, it did not extend into the main urban area of Port Louis where urban regeneration is needed.
The bunkering sector, as part of the port, is being hailed as a potential candidate for an extra economic pillar for Mauritius [19]. This aligns with the government’s Vision 2030, which aims at promoting the island as a petroleum and bunkering hub. A new framework offers several incentives to this end: (i) facilities for private entities to import their own products; (ii) exemption of excise duty, value-added tax and specific levy for bunker fuels; and (iii) discounts on port and ancillary fees together with facilities to carry out secondary activities such as crew changing [19]. These incentives have resulted in a 60% growth in importation of bunker fuels from 2014–2017 [19]. This is also not helping the old urban areas of Port Louis.

3.3. Opportunities for Urban Regeneration

Urban regeneration is the opposite of what has happened in smart cities in Mauritius. It is based on steel and glass high rise towers that sit in a landscape that is totally car dependent and not very walkable across the precinct. Such development is not appropriate for the old city of Port Louis, which has many historic buildings and precincts [20,21]. This paper is trying to determine how smart city technologies and approaches could be used to fit into the old urban fabric and enable it to be restored and regenerated rather than being redeveloped in modernist architecture.
Allam [9] underlines two major policies that are sought to negate modernist urban re-development in the old part of Port Louis, but which could become the basis for smart city regeneration: the buffer zone of the Aapravasi Ghat [22], and the Landlord and Tenant Act [23].

3.3.1. Aapravasi Ghat Buffer Zone

Located on the harbour front, the Aapravasi Ghat Immigration Depot (Figure 3) marks the site of arrival of over 500,000 indentured labourers, after the abolition of slavery, between 1834 and 1920. The mass migration was part of the British ‘Great Experiment’ and was later replicated in other British colonies around the world [24]. The site was inscribed as part of UNESCO World Heritage in 2006 and only measures 1640 m2, while its buffer zone amounts to 289,000 m2. The buffer zone of the Aapravasi Ghat, commonly known as Buffer Zone 2 [22], is illustrated in Figure 12.
The buffer zone area is part of a very old historic district including World Heritage sites where little development has been attracted to help restore some of the highest value heritage buildings in the world as showcased in Section 3.3.2. The area is a major urban regeneration opportunity. However, the area is not attracting investment as business is scared off by powerful heritage-based regulations.
Development in the Aapravasi Ghat buffer zones is bound by strict regulations underlined in the Planning Policy Guidelines 6 [22], which was set to preserve the unique architectural language and the rich cultural and historic nature of the place. However, there have been numerous complaints by landowners that the imposed regulations are not conducive to profitable business models due to strict height restrictions [22,24], mainly limited to two-storey building fronts [22]. While, traditionally, real estate by the waterfront had substantial value [26], property falling in the Aapravasi Ghat zone is deemed undesirable for development [27] due to regulations that negate development [28].
With this backdrop, buildings on the waterfront face decay as owners face restrictions of a two-storey building height; thus, owners lose interest in renovating their assets as return on investment is deemed lengthy without an optimal site usage.
The purpose of this paper is to show that a new approach can be taken that brings heritage regeneration into a smart city framework and enables areas where development is restricted, like UNESCO World Heritage Sites, to be restored, thus saving the buildings, as well as enabling significant new investment in new buildings that are complementary to the heritage qualities of the old urban fabric.

3.3.2. Landlord and Tenant Act

The Landlord and Tenant Act was enforced after the devastating Carol Cyclone of 1960, which with wind gusts of 280 km/h, destroyed over 70,000 homes and rendered a death toll of 42 [29]. Figure 4 illustrates the impacts of Carol Cyclone. The act was enforced to ensure that landowners do not take advantage of the devastating situation in the form of a drastic rise in price rentals. It thus ensures a steady rental rise, under current market rates [23].
Driven by the tenant lobby, a moratorium was enacted on the Landlord and Tenant Act to prevent rental price rise. The moratorium expiration was set to expire in 2005, but with a strong tenant lobby, the Government extended the moratorium in 2017 for another three years, till 2020 [31].
The rental price of property has thus been frozen since 1962 [32] in Mauritius, where tenants enjoy a price equivalent to USD 3–15 in the city centre [33], protected from eviction, as outlined in the Act. This policy thus impacts negatively on landowners and on the property market in Mauritius. There have been reports that highlight how Mauritian policies favour tenants over land owners [34].
This renders an environment where building owners cannot afford to renovate their building and prefer to leave it in a state of decay until tenants are forced to leave [28]. Following this, there have been numerous cases where landowners have waited for their building to crumble to demolish the site in favour of paid open-air parking, which is more profitable than a building [5]. Planning professionals believe that the Landlord and Tenant Act has been negatively impacting Port Louis over the last 50 years [3].
However, the lack of development, encouraged by both the Landlord and Tenant Act and the restrictions tied to Buffer Zone 2, is celebrated by some as the area retained its identity [5]. This has contributed to a rise in cultural and tourism attractivity due to historic buildings in the old fabric such as the Central Market (Figure 5), Port Louis Theatre (Figure 6), the Granary (Figure 7) and the Old Military Hospital (Figure 8), amongst others.
While some sites received government funding for restoration, Allam [38] suggests that renovation alone is not sufficient as buildings remain closed and access to city users voided. They are not going to be saved in the long run unless a significant economic activity is found to provide on-going maintenance. On the other hand, there have been a number of commendable project proposals by the private sector at those public sites aimed at protecting the cultural attributes while celebrating a financially-profitable diversity of use [3,5]. However, none came to fruition due to the lack of adequate frameworks providing attractive return to developers. Perhaps a new attempt using new technology and approaches from the smart city collection can enable such important sites to be regenerated.
It should be possible to construct a framework for urban regeneration that enables both heritage protection and urban regeneration to make the most of this area; thus, the next section suggests a possible framework.

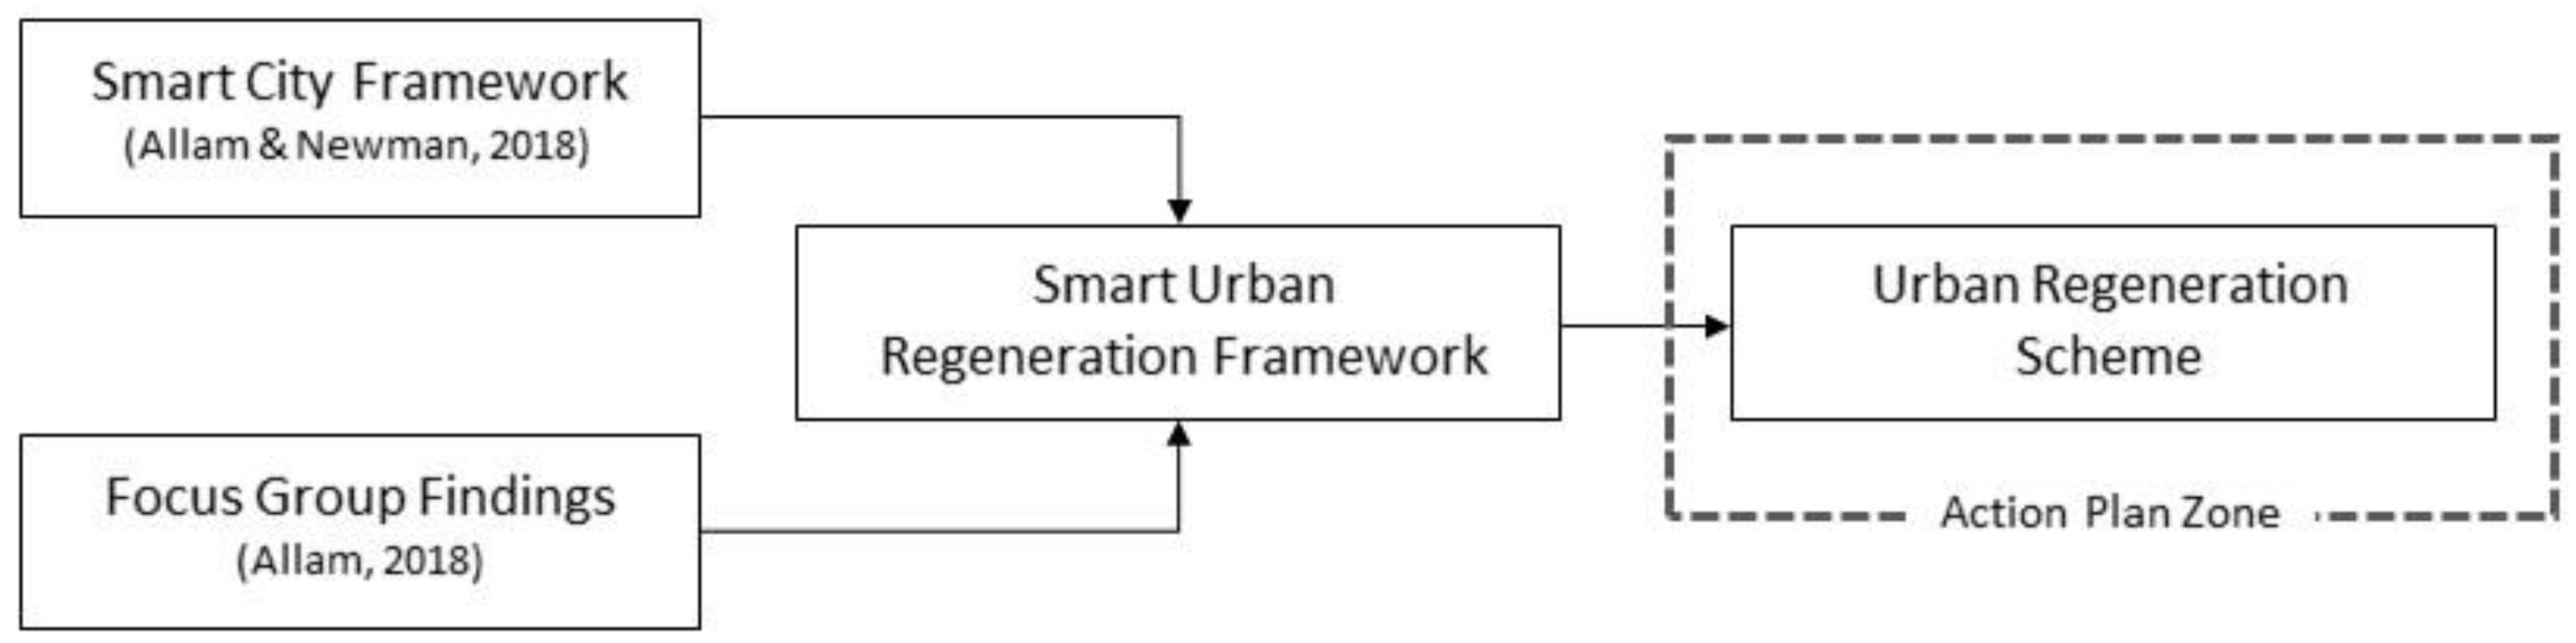
4. The Smart Urban Regeneration Framework

Building from prior research by Allam and Newman [10] and Allam [39], the smart city framework is used in this study to show how it can be applied to urban regeneration of an old city. Allam and Newman [10] underlined the three key dimensions when applying smart cities ideas to an existing city: culture, metabolism and governance. Figure 9 showcases the smart city framework. However, the focus group extended this in two other desired dimensions to promote an inclusive urban regenerative process (Figure 10), which provided incentives for the potential change in urban development priorities. The context of Mauritius is one where business has a history of supporting fiscal incentives as a catalyst tool for development [15,16,18]. A smart urban regeneration framework (Figure 10) is proposed where incentives are calibrated to regroup both the dimensions of business support and collaboration and further implemented to target the dimensions of governance, culture, metabolism and smart infrastructure to provide a smart city not simply with ICT alone in a kind of trickle down system of urban development. It is proposed that the two dimensions of business support and collaboration are coded as part of a proposed package of incentives and then applied to specific areas of the four dimensions of culture, smart infrastructure, governance and metabolism.

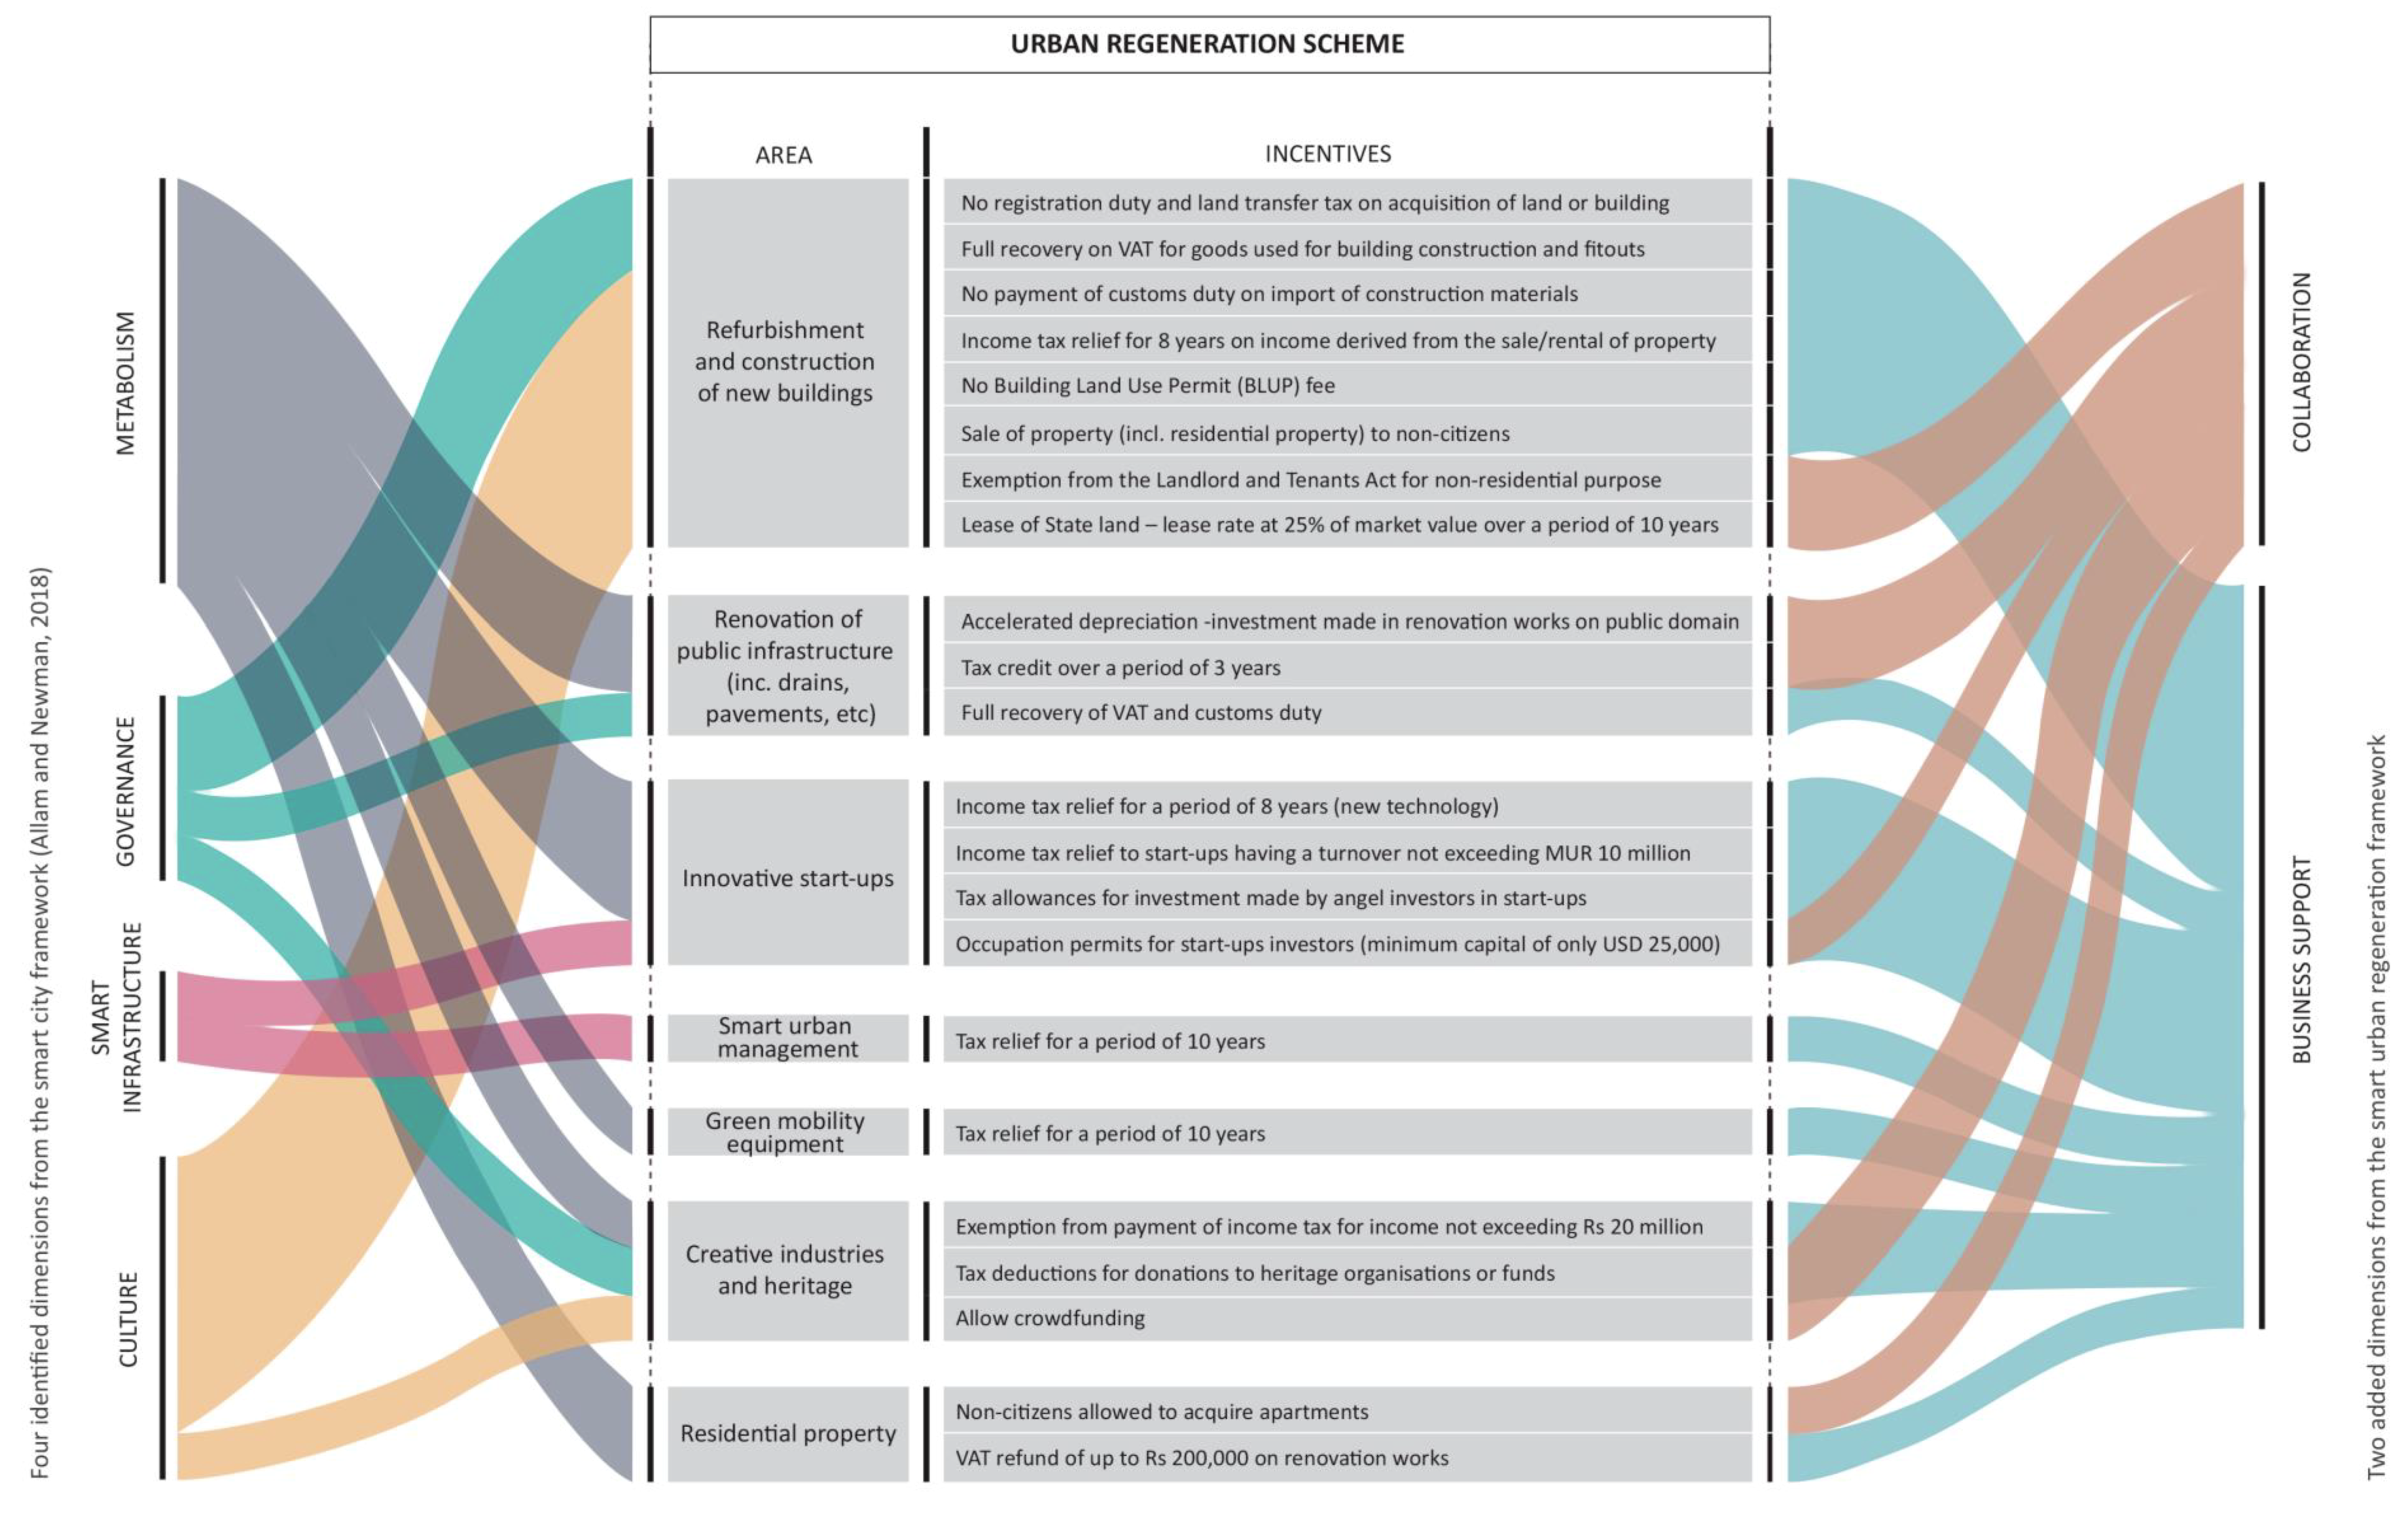
5. The Urban Regeneration Scheme

A URS proposed for Port Louis is designed to follow and deliver the smart urban regeneration framework based on key areas identified by the focus group and summarised in Allam [9]. Figure 11 illustrates the URS and its linkages to the six dimensions of the extended smart framework.

Action Plan Zone

To ensure the densification and urban regeneration of the urban fabric to create a healthier economy in the old quarter, an APZ is proposed where fiscal incentives shall be applicable. Findings from the focus group, as outlined by Allam [9], supported that the APZ should be limited to the Central Business District (CBD) of Port Louis. While there is no official designated boundary for the CBD, the Port Louis Outline Scheme [40] defines a ‘Core Zone’ as showcased in Figure 12 below. However, the Core Zone does not include part of the waterfront and the heritage district, which falls under the Planning Policy Guidelines 6 [22], as part of Buffer Zone 2 of the Aapravasi Ghat, as outlined above. For ease of interpretation, adoption and future possible integration in Mauritian legislations, the APZ is defined by the boundaries of the Core Zone coupled with that of Buffer Zone 2.
Thus, the smart urban regeneration model is delivered by an urban regeneration scheme (using planning and economic tools) and is applied to the APZ. The next sections set out how they use smart city technologies and processes.

6. Application of the Smart Urban Regeneration Model to the Action Plan Zone

The smart urban regeneration model aims to help bring life back to the area in Figure 12. It hopes to improve culture, metabolism and governance.

6.1. Smart Infrastructure

In relation to smart infrastructure, the prime focus is aimed not only at making the old quarter of Port Louis a tech-savvy area in terms of Information Technology (IT) industries, but also moving towards state of the art smart city processes. Carter [41] proposed three main focus areas for the processes behind an ICT-driven urban regeneration, based on being inclusive, innovative and sustainable:
(a)
Digital inclusion: to not only increase access to ICT, but also to popularize and promote ICT knowledge. Such a theme is being proposed in the URS and APZ where knowledge transfer from foreigners to locals is being highly incentivised.
(b)
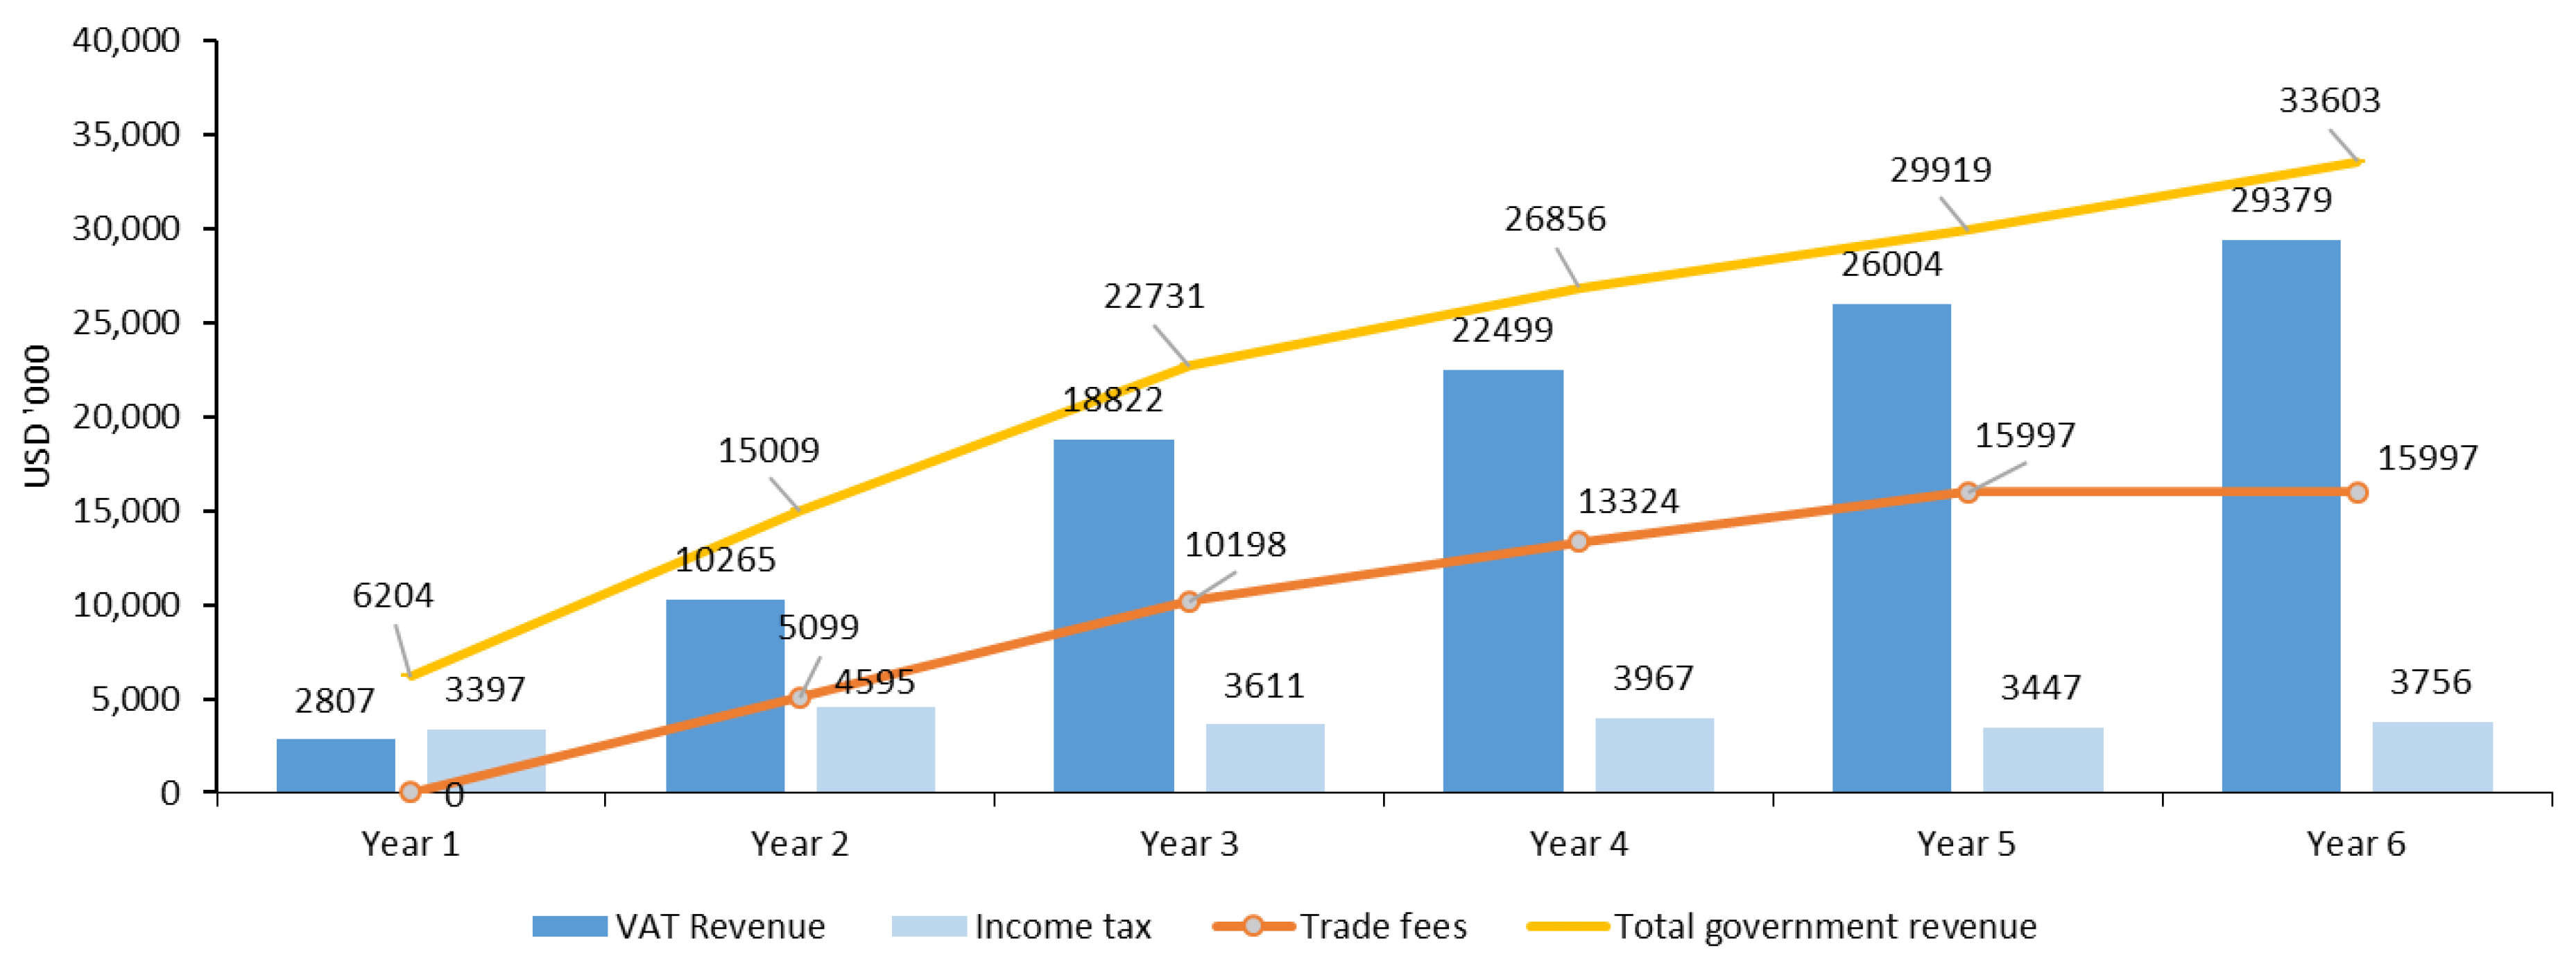
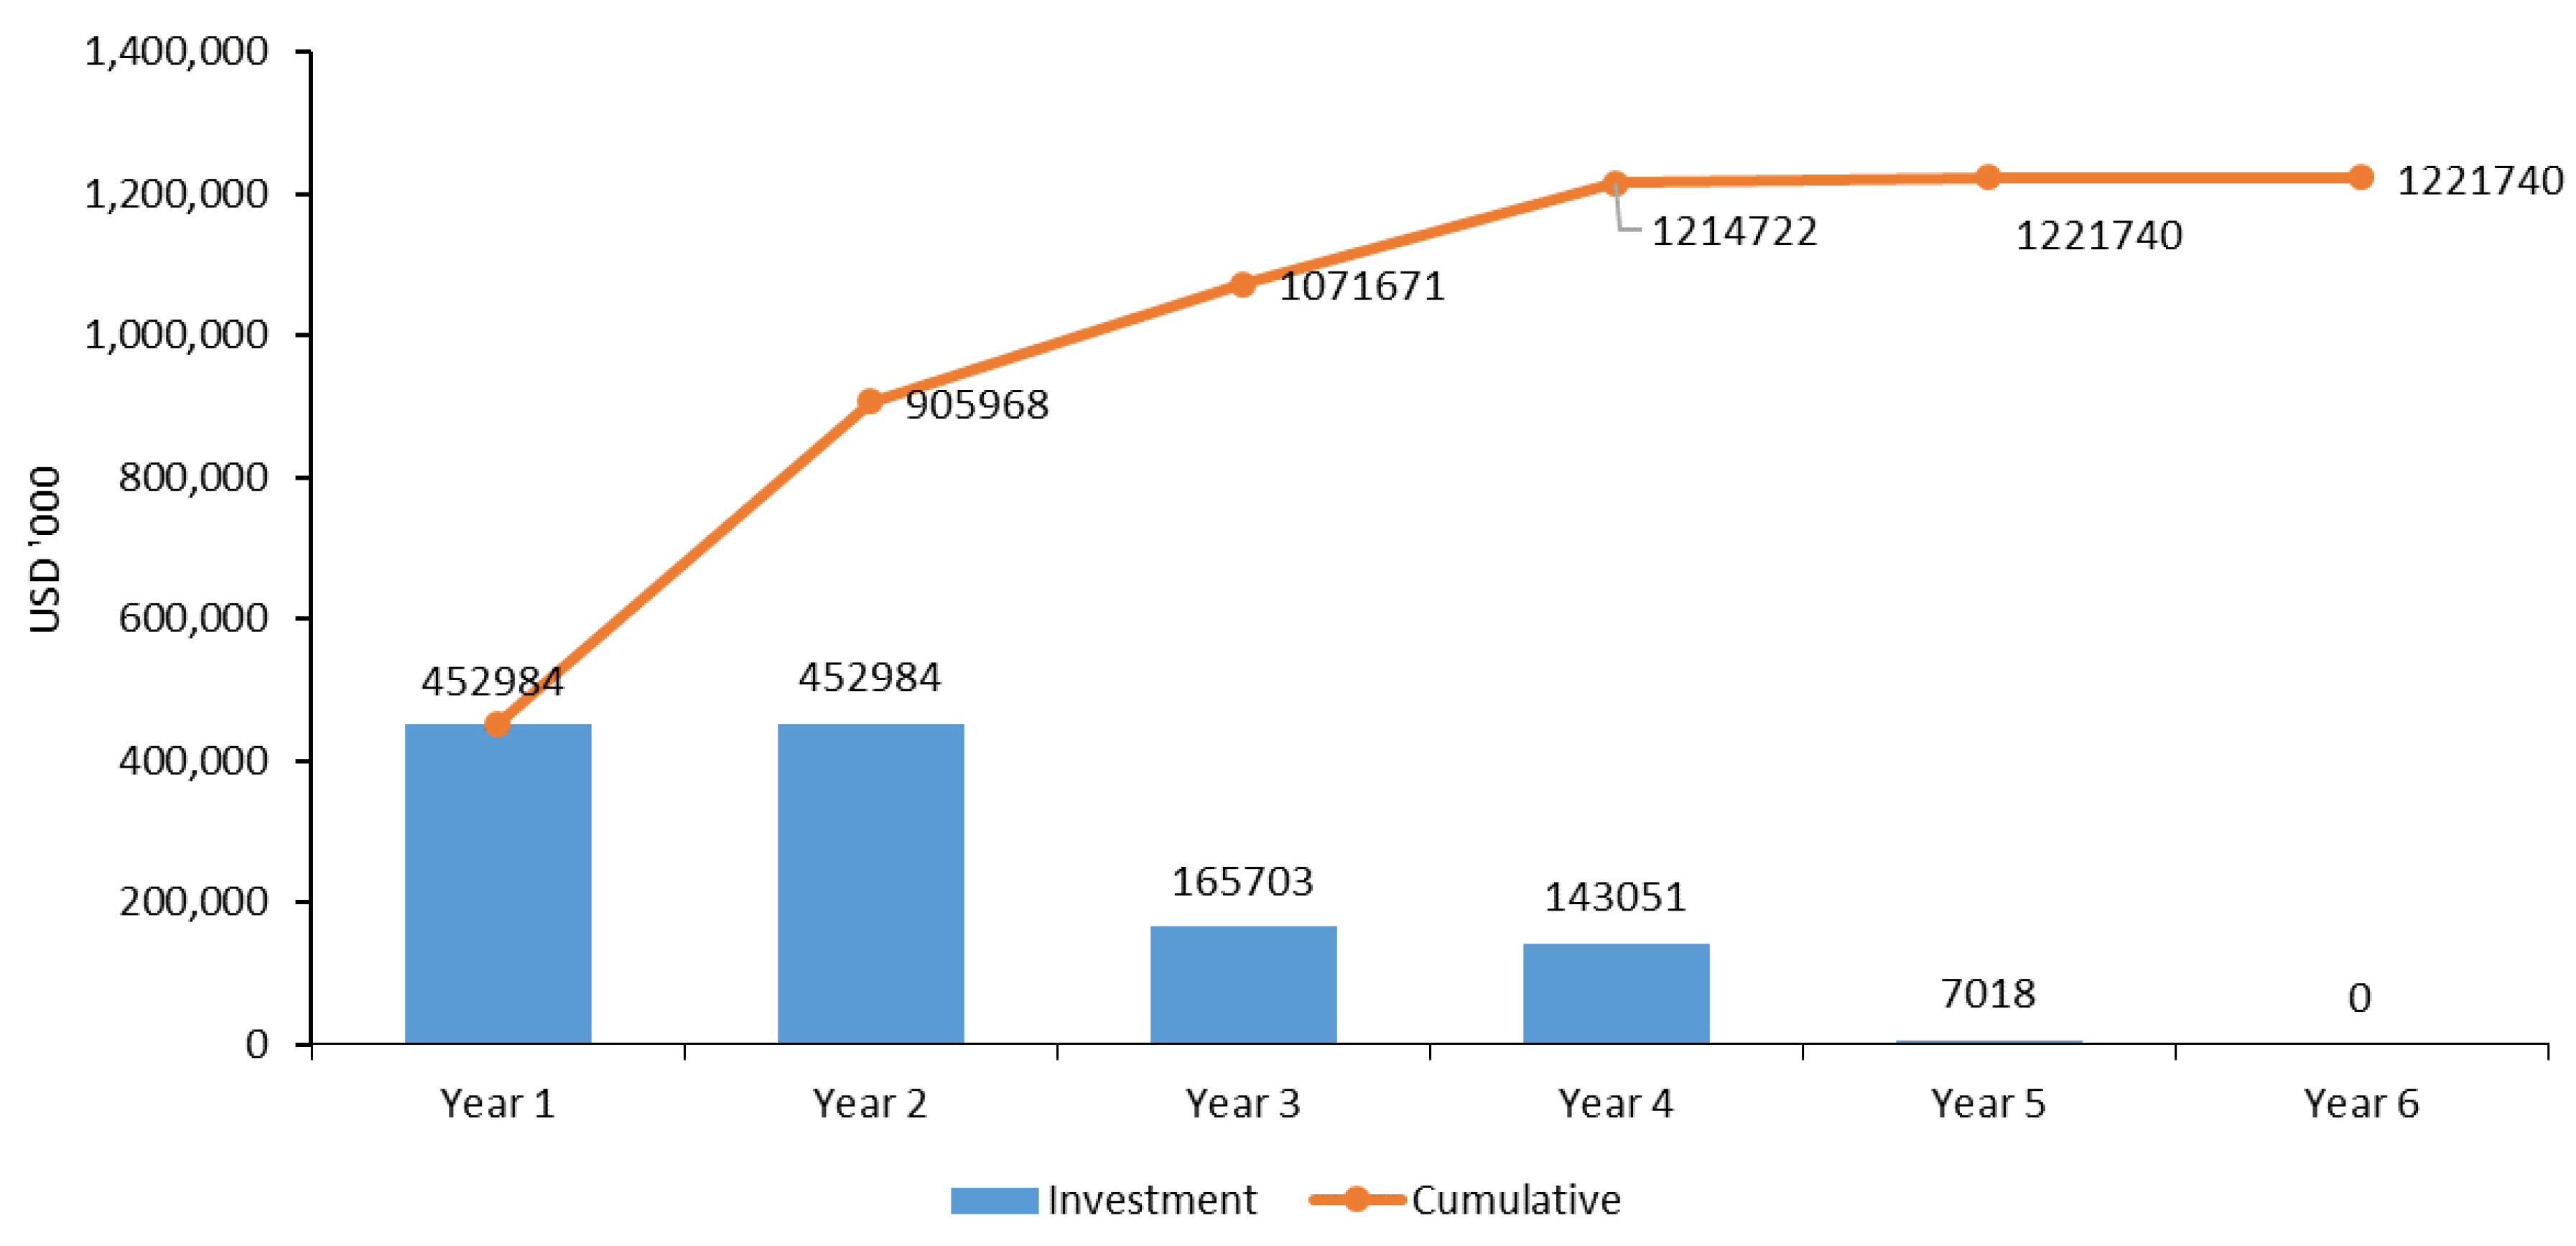
Digital industries: to build upon the highly effective energy and communication grids of Port Louis to lead as a community of digital industries. This requires consequential financial input, which is predicted to be generated within the first few years of adopting the URS (Figure 13, Figure 14, Figure 15, Figure 16 and Figure 17).
(c)
Digital innovation: to promote a smart approach to all facets of city life including the governance and cultural aspects outlined below, as well as the metabolism aspects of transport, energy, water, waste management, as well as governance issues such as disaster monitoring and control within a safe, resilient and sustainable environment.
This will promote better management of resources and solving parking and transportation issues in Port Louis [9,42]. For example, it is possible to use new public transport systems like the Trackless Tram with local shared mobility systems [43,44,45]. The literature points out the essential role that IT can play in regenerating and even increasing competitiveness and business attractiveness for a city [41,46,47]. Fiscal incentives have been provided in the URS that encourage innovation through ICT along with smart management solutions. Moreover, digital infrastructure as showcased by Allam and Newman [10] can be an enabler of other urban dimensions that aim at economic, sustainable and cultural regeneration.

6.2. Culture

UNESCO [48] extols the potential of culture-led urban rejuvenation through several key entry points of all of the 17 SDGs (Sustainable Development Goals). Culture is at the core of urban rejuvenation [48]. Old city urban fabric has the structural appeal necessary for cultural heritage due to its architectural character and history [49].
In terms of built heritage in Port Louis, the low rental price due to the Landlord and Tenant Act is one aspect of the business environment that has been an administrative dilemma for the governing bodies [31]. To cater to this, the URS provides for an exemption from the Landlord and Tenant Act in the APZ. An increase in property rents in the heritage district will provide for a better income flow for the restoration of buildings having a rich cultural significance. Emerging cities have long been struggling to balance out economic development and sustainability [50], but culture can bridge the gap between these two dimensions or city regeneration [51]. Bertacchini and Re [52] highlighted the laudable potential of culture-led regeneration of Port Louis through its urban heritage. These authors postulated that the capital city of Mauritius can adopt local economic development planning to tap into the rich economic potential of cultural and urban heritage. It is further highlighted that such an approach merges well with both top-down and community-based development strategies.
Moreover, the URS caters to setting up creative and cultural industries, which is expected to be a highly consequential economic contributor [51]. A report by EY [53] supports this claim by showing that the sales of digital cultural goods exceeds that of physical cultural goods, thus showing the economic potential of infusing culture with IT, while touching on a much wider audience. This expands culture to the creative cultural industries, an industry worth USD 2.3 trillions in revenue per year, and 29.5 million jobs worldwide.
In addition, the provision for crowdfunding, previously restricted in Mauritius as part of the ‘Public Collection Act’, will encourage artists to source funding from the public to support their activities. Such an approach will promote liveability and liveliness in the city of Port Louis. Three such artistic events have already been trialled with outstanding success by the ‘Porlwi organisation through their three events: Porlwi by Night, Porlwi by Light and Porlwi by Nature [54]. The smart urban regeneration framework proposes to bridge the gap between economic development and sustainability by focusing also on green industries and a rigorous control of urban metabolism, all aimed at promoting the liveability within the boundaries of Port Louis.

6.3. Metabolism

Grafting of ICT within development projects associated with solar energy, water and energy efficiency, shared battery systems and shared Electic Vehicles -Automatic Vehicles mobility systems can now make new urban development fit within the structures of the old quarter [55,56]. Such ICT includes block chain software for shared services, sensors for monitoring consumption and systems’ control for managing flows of resources. This can also promote better management of the city’s resources [57] and enable lower cost energy, water, waste and transport services, i.e., higher liveability. This will be particularly important as one hallmark dimension of a smart city is enhanced liveability, which is closely associated with the sustainability of the city [58,59]. Allam [39] highlights that this is achievable through understanding of urban metabolism for Port Louis.
The URS further calls for refurbishment and construction of new buildings, renovation of public infrastructure while promoting green mobility (Figure 11). These major projects will bring economic growth and are thus expected to increase the flow of materials within the APZ of Port Louis; this input, from a metabolism perspective, must not undermine the call for sustainability, so demonstrating low metabolism through ICT support will be high on the agenda for business, government and the community. To such an end, there is a need to integrate social, health and economic indicators into the scheme for urban regeneration as proposed by Kennedy et al. [60]. Moreover, it is essential to consider the impact of materials’ flow on the ecological economic system of Port Louis. An assessment of energy needs to be included, as well as a circular pattern of urban metabolism within a sustainable milieu [61]. Newman’s extended metabolism model proposes a thorough study of the dynamics of settlements in terms of transport, economic and cultural priorities [45,62]. Further to this, Shahrokni, et al. [63] called for integration of ‘smart urban metabolism’, which offers higher resolution as citizens and city officials can get feedback on their choices.
The transport and economic drivers, as being proposed in this URS, require adequate infrastructure and governance systems [45]. This highlights the need for a rigorous governance guideline for the whole redevelopment process [64,65,66,67]. Furthermore, the URS also caters to housing units in the city, which is expected to reduce vehicular transportation, as people shall live and work in the same place [68,69]. Overall, the URS is expected to promote sustainable development while increasing liveability, but the core of such a feat lies within proper governance.

6.4. Governance

The application of the urban regeneration scheme in an APZ will need its own delivery authority to enable all factors to be brought together. A good example of such an authority is the Barangaroo Delivery Authority (BDA) in Sydney, which enabled the regeneration of an old port area adjacent to the Sydney CBD. It was structured to provide full representation from community and private interests, as well as government and was phased out once completed [70,71]. The BDA was able to achieve a very low metabolism set of buildings along with a strong cultural tourism outcome. For the case of Port Louis, the authority eligible to pilot such an initiative could be the Economic Development Board (EDB), a parastatal entity, which pilots the Mauritian Smart Cities Initiative.
The other governance feature is how to manage the on-going metabolism of the area. Old city urban fabrics have governance structures of low metabolism due to their density and walkability, as well as their transit-friendly opportunities [72]. By combining with ICT, like smart urban management and smart mobility solutions, it can be even better.
The URS promotes key incentives for enhanced investment in renovating public amenities while opening a conspicuous business environment for stakeholders to explore avenues for smart urban management. These core events are expected to create a rebranding of Port Louis from a classically-managed municipality to a smartly managed modern city. For this study, the concept of governance follows Stoker’s definition of “a complex set of institutions and actors that are drawn from and also beyond government” [73]. This aligns with the study’s aims in terms of private-public partnerships for revamping Port Louis. The literature, however, warns about the potential issue of urban policy reflecting guidelines of business elites [65,74]. To avoid this ambiguity, the study suggests a regime governance approach that involves a clearly-defined form of collaborative politics [65]. In this type of governance, participants include all stakeholders of the city showcased within the hallmark dimensions of voluntary cooperation based on trust and diplomacy [65]. Moreover, such a governance approach is growth-centred and offers a synergistic cooperation between public and private bodies, which Davies [65] postulated as being able to “achieve otherwise unattainable goals”.
This kind of governance approach is facilitated by new smart city technologies such as block chain. The work of Green and Newman has highlighted how citizen utilities can use the block chain to create local shared systems [75]. This approach can be applied to the whole APZ with an on-going management of the core functions of the area.

7. Quantified Results from the Application of the URS

The basis of the econometric model is provided in Appendix A. It sets out how the Smart Urban Regeneration Framework using an Urban Regeneration Scheme applied to an APZ could result in investment and jobs that would bring the old city of Port Louis to life. The quantification exercise was led by the Port Louis Development Initiative (PLDI) in collaboration with the first author.

7.1. Financial Impact

It is estimated that USD 1.22 billions could be generated from investment as a result of the application of the URS. Figure 13 showcases the yearly estimated investment, as well as the cumulative sum. As it was assumed that projects are to start in the next six months from the adoption of the URS, it was noted that by Year 5, sizeable projects are expected to come to fruition, thus highlighting a decrease in investment.
Public revenue on the other hand is expected to witness an increase as more property space becomes available to host businesses. It is estimated that a total of USD 34 millions could be generated as a result of the URS by Year 6. Figure 14 highlights the yearly and cumulative estimated Value Added Tax [76], income tax and trade fees revenue.

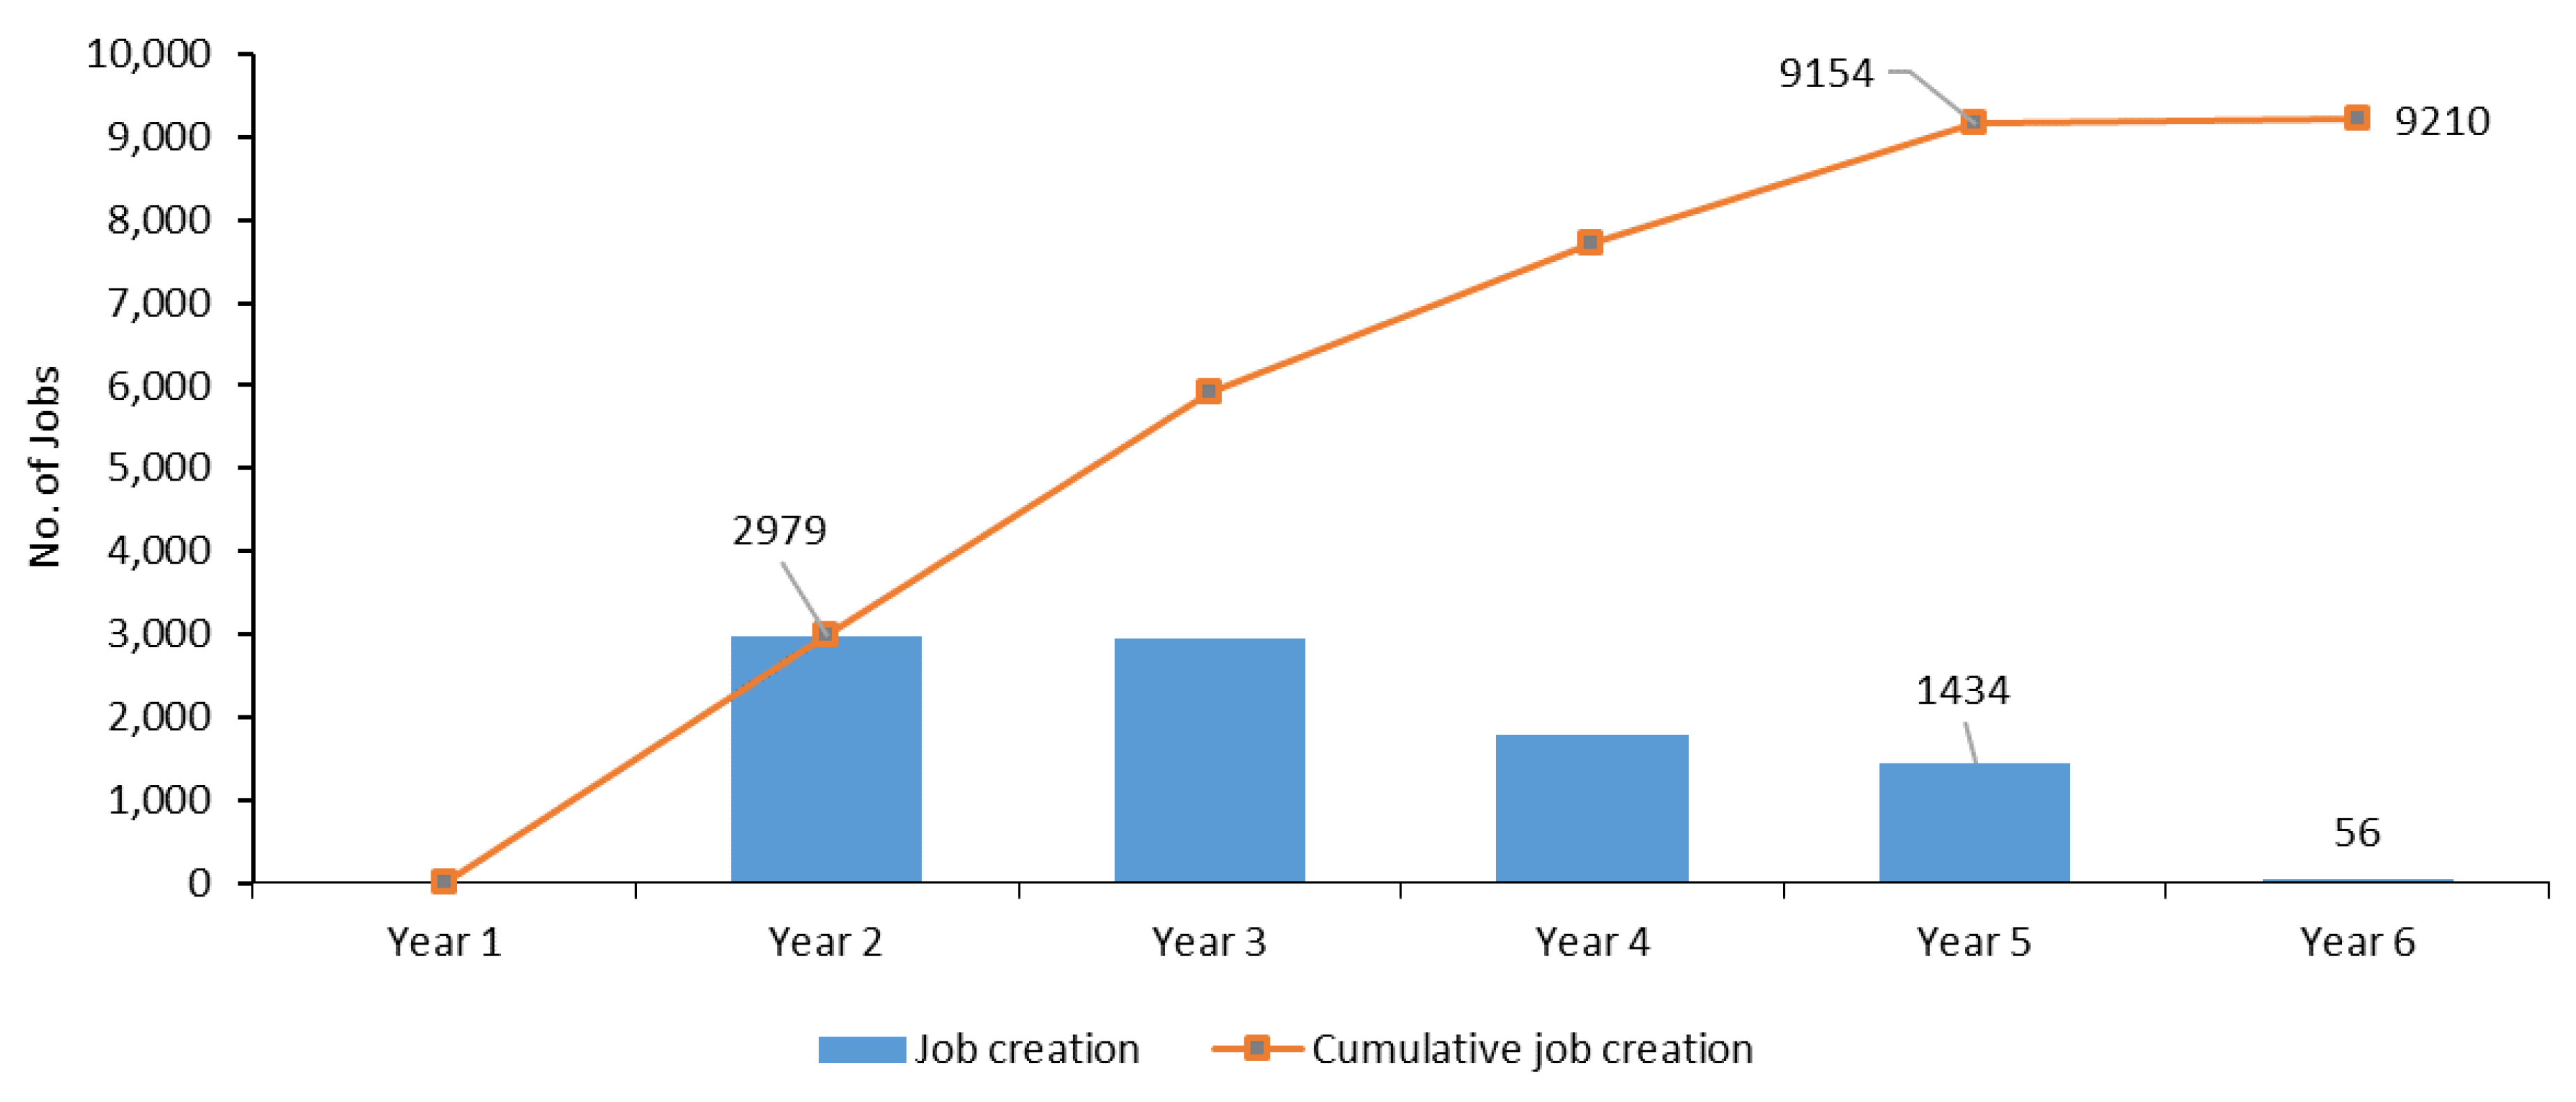
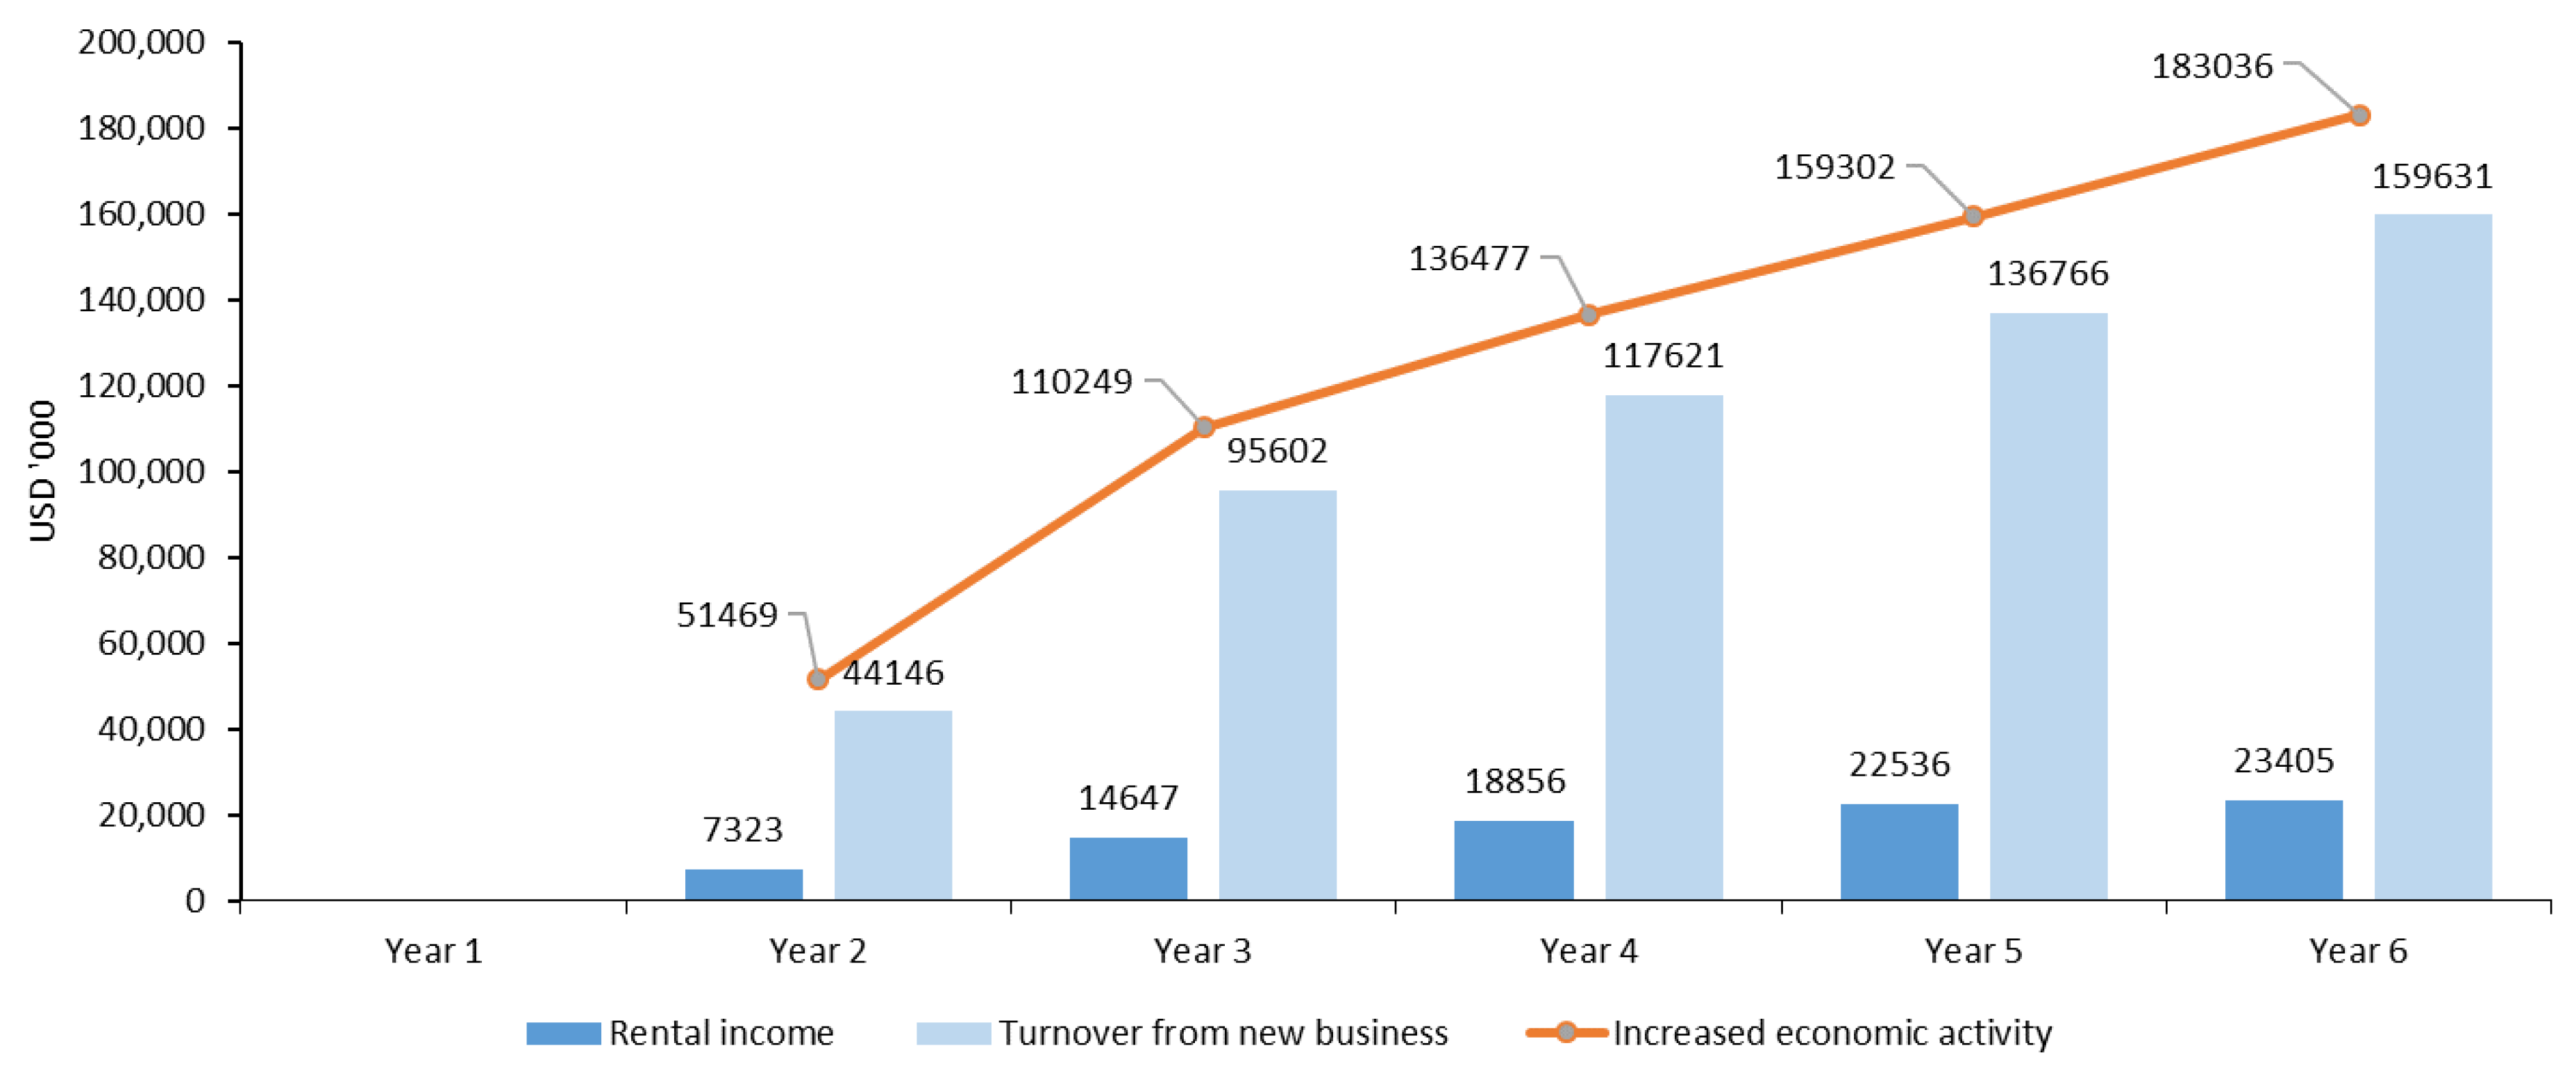
7.2. Business and Jobs’ Creation

A total of USD 184 millions is expected to be generated from new business activities with USD 157 millions as turnover in the six-year period. Figure 15 showcases the rental income, turnover from new businesses and the increased economic activity, both yearly and cumulatively.
Nine thousand two hundred and ten permanent jobs are expected to be created as of Year 6. It is observed that Year 6 results in a low figure and corresponds to a stabilisation of the creation of jobs with the creation of business activities. Figure 16 showcases the job creation by year and cumulatively.
Furthermore, it is expected that 94,588 jobs are to be created for the six-year period during construction periods. It is observed the low figures for Years 5 and 6 correspond to the reduced investment in the same period. Figure 17 showcases the yearly estimated job creation by year.

8. Conclusions

Urban decay is a potential danger faced by many cities that struggle to cope with the calls of economic attractiveness, liveability and sustainability. Port Louis may face a similar fate following the setting up of new, highly incentivised, smart cities in Mauritius in greenfield sites that are impacting on business investment in the old city. Rather than continuing with the old way of managing the old city, this paper has suggested a new way, based on a focus group of important stakeholders, that suggested how the concepts and technologies of the smart city could in fact be applied to the old city and lead to its urban regeneration.
Fiscally incentivising economic development as an urban regeneration tool is well documented in Mauritius [14,17]. However, incentivising to produce outcomes that respect culture, metabolism and governance using smart infrastructure, is new. Some examples were outlined of how this can be done. As such, to ensure a sustainable, smart and inclusive framework for business, culture and people, an urban regeneration scheme based on a smart urban regeneration framework was proposed for revamping the city of Port Louis through fiscal incentives. The urban regeneration scheme is detailed for an APZ in the old part of the capital city of Mauritius.
The expected outcomes of the urban regeneration scheme can be measured through projected investment gains, business and jobs’ creation (as set out in Figure 13, Figure 14, Figure 15, Figure 16 and Figure 17). The resulting impacts, based on econometric models show promising figures for a six-year period following its implementation. An estimated USD 1.22 billions is expected from investments, while USD 34 millions and USD 184 millions are anticipated for public revenue and from new business ventures, respectively. Moreover, 94,588 construction jobs and 9210 permanent jobs could be created in the same six-year period.
Despite such clear cut positive projections, it remains to be dissected how the actual dimensions interact to promote a rejuvenation and revamping of economic activities in Port Louis under a sustainable setup. It is hoped that the framework developed here will provide the catalyst that speeds up urban regeneration in a sustainable way [75].
This study seeks to inform policy makers about the potential of cities to be regenerated in their old urban fabric by the use of smart city technologies and concepts based on outcomes that enable the city to make the most of its benefits in culture, metabolism and governance. The URS proposal for Port Louis was adopted by the Government of Mauritius and expanded at the national level through the National Budget of 2018–2019. Many other cities with old areas in decline could benefit from such an approach.

Author Contributions

Writing, review and editing: Z.A. and P.N.

Funding

This research received no external funding.

Acknowledgments

The authors are grateful for the contribution of an Australian Government Research Training Program Scholarship in supporting this research, and for the Port Louis Development Initiative for providing access to, and permission to share, data for this study.

Conflicts of Interest

The authors declare no conflict of interest.

Appendix A

A.1. The Econometric Model

There are econometric models for measuring the impacts of tax incentive policies [77] in relation to their various contexts. However, there are no specific model that responds, in its entirety, to full set of criteria in the modelling for this paper. This is supported by the notable lack of connecting frameworks catering for innovative economic measures and methods [78]. Therefore, two distinct models were applied to various fragments of this study. The results are then combined for interpretation of findings. This approach allows for the containment of data irrelevancy to specific segments if arisen. While the combination of models have their limitations, this approach is supported by literature as it increases forecasting accuracy [79]. The agglomeration economic model [80] and the private construction forecasting model [81] was used to estimate jobs creation and construction & investment generated. Furthermore, the econometric forecasting was restricted to a time frame of 6 years, as longer time frames were shown to involve risks and contribute to inaccuracy [82].

A.2. Assumptions

The econometric forecasting was fed with available statistical data, information from governmental reports and by proprietary data granted by The Port Louis Development Initiative (PLDI). For this exercise, the following assumptions were made.

A.2.1. General

Aside from current activities, all new spending, revenues, profits and jobs created were assumed to be incremental on the basis that expected increasing activities would not have taken place without the URS.

A.2.2. Capital Expenditure for Construction

Sizeable architectural projects that are in development were taken in consideration with the assumption that those projects shall accelerate to benefit from the package of fiscal incentives. The total expenditure was fractured in different categories based on the nature of the investment and the intended use of created spaces. For new constructions, a market rate of Rs 50,000/m2 was assumed, while refurbishments were tabulated with a figure of Rs 20,000/m2.

A.2.3. Start of New Constructions

For simplicity, it has been assumed that construction of certain projects shall start in the year 2018. Since the proposal is aimed at the national budget scheduled in June 2018, this provides an assumption of six months, which is deemed reasonable for projects that already possess building permits. It is further assumed that 20% of unbuilt plots in Port Louis would be converted to residential and office spaces.

A.2.4. Occupancy Rate

From estimations of the current market, it was assumed that 15% of all properties in Port Louis are currently unoccupied. This figure was based on expert analysis. Fifty percent of that vacant space is assumed to be renovated as a result of the URS, and only 20% of vacant space is computed for renovation.

A.2.5. Rental Income

The current market rates were factored to calculate the potential income generated by type of space usage. This was further used to model the costs of investment. In addition, due to the upcoming new urban developments in Mauritius and the increasing competition, potential tenants will be tied in lease agreements and will not be able to relocate in the immediate short term. As such, it is assumed that only a ratio of 40% of new space constructed will be occupied by new activities, where the remaining will be occupied by existing activities.

A.2.6. Turnover

The additional turnover and profits to be generated by new businesses and commercial/retail business were based on the ratio of revenue/profits to rental for typical businesses.

A.2.7. Permanent Jobs’ Creation

The total number of jobs created from the new businesses (office and commercial/retail) were based on the new surface area occupied by new businesses. As the most common occupancy for new and current economic sectors in Port Louis concerns office and commercial, a figure of one employee for 10 m2 and 30 m2, respectively, was used.

A.2.8. Construction Jobs’ Creation

The number of construction jobs generated was based on the national spending from the construction sector and the resulting creation of jobs. Due to market fluctuations, the most recent figures of 2018 were used, which generated 56,500 jobs [83]. It was therefore assumed that 2.3 construction jobs shall be generated for every Rs 1 million spent, per annum.

A.2.9. Governmental Revenue

Governmental income was based on the (1) generated VAT on turnover by new businesses; (2) income tax on profits of new businesses and additional demand from construction companies; and (3) trade licence fees based on new businesses and from the increased revenue from existing ones, thus requiring higher categorisation of fees.

A.3. Limitations

The Author Acknowledges Various Limitations Mainly Due to the Broadness of the Study

The first concerns property value as is threefold: (1) There was an inability to quantify the resulting impacts on property value from cultural & artistic manifestations due to arise. While there are numerous studies [84,85] that provide an insight on this, no contextual information as to the metrics are available for the context of Mauritius. (2) The URS provides the opportunity to attract investment in public spaces and assets. Research suggest that this impacts considerably on property value [86,87], however due to local regulations in place and the limitations of attracting private investment for public services and utilities, no considerable investment would result in the next six years. (3) No provision for property depreciation & appreciation was tabulated in this study, and its related impact on property rental was tabulated. This was due to the fact that controlled rental, through the Landlord and Tenant act [23], is imposed in Mauritius, and there are no prior local research on the impacts on the exemption of this law on property value.
The second concerns job creation. While the agglomeration model [80] provides a clear pathway to estimate jobs creation, white collar jobs were removed from the exercise, due to the lack of available statistics and data for clear interpretation.
The third concerns revenue and expenditure. The study estimates the investment to be generated as a result of the URS, research underlines econometric models for predicting the ratio of Foreign Direct Investment [77]. However, there are no calibrated models to predict the ratio of Local and Foreign investment and the resulting interest rates for either business or state, which ultimately impacts on revenue generation.
For simplicity and unambiguity, the three factors as described above were abstracted from this study.

References

  1. Statistics Mauritius. Digest of Demographic Statistics; Statistics Mauritius: Port Louis, Mauritius, 2016.
  2. Bunwaree, S. The fading developmental state: Growing inequality in mauritius. Development 2014, 57, 578–590. [Google Scholar] [CrossRef]
  3. Redaction, L. Jean Claude de L’estrac: La Port Louis Development Initiative est un Bureau de Facilitation D’affaires; L’Express Maurice: Pamplemousses, Mauritius, 2017. [Google Scholar]
  4. Peck, J. Pushing austerity: State failure, municipal bankruptcy and the crises of fiscal federalism in the USA. Camb. J. Reg. Econ. Soc. 2014, 7, 17–44. [Google Scholar] [CrossRef]
  5. Groëme-Harmon, A. Gaëtan Siew: Ramener Jusqu’à 5000 Jeunes Vivre à Port-Louis; L’Express Maurice: Pamplemousses, Mauritius, 2018. [Google Scholar]
  6. Amini, M.H.; Boroojeni, K.G.; Iyengar, S.S.; Blaabjerg, F.; Pardalos, P.M.; Madni, A.M. A panorama of future interdependent networks: From intelligent infrastructures to smart cities. In Sustainable Interdependent Networks: From Theory to Application; Amini, M.H., Boroojeni, K.G., Iyengar, S.S., Pardalos, P.M., Blaabjerg, F., Madni, A.M., Eds.; Springer: Cham, Switzerland, 2018; pp. 1–10. [Google Scholar]
  7. Ramkissoon, H.; Nunkoo, R. City image and perceived tourism impact: Evidence from port louis, mauritius. Int. J. Hosp. Tour. Admin. 2011, 12, 123–143. [Google Scholar] [CrossRef]
  8. Bertacchini, E.E.; Re, A. Port Louis 2030: Investing in the City’s Cultural Assets; Centro Studi Silvia Santagata EBLA: Torino, Italy, 2017. [Google Scholar]
  9. Allam, Z. Focus group findings for smart urban regeneration. J. Urban Regen. Renew. 2018, in press. [Google Scholar]
  10. Allam, Z.; Newman, P. Redefining the smart city: Culture, metabolism & governance. Smart Cities 2018, 1, 4–25. [Google Scholar]
  11. Titus, D. Tax Incentives for Special Economic Zones; Asialaw, 2006. [Google Scholar]
  12. Adair, A.; Berry, J.; McGreal, S. Financing property’s contribution to regeneration. Urban Stud. 2003, 40, 1065–1080. [Google Scholar] [CrossRef]
  13. McGreal, S.; Berry, J.; Lloyd, G.; McCarthy, J. Tax-based mechanisms in urban regeneration: Dublin and chicago models. Urban Stud. 2002, 39, 1819–1831. [Google Scholar] [CrossRef]
  14. Laura Bottazzi, M.D.R.; Hellmann, T.F. The importance of trust for investment: Evidence from venture capital. Natl. Bur. Econ. Res. 2011. [Google Scholar] [CrossRef]
  15. Board of Investment (BOI). Smart Cities Guidelines; Board of Investment: Port Louis, Mauritius, 2015.
  16. Board of Investment (BOI). Smart Mauritius; Board of Investment: Port Louis, Mauritius, 2017.
  17. MPA. Mauritius Ports Authority. Available online: http://www.mauport.com/en/history-port (accessed on 29 April 2018).
  18. Board of Investment (BOI). Freeport Developer Handbook; Board of Investment: Port Louis, Mauritius, 2016.
  19. RoM. Bunkering Sector Can Become an Economic Pillar for Mauritius, Says Minister Gungah. Available online: http://www.govmu.org/English/News/Pages/Bunkering-sector-can-become-an-economic-pillar-for-Mauritius,-says-Minister-Gungah.aspx (accessed on 29 April 2018).
  20. Allam, Z. Rethinking Our Country’s Planning: A Need for a New Urban Form; Le Mauricien: Port Louis, Mauritius, 2013. [Google Scholar]
  21. Allam, Z.; Jones, D. Promoting resilience, liveability and sustainability through landscape architectural design: A conceptual framework for port louis, mauritius; a small island developing state. In International Federation of Landscape Architects World Congress; International Federation of Landscape Architects: Singapore, 2018. [Google Scholar]
  22. Ministry of Housing & Lands. Planning Policy Guidance–ppg6; Ministry of Housing & Lands: Quatre Bornes, Mauritius, 2011.
  23. AGS International Movers. Landlord and Tenant Act; Revised Laws of Mauritius; AGS International Movers: Port Louis, Mauritius, 1999. [Google Scholar]
  24. Aapravasi Ghat Trust Fund (AGTF). Aapravasi Ghat World Heritage Management Plan; Aapravasi Ghat Trust Fund: Port Louis, Mauritius, 2013. [Google Scholar]
  25. Attractions, M. Aapravasi Ghat. 2015. Available online: http://mauritiusattractions.com/aapravasi-ghat-visit-tour-p-1312.html (accessed on 1 July 2018).
  26. Chau, K.W.; Chin, T.L. Critical review of literature on the hedonic price model. Int. J. Hous. Sci. Appl. 2003, 27, 145–165. [Google Scholar]
  27. Mega. Développement Foncier à Port-Louis: Rs 200 Millions Réclamées à la Mairie. 2014. Available online: https://business.mega.mu/2014/03/17/developpement-foncier-port-louis-rs-200-millions-reclamees-la-mairie/ (accessed on 1 July 2018).
  28. Groëme-Harmon, A. Ile Maurice: Lloyd lai fak yu—j’ai Honte de Chinatown. Available online: http://fr.allafrica.com/stories/201605021457.html (accessed on 26 April 2018).
  29. Redaction, L. Les Cyclones les Plus Dévastateurs. 2015. Available online: https://www.lexpress.mu/article/257505/cyclones-plus-devastateurs (accessed on 26 April 2018).
  30. Paturau. Cyclone Carol in Port Louis. 1960. Available online: http://vintagemauritius.org/articles/chronology-key-events-mauritius/attachment/cyclone-carol-in-port-louis-feb-1960-paturau/?mode=list (accessed on 26 April 2018).
  31. Boutia, M. Raj Appadu: 10,000 Emplois Sauvés; Defi Media Group: Port Louis, Mauritius, 2017. [Google Scholar]
  32. Mauricien, L. Landlord and Tenants Act—Fin du Moratoire: Des Commerçants Craignent la Fermeture; Le Mauricien: Port Louis, Mauritius, 2017. [Google Scholar]
  33. Mauricien, L. Malgré le Moratoire, Quelle Aberration. Available online: https://www.lemauricien.com/article/malgre-le-moratoire-quelle-aberration/ (accessed on 26 April 2018).
  34. GPG. Landlord and Tenant Laws—Our Rating—Mauritius Compared to Continent. Available online: https://www.globalpropertyguide.com/Africa/Mauritius/landlord-tenant-law (accessed on 26 April 2018).
  35. Wavejourney. Day 39: Port Louis with Holland America. Available online: https://wavejourney.com/wj-reviews/day-39-port-louis-mauritius-with-holland-america/ (accessed on 19 July 2018).
  36. Carrotmadman. Carrotmadman’s Blog. Caudan Waterfront. Available online: http://carrotmadman6.blogspot.com/2010/06/caudan-waterfront.html (accessed on 8 August 2018).
  37. David. L’hopital militaire. Available online: https://www.patrimoineenperil.mu/inventaire/item.php?itemId=145 (accessed on 19 July 2018).
  38. Allam, Z. Sustainable architecture: Utopia or feasible reality? J. Biourban. 2012, 2, 47–61. [Google Scholar]
  39. Allam, Z. Building a conceptual framework for smarting an existing city in mauritius: The case of port louis. J. Biourban. 2017, 4, 103–121. [Google Scholar]
  40. Ministry of Housing and Lands (MoHL). Outline Scheme Port Louis; Ministry of Housing and Lands: Rue des Arts, Quatre Bornes, 2011.
  41. Carter, D. Urban regeneration, digital development strategies and the knowledge economy: Manchester case study. J. Knowl. Econ. 2013, 4, 169–189. [Google Scholar] [CrossRef]
  42. Geng, Y.; Cassandras, C.G. A new “smart parking” system infrastructure and implementation. Procedia Soc. Behav. Sci. 2012, 54, 1278–1287. [Google Scholar] [CrossRef]
  43. Newman, P.; Kosonen, L.; Kenworthy, J. Theory of urban fabrics: Planning the walking, transit/public transport and automobile/motor car cities for reduced car dependency. Town Plan. Rev. 2016, 87, 429–458. [Google Scholar] [CrossRef]
  44. Newman, P.; Kenworthy, J. The rise and fall of automobile dependence. In The End of Automobile Dependence; Island Press/Center for Resource Economics: Washington, DC, USA, 2015; pp. 1–31. [Google Scholar]
  45. Peter, W.N. Transport infrastructure and sustainability: A new planning and assessment framework. Smart Sustain. Built Environ. 2015, 4, 140–153. [Google Scholar]
  46. Abdoullaev, A. A smart world: A development model for intelligent cities. In Proceedings of the 11th IEEE International Conference on Computer and Information Technology (CIT-2011), Paphos, Cyprus, 31 August–2 September 2011. [Google Scholar]
  47. Morandi, C.R.A.; Di Vita, S. From Smart City to Smart Region: Digital Services for an Internet of Places; Springer: Berlin, Germany, 2016. [Google Scholar]
  48. UNESCO. Global Report on Culture for Sustainable Urban Development. Available online: http://unesdoc.unesco.org/images/0024/002459/245999e.pd (accessed on 2 April 2018).
  49. Kalay, Y.; Kvan, T.; Affleck, J. New Heritage: New Media and Cultural Heritage; Routledge: Abington, UK, 2007. [Google Scholar]
  50. Cohen, B. Urbanization in developing countries: Current trends, future projections, and key challenges for sustainability. Technol. Soc. 2006, 28, 63–80. [Google Scholar] [CrossRef]
  51. Siew, G.; Allam, Z. Culture as a driver for sustainable urban development. In UIA 2017 Seoul World Architecs Congress; International Union of Architects: Seoul, Korea, 2017. [Google Scholar]
  52. Bertacchini, E.E.; Re, A. Culture at Work-Port Louis 2030; Centro Studi Silvia Santagata-Ebla: Venice, Italy, 2017. [Google Scholar]
  53. EY. Cultural Times: The First Global Map of Cultural and Creative Industries; EY: London, UK, 2015. [Google Scholar]
  54. Porlwi. Festival Porlwi. Available online: www.porlwi.com (accessed on 29 April 2018).
  55. Glazebrook, G.; Newman, P. The city of the future. Urban Plan. 2018, 3, 20. [Google Scholar] [CrossRef]
  56. Wiktorowicz, J.; Babaeff, T.; Breadsell, J.; Byrne, J.; Eggleston, J.; Newman, P. Wgv: An australian urban precinct case study to demonstrate the 1.5 °C agenda including multiple sdgs. Urban Plan. 2018, 3, 64–81. [Google Scholar] [CrossRef]
  57. Priemus, H.; Nijkamp, P.; Banister, D. Mobility and spatial dynamics: An uneasy relationship. J. Transp. Geogr. 2001, 9, 167–171. [Google Scholar] [CrossRef]
  58. Leach, J.M.; Braithwaite, P.A.; Lee, S.E.; Bouch, C.J.; Hunt, D.V.L.; Rogers, C.D.F. Measuring urban sustainability and liveability performance: The city analysis methodology. Int. J. Complex. Appl. Sci. Technol. 2016, 1, 86–106. [Google Scholar] [CrossRef]
  59. Newman, P.W.G. Sustainability and cities: Extending the metabolism model. Landsc. Urban Plan. 1999, 44, 219–226. [Google Scholar] [CrossRef]
  60. Kennedy, C.; Pincetl, S.; Bunje, P. The study of urban metabolism and its applications to urban planning and design. Environ. Pollut. 2011, 159, 1965–1973. [Google Scholar] [CrossRef] [PubMed]
  61. Huang, S.-L.; Hsu, W.-L. Materials flow analysis and emergy evaluation of taipei’s urban construction. Landsc. Urban Plan. 2003, 63, 61–74. [Google Scholar] [CrossRef]
  62. Newman, P.W.G. Sustainability and Cities: Overcoming Automobile Dependence/Peter Newman, Jeffrey Kenworthy; Island Press: Washington, DC, USA, 1999. [Google Scholar]
  63. Shahrokni, H.; Lazarevic, D.; Brandt, N. Smart urban metabolism: Towards a real-time understanding of the energy and material flows of a city and its citizens. J. Urban Technol. 2015, 22, 65–86. [Google Scholar] [CrossRef]
  64. Cento Bull, A.; Jones, B. Governance and social capital in urban regeneration: A comparison between bristol and naples. Urban Stud. 2006, 43, 767–786. [Google Scholar] [CrossRef]
  65. Davies Jonathan, S. The governance of urban regeneration: A critique of the ‘governing without government’ thesis. Public Adm. 2002, 80, 301–322. [Google Scholar] [CrossRef]
  66. Degen, M.; GarcÍA, M. The transformation of the ‘barcelona model’: An analysis of culture, urban regeneration and governance. Int. J. Urban Reg. Res. 2012, 36, 1022–1038. [Google Scholar] [CrossRef]
  67. Jones, P.; Evans, J. Urban regeneration, governance and the state: Exploring notions of distance and proximity. Urban Stud. 2006, 43, 1491–1509. [Google Scholar] [CrossRef]
  68. Niedzielski, M.A.; Horner, M.W.; Xiao, N. Analyzing scale independence in jobs-housing and commute efficiency metrics. Transp. Res. Part A 2013, 58, 129–143. [Google Scholar] [CrossRef]
  69. Loo, B.P.Y.; Chow, A.S.Y. Jobs-housing balance in an era of population decentralization: An analytical framework and a case study. J. Transp. Geogr. 2011, 19, 552–562. [Google Scholar] [CrossRef]
  70. Wong, P.B.E.; Bressi, R.B.E.; Jerogin, P.B.; Kardash, V.B.E.M. From wasteland to world-class centre: Barangaroo south, sydney, australia. Proc. Inst. Civ. Eng. 2013, 166, 3–9. [Google Scholar] [CrossRef]
  71. Stickells, L. Barangaroo: Instant urbanism—Just add water. Archit. Aust. 2010, 99, 47–51. [Google Scholar]
  72. Thomson, G.; Newman, P. Urban fabrics and urban metabolism—From sustainable to regenerative cities. Res. Conserv. Recycl. 2018, 132, 218–229. [Google Scholar] [CrossRef]
  73. Stoker, G. Governance as theory: Five propositions. Int. Soc. Sci. J. 2008, 50, 17–28. [Google Scholar] [CrossRef]
  74. Bassett, K. Partnerships, business elites and urban politics: New forms of governance in an english city? Urban Stud. 1996, 33, 539–555. [Google Scholar] [CrossRef]
  75. Green, J.; Newman, P. Citizen utilities: The emerging power paradigm. Energy Policy 2017, 105, 283–293. [Google Scholar] [CrossRef]
  76. Costi, P.; Minciardi, R.; Robba, M.; Rovatti, M.; Sacile, R. An environmentally sustainable decision model for urban solid waste management. Waste Manag. 2004, 24, 277–295. [Google Scholar] [CrossRef]
  77. Tung, S.; Cho, S. Determinants of regional investment decisions in china: An econometric model of tax incentive. Rev. Quant. Financ. Account. 2001, 17, 167–185. [Google Scholar] [CrossRef]
  78. del Río, P.; Peñasco, C.; Romero-Jordán, D. What drives eco-innovators? A critical review of the empirical literature based on econometric methods. J. Clean. Prod. 2016, 112, 2158–2170. [Google Scholar] [CrossRef]
  79. Jadevicus, A. The use of combination forecasting approach and its application to regional market analysis. Region 2014, 1, Y1–Y7. [Google Scholar] [CrossRef]
  80. Combes, P.-P.; Duranton, G.; Gobillon, L. The identification of agglomeration economies. J. Econ. Geogr. 2011, 11, 253–266. [Google Scholar] [CrossRef]
  81. Thomas Ng, S.; Fan, R.Y.C.; Wong, J.M.W. An econometric model for forecasting private construction investment in hong kong. Constr. Manag. Econ. 2011, 29, 519–534. [Google Scholar] [CrossRef]
  82. Allen, P.G. Econometric forecasting. In Principles of Forecasting: A Handbook for Researchers and Practitioners; Springer: Berlin, Germany, 2001. [Google Scholar]
  83. Competition Commission Mauritius (CCM). Market Study of the Construction Industry in Mauritius; Competition Commission Mauritius: Port Louis, Mauritius, 2018. [Google Scholar]
  84. Seresinhe, C.I.; Preis, T.; Moat, H.S. Quantifying the Link between Art and Property Prices in Urban Neighbourhoods; Royal Society Open Science: London, UK, 2016. [Google Scholar]
  85. Seresinhe, C.I.; Preis, T.; Moat, H.S. Using Deep Learning to Quantify the Beauty of Outdoor Places; Royal Society Open Science: London, UK, 2017. [Google Scholar]
  86. Xiao, Y.; Li, Z.; Webster, C. Estimating the mediating effect of privately-supplied green space on the relationship between urban public green space and property value: Evidence from Shanghai, China. Land Use Policy 2016, 54, 439–447. [Google Scholar] [CrossRef]
  87. Brander, L.M.; Koetse, M.J. The value of urban open space: Meta-analyses of contingent valuation and hedonic pricing results. J. Environ. Manag. 2011, 92, 2763–2773. [Google Scholar] [CrossRef] [PubMed]
Figure 1. Methodological approach for creating a smart urban regeneration model.
Smartcities 01 00004 g001
Figure 2. The Six identified dimensions for smart urban regeneration, featured in popularity [9].
Smartcities 01 00004 g002
Figure 3. Photo of Aapravasi Ghat [25].
Smartcities 01 00004 g003
Figure 4. Impacts of Carol Cyclone in 1960 [30].
Smartcities 01 00004 g004
Figure 5. The Central Market, Port Louis, Mauritius [35].
Smartcities 01 00004 g005
Figure 6. The Port Louis Theatre, Mauritius [36].
Smartcities 01 00004 g006
Figure 7. The Granary, Port Louis, Mauritius [36].
Smartcities 01 00004 g007
Figure 8. The Old Military Hospital, Port Louis, Mauritius [37].
Smartcities 01 00004 g008
Figure 9. The Smart City Framework for Port Louis by Allam and Newman [10].
Smartcities 01 00004 g009
Figure 10. The smart urban regeneration framework.
Smartcities 01 00004 g010
Figure 11. Proposed incentives as part of the urban regeneration scheme.
Smartcities 01 00004 g011
Figure 12. Action Plan Zone (APZ) as a combination of both the Core Zone [40] and Buffer Zone 2 [22]. Illustration by the authors.
Smartcities 01 00004 g012
Figure 13. Investment generated.
Smartcities 01 00004 g013
Figure 14. Governmental revenue.
Smartcities 01 00004 g014
Figure 15. Increased business activity.
Smartcities 01 00004 g015
Figure 16. Permanent jobs’ creation.
Smartcities 01 00004 g016
Figure 17. Construction jobs.
Smartcities 01 00004 g017
Table 1. Smart city incentives by the Government of Mauritius [15].
1A smart city company (holder of Smart City Scheme Certificate) is exempted from the payment of:
(i)
income tax for a period of 8 years from the issue of the SCS Certificate provided that the income is derived from an activity pertaining to the development and sale, rental or management of immovable property other than an activity with respect to the supply of goods and services
(ii)
land transfer tax and registration duty on transfer of land into the smart city company for the development of the smart city project, provided that the transferor holds shares, in the smart city company, equivalent to the value of the land transferred
(iii)
land transfer tax and registration duty on the transfer of land from a smart city company to a Special Purpose Vehicle (SPV) set up to develop a component of the smart city project, provided that the smart city company holds shares in the SPV, equivalent to at least the value of land transferred (iv) land conversion tax with respect to the land earmarked for the development of non-residential components (office and business parks, Information Communication Technology (ICT) and innovation clusters, tourist, leisure and entertainment facilities including hotels and golf courses, renewable energy and green initiatives)
(iv)
land conversion tax with respect to the land earmarked for the development of non-residential components (office and business parks, ICT and innovation clusters, tourist, leisure and entertainment facilities including hotels and golf courses, renewable energy and green initiatives)
(v)
valued added tax with respect to buildings and capital goods
(vi)
customs duty on the import or purchase of any dutiable goods, other than furniture, to be used in the infrastructure works and construction of buildings under the smart city scheme
(vii)
morcellement tax for the subdivision of land
2A smart city company issued with a SCS Certificate is granted accelerated annual allowance at a rate of 50% of the costs with respect to capital expenditure incurred on:
(i)
renewable energy
(ii)
energy-efficient equipment or noise control device
(iii)
water-efficient plant and machinery and rainwater-harvesting equipment and system
(iv)
pollution control equipment or device, including wastewater recycling equipment
(v)
an effective chemical hazard control device
(vi)
a desalination plant
(vii)
composting equipment
(viii)
equipment for shredding, sorting and compacting plastic and paper for recycling
3The smart city company may sell serviced land to another company to develop a component of the smart city project
4Application for the permits and licenses submitted by the smart city company will be facilitated through the Board of Investment One Stop-Shop and fast tracked through the Investment Projects
Fast-Track Committee
5Sale of immovable property can be made by way of ‘Vente en Etat Futur d’Achevement’ (VEFA) or ‘Vente a Terme’
6Land transfer tax for immovable property sold on VEFA is payable in four 6-monthly instalments
Table 2. Freeport incentives by the Government of Mauritius [18].
1A zero-rate tax on corporate profits
2Exemption from customs duties and value-added tax on all goods and equipment imported into the freeport zones
3Reduced port handling charges for all goods destined for re-export
4Free repatriation of profits
5100% foreign ownership allowed
6Possibility of selling a quota, 50% of the total value for customs purposes of the goods re-exported or exported in any period of 12 months, on the local market (Section 7 (5) of the Freeport Act 2004). However, profits generated from these transactions will be taxable at the normal corporate tax

