1. Introduction
Recently, due to COVID-19, many untact (non-face-to-face) service technologies have been provided at various commercial facilities, such as restaurants, performances, shops, department stores, and companies. These technologies require people’s visit records during check-ins using a quick response (QR) code. Electronic access registration services using a phone can be found anywhere users enter. QR codes have large squares of three vertices and small squares close to each vertex, and they can store up to 7089 digits and 4296 ASCII characters [
1]. Initially, QR codes were used to provide URL addresses and simple text information for website links. However, their range of use has gradually expanded, and QR codes are now used as electronic payment methods, such as Ali Pay, Zero Pay, and Kakao Pay, and they are also used for mobile tickets, such as express buses, trains, and airlines [
2]. In June 2020, due to COVID-19, QR codes were also used in the KI-PASS (an electronic access list), which would be prepared when entering and exiting multi-use facilities. Therefore, visits are currently restricted to access through QR code recognition methods or call-in to caller phone numbers when attempting to enter most facility buildings [
3,
4,
5].
There are two methods of certifying electronic entry lists using QR codes. The first method installs QR code recognition applications on the user’s smart device and recognizes the QR code placed in the visiting facility. The application manages visitor information by sending user information along with recognized data to a designated server [
6]. This method requires the user’s smart device to have a visiting certification application with QR detection functionality, and the user’s information must be registered in the application. This method does not require the installation of smart devices for QR code recognition in electronic entry lists at access facilities, and it also has the advantage of only printing QR codes containing facility information and placing them in facilities. The second method is to issue an authentication QR code from the Naver or Kakao application (in Republic of Korea) using a user’s smart device, then to allow the user to recognize the code through the camera of the smart device installed in the facility [
7]. The smart device installed for visit certification does not store the data of the recognized code in the smart device itself but rather sends it to a designated server to manage visitors’ information. This method requires the establishment of smart devices, applications, and servers for electronic entry lists at the access facilities because visitors’ smart devices have user information. However, both of these methods require specific actions from users who recognize QR code on smart devices. For example, in stores where only QR codes are printed, users should recognize the QR code by running a designated visit certification application. If a smart device for visit certification is installed at the entrance of the store, the authentication QR code with user information should be generated from the smart device, and the authentication QR code should be recognized by the installed smart device. In other words, users may be confused about which of the two methods should be used, because both methods are not unified. There is also a disadvantage: when several people visit together, they often have to line up at the entrance in turn to certify their visit.
Call check-in with caller telephone number access is a method of calling a designated contact at the point of visit and certifying the visit. In Republic of Korea, the user can call a designated phone number starting with 070 or 080 for the store they are visiting and enter the store after confirmation of certification [
8,
9]. The certification center where the user dials, the user’s contact number, the phone reception time, and the designated number are recorded on the server to create an electronic entry list. However, this method requires continuous guidance for call check-in certification during user visits in front of the store, and if the store is not visited, a false authentication problem occurs if the user calls the designated number. In addition, visit times are inaccurate because the recorded time is the time the user calls. Recently, a visit certification service using Wi-Fi or a beacon has been released, but the signal has the disadvantage of having a wide range of reach. In other words, the problem lies in that it can recognize the store as having been visited even if the user has not visited the store and is standing in front of the door.
Therefore, in this study, we propose a user visit certification and visit trace system using inaudible frequencies in the range of audible frequencies but not those audible to people. This proposed application is run to authenticate electronic access without having to line up at the entrance of the visit point. Most speakers can output 20–22 kHz, a range that people can hear (humans have an A-weighted dB hearing that changes drastically with age, and healthy children can hear the upper frequency band up to 30 kHz), and most smart devices can detect trigger signals by collecting ambient sounds through built-in microphones and analyzing collected sounds [
10]. The proposed system uses an interval of 50 Hz between 18 kHz and 20 kHz for data communication studies using conventional high frequencies as a trigger signal. Sound in the range of 18 kHz to 22 kHz is almost inaudible to most people. Frequencies exceeding 20 kHz present the problem that the signal transmission distance gradually decreases. Therefore, we used the range of 18 kHz to 20 kHz, which has been used in many existing studies. The proposed application will perform user visit certification by sending signal values, user identification (ID), and location information to the server when the smart device detects the signal specified by the smart device located within the space where the signal is generated. The server checks the location information of the received data, stores the certification data in the database, and then sends the resulting values back to the smart device to complete authentication. The proposed application stores certificated information in a local database of smart devices, allowing users to view their visit histories at a glance through a list and maps by date. Further, certification information stored on the server can be classified by individual and store, and used to investigate users’ dynamics and search for visitor information by store. To verify the performance of the proposed system, we developed a visit certification application based on a smart device and server system using inaudible frequencies, and conducted a visit certification experiment using 10 smart devices, resulting in an average of 99.6% certification accuracy. We conducted a comparative experiment using the proposed method and a Bluetooth low-energy (BLE) beacon and confirmed that the proposed method has better accuracy of visit certification than a beacon. We also conducted comparative experiments with visiting certification methods using QR codes on paper, authentication of QR codes on smart devices, and call check-in, and found that the proposed method could save more time for authentication. Thus, the proposed system is a technology that allows electronic access to multiple facilities using microphones of smart devices and inaudible frequencies that cannot be heard by people, and it will be a useful technology that can contribute greatly to the untact services required by society after COVID-19.
The structure of this paper is as follows. The “Previous Work” section describes existing studies using inaudible high frequencies in the audible frequency domain used in the proposed method. The “User Visit Certification and Visit Trace System using Inaudible Frequency” section explains the flow of user visit certification and visit trace system using high frequencies, and explains the transmission method of trigger signals consisting of inaudible high frequencies. The “Experiments and Evaluations” section presents the proposed application and shows experiments and results for performance verification of user visit certification and the visit trace system. The “Conclusions and Future Research” section presents the conclusions and establishes future research directions.
2. Previous Work
In this section, we review existing studies that use inaudible high frequencies in the audible frequency domain. Recent inaudible high frequency studies have used a range of frequencies from 18 kHz to 22 kHz, which can be output from ordinary speakers and are rarely heard by people, as recognized by microphones in smart devices. Studies that have used trigger signals by selecting two frequencies from the range of audible frequencies are Bihler’s museum smart guide system, Kim’s user authentication method between smart devices and PCs, and Chung’s public transportation drop-off notification application and spatial density analysis.
Bihler used two frequencies, 20 kHz and 22 kHz, to generate signals with frequency shift keying (FSK) technology and proposed a trigger signal applied with a hamming code to compensate for errors in signal transmission [
11]. Kim proposed generating two high-frequency combinations in the range of 15.8 kHz to 20 kHz to transmit 4-bit signals [
12]. The authentication signal would then send 2 bytes for 8 s. Chung’s public transportation drop-off notification application also uses Kim’s proposed method, which sends two combinations in the range of 18 kHz to 22 kHz, along with trigger signals when station announcements are made through speakers [
13]. This method generates a trigger signal for three seconds, during which time the smart device recognizes the current location of public transportation from the signal and notifies the user of the station to get off at. Chung also proposed a spatial user density analysis system that can identify how many people are gathered in a particular space using the same signal [
14]. However, this pair of high-frequency approaches has the disadvantage of having less transferred data value compared to the time required for delivery. In addition, this method had the problem of requiring a gap of more than 600 Hz to avoid interference between frequencies.
To complement this, Chung proposed a method for transferring near-field data between smart devices using various frequencies ranging from 18 kHz to 22 kHz, rather than only two frequencies, using on–off keying and cyclic redundancy check (CRC) techniques [
15]. This method complements the 600 Hz interval of interference between frequencies feared in conventional methods. This method predefines the data frequency protocol to send more data in a short time frame and seeks to find the optimal transmission value by varying the frequency interval between 25 Hz and 100 Hz. To prevent errors in data transmission due to interference between frequencies, this method applies CRC techniques, which can transmit 40-bit data, including 8 bits of CRC data, within 1 s. Won proposed an invisible data transmission system using dual frequencies that are resistant to ambient noise [
16]. Won’s method uses the Mary frequency shift keying modulation scheme to improve data transmission accuracy [
17]. This method was transmitted using two frequencies with 200 Hz intervals in the range of 16 kHz to 22 kHz, showing 90% accuracy within 12 m.
3. User Visit Certification and Visit Tracing System Using Inaudible Frequency
In this section, we explain a user visit certification and visit tracing system using inaudible high frequencies within the audible frequency. Our proposed system requires a speaker and personal computer (PC), smart device-based application, and server for user visit certification and visit tracing. The process flow between the proposed application and the server is shown in
Figure 1.
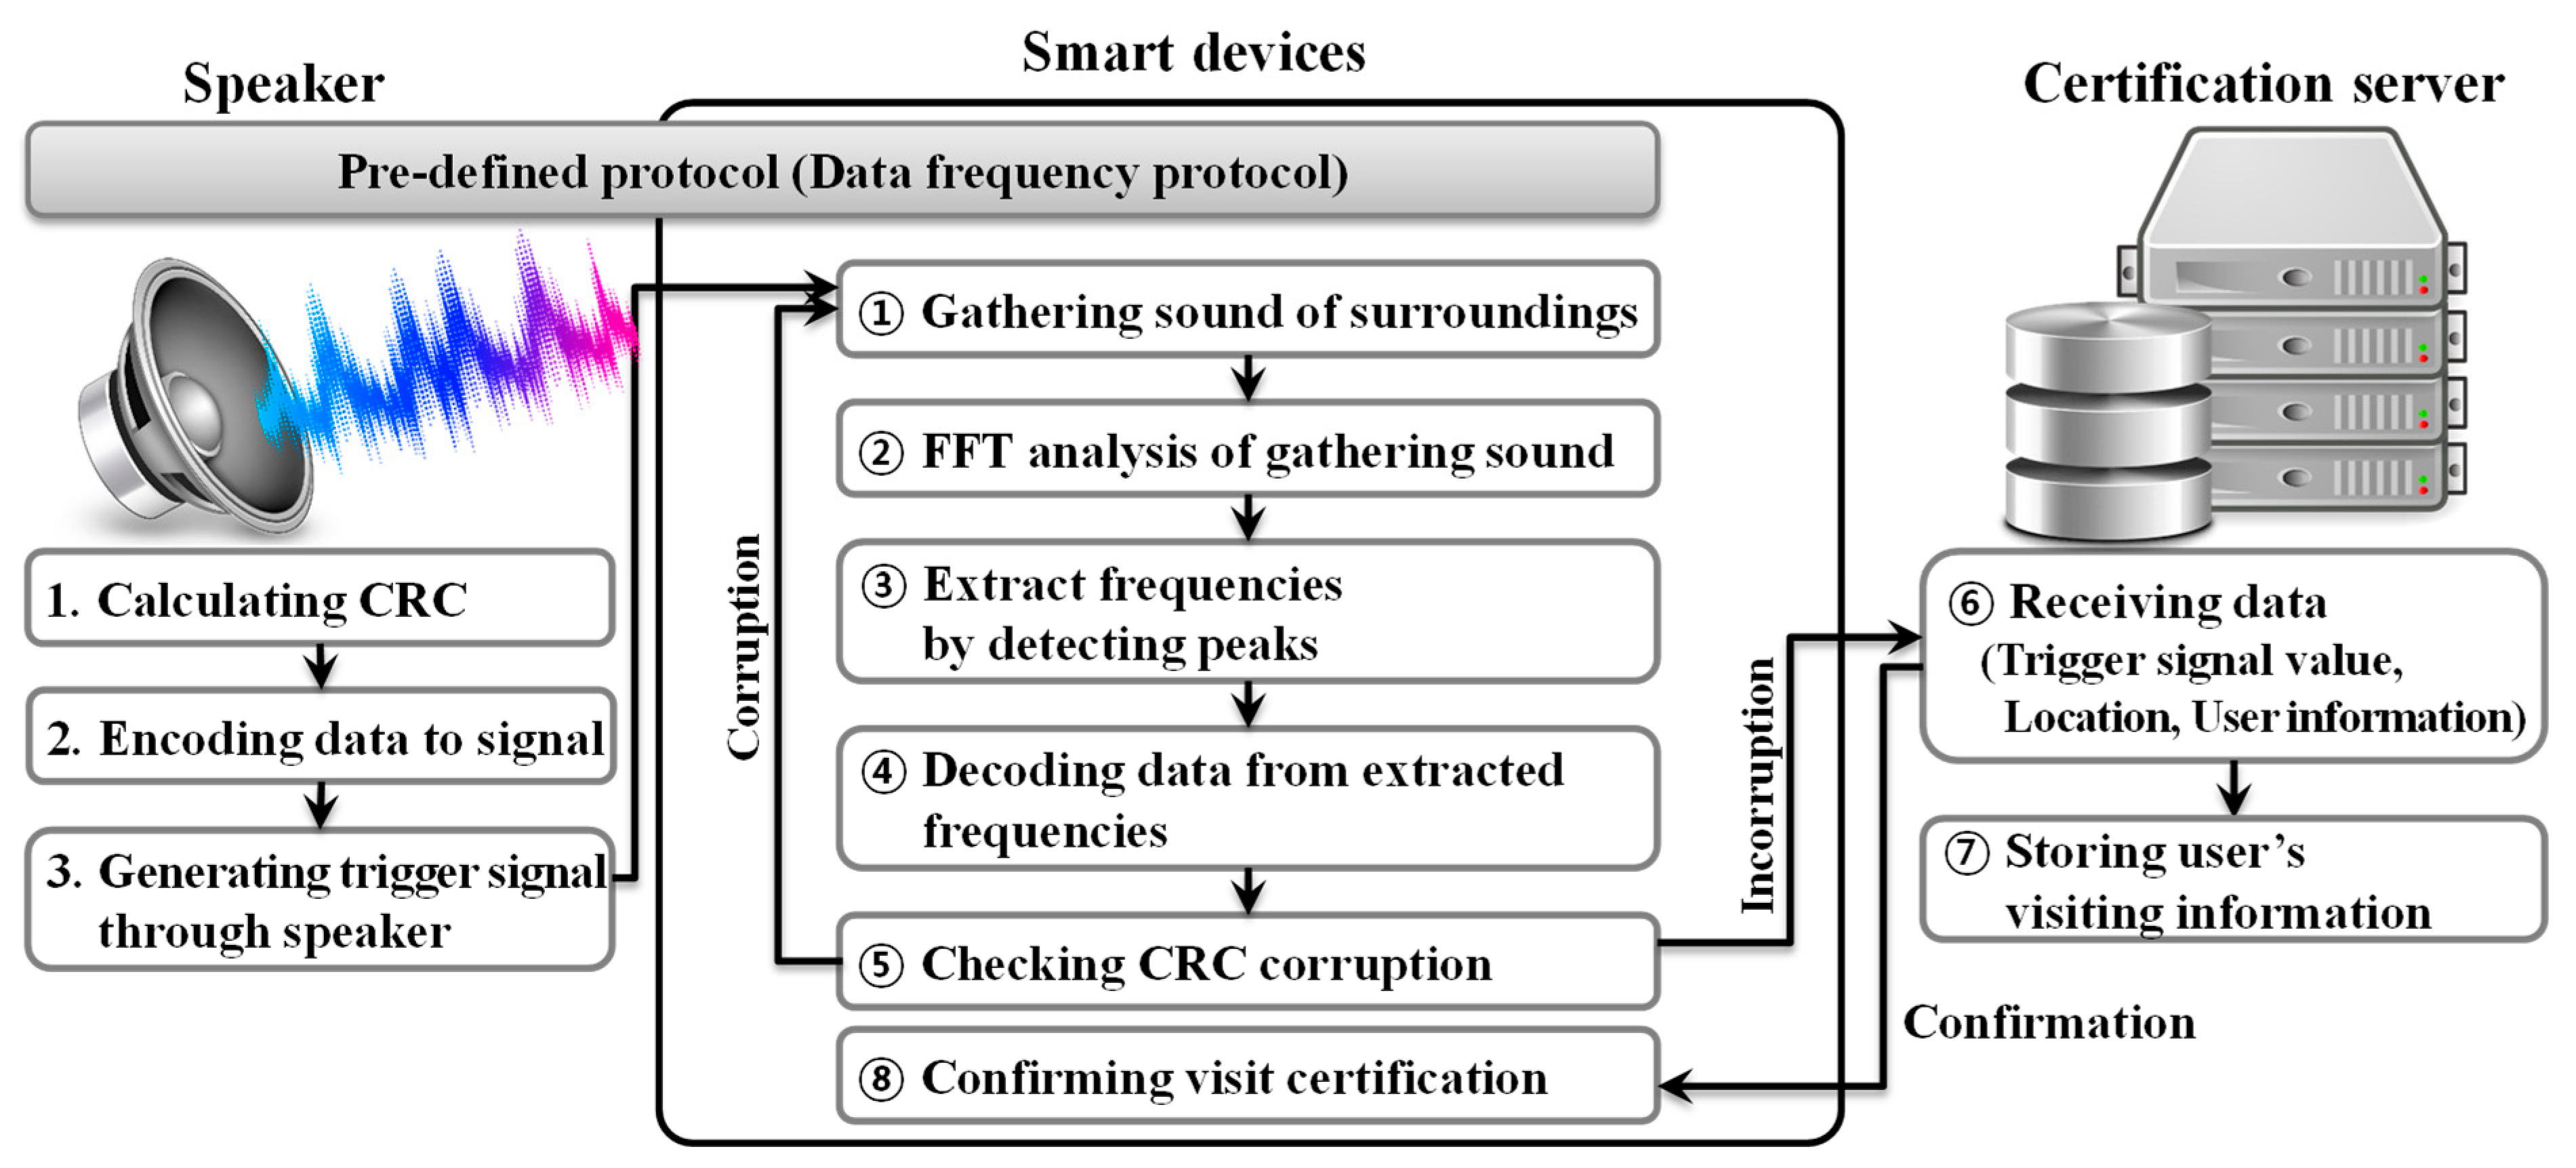
In
Figure 1, the process flow of the proposed system for user visit certification and visit tracing is similar to that of existing QR codes. Sound data from speakers that generate trigger signals should be set up in a predefined protocol first to allow the smart device to recognize the signal. A PC or laptop connected to a speaker calculates a CRC value to generate a trigger signal (1) and encodes signal data (2) for signal output. The trigger signals created in this way are generated through speakers installed in the store (3), and trigger signals are generated at regular intervals during the time when people need to check their access to the store. The trigger signals that occur at this time use a high range of frequencies that people cannot hear, so they do not have a significant impact on facility managers located nearby [
18]. When a user visiting a multi-use facility runs the proposed application installed on a smart device, the application collects sounds around the visitor (①). The application performs a fast Fourier transform (FFT) analysis from the sound collected (②) and extracts valid frequency values by detecting the peak values of frequencies from the analysis results (③). The extracted frequency values are decoded into bit data according to the predetermined data frequency protocol (DFP) (④). Next, CRC checks confirm that an error exists in the decoded data (⑤), and if there is an error due to corruption, the application returns to ① and performs the trigger signal analysis again. When accurate data without data deformation are received, the application sends trigger signal values, user location information, and user ID to the certification server. The certification server checks the data received (⑥) and stores each datum for use in tracing users’ visits, epidemiological investigations, and store-specific visitor information retrieval (⑦). After checking the user’s location information on the server, when the visit certification is approved, the information is delivered to the smart device to complete the user’s visit certification (⑧). The detailed process flow of ⑥, ⑦, and ⑧ in
Figure 1 is shown in
Figure 2.
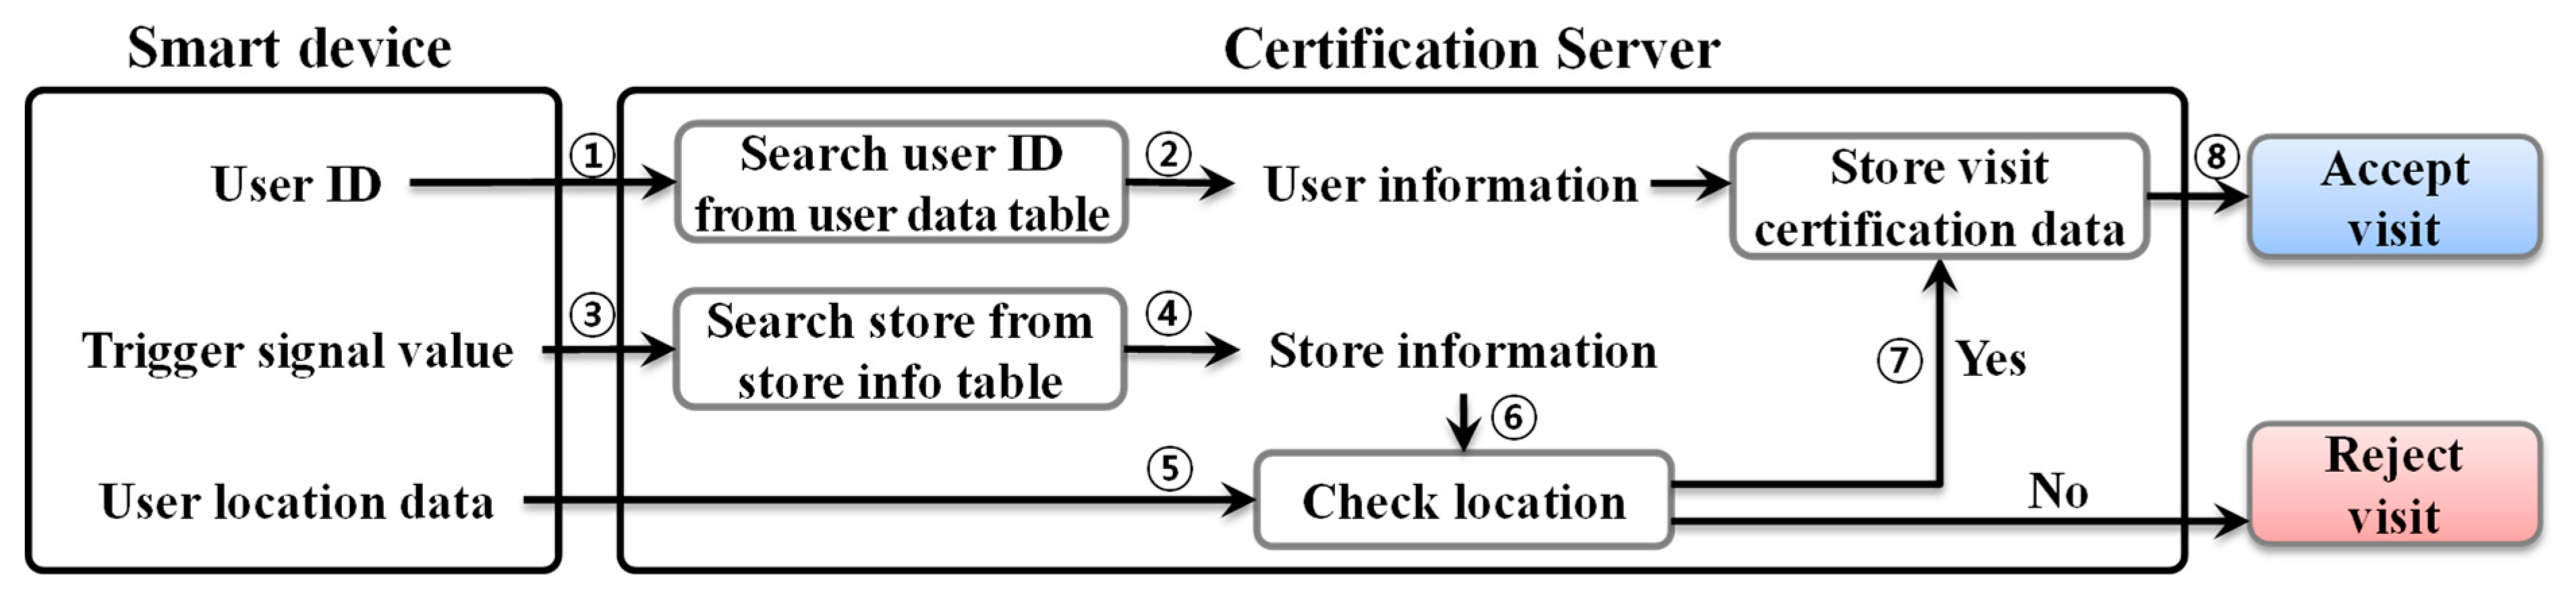
In
Figure 2, when the certification server receives a user ID from a smart device (①), it retrieves user information through a search in the user data table (②). The server then retrieves store information from the store information table (④) using the trigger signal value received (③). The server receives the user’s location information from the smart device (⑤) and performs comparisons with the store location information obtained from ④ (⑥). If the user’s location and store location information are located within a certain range, the certification server stores the visit certification data in the database (⑦) and approves the user’s visit (⑧). If the user’s location and store location information are outside the valid range, the server does not certify that the user has visited the store and refuses to approve the visit. If the visit is approved through the process shown in
Figure 2, the server sends the application of the smart device a store contact, the store name, store global positioning system (GPS) data, and an approval time with the approval number. The application that receives the data stores the information in the SQLite database within the application and uses it to trace user visits and visit locations using Google Maps. If the visit approval is rejected, the server sends an approval error message to the application, which collects the trigger signals from the surrounding area again and then performs the action of requesting reapproval.
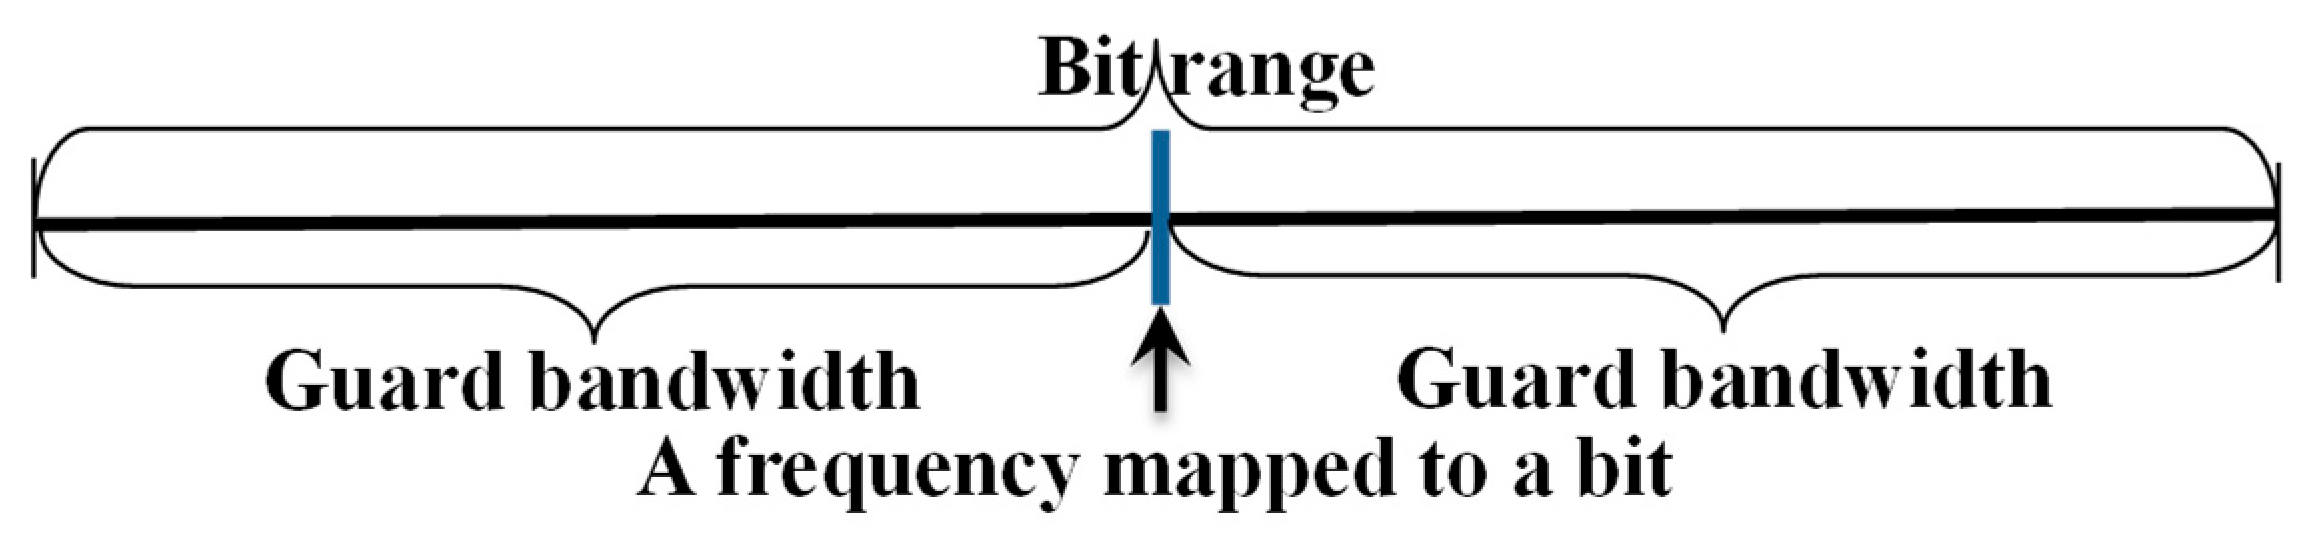
To generate trigger signals for visit certification, we used the predefined protocol proposed by Chung. Bit data using inaudible high frequencies are defined as shown in
Figure 3.
In
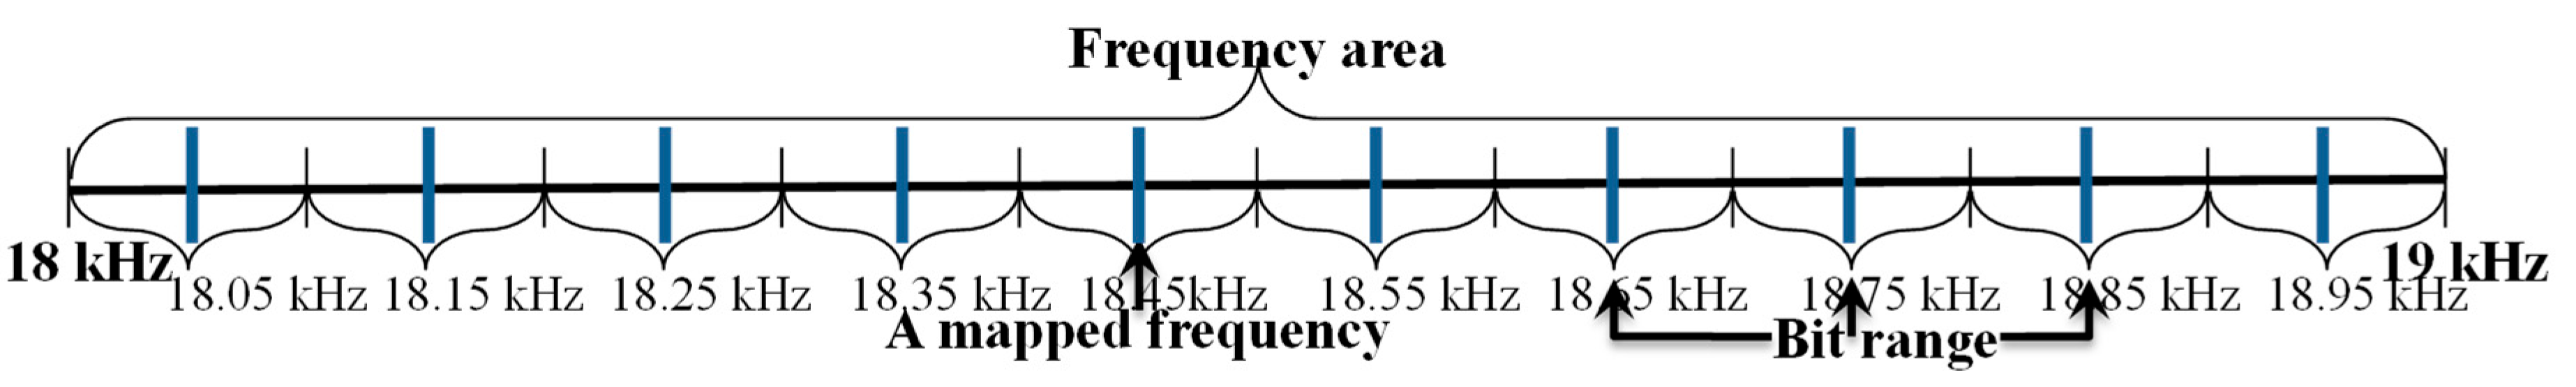
Figure 3, to avoid interference between frequencies, a guard bandwidth (GB) is placed on either side of the frequency mapped to a bit, and the bit range uses twice that. The value representing the bit is central, so the bit is extracted according to the on–off keying technique. In other words, if a GB is used at 50 Hz in the range of 18 kHz to 19 kHz, the bit range will be 100 kHz, as shown in
Figure 4, and the mapped frequencies as bit positions will be 18.05 kHz, 18.15 kHz, 18.25 kHz, …, 19.75 kHz, 19.85 kHz, and 19.95 kHz, with a total of 10 values available.
As shown in
Figure 4, the predefined protocol can be represented using Equation (1).
In Equation (1),
Br is the bit range and
fα refers to the frequency area. When using a GB of 50 Hz, a bit range of 100 Hz, and a frequency area of 18 kHz to 19 kHz, as shown in
Figure 4 (
Pdf = 100 Hz (18–19 kHz)), the data can be 10 bits. In other words, the PC connected to the speaker in
Figure 1 encodes the trigger signal data, including the CRC, using the predefined protocol with
Pdf and then outputs the generated signal.
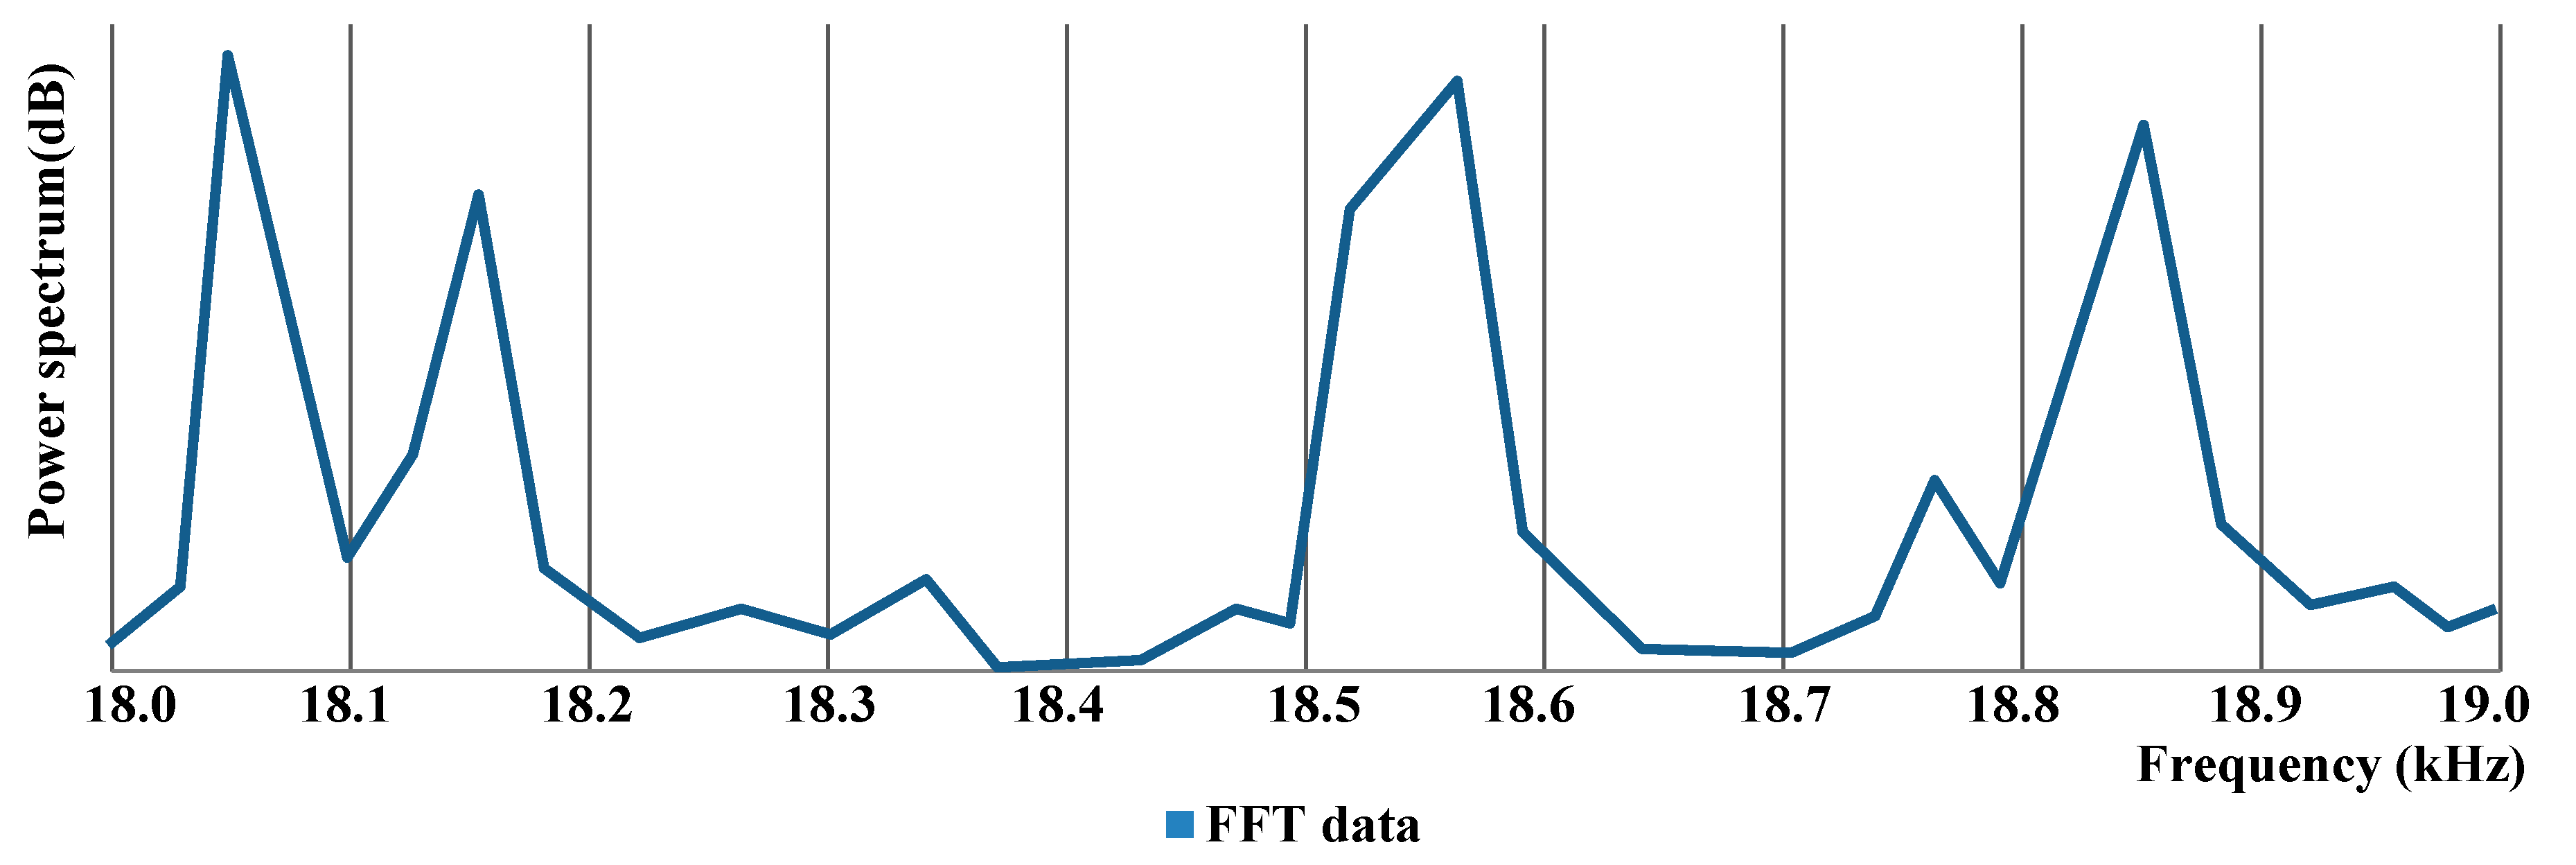
Next, the microphone of the smart device collects ambient sounds, and the proposed application recognizes the data through FFT analysis. The application performs decoding of the data received by modifying the on–off keying technique from the analyzed FFT values. If the signal contains a frequency mapped to each bit, the value of the bit is set to 1, and if the frequency does not exist, the value of the bit is set to 0. For example, if the application receives FFT analysis results with DFP defined as
Pdf = 100 Hz (18–19 kHz), as shown in
Figure 5, valid peaks can be determined to be in the range of 18.0 kHz to 18.1 kHz, 18.1 kHz to 18.2 kHz, 18.5 kHz to 18.6 kHz, and 18.8 kHz to 18.9 kHz.
The mapped bits with center values of 18.05 kHz, 18.15 kHz, 18.55 kHz, and 18.85 kHz, which are the first, second, fifth, and ninth bits of this domain frequency, respectively, have a value of 1. Therefore, the decoded bit value in
Figure 5 is 1100010010 as a 1-bit data point. However, in
Figure 5, a small peak (18.75 kHz) between 18.7 kHz and 18.8 kHz may be recognized as a valid value, depending on the threshold for extracting the peak. Therefore, to avoid these errors, this study used CRC techniques to detect errors. CRC ensures an error detection rate of at least
(1 − 2−m) × 100% for all situations when used for
m bit error detection, and the
m bit of the CRC is added to the back of the actual data, not the data that are separately transmitted, and sent together. Thus, if
m = 3, the last three bits of 1100010010 are used as added data for error detection, and the actual data you want to transmit are 1100010, the previous seven bits. Therefore, the proposed method uses 8 bits as
n bits to transmit a trigger signal through speakers for visit certification to multi-use facilities, and the proposed application decodes the frequency values as bit data based on DFP and then detects the data from the trigger signal through CRC review.
4. Experiments and Evaluations
This section presents the proposed application for user visit certification and the visit trace system, and shows the experiments and analysis of results for performance verification using the proposed application and certification server. The screen configuration of the proposed application is the same as in
Figure 6, and is well developed for the iOS-based iPhone 11.
Figure 6a is the main view when the user first runs the application for visit authentication, and it displays the time in seconds spent on authentication in the red circle position. On the right side of the screen, the “Visit list” button is placed to view the visit history of the places the user visited recently. After running the application, the proposed application performs the certification procedure in the order shown in
Figure 1 if a trigger signal corresponding to the proposed method exists. The application switches to the view in
Figure 6b when the visit certification in
Figure 2 is approved. This is a successful visit authentication, in which the application receives information about the visited store from the server and displays the name of the certified multi-facility, store ID, and store address. This screen allows the user to reenter the store visit certification by touching the “Certification” button located on the right, and the user can touch the “Visit list” button to see the places they have visited recently. Further, if the visit certification is not approved by the server, the application takes more time to approve without changing the view on the screen shown in
Figure 6a.
We set the trigger signal to
Pdf = 50 Hz (18–20 kHz) for visit certification of the proposed application, and output the signals to the speaker using five pieces of 40-bit data, including the CRC data, as shown in
Table 1.
The frequency range was set from 18 kHz to 20 kHz, because the response rate of microphones built into smart devices is inconsistent and depends on the type of smart device when high frequencies above 20 kHz are used [
19,
20]. For example, in Won’s experiments, speaker volume typically decreased from 22.05 kHz to 24 kHz, depending on speaker performance and frequency sample rate, and Chung’s experiments showed a 99.88% transmission accuracy at a sampling rate of 32,768 for FFT analysis. In
Table 1, the 40-bit data consist of 32-bit information data and 8-bit CRC data, with CRC data attached to the back of the 32-bit data. The CRC data generated CRC values for the 32-bit data using the generator polynomial
0x9B (x8 + x7 + x4 + x3 + x + 1) used in WCDMA wireless communication [
21].
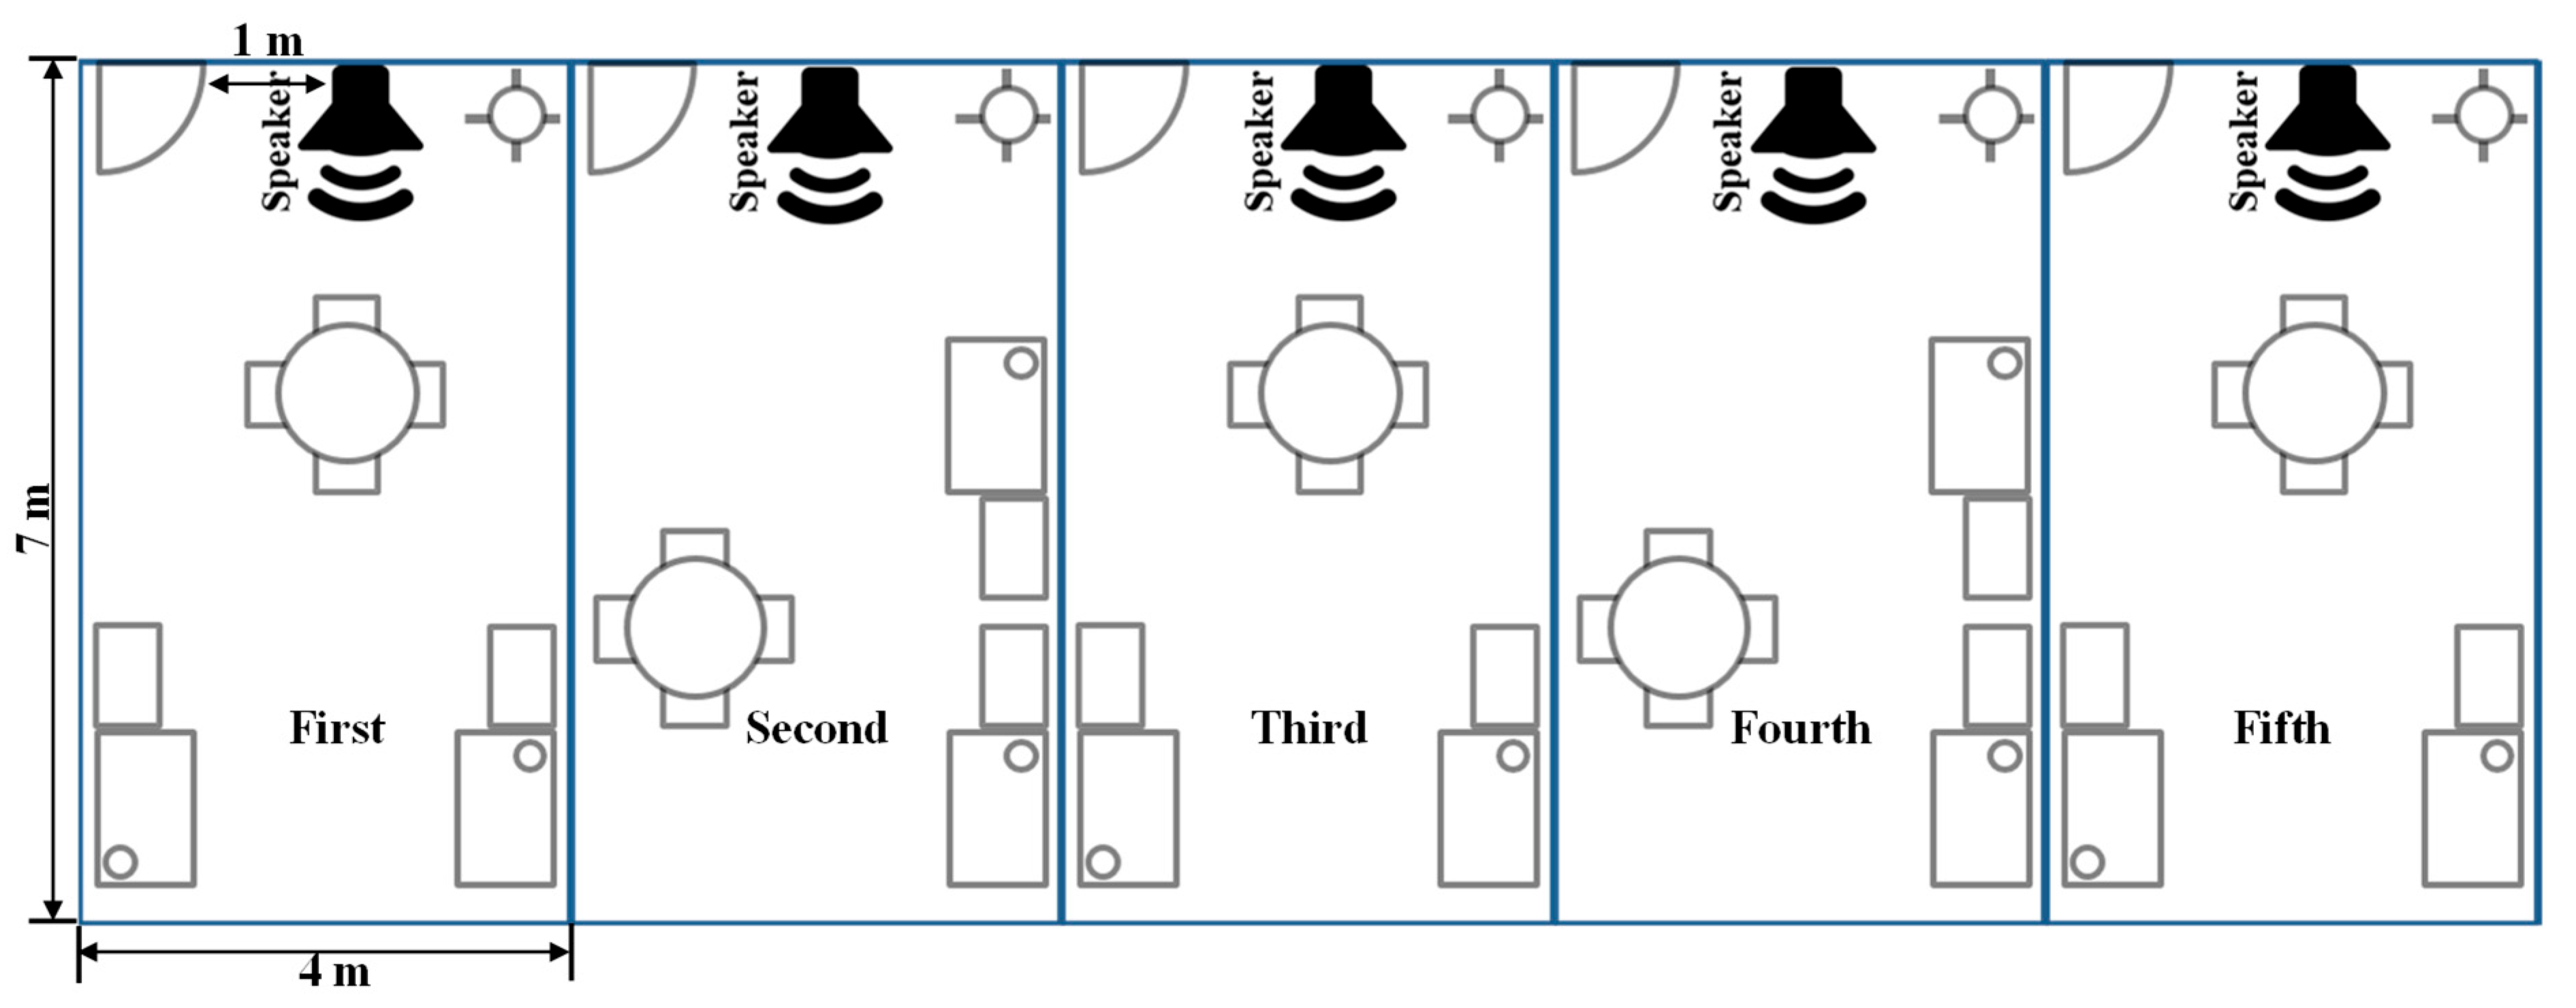
Next, the space for the experiment was determined as the location of five 7 m-by-4 m laboratories located on the same floor of the same building, as shown in
Figure 7. The trigger signal for each space was set in turn from
first to
fifth in
Table 1 to generate a signal from the speaker, which was placed within 1 m of the entrance of each laboratory, as shown in
Figure 7.
There were 10 participants, and the participants were required to visit each space 10 times in turn to run the proposed application and certify their visit. The server system for authorizing the visit certification and storing the information used Apache 2.2.14, PHP 5.2.12, MySQL 5.1.39, and Intel
® Core
TM i5 CPU 750, with 8 G RAM as the hardware. The speakers for trigger signal generation and output in each laboratory used a 2019 13-inch MacBook Pro and built-in speakers, while the signal generation used JavaScript-based web applications. The smart device used in the experiment used 10 iPhone 11 devices. The comparative experiment was conducted under the same conditions as the BLE beacon, considering how the RSSI signal of the beacon was used as the trigger signal. The BLE beacons in the experiment used i4 beacons sold by Helpter from Seoul, Republic of Korea, and the beacons were placed in the same position as the speaker in the laboratory.
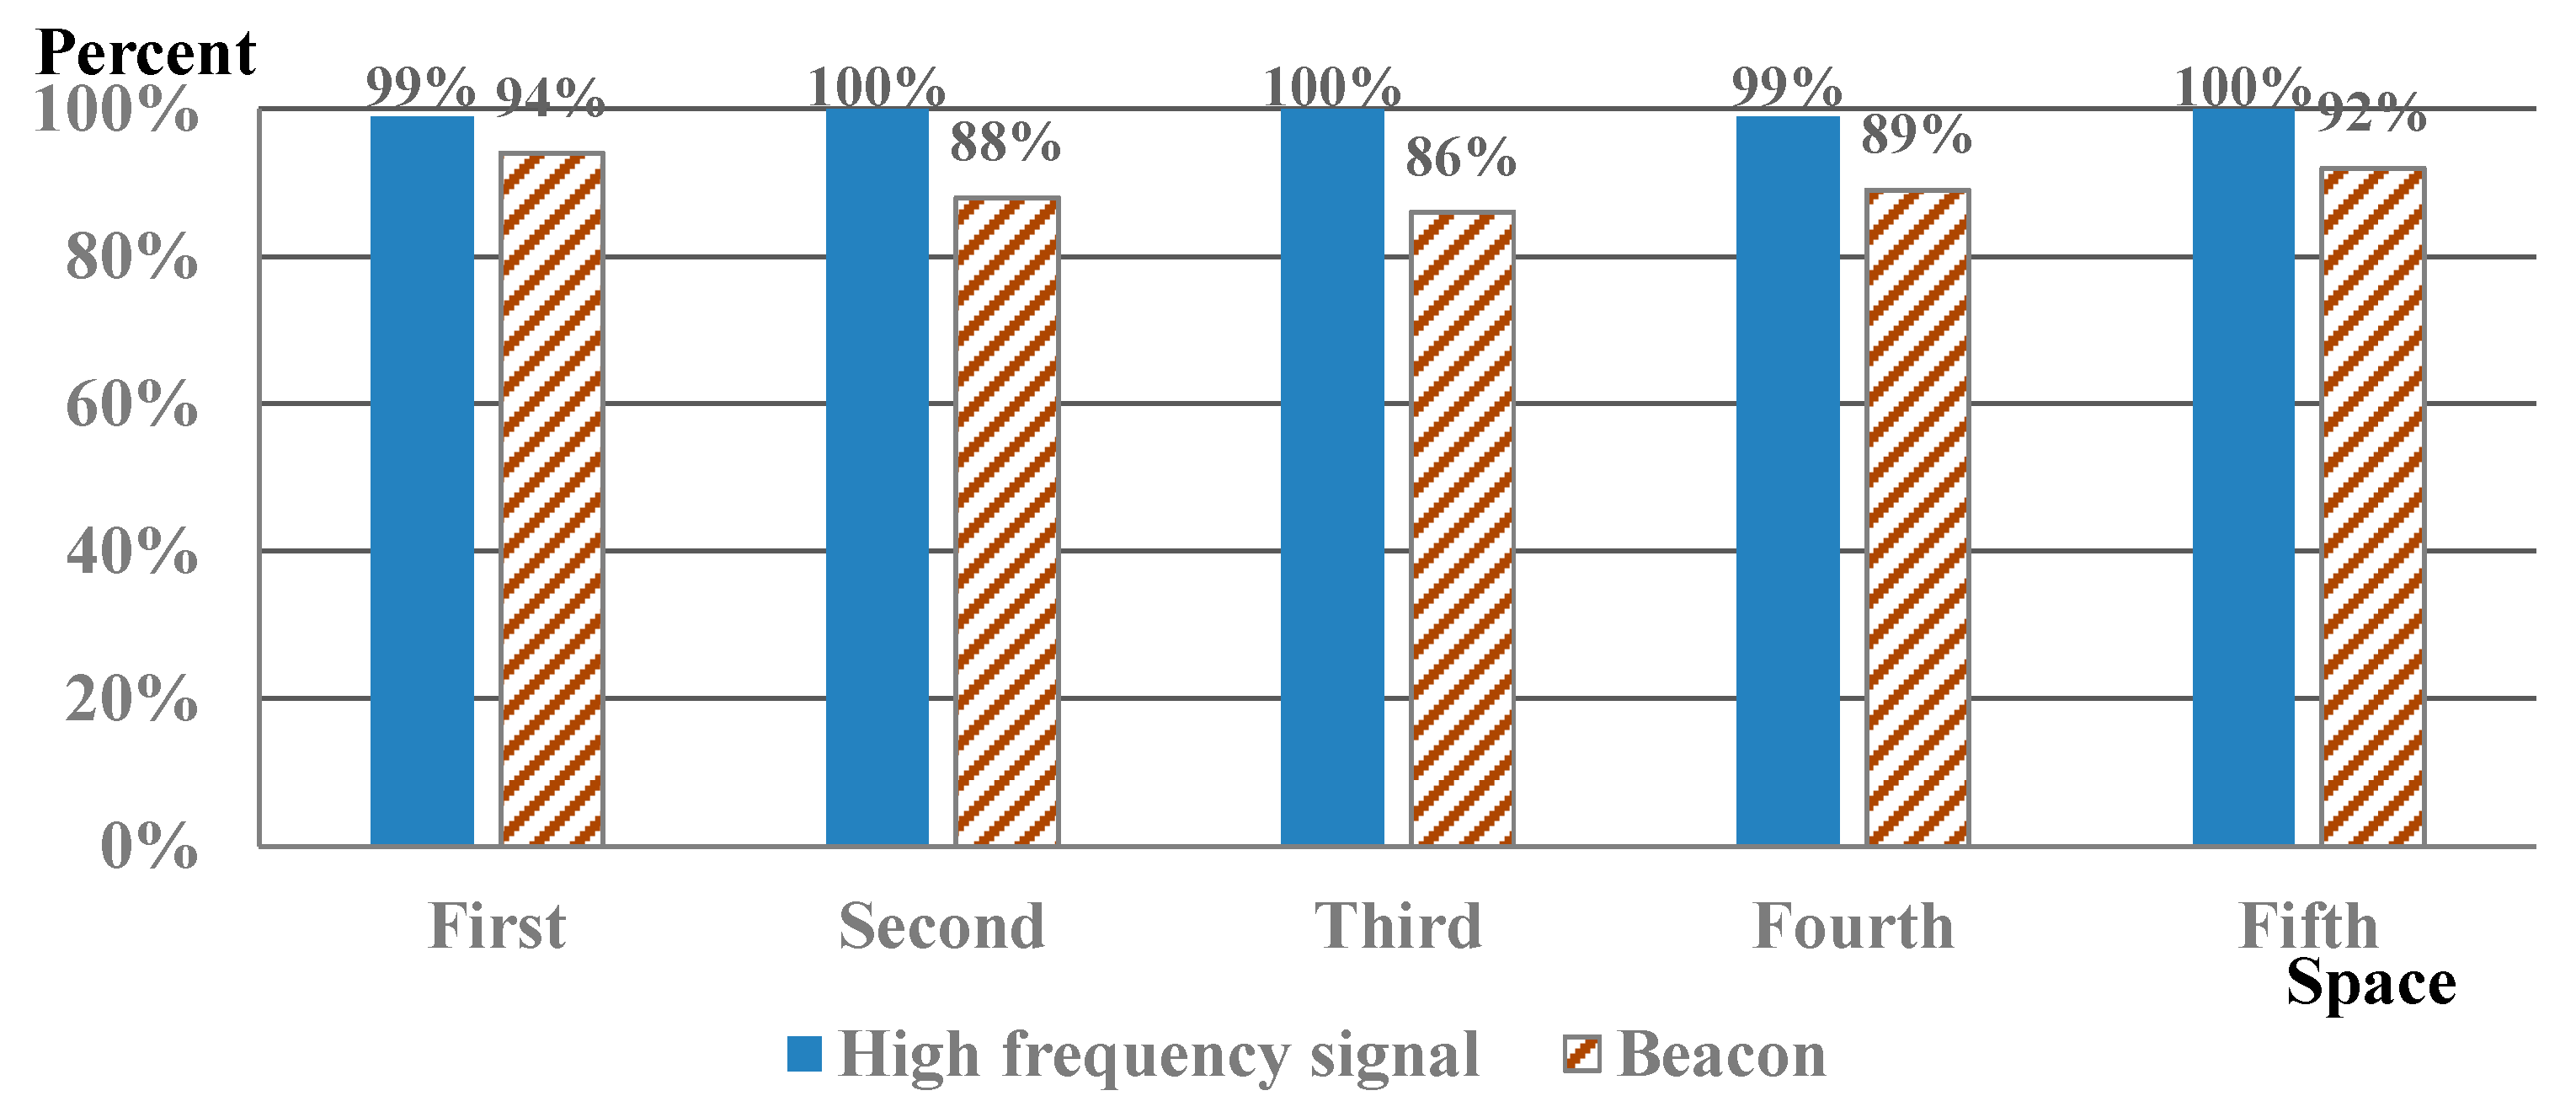
Figure 8 is the result of user visit certification experiments using inaudible high frequency and the RSSI signal from the beacon.
In
Figure 8, “First” through “Fifth” refer to experimental spaces 1 through 5, where trigger signals from
Table 1, such as space names, are constantly generated along with an RSSI signal from each beacon. Ten participants in each space completed a visit certification using the proposed application ten times and a visit certification using a beacon. If a certification error occurred for 10 s and could not be approved, this attempt was considered a failure. In
Figure 8, the results of the experiment using a high-frequency signal showed a high accuracy of 99.6%, with 99%, 100%, 100%, 99%, and 100% success rates at each laboratory. In the first and fourth spaces, 1% of certification failures occurred. We speculated that in these cases, the trigger signal was not recognized accurately because the participant covered the microphone portion of the smart device.
However, the results of a visit certification experiment using beacons showed 94% for the first, 88% for the second, 86% for the third, 89% for the fourth, and 92% for the fifth spaces, with 89.8% accuracy. The certification accuracy using beacons was lower in each space compared to the proposed method because of interference from beacon signals generated by laboratories located next to each space. In other words, the results in
Figure 8 confirm that the visit certification method using inaudible high frequency performed better than the beacon method. Further, when using a beacon, participants needed to always have Bluetooth turned on during the experiment; thus, the beacon was not properly recognized when Bluetooth was turned off.
Next, we developed each application for comparative experiments with visit certification using a QR code, visit certification using an authenticated QR code, and visit certification using call check-in. As a first experiment, we tested visit certification using a QR code that required a visit certification application using a library that could recognize QR codes on smart devices and QR codes printed at paper. Thus, printed QR codes for visit certification were placed on circular tables in each laboratory. The time spent on certification was measured as the time between turning on smart devices, running applications, and completing visit certification. As a second experiment, for the visiting certification using an authenticated QR code, we developed a QR code recognition application for smart devices installed in stores, and authenticated QR codes were generated using the Kakao application. Smart devices for QR code recognition were placed on circular tables in each laboratory, and the experimental methods were measured in the same manner as in the first experiment. The certification time was measured by turning on the smart device, generating the Kakao authentication QR code, recognizing the QR code from the installed smart device, and completing the visit certification. The third experiment was a visit certification using call check-in, and we have not developed an application. The certification time was measured by turning on the smart device, dialing the call check-in number, calling the number, and tracking the time until the first beep. As a fourth experiment, visiting certification using the proposed method was conducted in the same way as in the environment used in the performance verification experiment. The certification time was measured by turning on the smart device, running the proposed application, recognizing inaudible frequency trigger signals, and completing the visit certification. The experimental method measured the time it took for 10 participants to enter each laboratory to certify their visits. In the event of an error in certification failure, the total time required for certification was measured by reattempting the certification, and the visit certification test for each space was conducted 10 times for each participant.
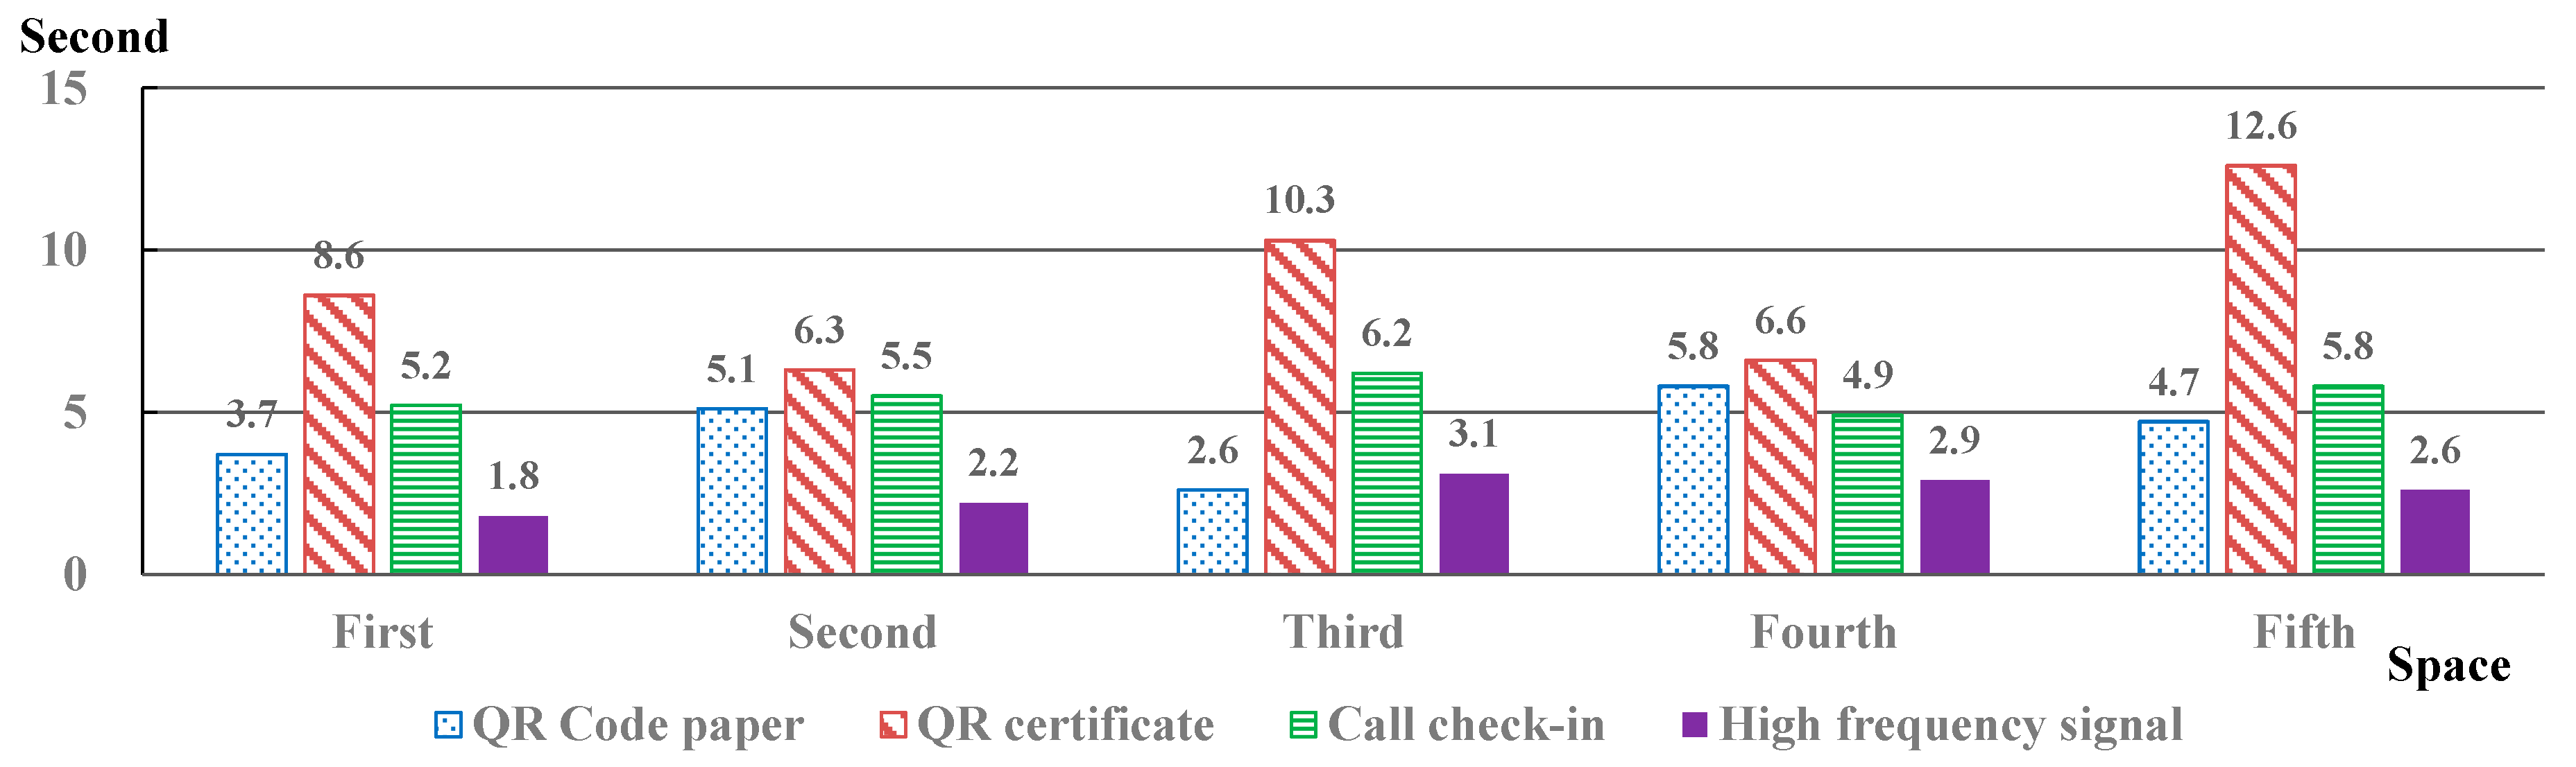
Figure 9 shows the results of the four experiments.
In
Figure 9, the time spent on each laboratory’s certification shows the average time required for 10 participants to attempt certification 10 times per space. If a QR code on paper was used, it took 3.7 s, 5.1 s, 2.6 s, 5.8 s, and 4.7 s for the first through the fifth spaces, respectively, and the average time for visit certification was 4.38 s. It took more than 5 s in the second and fourth spaces, probably due to the light or light effect of QR code recognition, or the camera was not properly positioned for QR code paper recognition. When using the certificate QR code, it took 8.6 s, 6.3 s, 10.3 s, 6.6 s, and 12.6 s for the first through the fifth spaces, respectively, and the average time for visit certification was 8.88 s. The average time for visit certification was higher than in the other experiments, probably due to the reflection of liquid crystal surfaces or light reflection of smart devices with certificate QR codes. Further, we speculated that the user holding the smart device expected that the camera position of the smart device would recognize the certificate QR code based on the screen position and tried to recognize it. When using call check-in, certification took 5.2 s, 5.5 s, 6.2 s, 4.9 s, and 5.8 s for the first through the fifth spaces, respectively, and the average time for visit certification was 5.52 s. Call check-in requires the user to dial the phone number for certification. Further, there was no error except when the number was pressed incorrectly; thus, the visit certification time was uniform within 5 to 6 s in all five spaces. When using the proposed method of inaudible frequency triggering signals, it took 1.8 s, 2.2 s, 3.1 s, 2.9 s, and 2.6 s for the first through the fifth spaces, respectively, and the average time for visit certification was 2.52 s. The proposed method successfully performed certification within approximately 3 s in all spaces, and the average time for visit certification was faster than that of the existing methods.
Lastly, we conducted an experiment on the visiting certification performance of the proposed application when using the same trigger signal in three other spaces more than 50 m apart and not in the same building. This was to ensure that even if the same trigger signal was used, accurate visit certification would be provided based on the user’s location information and the location of the store visited. The location of the speakers was under the same conditions as in the first experiment, and the experimental method was conducted by one participant 10 times, 20 times, 50 times, and 100 times in each space. The results are shown in
Table 2. In
Table 2, each space is named A, B, and C, with GPS values for A (37.379297, 126.927540), B (37.380938, 126.926215), and C (37.380499, 126.928816). We observed 100% certification in all spaces during 10 and 20 certification attempts. With 50 attempts, 98% of the A space and 100% of the other spaces were certified, and with 100 attempts, 100% of both the A and B spaces were certified, while the C space was certified at 99% of the attempts. By demonstrating over 99% certification success in 10, 20, 50, and 100 certification experiments, we confirmed that the proposed method is available in many regions, even if 32 bits are used.
After the visit certification, the information display for tracking a user’s visit is presented in the form of a list, as shown in
Figure 10, using the information stored in the SQLite database within the application.
In
Figure 10, the visit information is separated by the latest date, which appears in ascending chronological order. The user visited Waffle204 at 11:21:11 on Saturday, 24 August 2024, followed by Union Store at 14:52:33. The user visited A Twosome Place at 18:03:52, with the six-digit number next to the store name being the store ID. At this time, for ground truth, the user handwrote each store visited and the visit time on paper. As a result of comparing the value written by hand with the value saved by the application, we confirmed that each visit information and time match. When the user touches the “Visit map” button shown in
Figure 10, the location of the visit certification using Google Maps 25.19.1 is displayed, as shown in
Figure 11.
In
Figure 11, Waffle204, Union Store, and A Twosome Place, which the user visited on Saturday, 24 August 2024, are displayed in pin form on Google Maps. Application users can easily trace their visits. In
Figure 11, the user can return to the screen shown in
Figure 10 by touching the “Visit list” button. Touching the “Certification” button shown in
Figure 10 and
Figure 11 switches to the visit certification screen shown in
Figure 6a, the initial screen of the application. Therefore, through visit certification accuracy experiments and visit certification time comparison experiments, the user visit certification and visit trace system proposed in this study was confirmed as a technology that can accurately and quickly certify electronic access to multi-use facilities. Thus, this technology will be useful for the untact services required by society after the COVID-19 pandemic.


