Technical Note

Method and System for Heart Rate Estimation Using Linear Prediction Filtering †

by
Vitor O. T. Souza
1,
Fabrício G. S. Silva
2,
José M. Araújo
1,* and
Jaimilton S. Lima
3
1
Instituto Federal da Bahia, Grupo de Pesquisa em Sinais e Sistemas, Salvador 40301-015, BA, Brazil
2
Instituto Federal da Bahia, Grupo de Pesquisa em Sistemas de Comunicação, Salvador 40301-015, BA, Brazil
3
Instituto Federal da Bahia, Campus Camaçari, Camaçari 42800-605, BA, Brazil
*
Author to whom correspondence should be addressed.
This paper is an extended version of our paper published in the CBEB 2022, which was presented at XXVII Brazilian Congress on Biomedical Engineering, Vitória, ES, Brazil, October 2022.
Signals 2025, 6(2), 15; https://doi.org/10.3390/signals6020015
Submission received: 18 February 2025 / Revised: 12 March 2025 / Accepted: 18 March 2025 / Published: 25 March 2025

Abstract

:
Cardiovascular diseases represent one of the major problems faced by modern society. In addition to reducing people’s quality of life, bringing high costs to the health system, and causing losses in economic productivity, they are the leading cause of death in the world. Early diagnosis and treatment are the best actions to minimize the damage and costs caused by these diseases. For this, developing techniques and technologies that have higher accuracy in the analysis of electrocardiogram (ECG) signals is necessary. Early diagnosis benefits from relevant ECG interpretation. Then, it can contribute to reducing healthcare costs by replacing interventionist responses with preventive actions. This work presents a method and system for heart rate estimation using Linear Prediction Coefficients (LPCs) centered on an ESP32 microprocessor module and an AD8232 ECG signal conditioning module. The proposal was validated with a Tektronix AFG1022 function generator that produces ECG signals and obtained measurements with accuracy above 98.87%, showing performance similar to studies presented in the literature. Also, the LPC algorithm showed good performance in rejecting low-frequency noise caused by some common artifacts, such as body movement and electrode displacement.

1. Introduction

Cardiovascular disease (CD) is a general term for an illness that affects blood vessels and heart tissue [1]. According to the Brazilian Society of Cardiology, CD is one of the leading causes of death in Brazil and also around the world [2]. It is believed that cardiac insufficiency, heart attacks, atrial fibrillation, and arterial hypertension affect approximately 45.7 million people in Brazil, that is, 32% of the adult population [3,4]. The estimated number of deaths in Brazil was disclosed to be about 400 thousand people in the year 2019, the primary cause of death in that year.
The treatment and diagnosis of CD demand high budgets for public health services and affect the well-being of the population. CDs must be a high priority, resulting in the importance of investments in prognosis and prevention, which can significantly impact productivity losses and the high costs of posterior treatments [4].
An interesting approach to improving the attention of patients with CD is telemedicine, which is internationally associated with reductions in the cost of treatment and readmissions, as well as a decrease in the mortality rate and improved patient comfort and satisfaction [5].
In [6], the effectiveness of telemedicine interventions compared with conventional healthcare for patients with cardiac insufficiency was examined, and the study found that medically supported telemedicine systems were more effective for adults, particularly in reducing all-cause hospitalization, cardiac hospitalization, all-cause mortality, cardiac mortality, and length of stay. In [7], a case study of the use of telemedicine with the auxiliary tool of artificial intelligence in the city of Tarumã—SP is presented, in which there was a 21% decrease in premature deaths due to cardiovascular diseases and a 25% decrease in premature deaths due to circulatory diseases.
To detect CDs and to give accurate diagnoses, the electrocardiogram—ECG—is one of the main types of test/exam, and innovation trends and available technologies make this exam very applicable to telemedicine procedures. It consists of recording the variation in the bio-electrical activity of the heart, which represents the cyclic contractions and relaxations of the human heart muscle and provides important information about the functional aspects of the heart and the cardiovascular system [8]. It is a procedure that has the benefits of having well-defined parameters, low cost, and high sensitivity in detecting CD [9]. The use of artificial intelligence (AI) in analyzing ECG signals to classify arrhythmia and CD has been a trend. Automation is a good route to reduce errors and human burden while interpreting ECG signals; also, automated classification/measurements of ECG signals can improve the accuracy and efficiency of diagnoses [1]. Some examples of recent studies that apply AI tools for detecting cardiovascular diseases focused on deep learning techniques, mainly well-known unidimensional convolutional neural networks—1D-CNNs. A new classification method was presented in [10] for three classes of cardiomyopathy, in which a data elimination and remodeling procedure substantially reduced the processing and learning time. Also, the final precision of the classification was improved, reaching values higher than 94.7% of test precision. In [11], the author proposed a solution that includes data filtering and pulsated dynamic segmentation in a ten-layer 1D-CNN, reaching a precision of 97.8% in a 14-class scenario of arrhythmias from the MIT-BIH database. A high-precision classifier for two classes of low-cost remote monitoring was proposed in [12]. The researchers used the versatile ESP32 for data acquisition, and a 1D-CNN implemented in MATLAB v24.1 was trained and reached a precision of 92.7%. In the work of [11], the researchers also used the ESP32 system for ECG data acquisition, followed by cloud computing training and classification. As one more example, a 1D-CNN was implemented with Tensorflow libraries for cardiac frequency estimation in [10]. Another relevant theme in ECG processing is compressed sensing techniques [13,14,15]. Compressing the ECG signals leads to a sparse representation by downsampling, thereby saving memory space as well as internet capacity, with a minimum loss of information.
Heart rate is one of the most relevant measures that can be estimated via ECG signals, and its unit is beats per minute (bpm); its measure has a diversity of applications, e.g., see [16]. Interpreting this measure is more significant if it can be detected in small windows as compared to a single computation of a mean in larger time intervals. The variability of heart rhythm in short time intervals [17] can be a rich signature to help classifier systems in automated diagnosis. Several works in the specialized literature approach the estimation of cardiac frequency with different sensors, systems, or methods to estimate this significant quantity for the purpose of developing diagnosis tools [18,19,20,21,22,23,24,25].
The contribution of this work is twofold. First, the concept of an LPC-based automated heart rhythm estimator using the reconstruction and error of ECG signals with low-order linear prediction coefficients is proved in an experimental test bed. The method was previously described in [26], wherein a theoretical and simulated test and a comparison with other methods using canonical datasets were carried out. Second, the low-cost prototype system composed of an ESP32 microprocessor module and an AD8232 ECG signal conditioning module is detailed, and the experimental tests conducted using a synthetic ECG wave produced with a Tektronix AFG1022 function generator are presented in the Section 3. The last section reports some conclusions and perspectives for future works. In the following sections, the following notation is used in general. A time domain signal is denoted as lowercase letters with discrete time in brackets, e.g., x [ n ] , x ^ [ n ] , e [ n ] ; lowercase or uppercase letters are for parameters, e.g., p is a positive integer as the order of LPC, a k are the scalars coefficients of the LPC filter, r k is the autocorrelation coefficients; s u p n [ n ] if for the supremum value of the sequence [ n ] ; μ 1 2 [ n ] is the median value of the sequence [ n ] .

2. Materials and Methods

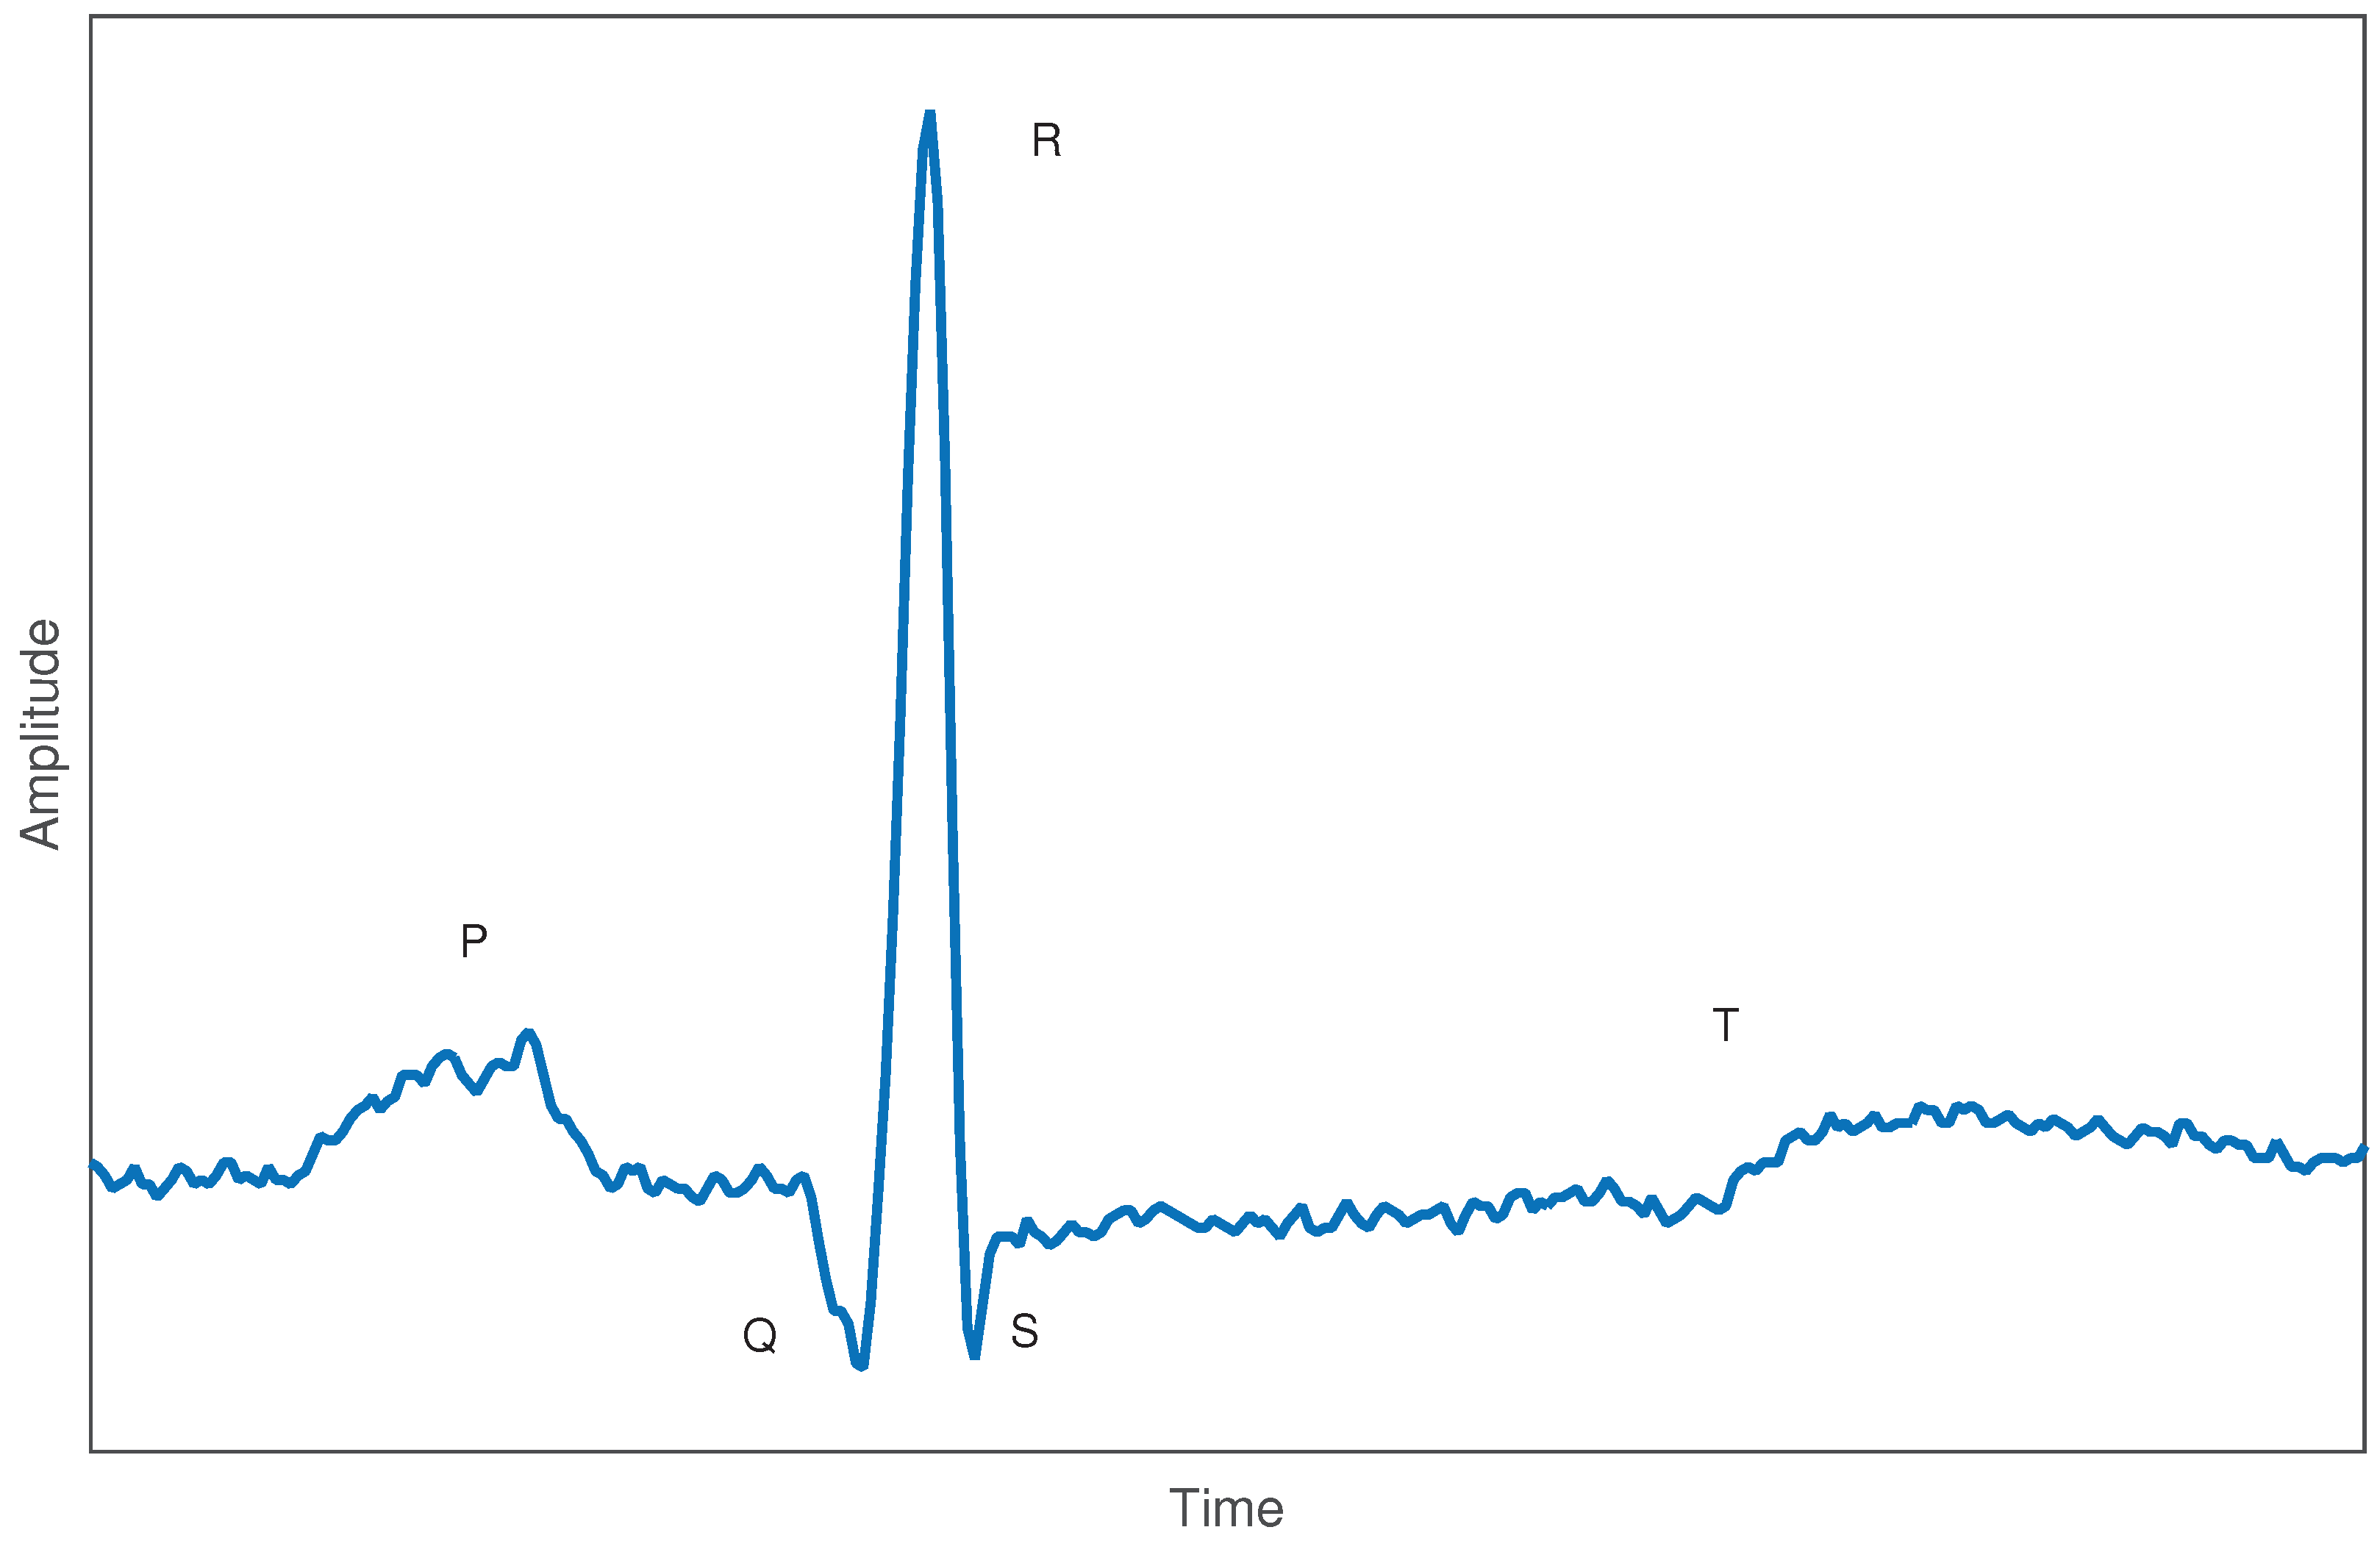
2.1. Electrocardiogram Signals

Figure 1 displays a typical example of an ECG signal. It carries information on biological changes in the heartbeat generated by a stimulus from the atrium and the ventricle. The signal presents three significant characteristics: the length given in seconds (or samples), the amplitude in millivolts, and morphology, from which it is possible to identify its waveform.
Figure 1 shows the main waves of the ECG signal: P wave, QRS complex, and T wave. The QRS complex comprises the Q, R, and S waves [27]. In most cases, cardiac events occur in these waves. For that, much research has focused on complex QRS. For example, QRS complex identification was successfully performed using a sparse representation approach in [28]. In the tests with the system, an AFG1022 Arbitrary Function Generator (TektronixTM, Beaverton, OR, USA) is used to give a reference ECG with a known set of cardiac frequencies, and the signals are then injected into the acquisition interface for real-time processing.

2.2. LPC—Linear Prediction Coefficients

The cornerstone concept of LPC is to express an optimal one-step-ahead prediction x ^ [ n ] of a discrete signal x [ n ] from its past p samples [29,30], whose difference equation is given by
x ^ [ n ] = k = 1 p a k x [ n k ] ,
in which a k are the coefficients of LPC and p is the order of the predictor.
The error of estimation e [ n ] is determined by
e [ n ] = x [ n ] x ^ [ n ] .
From Equations (1) and (2) can be rearranged as
e [ n ] = x [ n ] + k = 1 p a k x [ n k ] ,
whose linear prediction coefficients a k minimize the mean square of error e [ n ] . It can be found by applying Equation (4):
a 1 a 2 a p = r 0 r 1 r p 1 r 1 r 2 r p 2 r p 1 r p 2 r 0 1 r 1 r 2 r p ,
where correlation coefficients r k are given as
r k = i = 0 N 1 k x i [ n ] x k + i [ n ] .
The error signal e [ n ] is responsive to sudden variations in the signal x [ n ] due to its high-pass behavior, as can be deduced by applying Z -Transform to error e [ n ] (3) ( H ( z ) = E ( z ) X ( z ) = Z e [ n ] Z x [ n ] ; notice that from Equation (2), one has Z e [ n ] = X ( z ) + k = 1 p a k z k X ( z ) , then Equation (6) holds).
H ( z ) = E ( z ) X ( z ) = 1 + k = 1 p a k z k .
In the next section, this property is used to estimate the heartbeat.

2.3. LPC: Heart Rhythm Estimation

Most research on characteristic extraction of ECG signals primarily focuses on the QRS complex. This paper proposes using an LPC-based method to locate the instants when the QRS complex occurs, with a particular interest in the R-R interval.
To understand the approach, consider the discrete-time ECG signal x [ n ] , whose samples can be predicted from the signal x ^ [ n ] obtained by the 4th-order (p = 4) LPC model (1). From the difference x [ n ] x ^ [ n ] , the error e [ n ] is computed. It is susceptible to high-frequency components and, consequently, to the inrush variations of the signal level within the QRS complex. Then, a threshold-based search can be easily applied to e [ n ] to retrieve heart rhythm information. Since the error signal carries only high frequency in this band, the offset drift caused by spurious interference and even possible T wave prominence and other artifacts that can affect the ECG captured signal are absent. Then, the threshold logic detection of the peaks tends to be effective.
The choice of a reasonable detection threshold has some level of subjectivity [31]. However, for a given sorted sequence in ascending order of the normalized absolute value of the error:
e ˜ [ n ] = | e [ n ] | sup n | e [ n ] | ,
is acceptable to discard the 10% higher values of the samples in e ˜ [ n ] , resulting in a truncated sequence, e ˜ t [ n ] . Considering that this resultant sequence gives the spiking events a good prominence, a reference to the threshold value can be computed using the median μ 1 2 :
L = μ 1 2 ( e ˜ t 2 [ n ] ) .
And finally, it is possible to consider an adequate calibration for the threshold:
D = β L , β > 0 .
For example, a good value for the parameter β considering use with the MIT database was obtained as β = 6 .
The m k sample is then considered an event to be marked if the condition e ˜ [ m k ] D is verified. For each of two consecutive marked samples m 1 and m 2 with m 2 m 1 = N , the heart rhythm H R in beats per minute (bpm) can be estimated as:
H R = 60 f s N ,
where f s is the sampling frequency in hertz. In Figure 2, a summary of this procedure is displayed.
For example, in Figure 3a, an excerpt from an ECG signal from the MIT database with baseline correction is displayed in the basal state and also contaminated with wanderer and drift spurious signals. Figure 3b shows a similar pattern for the normalized squared error.
On the choice of LPC filter order, a signal reconstruction test is performed with an excerpt containing 600 samples, with a sampling frequency of 300 Hz taken from an ECG from Physionet. The excerpt used and the error variance as a function of the order is depicted in Figure 4. One can observe that orders p higher than four do not significantly improve the error variance. The high-pass nature of the LPC filter for p = 4 is shown in Figure 5.

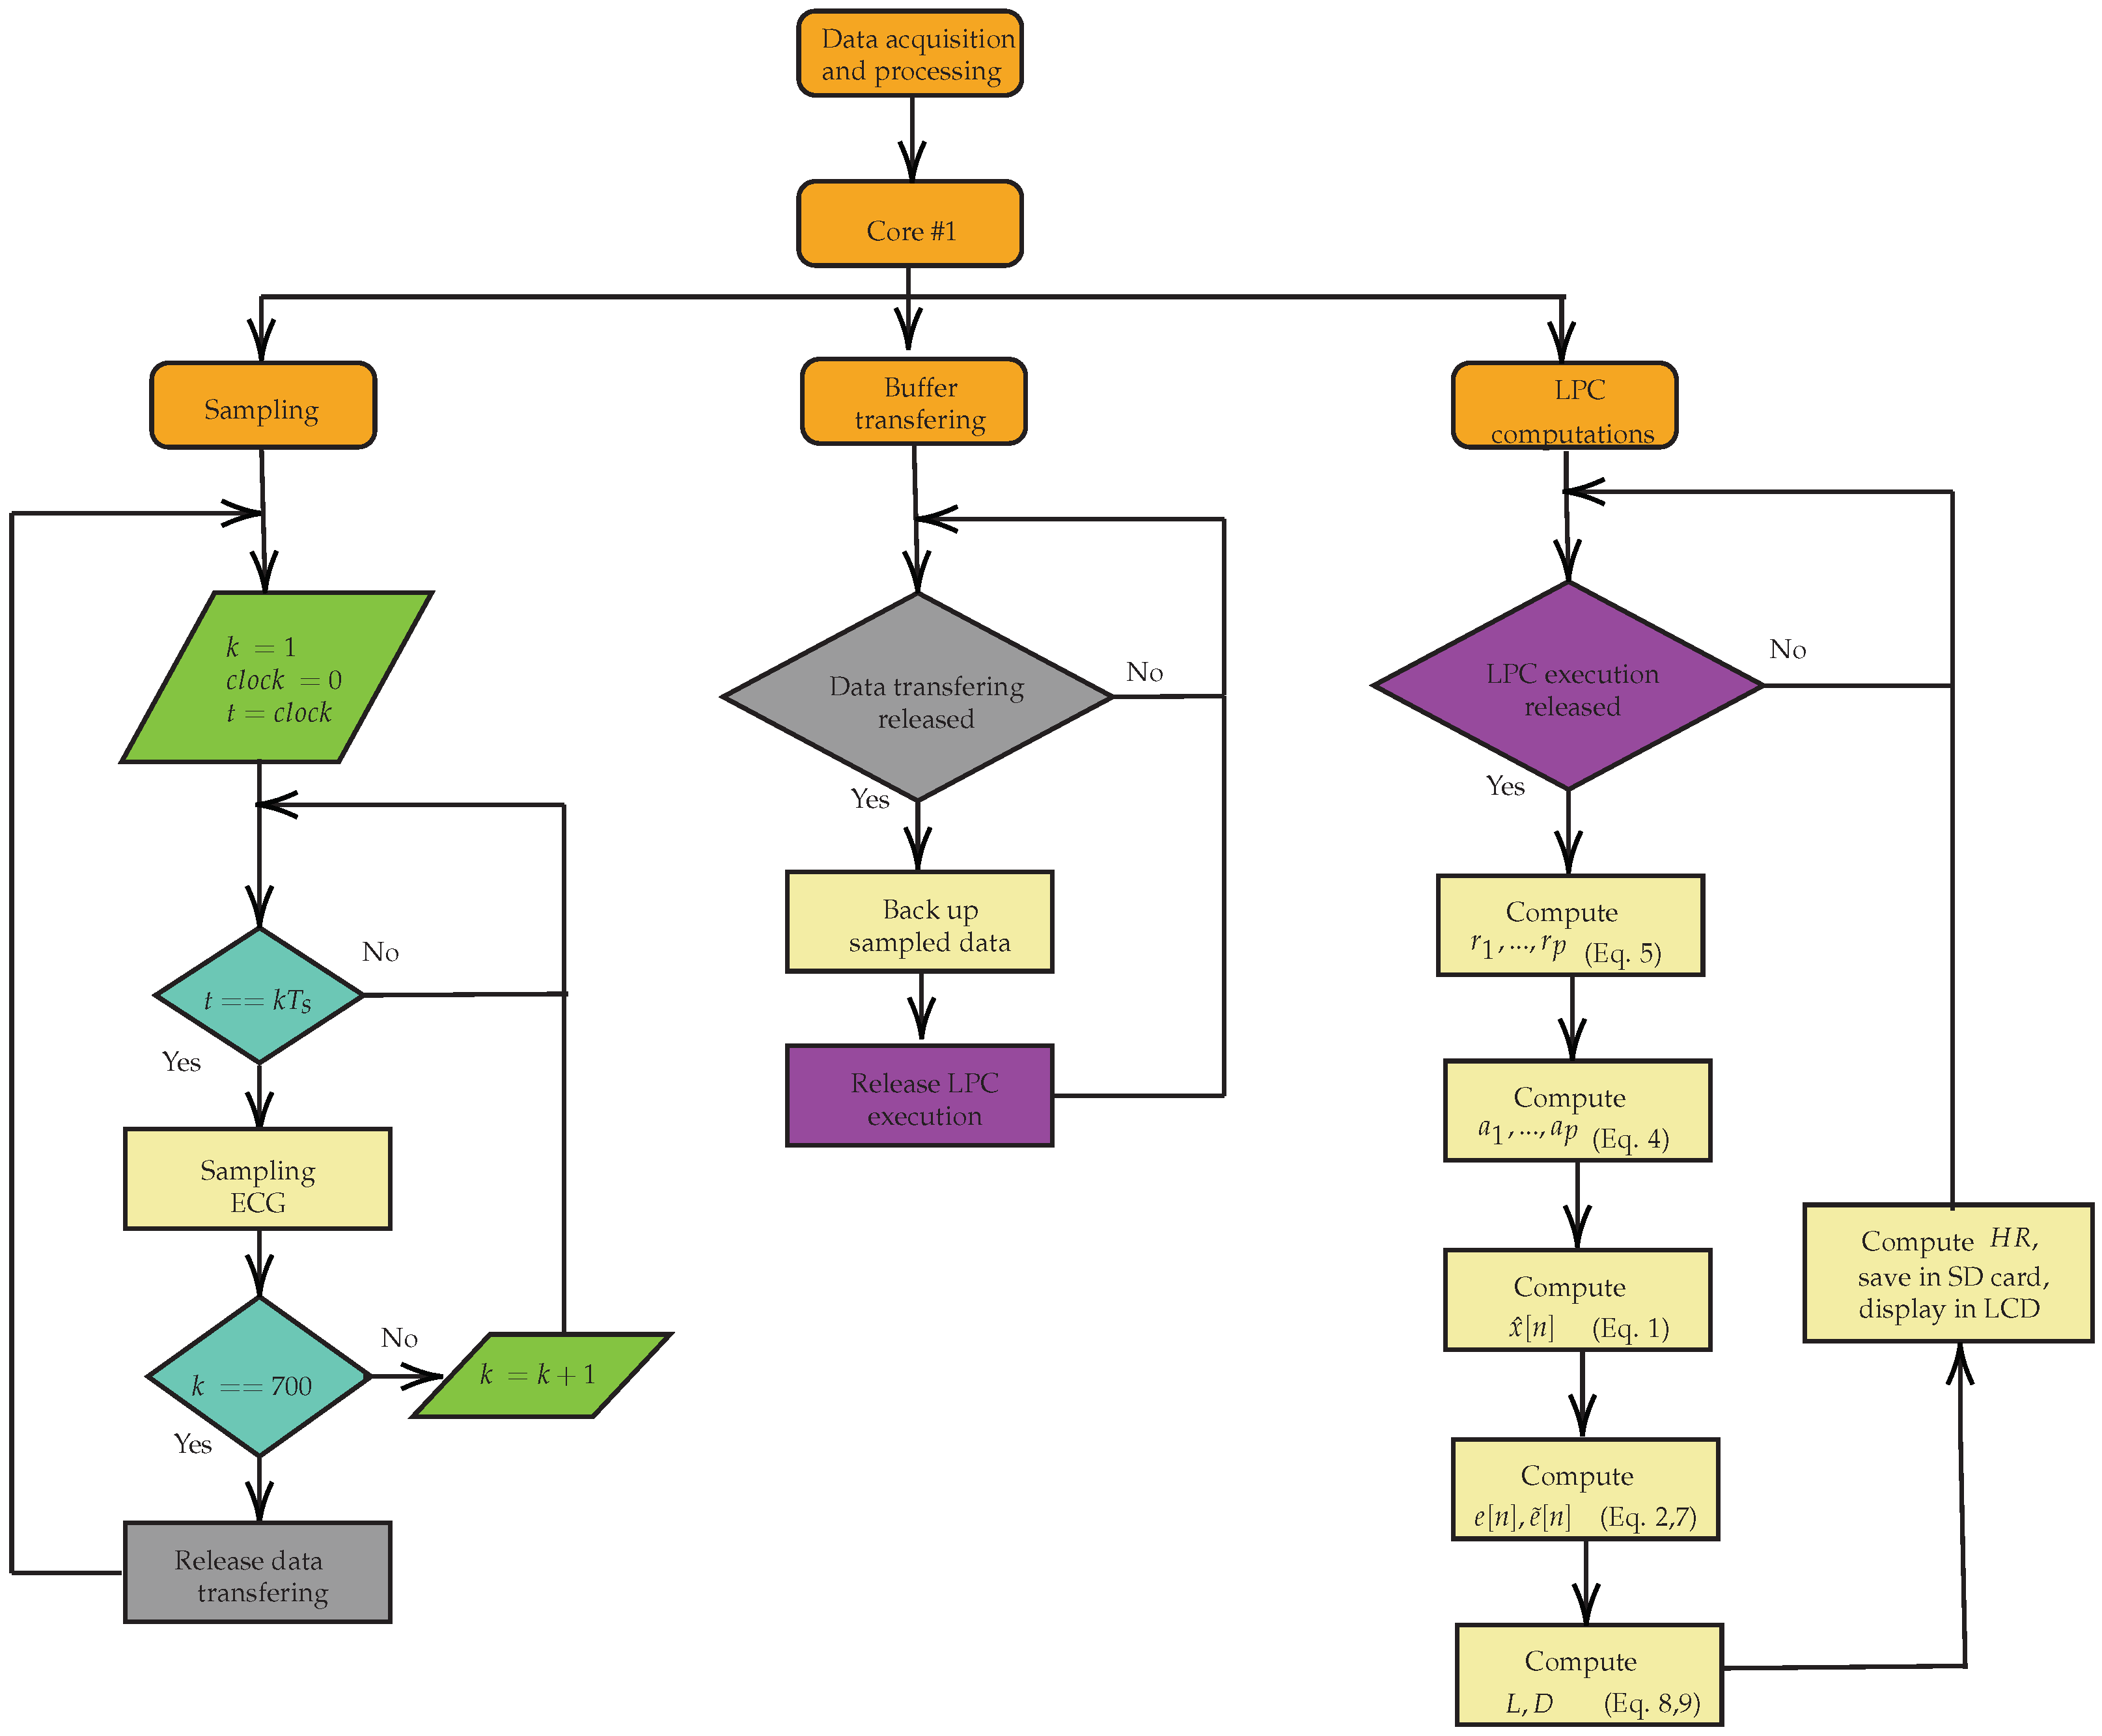
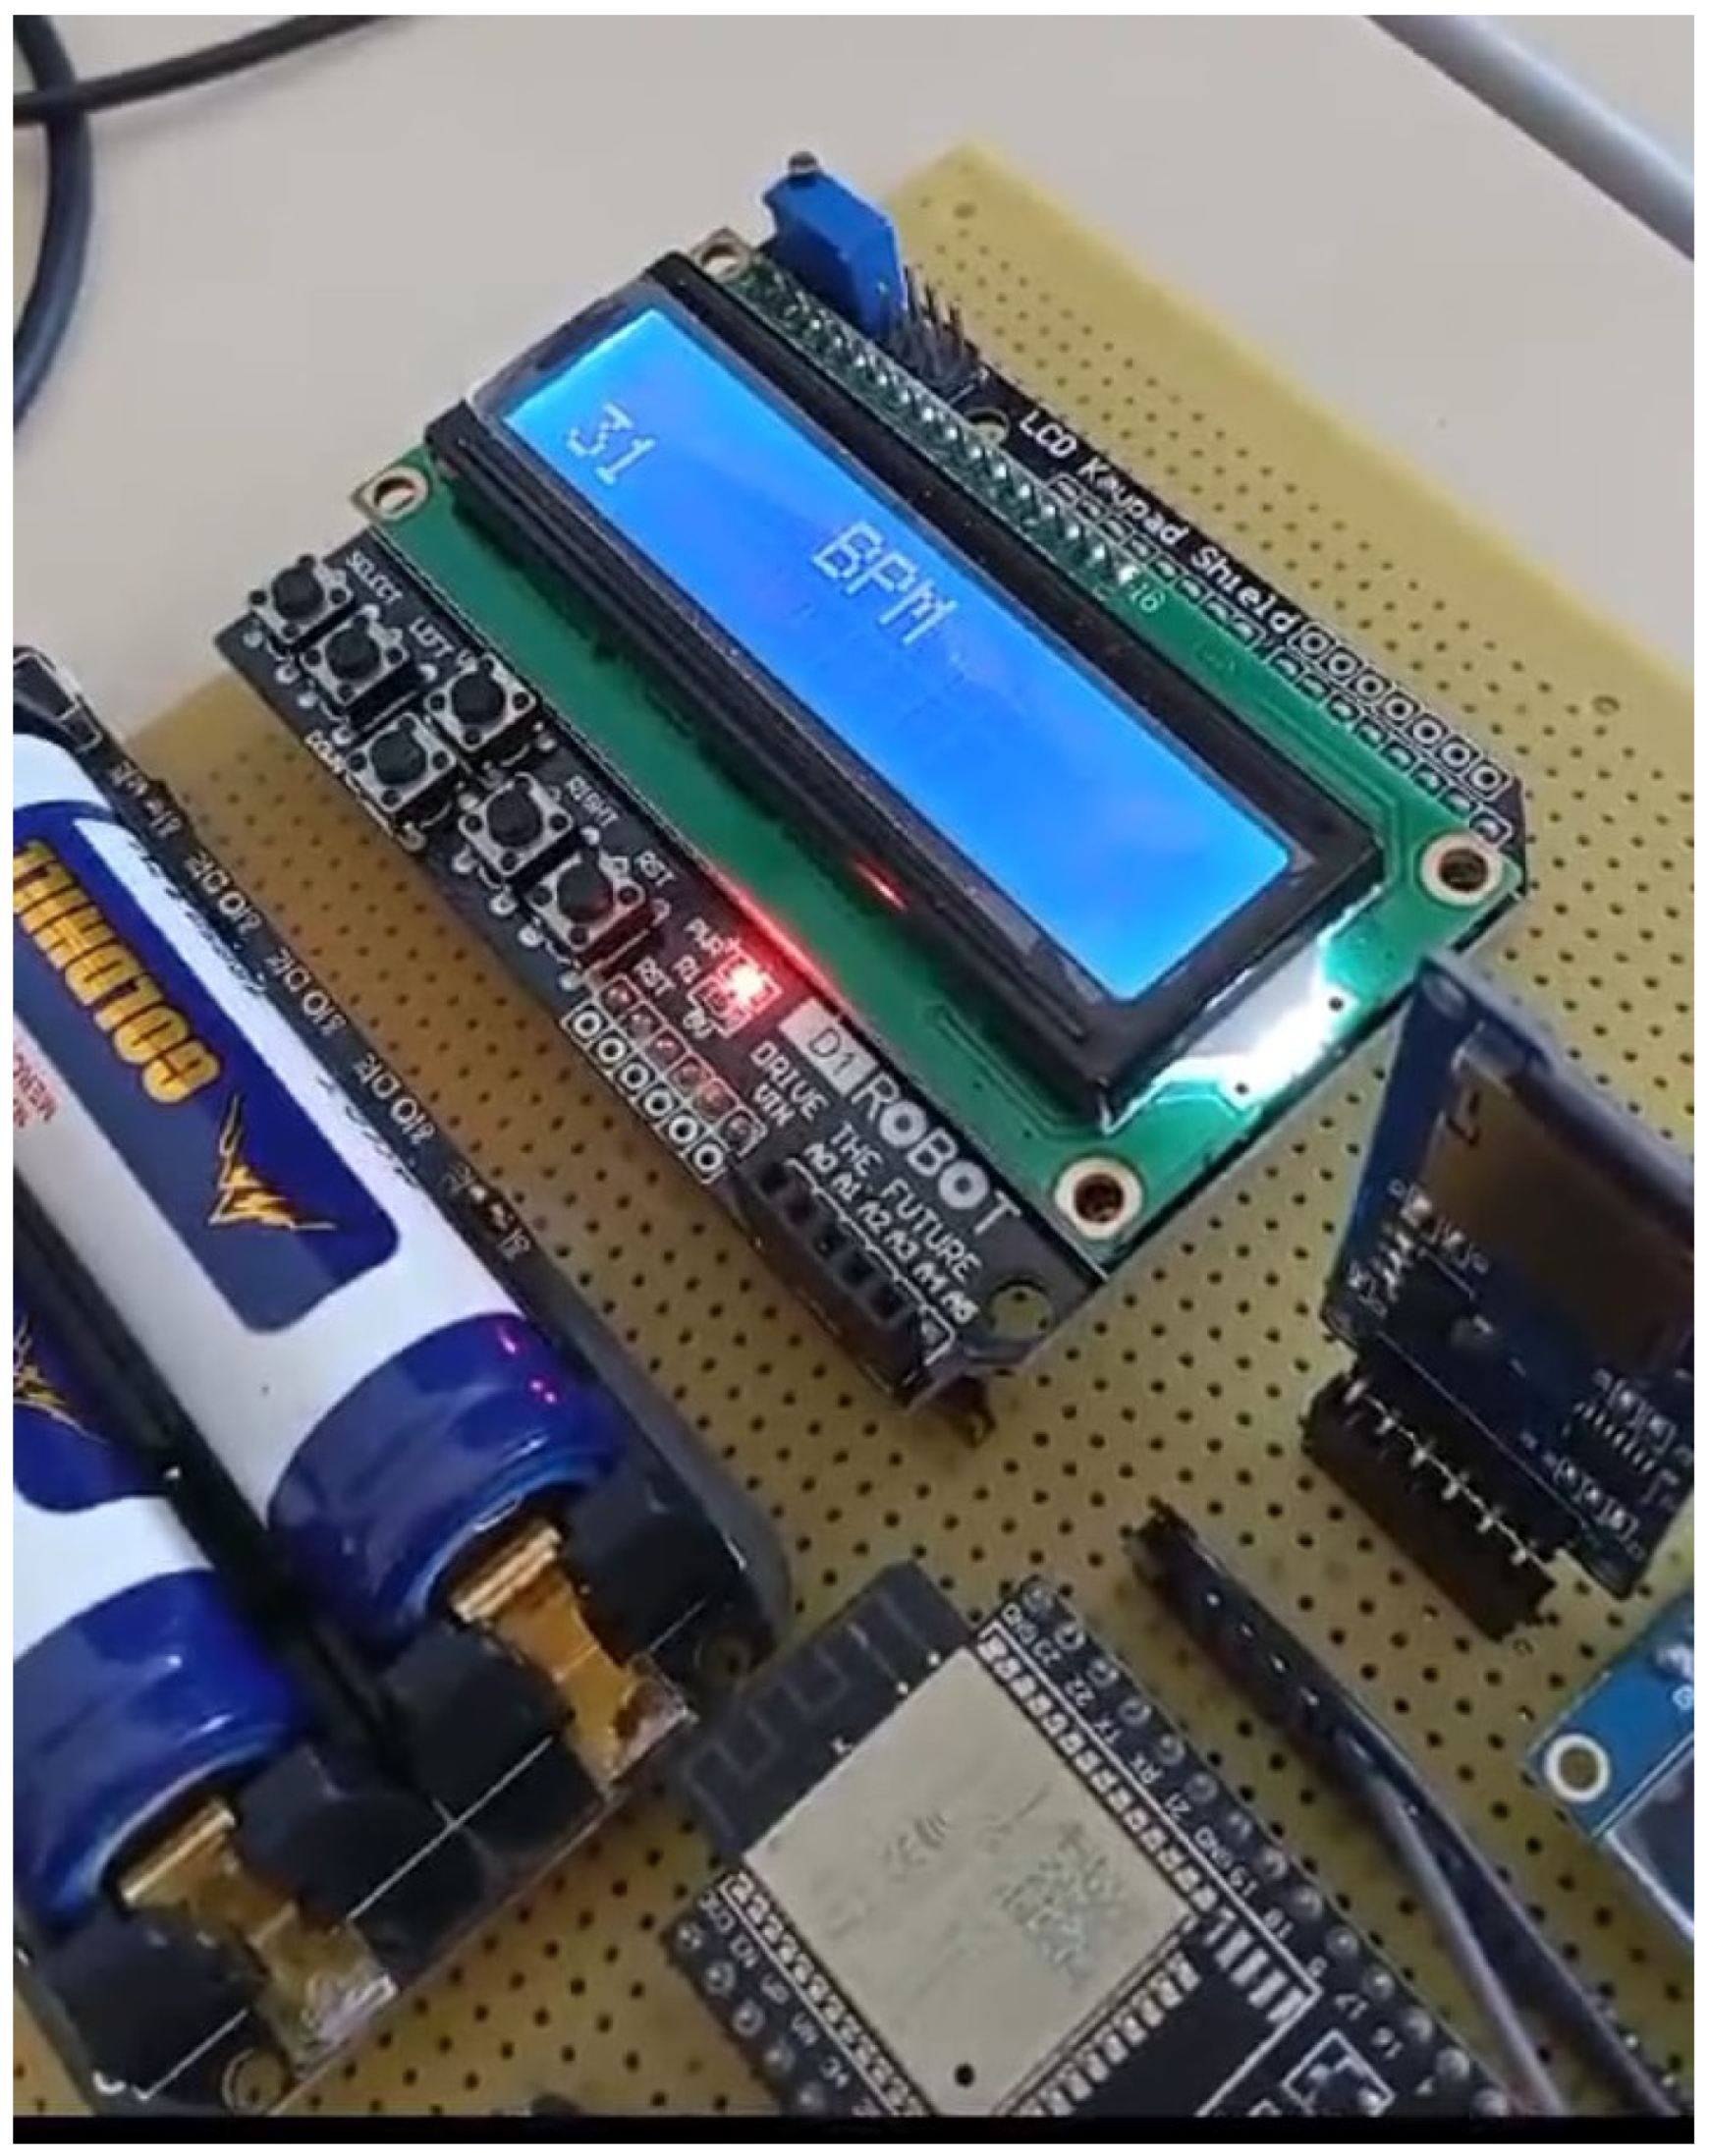
2.4. Experimental Setup

Having understood the dynamics of the ECG signal and the technological trends in their diagnosis, the system specification was initiated according to the classification of [32], characterized as a single-lead system for outpatient/home medical application, to diagnose diseases at low cost, identifying itself as a smart system due to the use of IoT, cloud and artificial intelligence (AI) technologies. Based on the analyses of traditional ECG systems and Smarts Health Care presented in [33,34] and considerations on the form of data acquisition and preprocessing (filtering, resampling, and normalization), some functional requirements were established:
  • Sampling rate 250 samples/s and 12-bit resolution;
  • Use of instrumentation amplifier;
  • 0.5 to 40 Hz bandpass filter or a high-pass filter together with a low-pass filter;
  • Notch filter at 60 Hz;
  • Use of processor compatible with the implementation;
  • Use of 1 GB microSD card electronics;
  • Use of LCD, TFT or OLED screen;
  • Use of charge control electronics for lithium-ion batteries.
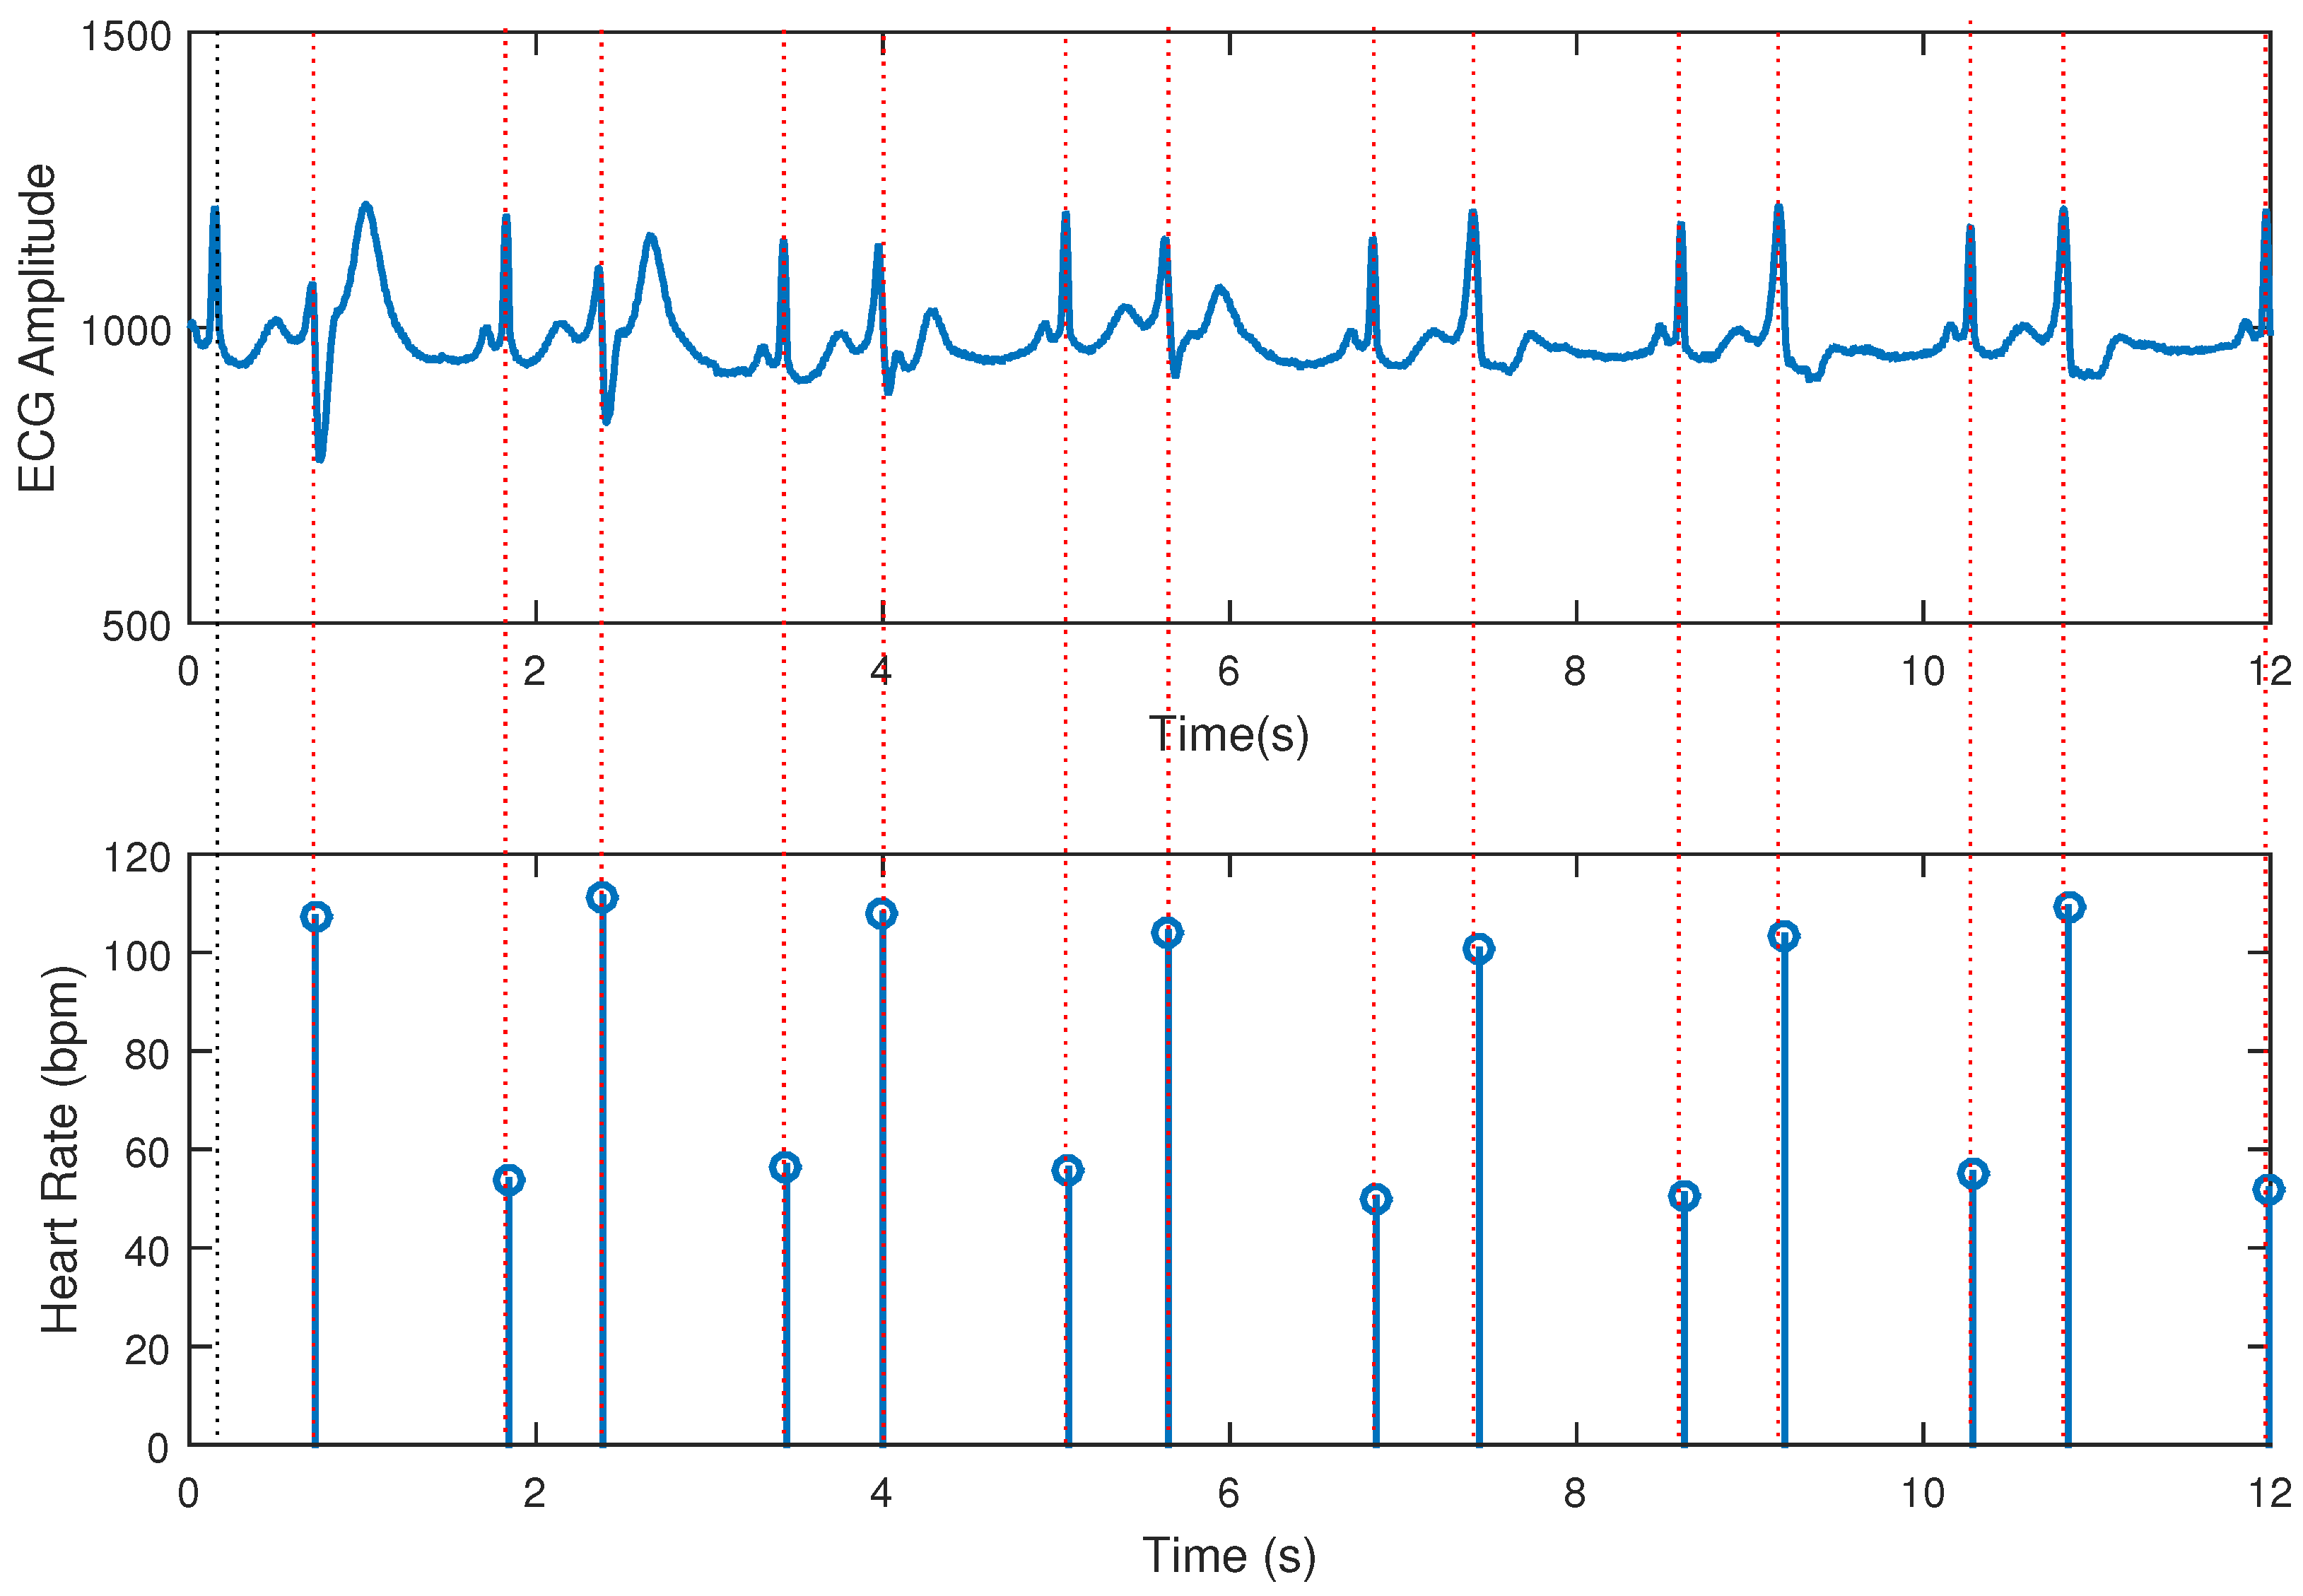
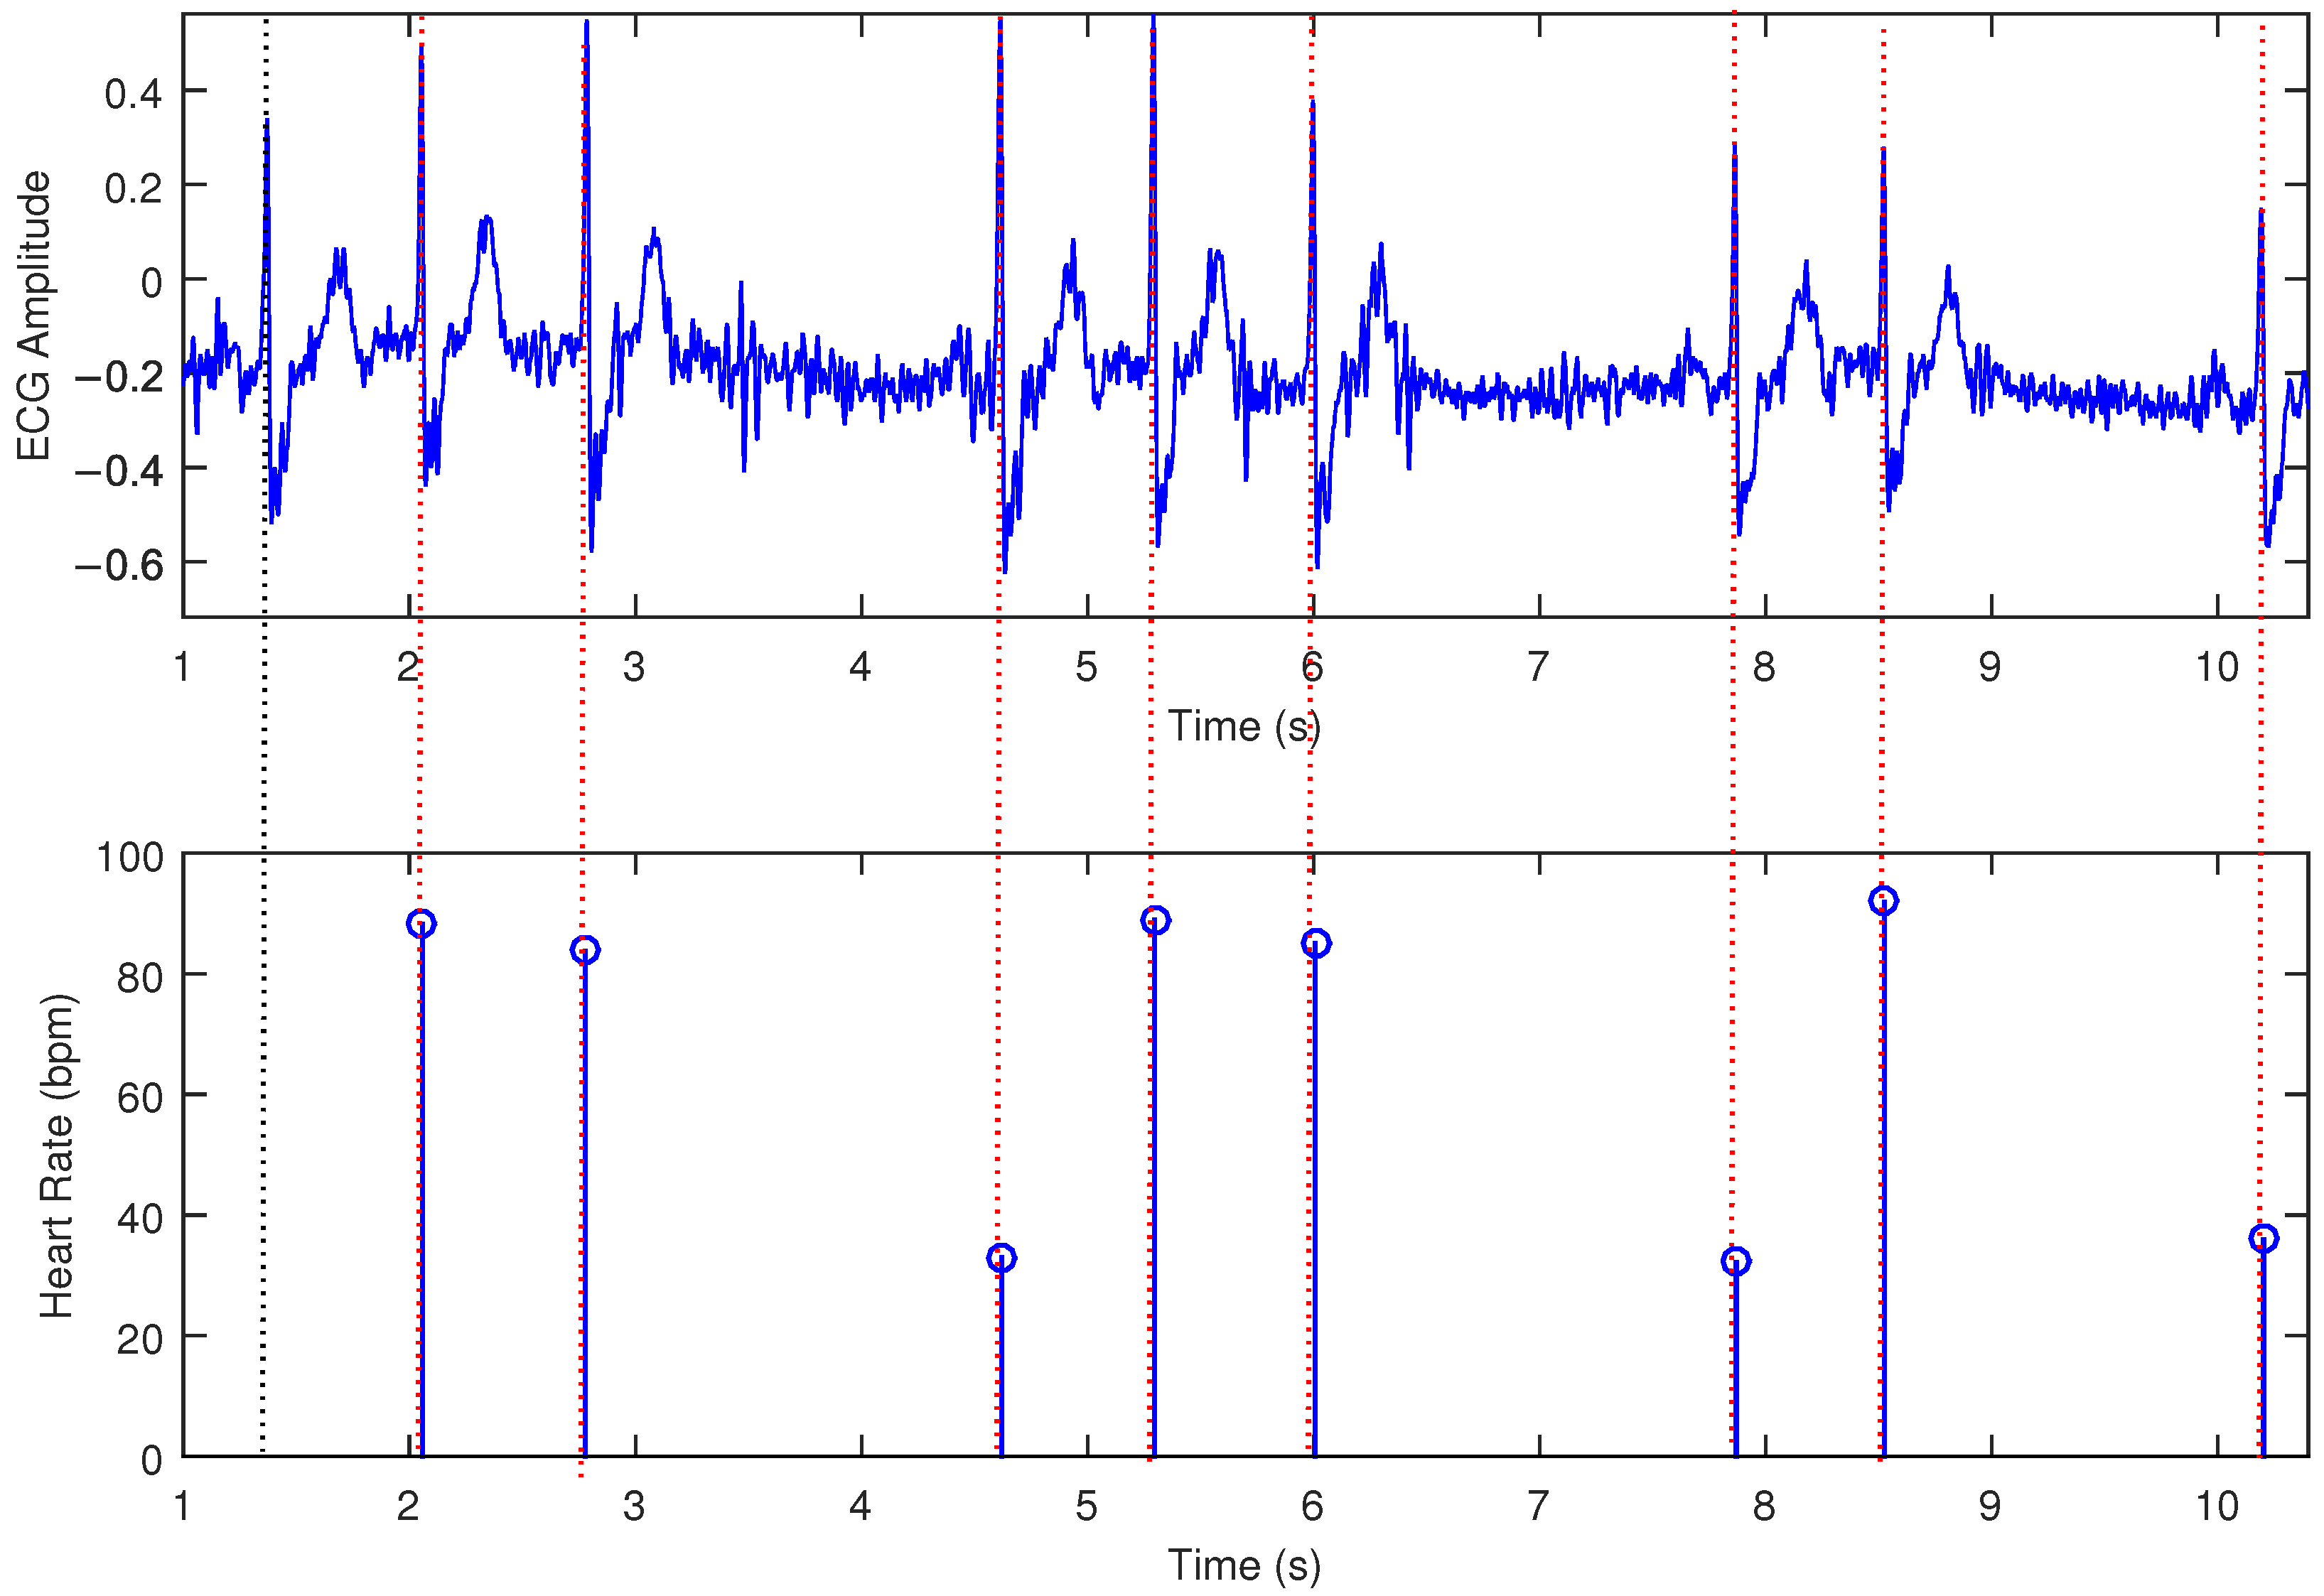
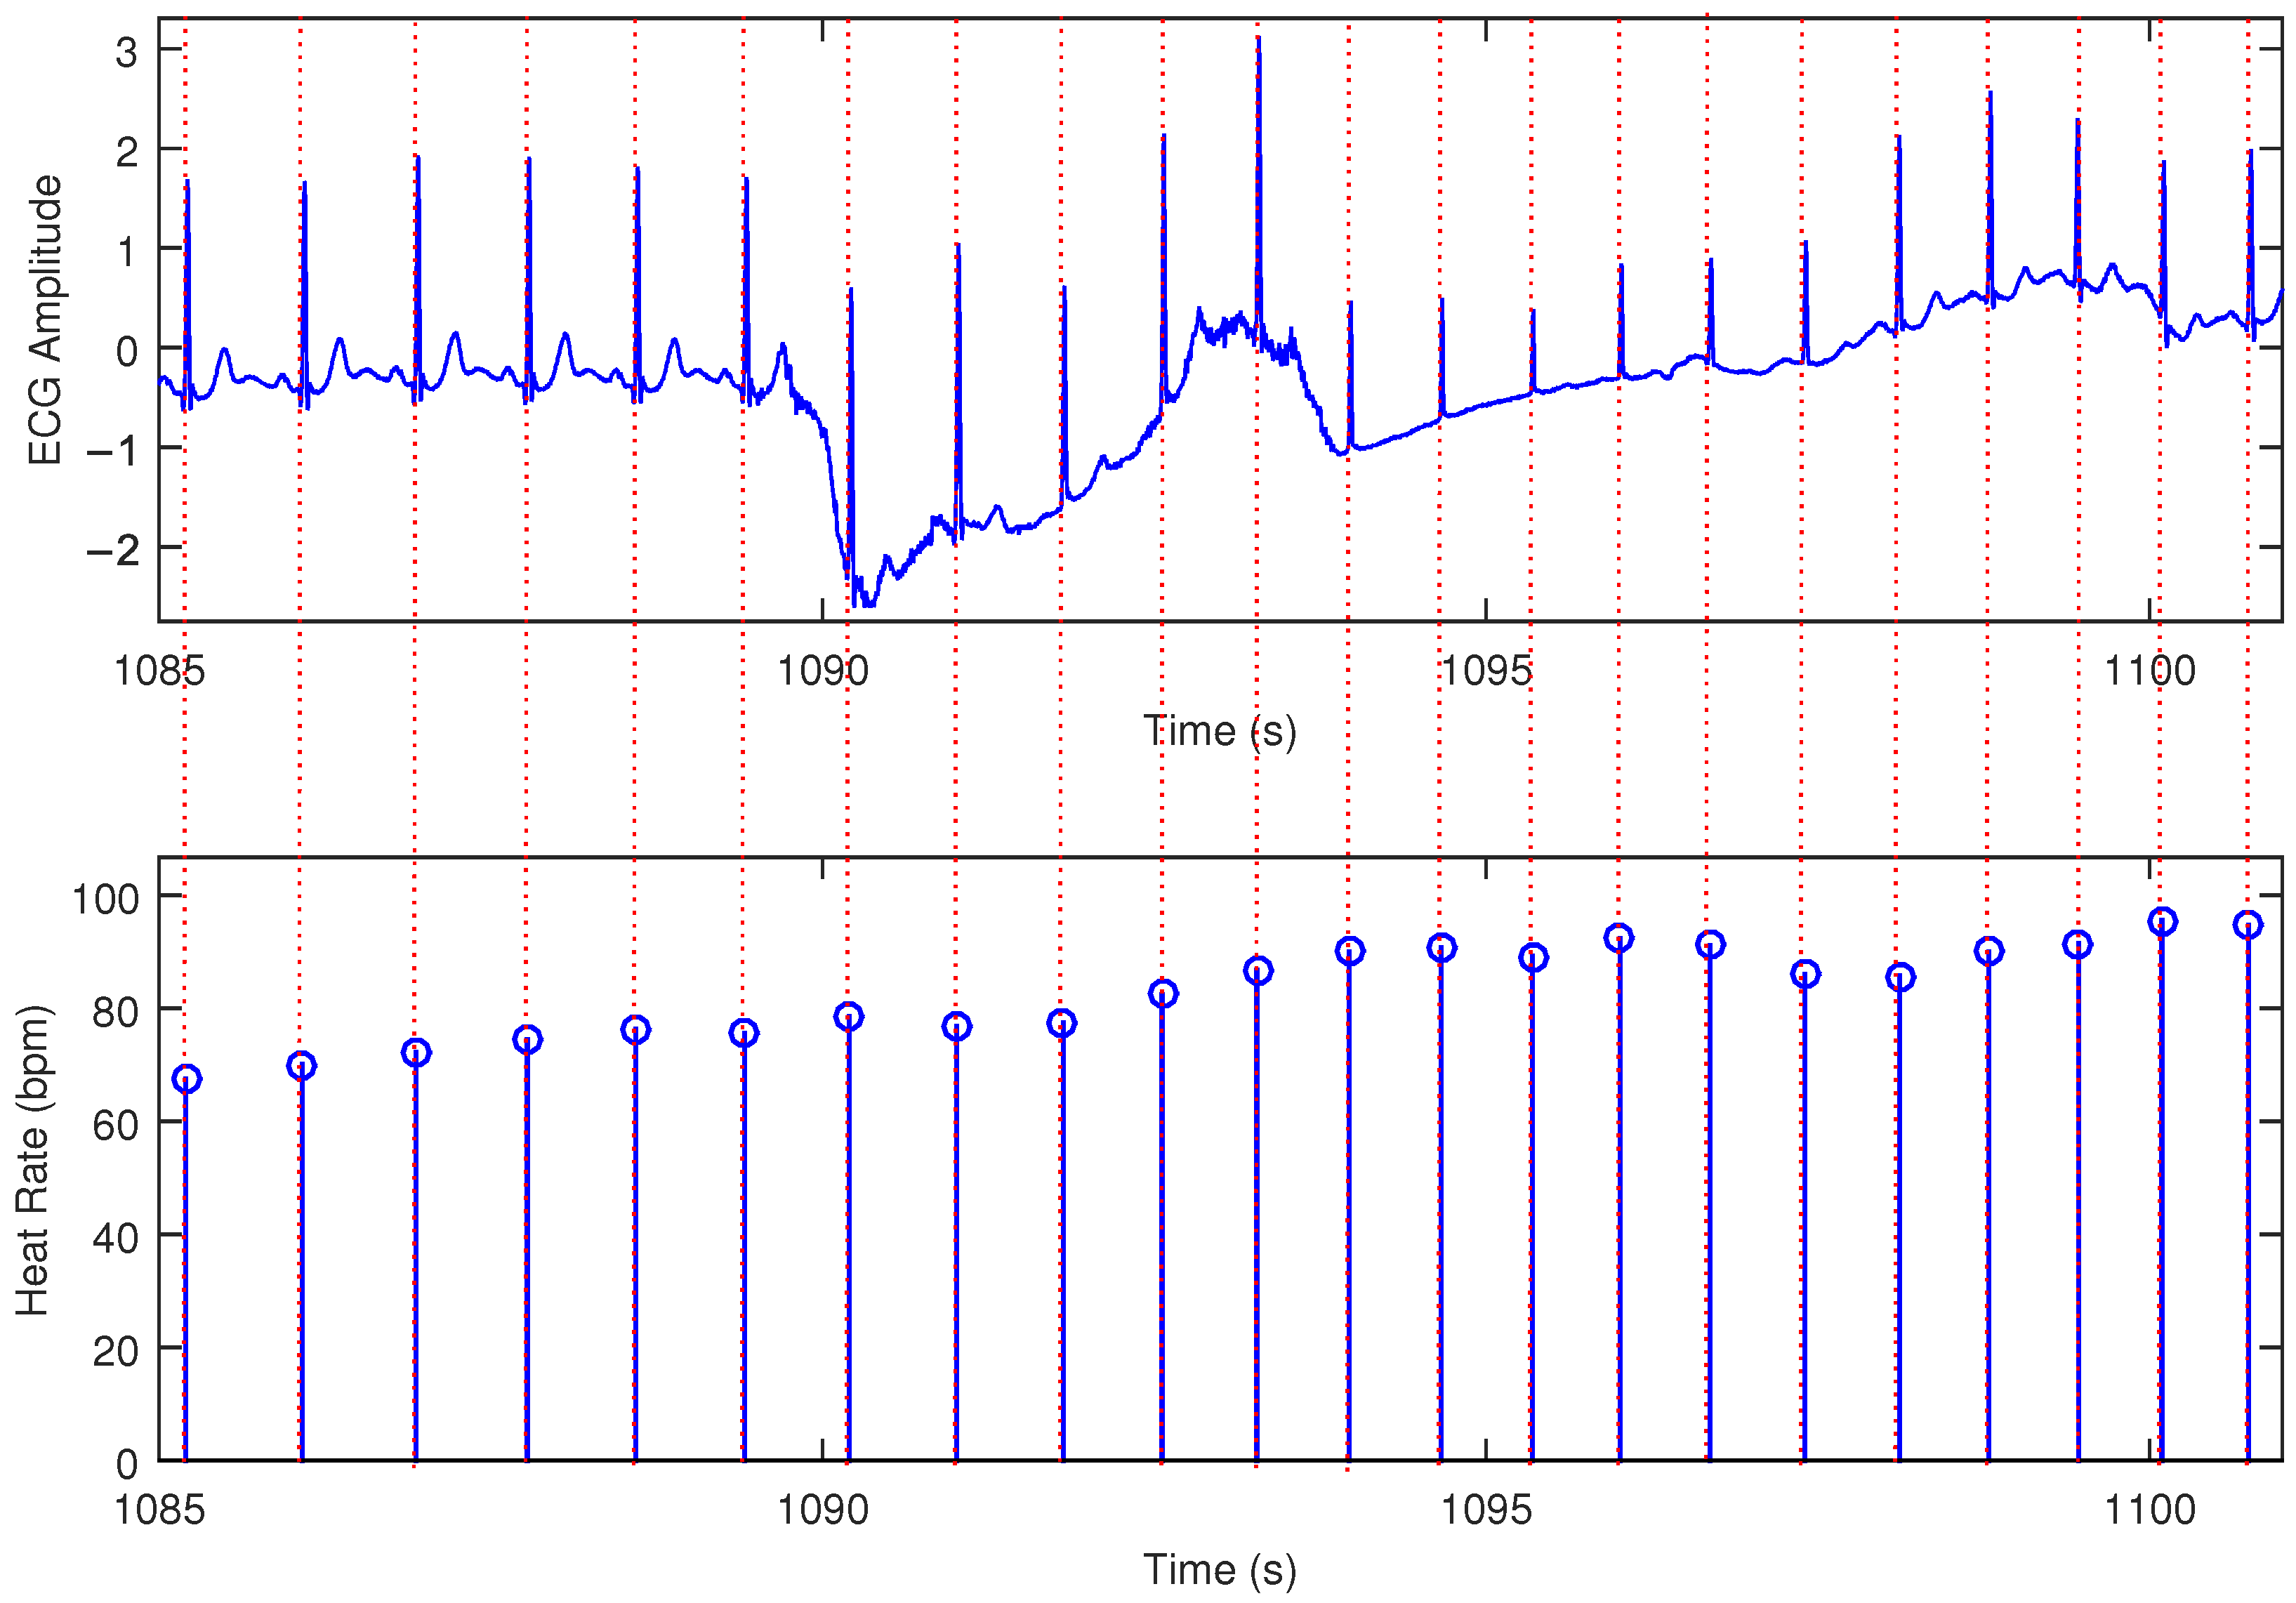
Silver and silver chloride (Ag/AgCl) electrodes and a Sparkfun AD8232 (Analog DevicesTM, Beaverton, OR, USA) single-lead heart rate monitor module, illustrated in Figure 6, can be used for data acquisition and preprocessing. This electrode type was chosen because it is easy to find and because of its low price. The Sparkfun AD8232 module is an electronic board based on the Analog Devices AD8232 integrated circuit that is designed to extract, amplify, and filter small biopotential signals in the presence of noisy conditions, such as those created by motion or remote electrode placement. The configuration implemented in Sparkfun’s AD8232 is to obtain an ECG waveform with minimal distortion, with a second-order high-pass filter and cutoff frequency of 0.5 Hz followed by a second-order low-pass filter and cutoff frequency of 40 Hz with the use of a third electrode for optimal common-mode rejection (https://cdn.sparkfun.com/datasheets/Sensors/Biometric/AD8232.pdf, accessed on 18 March 2025). Since a 60 Hz notch filter is not implemented via hardware in the module, it was digitally implemented in the code.
The hardware development (processing) platform chosen to execute the project was the ESP32-DevKit of Figure 7, a small ESP32-based development board produced by Espressif. The ESP32 (EspressifTM, Shangai, China) is a unique integrated circuit that combines 2.4 GHz Wi-Fi and Bluetooth technologies (https://www.espressif.com/en/products/socs/esp32, accessed on 18 March 2025) and has a 32-bit 240 MHz single/dual-core Xtensa processor (EspressifTM, Shangai, China), 448 KB ROM, 520 KB SRAM, 16 KB SRAM in RTC, QSPI supporting multiple flash/SRAM chips, 34 GPIOs, 4 SPI, 2 I2S, 2 I2C, 3 UART, 1 host (SD/eMMC/SDIO), 1 slave (SDIO/SPI), TWAI®, RMT (TX/RX), PWM Motor, PWM LED, 12-bit ADC, 2 8-bit DAC, Wifi IEEE 802.11b/g/n (up to 150 Mbps) and Bluetooth v4.2 BR/EDR and BLE. Its choice was based on the relatively low cost of the platform, reasonable processing power, and the availability of integrated Wi-Fi Bluetooth communication, which allows ease of programming and reduction in the prototype size. Although the ESP32 does not have Digital Signal Processor (DSP) functions, the literature shows that it performs well for implementations in ECG signals [35,36].
The selected solution for the HMI was DFRobot LCD Keypad Shield (https://wiki.dfrobot.com/LCD_KeyPad_Shield_For_Arduino_SKU__DFR0009, accessed on 18 March 2025) displayed in Figure 8. It is a module that allows the development of a navigable interface. It consists of a 16 × 2 white character LCD with blue backlight and five keys that allow selection, up, right, down, and left. Initially, the system only showed the heart rate value calculated using the LPC method, but a menu could be developed in future versions.
The system is powered by a shield for charging two 18650 lithium-ion batteries, as illustrated in Figure 9. It features output voltages of 5 volts (2 amps) and 3.3 volts (1 amp), as well as battery overcharge and over-discharge protection. Additionally, it includes 0.5 amp USB (Micro, C) connectors and LED indicators for charging and full charge status.
MATLAB v24.1 (Matrix Laboratory) is a programming and numerical computing platform for analyzing data, developing algorithms, and creating models that combine an environment tailored for interactive analysis and design processes with a programming language expressed in matrix and array mathematics (https://www.mathworks.com/, accessed on 18 March 2025). It validates the LPC frequency estimation algorithm before deploying the code in the ESP32-Dev-Kit.
The firmware implementation is performed through Arduino v2.0 IDE, which uses a C++ programming language with some modifications. This choice was based on ease of use, availability of sample codes, and libraries for accessing peripherals.
An AFG1022 Arbitrary Function Generator (TektronixTM, Beaverton, OR, USA), illustrated in Figure 10, which can emulate an ECG signal, was used in the system validation. The system was evaluated by generating ECG signals at heart rates of 30, 60, 120, and 180 beats per minute. The heart rate was estimated using 100 cardiac cycles per frequency, and performance was assessed by calculating the accuracy.

3. Results

The main code for LPC computations was tested in a MATLAB v24.1 function using excerpts of signals from the MIT or PhysioNet databases [37,38], and the obtained results were quite plausible. For example, Figure 11 displays a test with a bigemy-affected ECG excerpt from the MIT database. Notice the presence of a DC level in the ECG signal for this case. The algorithm successfully captured the instantaneous heart rate, as evident in the stem plot of heartbeat events. Next, we test an example of an ECG with arrhythmia containing substantial noise. The result is displayed in Figure 12, and again, one can see the LPC approach’s effectiveness in tackling this kind of artifact. Finally, the algorithm was tested with a signal containing an evident motion artifact. As in the preceding tests, one can see in Figure 13 that the approach is robust to various signal acquisition disturbances.
The developed hardware is based on the block diagram shown in Figure 14. The system consists of an ESP32 microprocessor module that reads the signal from the AD8232 ECG signal conditioning module, executes the LPC algorithm to determine the heart rate, presents the data on an LCD, and saves the data to an SD card, in addition to a charge control module for 18650 lithium-ion batteries and a voltage source of 3.3 and 5 volts. Capacitors of 2.2 μ F and 10 μ F were placed near the power pins of the ESP32 and AD8232 modules to eliminate possible 60 Hz noise. During processing, the hardware consumption is a current of 175 mA at a voltage of 5.5 V, that is, a maximum power of 0.96 W , and a minimum autonomy with uninterrupted processing of approximately 14 h.
The developed firmware was based on the actions in the block diagram in Figure 15, Figure 16 and Figure 17. Figure 15 provides an overview of the code produced. The sequence of initial configurations of internal and external peripherals used, of parallel processing in two cores, and of digital filters is shown in Figure 16.
The Acquisition and Processing block of Figure 15 is detailed in Figure 17. Core 0 was reserved for future processing of the Wi-Fi communication, and the other tasks were executed in Core 1. The ECG signal acquisition and filtering activities were assigned to a parallel processing task executed within a time interval of 4 milliseconds, providing a sampling rate of 250 samples per second. A 60 Hz digital notch filter and a second-order low-pass digital filter with a cutoff frequency of 500 Hz are applied to the signal. Upon reaching 600 acquired samples, another task is enabled from a semaphore, and the transfer of these samples from the acquisition buffer to another begins, avoiding overwriting of this buffer during the processing of the heart rate determination algorithm. The LPC algorithm for estimating the heart rate with order p = 4 and displaying it on an LCD is only executed after enabling a semaphore at the end of the buffer sample transfer task. The flow control of the parallel processing was executed using the Free RTOS real-time operating system. The firmware and variables require 361,205 bytes (27%) of program storage space and 39,824 bytes (12%) of dynamic memory, respectively.
The ECG signal emulated by the function generator at a set of frequencies, 30, 60, 120, and 180 beats per minute, was used as excitation to the developed system. The result of the real-time processing of this signal by the LPC heart rate estimation algorithm is presented in Figure 18. The system was evaluated by generating ECG signals at these frequencies, and the heart rate was estimated using 100 cardiac cycles per batch; the performance was assessed by computing the accuracy compared to the true value. The generated signals were applied to the prototype for real-time accuracy tracking. In Table 1, the accuracy of the measured frequencies is presented, and the small standard deviation demonstrates that the instantaneous heart rate has been successfully estimated, as the waves have a fixed frequency.

4. Discussion

According to Table 1, the system’s operation is stable, and the heart rate measurement results showed accuracies between 98.87% (30 BPM) and 99.95% (120 BPM). For instance, at 30 BPM, 66 measurements were 30 BPM, and 34 were 29 BPM, resulting in a mean of 29.66 and an accuracy of 98.87%. These results were satisfactory compared to those obtained by [26], which reached accuracies between 98.18% and 100% using the same algorithm in a similar code for Matlab and with data from the MIT-BIH database and also reached accuracies between 42.47% and 97.02% using a code based on the Wavelet Transform [39]. In Table 2, a comparison of the presented method with some methods in the literature is illustrated.
A 100% accuracy was obtained in [41] for the correlation of heart rate (mean: 75.6 ± 16.4 beats/min) between a prototype and a lead I ECG from a standard 12-lead device used in a clinical setting. In [42], the measured heart rates obtained through a chest strap and a vest were compared with a gold standard reference (3-lead clinical Holter ECG), yielding accuracies of 99.21% and 96.28%, respectively, and mean absolute percentage errors (MAPEs) of 0.76% and 3.32%. An accuracy of 98.12% was obtained in measuring fetal heartbeats using a Powerlab DAC [40].

5. Conclusions

This paper presents a method and system for heart rate estimation using linear prediction filtering in an effective real-time firmware for instantaneous heart rate detection applications. The obtained experimental results are accurate and can be considered a proof of concept of a simulated, offline result previously obtained by the authors. The next steps of the work involve using the instantaneous heart rate measurement from the system to train a deep learning CNN-1D model for the automated diagnosis of heart diseases from captured real-time ECGs.

Author Contributions

Conceptualization, V.O.T.S., F.G.S.S., J.M.A. and J.S.L.; methodology, V.O.T.S., F.G.S.S., J.M.A. and J.S.L.; software, V.O.T.S. and J.S.L.; validation, V.O.T.S.; formal analysis, V.O.T.S., F.G.S.S. and J.M.A.; investigation, V.O.T.S., F.G.S.S., J.M.A. and J.S.L.; resources, J.M.A. and F.G.S.S.; data curation, V.O.T.S. and J.M.A.; writing—original draft preparation, V.O.T.S., F.G.S.S. and J.M.A.; writing—review and editing, V.O.T.S., F.G.S.S. and J.M.A.; visualization, V.O.T.S., F.G.S.S., J.M.A. and J.S.L.; supervision, F.G.S.S. and J.M.A.; project administration, F.G.S.S. and J.M.A.; funding acquisition, F.G.S.S. and J.M.A. All authors have read and agreed to the published version of the manuscript.

Funding

This research was partially funded by CNPq, grant number # 306178/2023-0, and the APC was funded by Instituto Federal da Bahia.

Data Availability Statement

The data presented in this paper can be provided by the authors upon reasonable request.

Conflicts of Interest

The authors declare that they have no conflicts of interest.

References

  1. Chaitanya, M.K.; Sharma, L.D.; Roy, A.; Rahul, J. A review on artificial intelligence for electrocardiogram signal analysis. In Big Data Analytics and Artificial Intelligence in the Healthcare Industry; IGI Global: Hershey, PA, USA, 2022; pp. 38–72. [Google Scholar]
  2. Précoma, D.B.; Oliveira, G.M.M.d.; Simão, A.F.; Dutra, O.P.; Coelho, O.R.; Izar, M.C.d.O.; Póvoa, R.M.d.S.; Giuliano, I.d.C.B.; Alencar, A.C.d.; Machado, C.A.; et al. Atualização da diretriz de prevenção cardiovascular da Sociedade Brasileira de Cardiologia. Arq. Bras. Cardiol. 2019, 113, 787–891. [Google Scholar] [PubMed]
  3. Stevens, B.; Pezzullo, L.; Verdian, L.; Tomlinson, J.; George, A.; Bacal, F. Os custos das doenças cardíacas no Brasil. Arq. Bras. Cardiol. 2018, 111, 29–36. [Google Scholar]
  4. Oliveira, G.M.M.d.; Brant, L.C.C.; Polanczyk, C.A.; Malta, D.C.; Biolo, A.; Nascimento, B.R.; Souza, M.d.F.M.d.; Lorenzo, A.R.D.; Fagundes Júnior, A.A.d.P.; Schaan, B.D.; et al. Estatística Cardiovascular–Brasil 2021. Arq. Bras. Cardiol. 2022, 118, 115–373. [Google Scholar] [CrossRef] [PubMed]
  5. Kruse, C.S.; Soma, M.; Pulluri, D.; Nemali, N.T.; Brooks, M. The effectiveness of telemedicine in the management of chronic heart disease—A systematic review. JRSM Open 2017, 8, 2054270416681747. [Google Scholar] [CrossRef]
  6. Zhu, Y.; Gu, X.; Xu, C. Effectiveness of telemedicine systems for adults with heart failure: A meta-analysis of randomized controlled trials. Heart Fail. Rev. 2020, 25, 231–243. [Google Scholar] [CrossRef]
  7. Amaral, F.; Fernandes, E.; Drabowski, N.; Alves, M.; Nunes, A.; da Silva, E.; Bastos, M.; Romera, J.; de Castro Figueroa, R. Estudo de caso de Tarumã: O uso de telemedicina e Inteligência Artificial para redução da mortalidade por doenças cardíacas e otimização dos recursos em saúde. Scielo 2022, Preprints. [Google Scholar] [CrossRef]
  8. Salgueiro, A.T.F. Detecção de Problemas Cardíacos Usando Sinais de Electrocardiograma (ECG). Master’s Thesis, Universidade de Coimbra, Coimbra, Portugal, 2020. [Google Scholar]
  9. Andrade, M.V.; Maia, A.C.; Cardoso, C.S.; Alkmim, M.B.; Ribeiro, A.L.P. Custo-benefício do serviço de telecardiologia no Estado de Minas Gerais: Projeto Minas Telecardio. Arq. Bras. Cardiol. 2011, 97, 307–316. [Google Scholar] [CrossRef]
  10. Ktata, F.; Ben Kalboussi, K. Real Time Mobile E-Health Platform for Vital Signals Monitoring and ECG Classification Using 1D CNN; Research Gate Preprint. 2021. Available online: https://www.researchgate.net/publication/358921899_Real_time_mobile_E-Health_platform_for_vital_signals_monitoring_and_ECG_classification_using_1D_CNN (accessed on 18 March 2025).
  11. Shaker, A.M.; Tantawi, M.; Shedeed, H.A.; Tolba, M.F. Heartbeat Classification Using 1D Convolutional Neural Networks; Springer International Publishing: Berlin/Heidelberg, Germany, 2020; pp. 502–511. [Google Scholar]
  12. Falhi, H.M.; Hussain, K.K. Design an Intelligent Real Time ECG Monitoring System Using Convolution Neural Network. Revue d’Intell. Artif. 2023, 37, 323. [Google Scholar] [CrossRef]
  13. Ardhapurkar, S.; Manthalkar, R.; Gajre, S. Electrocardiogram compression by linear prediction and wavelet sub-band coding techniques. In Proceedings of the 2011 Computing in Cardiology, Hangzhou, China, 18–21 September 2011; pp. 141–144. [Google Scholar]
  14. Bazzi, A.; Slock, D.T.M.; Meilhac, L. A Newton-type Forward Backward Greedy method for multi-snapshot compressed sensing. In Proceedings of the 2017 51st Asilomar Conference on Signals, Systems, and Computers, Pacific Grove, CA, USA, 29 October–1 November 2017; IEEE: Piscataway, NJ, USA, 2017; pp. 1178–1182. [Google Scholar] [CrossRef]
  15. Hassan, A.M.A.; Mohsen, S. Compression of electrocardiogram signals using compressive sensing technique based on curvelet transform toward medical applications. Multimed. Tools Appl. 2024. [Google Scholar] [CrossRef]
  16. Schirato, S.R.; El-Dash, I.; El-Dash, V.; Natali, J.E.; Starzynski, P.N.; Chaui-Berlinck, J.G. Heart rate variability changes as an indicator of decompression-related physiological stress. Undersea Hyperb. Med. 2018, 45, 173–182. [Google Scholar] [CrossRef]
  17. Natali, J.E.S.; Starzynski, P.N.; Chaui-Berlinck, J.G. Oscillatory patterns in heart rate variability and complexity: A meta-analysis. Biomed. Signal Process. Control 2017, 33, 66–71. [Google Scholar] [CrossRef]
  18. Santos, M.; Fonseca, J.; Barros, A. New method to heart instantaneous frequency estimation. In Proceedings of the 2004 14th IEEE Signal Processing Society Workshop Machine Learning for Signal Processing, Sao Luis, Brazil, 29 September–1 October 2004; IEEE: Piscataway, NJ, USA, 2004; pp. 473–480. [Google Scholar] [CrossRef]
  19. Silva, A.F.; Carmo, J.P.; Mendes, P.M.; Correia, J.H. Simultaneous cardiac and respiratory frequency measurement based on a single fiber Bragg grating sensor. Meas. Sci. Technol. 2011, 22, 075801. [Google Scholar] [CrossRef]
  20. Damla, O.; Altug, C.; Pinar, K.K.; Alper, K.; Dilek, I.G.; Kadriye, A. Heart rate variability analysis in patients with multiple sclerosis. Mult. Scler. Relat. Disord. 2018, 24, 64–68. [Google Scholar] [CrossRef] [PubMed]
  21. Badr, A.; Badawi, A.; Rashwan, A.; Elgazzar, K. XBeats: A Real-Time Electrocardiogram Monitoring and Analysis System. Signals 2022, 3, 189–208. [Google Scholar] [CrossRef]
  22. Yen, H.T.; Kurosawa, M.; Kirimoto, T.; Hakozaki, Y.; Matsui, T.; Sun, G. Non-Contact Estimation of Cardiac Inter-Beat Interval and Heart Rate Variability Using Time-Frequency Domain Analysis for CW Radar. IEEE J. Electromagn. Microwaves Med. Biol. 2023, 7, 457–467. [Google Scholar] [CrossRef]
  23. Mason, H.T.; Martinez-Cedillo, A.P.; Vuong, Q.C.; Garcia-de Soria, M.C.; Smith, S.; Geangu, E.; Knight, M.I. A Complete Pipeline for Heart Rate Extraction from Infant ECGs. Signals 2024, 5, 118–146. [Google Scholar] [CrossRef]
  24. Thakur, S.; Chao, P.C.P.; Tsai, C.H. Precision Heart Rate Estimation Using a PPG Sensor Patch Equipped with New Algorithms of Pre-Quality Checking and Hankel Decomposition. Sensors 2023, 23, 6180. [Google Scholar] [CrossRef]
  25. Zakynthinaki, M.S.; Kapetanakis, T.N.; Lampou, A.; Ioannidou, M.P.; Vardiambasis, I.O. A Neural Network Model for Estimating the Heart Rate Response to Constant Intensity Exercises. Signals 2021, 2, 852–862. [Google Scholar] [CrossRef]
  26. Lima, J.S.; Silva, F.G.S.; Araujo, J.M. An LPC-Based Approach to Heart Rhythm Estimation. In XXVII Brazilian Congress on Biomedical Engineering; Bastos-Filho, T.F., de Oliveira Caldeira, E.M., Frizera-Neto, A., Eds.; Springer: Cham, Switzerland, 2022; pp. 1795–1799. [Google Scholar] [CrossRef]
  27. Becker, D.E. Fundamentals of Electrocardiography Interpretation. Anesth. Prog. 2006, 53, 53–64. [Google Scholar] [CrossRef]
  28. Zhou, Y.; Hu, X.; Tang, Z.; Ahn, A.C. Sparse representation-based ECG signal enhancement and QRS detection. Physiol. Meas. 2016, 37, 2093–2110. [Google Scholar] [CrossRef]
  29. Marvi, H.; Esmaileyan, Z.; Harimi, A. Estimation of LPC Coefficients using Evolutionary Algorithms. J. AI Data Min. 2013, 1, 111–118. [Google Scholar]
  30. Beraldo, O.A. Processamento Digital do Sinal de Eletrocardiograma para Aplicação em Experimentos de Fisiologia Cardíaca. Ph.D. Thesis, Universidade de São Paulo, São Carlos, Brazil, 1997. [Google Scholar]
  31. Araujo, J.M.; Embirucu, M.; Fontes, C.H.O.; de Andrade Lima, L.; Kalid, R. Melhoria da performance em reconciliação de dados pela eliminação de outliers com pré-filtro por predição linear. In Proceedings of the 8th International Seminar on Electrical Metrology, João Pessoa, Brazil, 17–19 June 2009; pp. 1–5. [Google Scholar]
  32. Serhani, M.A.; T. El Kassabi, H.; Ismail, H.; Nujum Navaz, A. ECG monitoring systems: Review, architecture, processes, and key challenges. Sensors 2020, 20, 1796. [Google Scholar] [CrossRef]
  33. Bansal, A.; Joshi, R. Portable out-of-hospital electrocardiography: A review of current technologies. J. Arrhythmia 2018, 34, 129–138. [Google Scholar]
  34. Ardeti, V.A.; Kolluru, V.R.; Varghese, G.T.; Patjoshi, R.K. An Overview on State-of-the-Art Electrocardiogram Signal Processing Methods: Traditional to AI-Based Approaches. Expert Syst. Appl. 2023, 217, 119561. [Google Scholar]
  35. Anbukarasu, P.; Nanisetty, S.; Tata, G.; Ray, N. Tiny-HR: Towards an interpretable machine learning pipeline for heart rate estimation on edge devices. arXiv 2022, arXiv:2208.07981. [Google Scholar]
  36. Asutkar, S.; Chalke, C.; Shivgan, K.; Tallur, S. TinyML-enabled edge implementation of transfer learning framework for domain generalization in machine fault diagnosis. Expert Syst. Appl. 2023, 213, 119016. [Google Scholar]
  37. Moody, G.B.; Mark, R.G. The impact of the MIT-BIH Arrhythmia Database. IEEE Eng. Med. Biol. Mag. 2001, 20, 45–50. [Google Scholar]
  38. Plawiak, P. ECG Signals (1000 Fragments); Version 3; Mendeley Data; Mendeley: London, UK, 2017. [Google Scholar] [CrossRef]
  39. Aniyan, A. ECG Beat Calculation; MATLAB Central File Exchange. 2025. Available online: https://www.mathworks.com/matlabcentral/fileexchange/24628-ecg-beat-calculation (accessed on 18 March 2025).
  40. Krupa, A.J.D.; Dhanalakshmi, S.; Sanjana, N.; Manivannan, N.; Kumar, R.; Tripathy, S. Fetal heart rate estimation using fractional Fourier transform and wavelet analysis. Biocybern. Biomed. Eng. 2021, 41, 1533–1547. [Google Scholar]
  41. Lo, C.I.; Chang, S.S.; Tsai, J.P.; Kuo, J.Y.; Chen, Y.J.; Huang, M.Y.; Lee, C.H.; Sung, K.T.; Hung, C.L.; Hou, C.J.-Y.; et al. Evaluation of the accuracy of ECG captured by CardioChip through comparison of lead I recording to a standard 12-lead ECG recording device. Acta Cardiol. Sin. 2018, 34, 144–151. [Google Scholar]
  42. Parak, J.; Salonen, M.; Myllymäki, T.; Korhonen, I. Comparison of heart rate monitoring accuracy between chest strap and vest during physical training and implications on training decisions. Sensors 2021, 21, 8411. [Google Scholar] [CrossRef]
Figure 1. Typical morphology of normal sinus rhythm seen on ECG.
Signals 06 00015 g001
Figure 2. Heart rhythm computation using detected R waves.
Signals 06 00015 g002
Figure 3. Squared error patterns for ECG signals unperturbed (black) and perturbed with wanderer (blue) and drift (red) in a given window of measurement: (a) ECG signals and (b) squared error.
Signals 06 00015 g003
Figure 4. Error variance in the signal reconstruction as a function of order p.
Signals 06 00015 g004
Figure 5. Frequency response of the LPC filter.
Signals 06 00015 g005
Figure 6. Sparkfun AD8232 single-lead heart rate monitor module.
Signals 06 00015 g006
Figure 7. Esp32-DevKit.
Signals 06 00015 g007
Figure 8. DFRobot LCD keypad shield.
Signals 06 00015 g008
Figure 9. Shield for 18650 lithium-ion batteries.
Signals 06 00015 g009
Figure 10. Arbitrary function generator.
Signals 06 00015 g010
Figure 11. Bigemy-affected ECG and estimated heart rate with LPC filtering.
Signals 06 00015 g011
Figure 12. Typical arrhythmia in a noisy ECG and estimated heart rate with LPC filtering.
Signals 06 00015 g012
Figure 13. ECG signal affected by motion artifact and estimated heart rate with LPC filtering.
Signals 06 00015 g013
Figure 14. Hardware block diagram (simplified).
Signals 06 00015 g014
Figure 15. ESP32 firmware overview.
Signals 06 00015 g015
Figure 16. Peripheral configuration.
Signals 06 00015 g016
Figure 17. Acquisition and processing.
Signals 06 00015 g017
Figure 18. Acquisition system with 30 beats per minute.
Signals 06 00015 g018
Table 1. Heart rate estimation performance of the system.
Heart Rate (bpm)Performance in One Hundred EstimationsMean (bpm)Std. Deviation (bpm)Accuracy
3030 bpm (66 samples)
29 bpm (34 samples)
29.660.48 98.88 %
6060 bpm (87 samples)
59 bpm (13 samples)
59.870.34 99.78 %
120120 bpm (94 samples)
119 bpm (6 samples)
119.940.24 99.95 %
180180 bpm (87 samples)
178 bpm (13 samples)
179.270.68 99.92 %
Table 2. Performance comparison.
System/MethodAccuracy
Developed System (LPC)98.88–99.95%
Fractional Fourier transform and Wavelet transform [40]98.12%
MATLAB (WT/MIT-BIH) [39]42.47–97.02%
Prototype [41]100%
Test/chest strap and a vest [42]99.21–96.28%
Disclaimer/Publisher’s Note: The statements, opinions and data contained in all publications are solely those of the individual author(s) and contributor(s) and not of MDPI and/or the editor(s). MDPI and/or the editor(s) disclaim responsibility for any injury to people or property resulting from any ideas, methods, instructions or products referred to in the content.

