Article

Acoustic Rocket Signatures Collected by Smartphones

by
Sarah K. Popenhagen
* and
Milton A. Garcés
Infrasound Laboratory, University of Hawai’i at Mānoa, Honolulu, HI 96822, USA
*
Author to whom correspondence should be addressed.
Submission received: 30 November 2024 / Revised: 15 January 2025 / Accepted: 22 January 2025 / Published: 24 January 2025

Abstract

:
Rockets generate complex acoustic signatures that can be detected over a thousand kilometers from their source. While many far-field acoustic rocket signatures have been collected and released to the public, very few signatures collected at distances less than 100 km are available. This work presents a curated and annotated dataset of acoustic signatures of 243 rocket launches collected by a network of smartphones stationed at distances between 10 and 70 km from the launch sites, resulting in 1089 individual recordings. Due to the frequency dependence of atmospheric attenuation and the relatively short propagation distances, higher-frequency features not preserved in most publicly available data are observed. The signals are time-aligned to allow for different segments of the signal (ignition, launch, trajectory, chronology) to be more easily examined and compared. Initial analysis of the features of these rocket launch stages is performed, observed features are compared to those found in the existing literature, and comparisons between signals from launches of different rocket types are made. The dataset is annotated and made available to the public to aid future analysis of the characteristics and source mechanisms of rocket acoustics as well as applications such as rocket detection and classification models.

1. Introduction

Acoustic waves traveling through the atmosphere carry information about both the source that generated them and the medium through which they travel. As waves propagate, they lose some of that information to atmospheric attenuation. Atmospheric attenuation, however, does not affect all waves equally. Lower-frequency sound is less attenuated and can remain detectable over much longer distances than higher-frequency signals. Since both natural and anthropogenic large-scale events can generate significant amounts of low-frequency energy, this phenomenon is particularly useful for detecting and monitoring such events. Sound waves with frequencies below 20 Hz (the lower frequency limit of human hearing) are called infrasound. A wide variety of events have been successfully detected using infrasound, including tsunamis, volcanoes, bolides, earthquakes [1], lightning [2], explosions [3], and rocket launches [4].
Many of these detections were made using infrasound data collected by the International Monitoring System (IMS) of the Comprehensive Nuclear-Test-Ban Treaty [5]. The IMS is a global network of stations that collects data from a number of different types of sensors, including infrasound microphones. While the IMS has proven invaluable for global detection of large-scale events, the size of the network necessitates sparseness in order to limit cost, resulting in most signals being detected only after propagating great distances. This trend towards far-field data is not unique to the IMS; many of the infrasound signals collected are collected at large propagation distances. Due to the low attenuation rate of infrasound in the atmosphere, this is not generally a problem for detectability given a sufficiently energetic low-frequency signal, but it severely limits the expediency at which detections can be made due to the relatively slow (compared to light) speed of sound.
Acoustic signals generated by rocket launches have consistently been detected over the decades since humanity’s first successful launches [4,6,7,8,9,10,11,12,13,14]. Starting in the late 1950s, infrasound waves from rocket launches in Florida were detected by infrasound sensors at multiple stations in the eastern United States at ranges between 291 and 1594 km [6,7,10]. In 1971, Cotton and Donn reported the observation of infrasound signals believed to be shock waves generated by the exhaust plumes of Apollo rockets as they flew over Bermuda at 188 km altitude [10,14]. In the decades following these early observations, the annual number of rocket launches has increased dramatically, as has our ability to detect infrasound signals. Numerous rocket launch signals have been detected by IMS infrasound stations since the network’s establishment, usually at great distances. Such signals have been analyzed in multiple studies [4,8,9,12,15], and thus the characteristics of far-field rocket signatures are generally well understood.
Far fewer studies, however, have been conducted on acoustic rocket launch signals collected at shorter distances (<100 km). The existing literature includes a 2016 study that analyzed acoustic signals collected 7–100 km from the launch site of a four-stage sounding rocket [12], and results of a few studies analyzing acoustic signals collected at similar distances can be found in conference proceedings [13,16,17], but few data are currently publicly available. This relative dearth of nearer-field data limits advancement in the field of rocket acoustics for two related reasons. First, due to the atmospheric propagation effects previously discussed, much of the original signal’s content is lost as it propagates, including features seen in data from previous studies [12,13,15,16], limiting what can be learned about the source. Second, distortion of the signal during propagation makes relationships between characteristics and their source mechanisms more difficult to interpret in signals collected at longer ranges. Thus, we believe there is much to learn from analysis of nearer-field rocket launch acoustics.
In order to conduct such an analysis, however, it is first necessary to curate a dataset of such signals. To this end, we established a semi-permanent network of low-cost, attritable sensors at a 10–70 km range from launch sites at the Kennedy Space Center and Cape Canaveral Space Force Station in Merritt Island and Cape Canaveral, FL, USA. From the first launch recorded on 24 May 2019 until the last on 20 August 2024, the network recorded 1089 acoustic signals from 243 rocket launches. These recordings have been aggregated into a curated, labeled dataset, hereafter referred to as ASTRA (Aggregated Smartphone Timeseries of Rocket-generated Acoustics) for convenience [18]. ASTRA is an open-access dataset created to help increase our understanding of the nature and features of rocket acoustics through traditional analysis, as well as for building, training, and testing near-real-time rocket detection and identification models using machine learning methods. We present an overview of ASTRA, the network on which it was collected, the alignment and labeling procedures used, and a summary of the observed time–frequency characteristics.

2. Materials and Methods

2.1. Data Collection

The data used in this study were collected by a network of smartphones located 10–70 km from the launch sites. Smartphones are used in this study for several reasons, first of which is their low cost compared to traditional infrasound sensors, which allowed for a much denser network. In addition, smartphones are attritable, user-friendly, and able to run machine learning models in the field, which may prove valuable for near-real-time detection and identification studies in the future [19,20]. Smartphones are also commercially off-the-shelf (COTS) devices, thus stations can be replaced quickly and easily by simply buying a new smartphone on location, which could be valuable for monitoring applications.
There are important limitations to keep in mind when working with smartphones, however. Firstly, ground-truth information about a smartphone’s on-board microphone is usually unavailable, as the information is considered proprietary. In addition, we know through observation that the model of microphone used can differ between smartphone models and even individual devices of the same make and model [21]. The frequency response of smartphones can and has been studied [22,23,24]; however, it is impossible to know the exact frequency response of a specific smartphone without calibration due to the microphone model being unknown. Requiring each smartphone to be individually calibrated would negate many of the previously discussed strengths of using a smartphone network. Thus, we instead leave all the phones uncalibrated, display normalized amplitudes to avoid assigning meaning to uncalibrated values, and focus on the signal-to-noise ratio and information in the time–frequency domain, in which important characteristics of acoustic signals (such as shape) have been shown to remain stable between traditional infrasound microphones and smartphones [23,25] over the relatively unstable shape and amplitude of the signal in the time domain. However, possible inconsistencies due to the lack of calibration must still be kept in mind during analysis. For those interested, examples of how signals collected by smartphone microphones compare to those collected by traditional sensors can be found in previous studies [21,22,23,24,25], and the raw amplitudes of the waveforms as well as the makes, models, and unique identification numbers of the smartphones are included in the dataset.
Each of the phones collected data from multiple internal sensors through the RedVox Android application [26], the specifications of which are detailed in [27]. While data from multiple sensors can be collected using the RedVox application, the only sensor relevant to this work is the microphone. The smartphone microphones collected acoustic data at a sampling rate of 800 Hz and uploaded the data in near-real time, after which they were downloaded from the cloud using the Redvox SDK [26] and processed in Python [28] using open-source packages [26,29,30,31,32,33]. The makes and models of the smartphones represented in ASTRA are shown in Figure 1 along with the distributions of rocket types and propagation ranges.
The data were largely recorded by Samsung Galaxy models (see Figure 1a), as the network was originally deployed with Galaxy S8 phones, which were replaced in time with S10s, and finally with S20s. The other models represented in ASTRA originate from instances where a single station was replaced or when other smartphones were temporarily added to the network. As the network’s day-to-day operation was performed by citizen scientists, not every phone in the network was turned on and recording for every launch, resulting in some individual launches being recorded by only a subset of the phones.
The vast majority of the signals (949 out of 1089) are of SpaceX Falcon 9 launches (see Figure 1b), as Falcon 9s were the most commonly launched rocket during the collection period. ULA Atlas V and SpaceX Falcon Heavy launches were also prevalent during the collection period, resulting in 77 and 40 collected signals, respectively. All other rocket types represented in ASTRA have less than 10 collected signals, as most were launched only once in the collection period.
The range distribution is more even than the distributions previously discussed, with 390, 475, and 224 signals in the 10–30 km, 30–50 km, and 50–70 km categories, respectively (see Figure 1c). However, the distribution is skewed slightly towards the 30–50 km range category, and the 50–70 km range category is underrepresented. These distributions are considered when analyzing trends in the dataset.

2.2. Data Alignment

For each rocket launch, the reported time of the launch and the great circle distances between the source and each active station are used to compute estimates of the signal’s arrival time at each station using an estimated speed of sound. There are two likely sources of error in these estimates that we will address. Firstly, the reported launch time is often accurate only to the minute. Secondly, we assumed direct great circle paths from the source to each phone, which, while a reasonable estimate for short propagation distances, may not be an accurate representation of acoustic wave propagation. We expect that error in arrival times arising from simplified propagation paths will increase with distance from the source, while bias error due to imprecisely or inaccurately reported launch times will be independent of distance.
For each signal in ASTRA, the effective speed of sound is estimated according to
c e f f = 331.3   m s · 1 + T ¯ 273.15 + v ¯ ,
using the mean temperature T ¯ in degrees Celsius and mean parallel (or negative if antiparallel) wind along the great circle path between the source and the station. Temperature and wind values were obtained from Copernicus Climate Change Service’s ERA5 [34,35], and parallel wind is calculated by projecting the wind vector onto a vector representing the estimated speed of sound in the direction of propagation. The magnitude of the parallel or antiparallel wind is then added or subtracted, respectively, from the magnitude of the estimated speed of sound, giving the effective speed of sound along the assumed path. The estimated travel time is simply the assumed propagation distance divided by the effective speed of sound.
Once the effective sound speed is estimated, the dataset is aligned in two ways, each with a different estimate of the arrival time of the signal. Both estimates of the arrival times are preserved in ASTRA as there are use cases where each estimate may prove more useful than the other. These estimates, their strengths, and their potential weaknesses are outlined in the following paragraphs.
The first arrival time estimate is made by simply adding the estimated travel time to the reported launch time. We call data aligned this way “start-aligned”, and the associated arrival time estimate is labeled as such in ASTRA. The start-aligned estimation is independent of the waveforms themselves and thus unaffected by noise in the data, but it is sensitive to bias error in the reported launch time and assumed propagation path. An example of start-aligned data is shown in Figure 2.
To calculate the second arrival time estimate, a window from which to select a peak is determined. The window duration is equal to 180 s plus 25% of the estimated propagation time to account for the uncertainty increasing with propagation distance as previously discussed. For each individual launch, estimates are made starting with the closest station to the launch site, for which the first timestamp of the selection window is set to the start-alignment estimate of the arrival time at the same station, minus a 30 s buffer to account for potential error in the reported launch time. For successive stations, the next-closest station’s new estimate is used instead of the start-alignment estimate, and an additional buffer term inversely proportional to the difference between the two propagation distances is subtracted. This is represented mathematically in Equation (2).
t i = t i 1 t b u f f e r t b u f f e r / ( r i r i 1 )
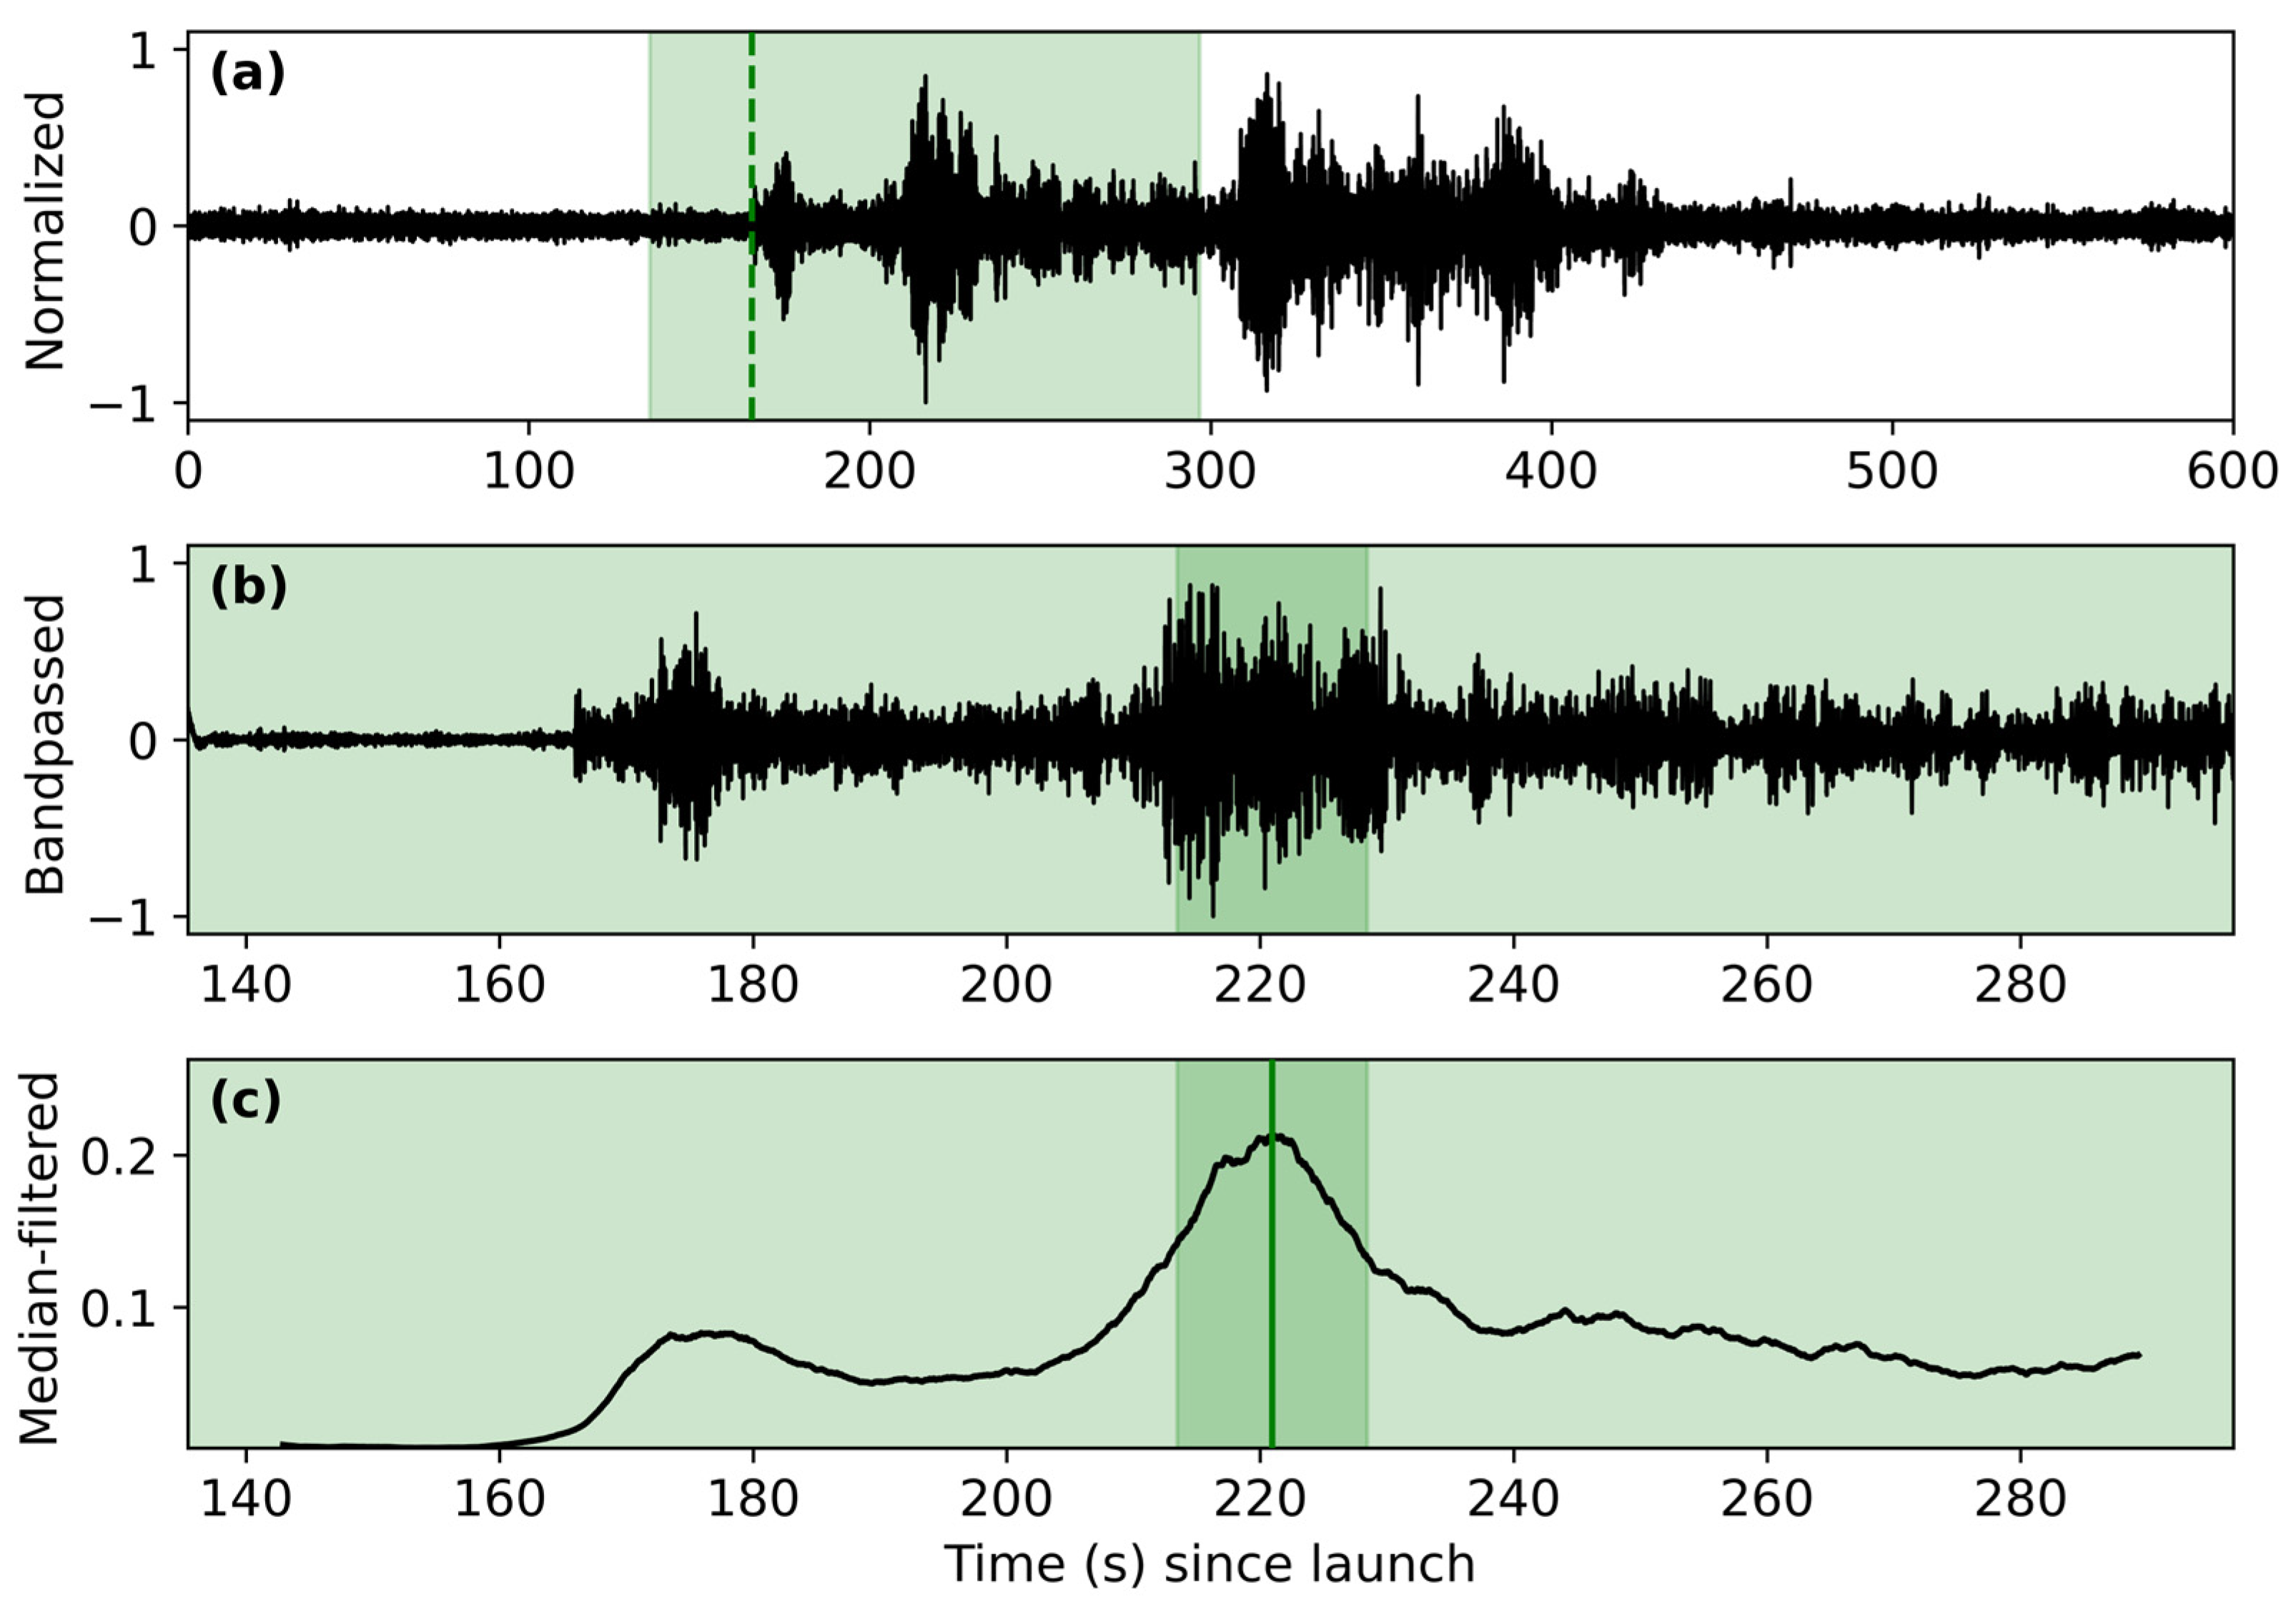
The windowed waveform is then bandpassed. Previous studies [4,7,8,12,13,14] have shown that characteristic acoustic frequencies of rocket launch signals are higher than 0.5 Hz, and preliminary observation of the data showed a decrease in the signal-to-noise ratio below approximately 50 Hz, thus the frequency limits of the passband are set to 0.5 Hz and 50 Hz. As the main phase of the rocket launch signature persists over a timescale on the order of 10 s to 100 s, a rolling median filter is applied to the absolute value of the windowed and bandpassed waveform with a kernel duration of 15 s. The peak of the median-filtered time series is then determined, the corresponding epoch time of which is the second arrival time estimate. We call data aligned this way “peak-aligned”, and the associated arrival time estimate is labeled as such in ASTRA. Aligning the dataset this way is useful for observing characteristics of the signature that are more stable over the propagation path, such as the frequency of peak energy. Unlike start alignment, the accuracy of peak alignment is partially dependent on the signal-to-noise ratio of the waveform, but it is less reliant on the accuracy of the travel time estimation and reported launch time. The peak selection process is visualized in Figure 3, and an example of peak-aligned data is shown in Figure 4.
Which type of alignment should be used depends on which phase of the rocket launch sequence is of interest. For example, if analyzing the ignition signal, start alignment is more useful, as propagation effects cause the signal to become more emergent as it travels and peak-aligning the signals will misalign the ignition signals (see Figure 4). In contrast, if the goal is to analyze the characteristics of the signal generated during the rocket’s ascent, peak alignment may be more useful.

3. Results

Once the signals in the dataset are aligned, characteristics of the signature are more easily observed. Through comparison of recordings of the same launch collected at different distances, the effects of propagation on the signal are apparent. As previously mentioned, different frequency components of an acoustic signal can travel through the atmosphere at slightly different speeds, leading to dispersed signals with more emergent onsets at greater distances from the source. We also expected to observe frequency-dependent energy loss as the propagation distance increases due to atmospheric attenuation.
In addition to analyzing the differences between signals originating from the same source but collected at different distances, signals generated by different types of rockets can also be examined for differing characteristics. ASTRA includes signals from launches of eight different rocket types with lift classes ranging from small (Terran 1, Rocket 3.3) to super heavy (Space Launch System B1) with varying fuel types and numbers of engines. The results are organized by rocket type, starting with the heaviest rockets and proceeding to the lightest.

3.1. Space Launch System B1

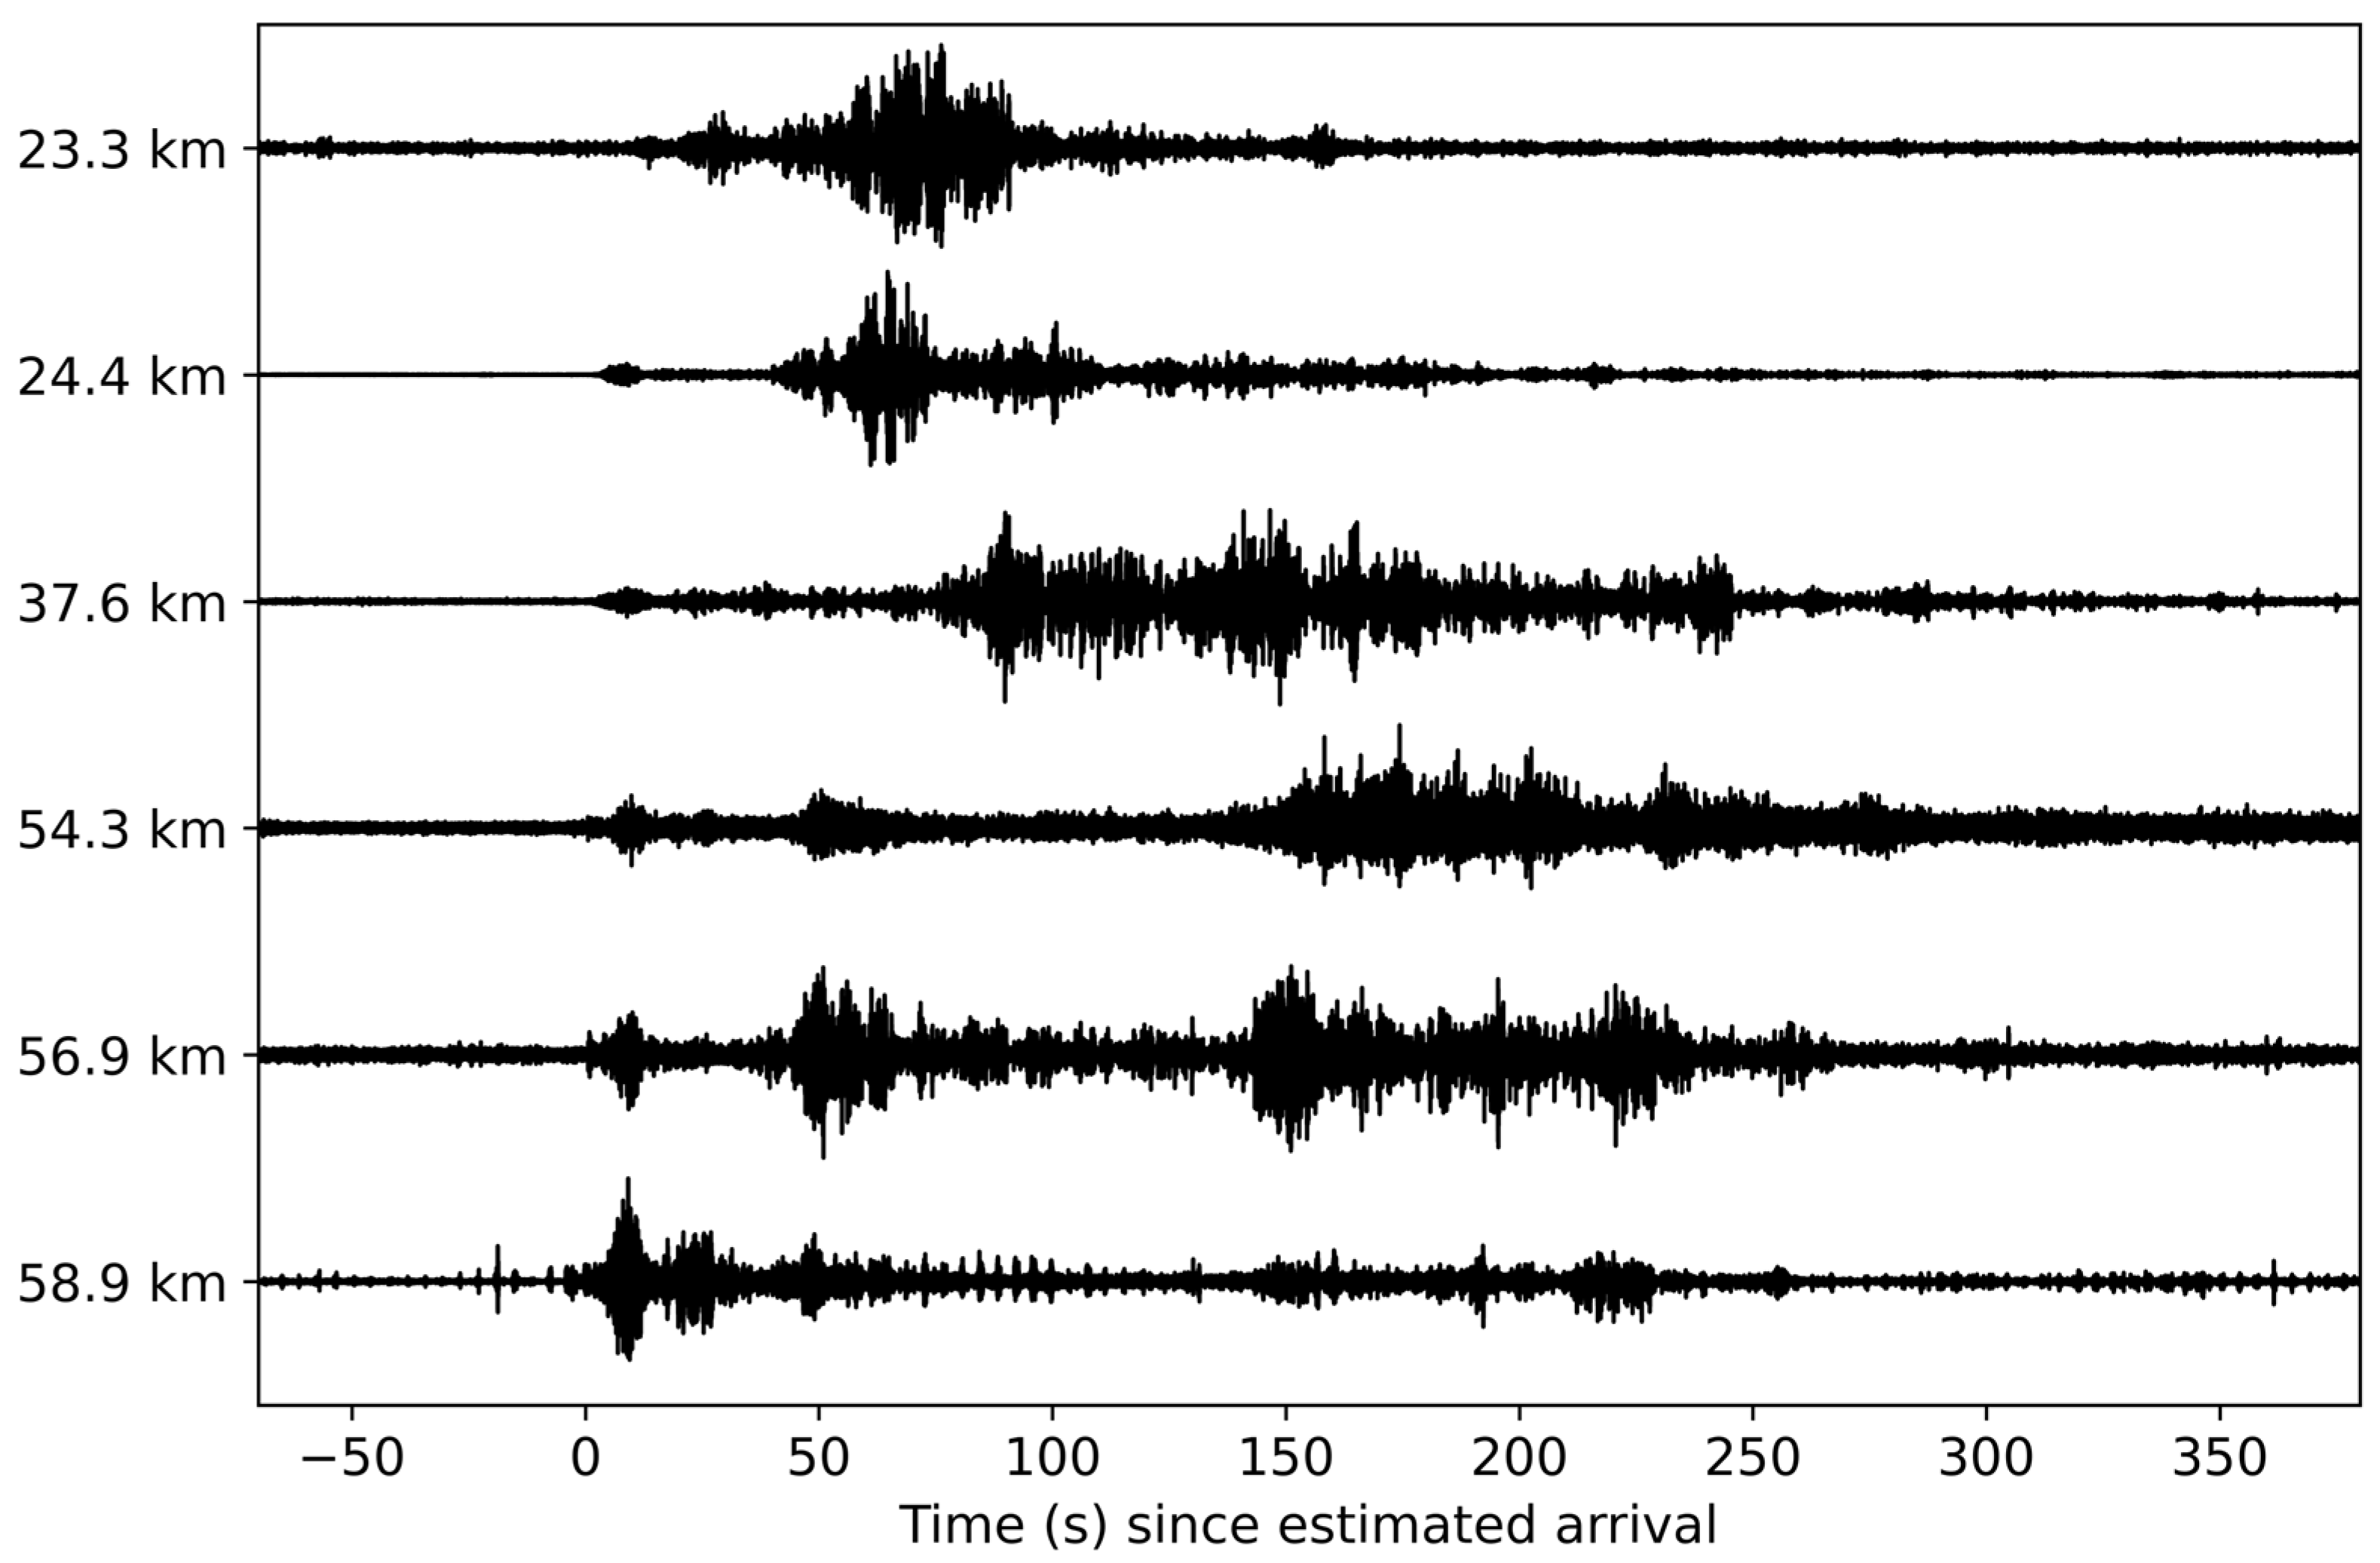
NASA’s Space Launch System B1 (SLS-B1) is a super-heavy-lift launch vehicle and the most powerful operational rocket to date. Its first stage is powered by four RS-25 liquid-fueled engines and two solid rocket boosters. It is represented in ASTRA by a single launch (Artemis I), from which six stations collected acoustic signals. The waveforms of all six signals can be seen in Figure 5. The waveforms collected less than 30 km from the source are characterized by a spindle-like shape, high chronological symmetry about the peak amplitude, short duration of the highest amplitude segment (~60 s) compared to longer-range signals, and the presence of a small transient signal preceding the high amplitude segment. The waveform collected at a 37.6 km range shows significant elongation but maintains some similarity in shape with the shorter-range data despite early signs of peak separation. In contrast, the shapes of the waveforms collected at a greater than 50 km range are significantly different, with all three showing two chronologically distinct high-energy regions separated by approximately 150 s, both of which appear to further separate into two sub-regions each.
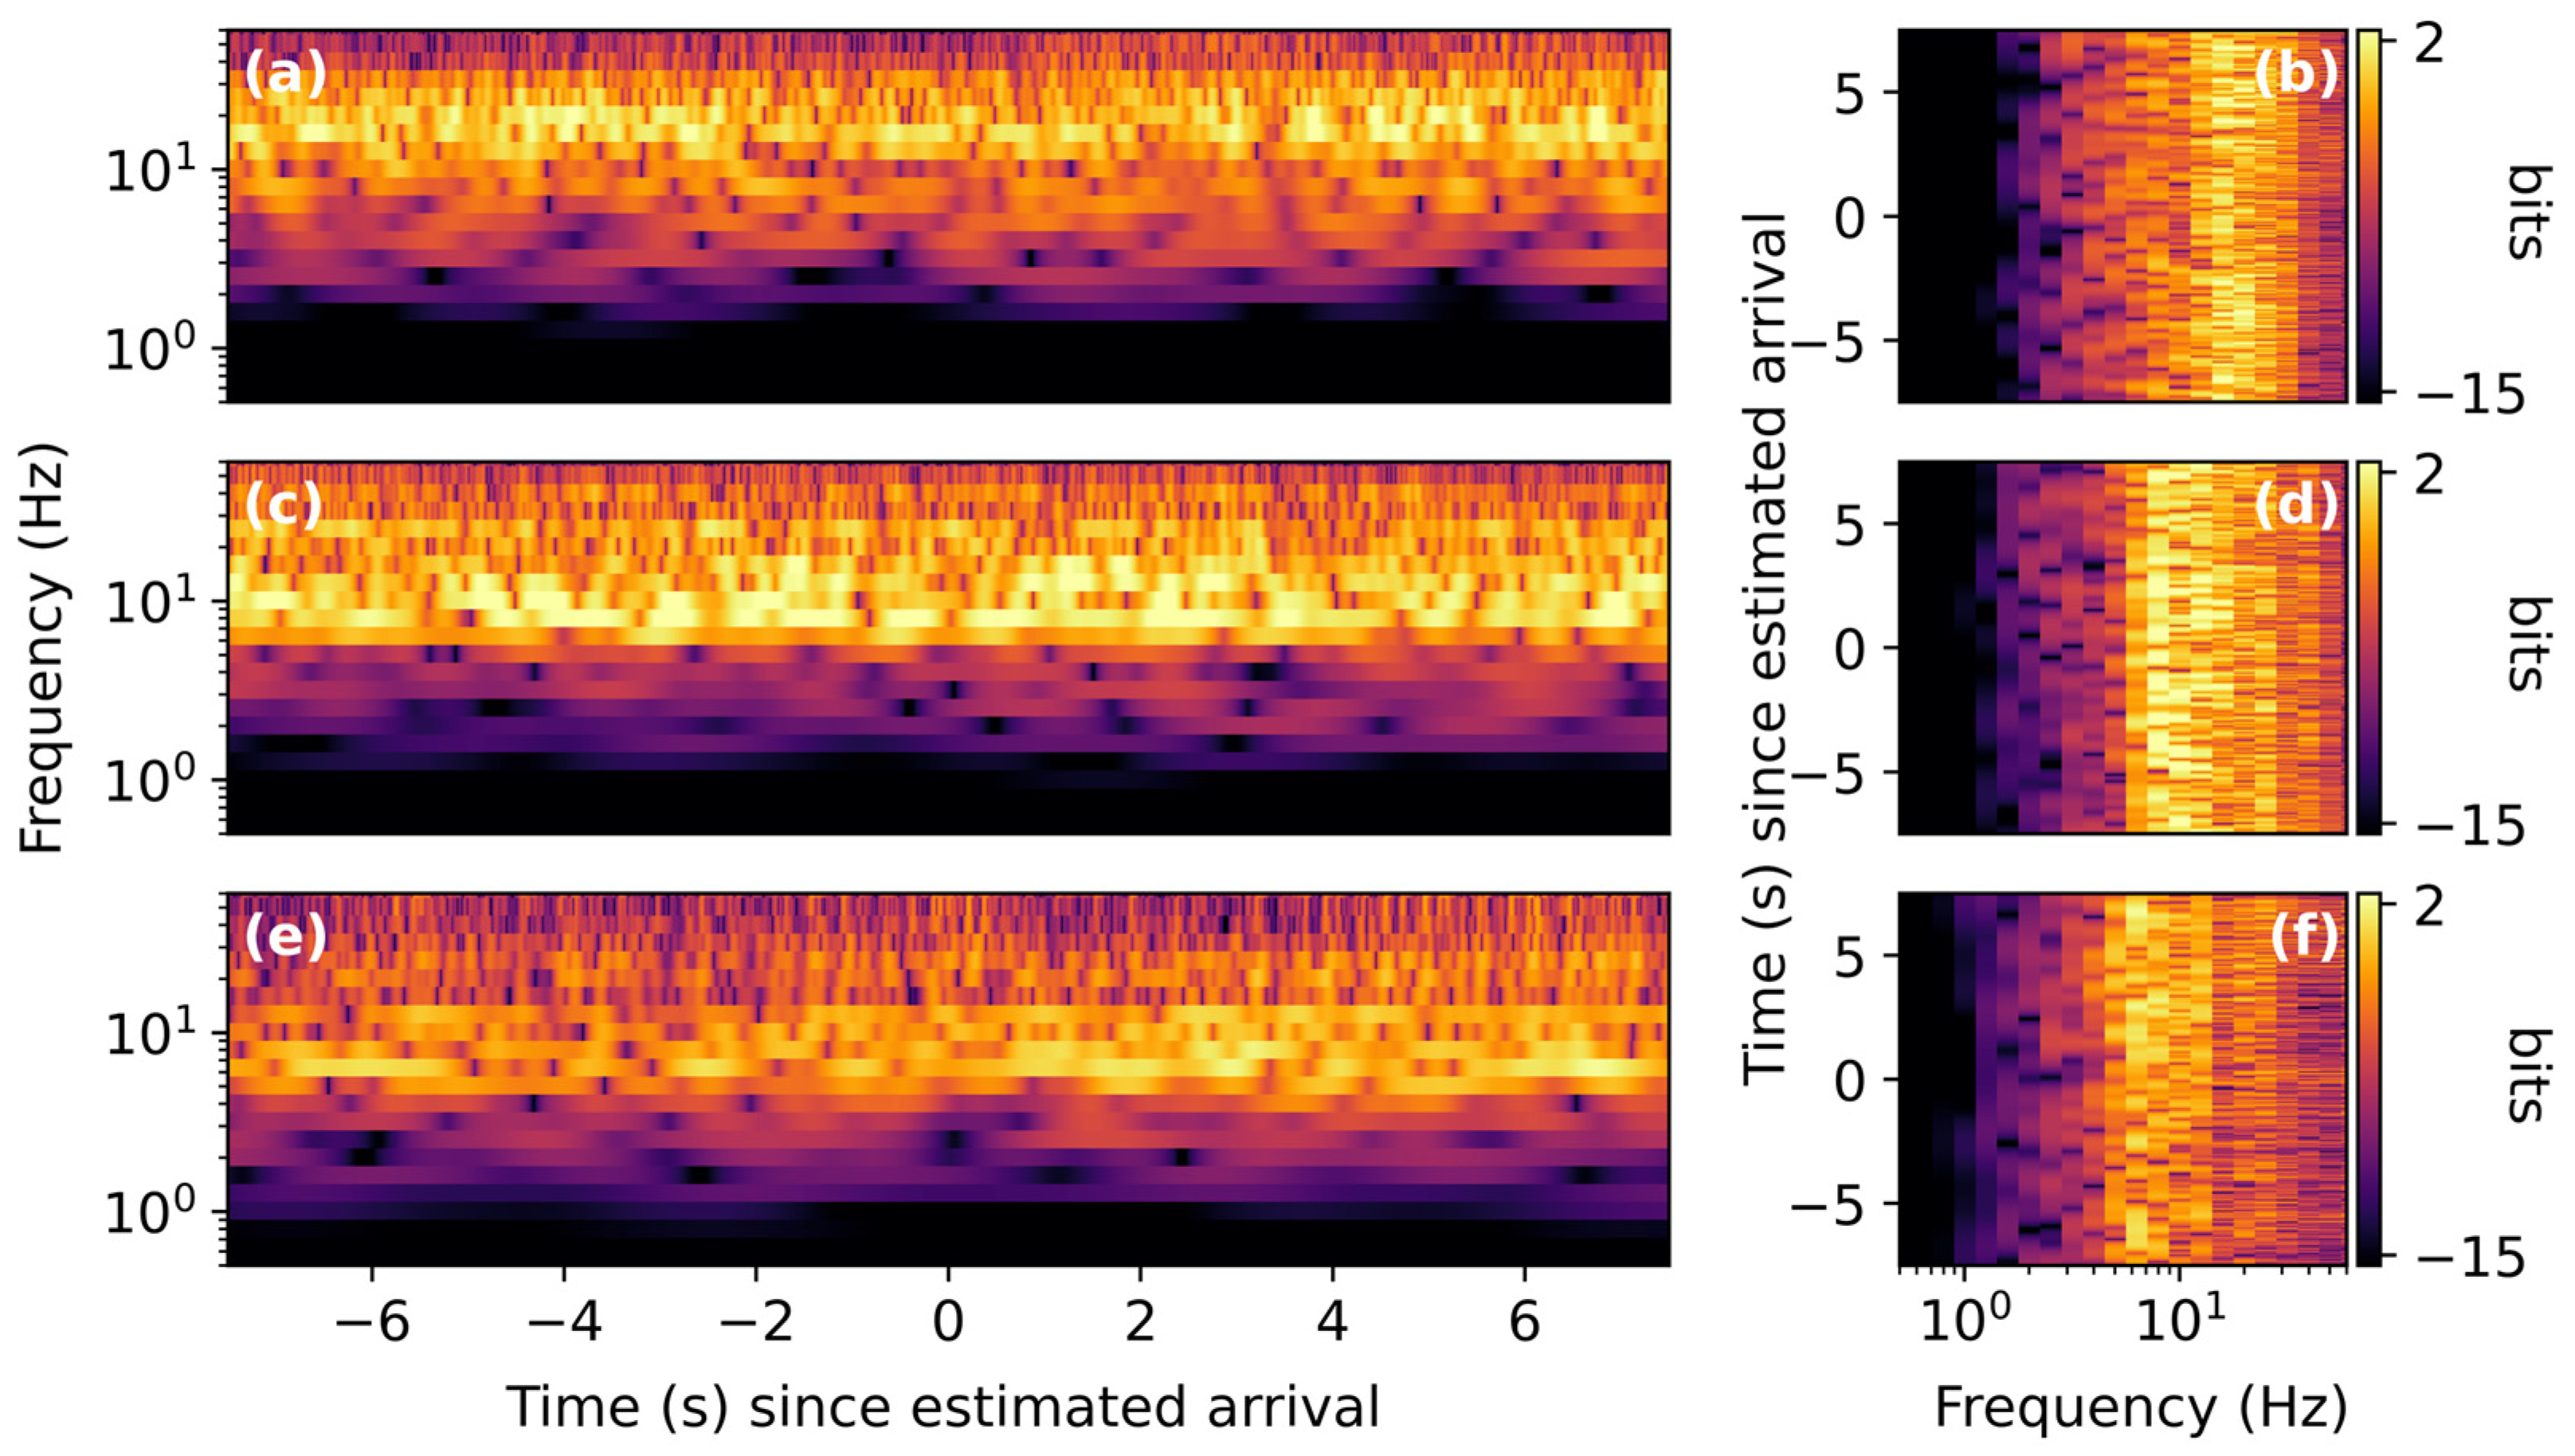
Multiresolution time–frequency analysis was performed on all six signals, and one signal from each of the range categories (10–30 km, 30–50 km, 50–70 km) was selected to illustrate the identified characteristics, as high similarity was observed within each range category. In signals collected between 10 and 30 km from the source, we observe a sharp increase in power across nearly the whole spectrum (see Figure 6), but particularly near 10, 20, 45, and 100 Hz. As the signal propagates and the contribution of higher-frequency components is reduced, the peak power band near 10 Hz becomes more dominant. This phenomenon can be seen in Figure 6 and Figure 7, in which spectrograms of the continuous wavelet transform (CWT) power of the three selected signals are displayed. As the rocket ascends, moving away from the stationary sensor, an apparent decrease in the frequency of the signal is observed. This observed shift in frequency, an example of the Doppler effect, can be seen most clearly in Figure 6c and Figure 7e.

3.2. Falcon Heavy

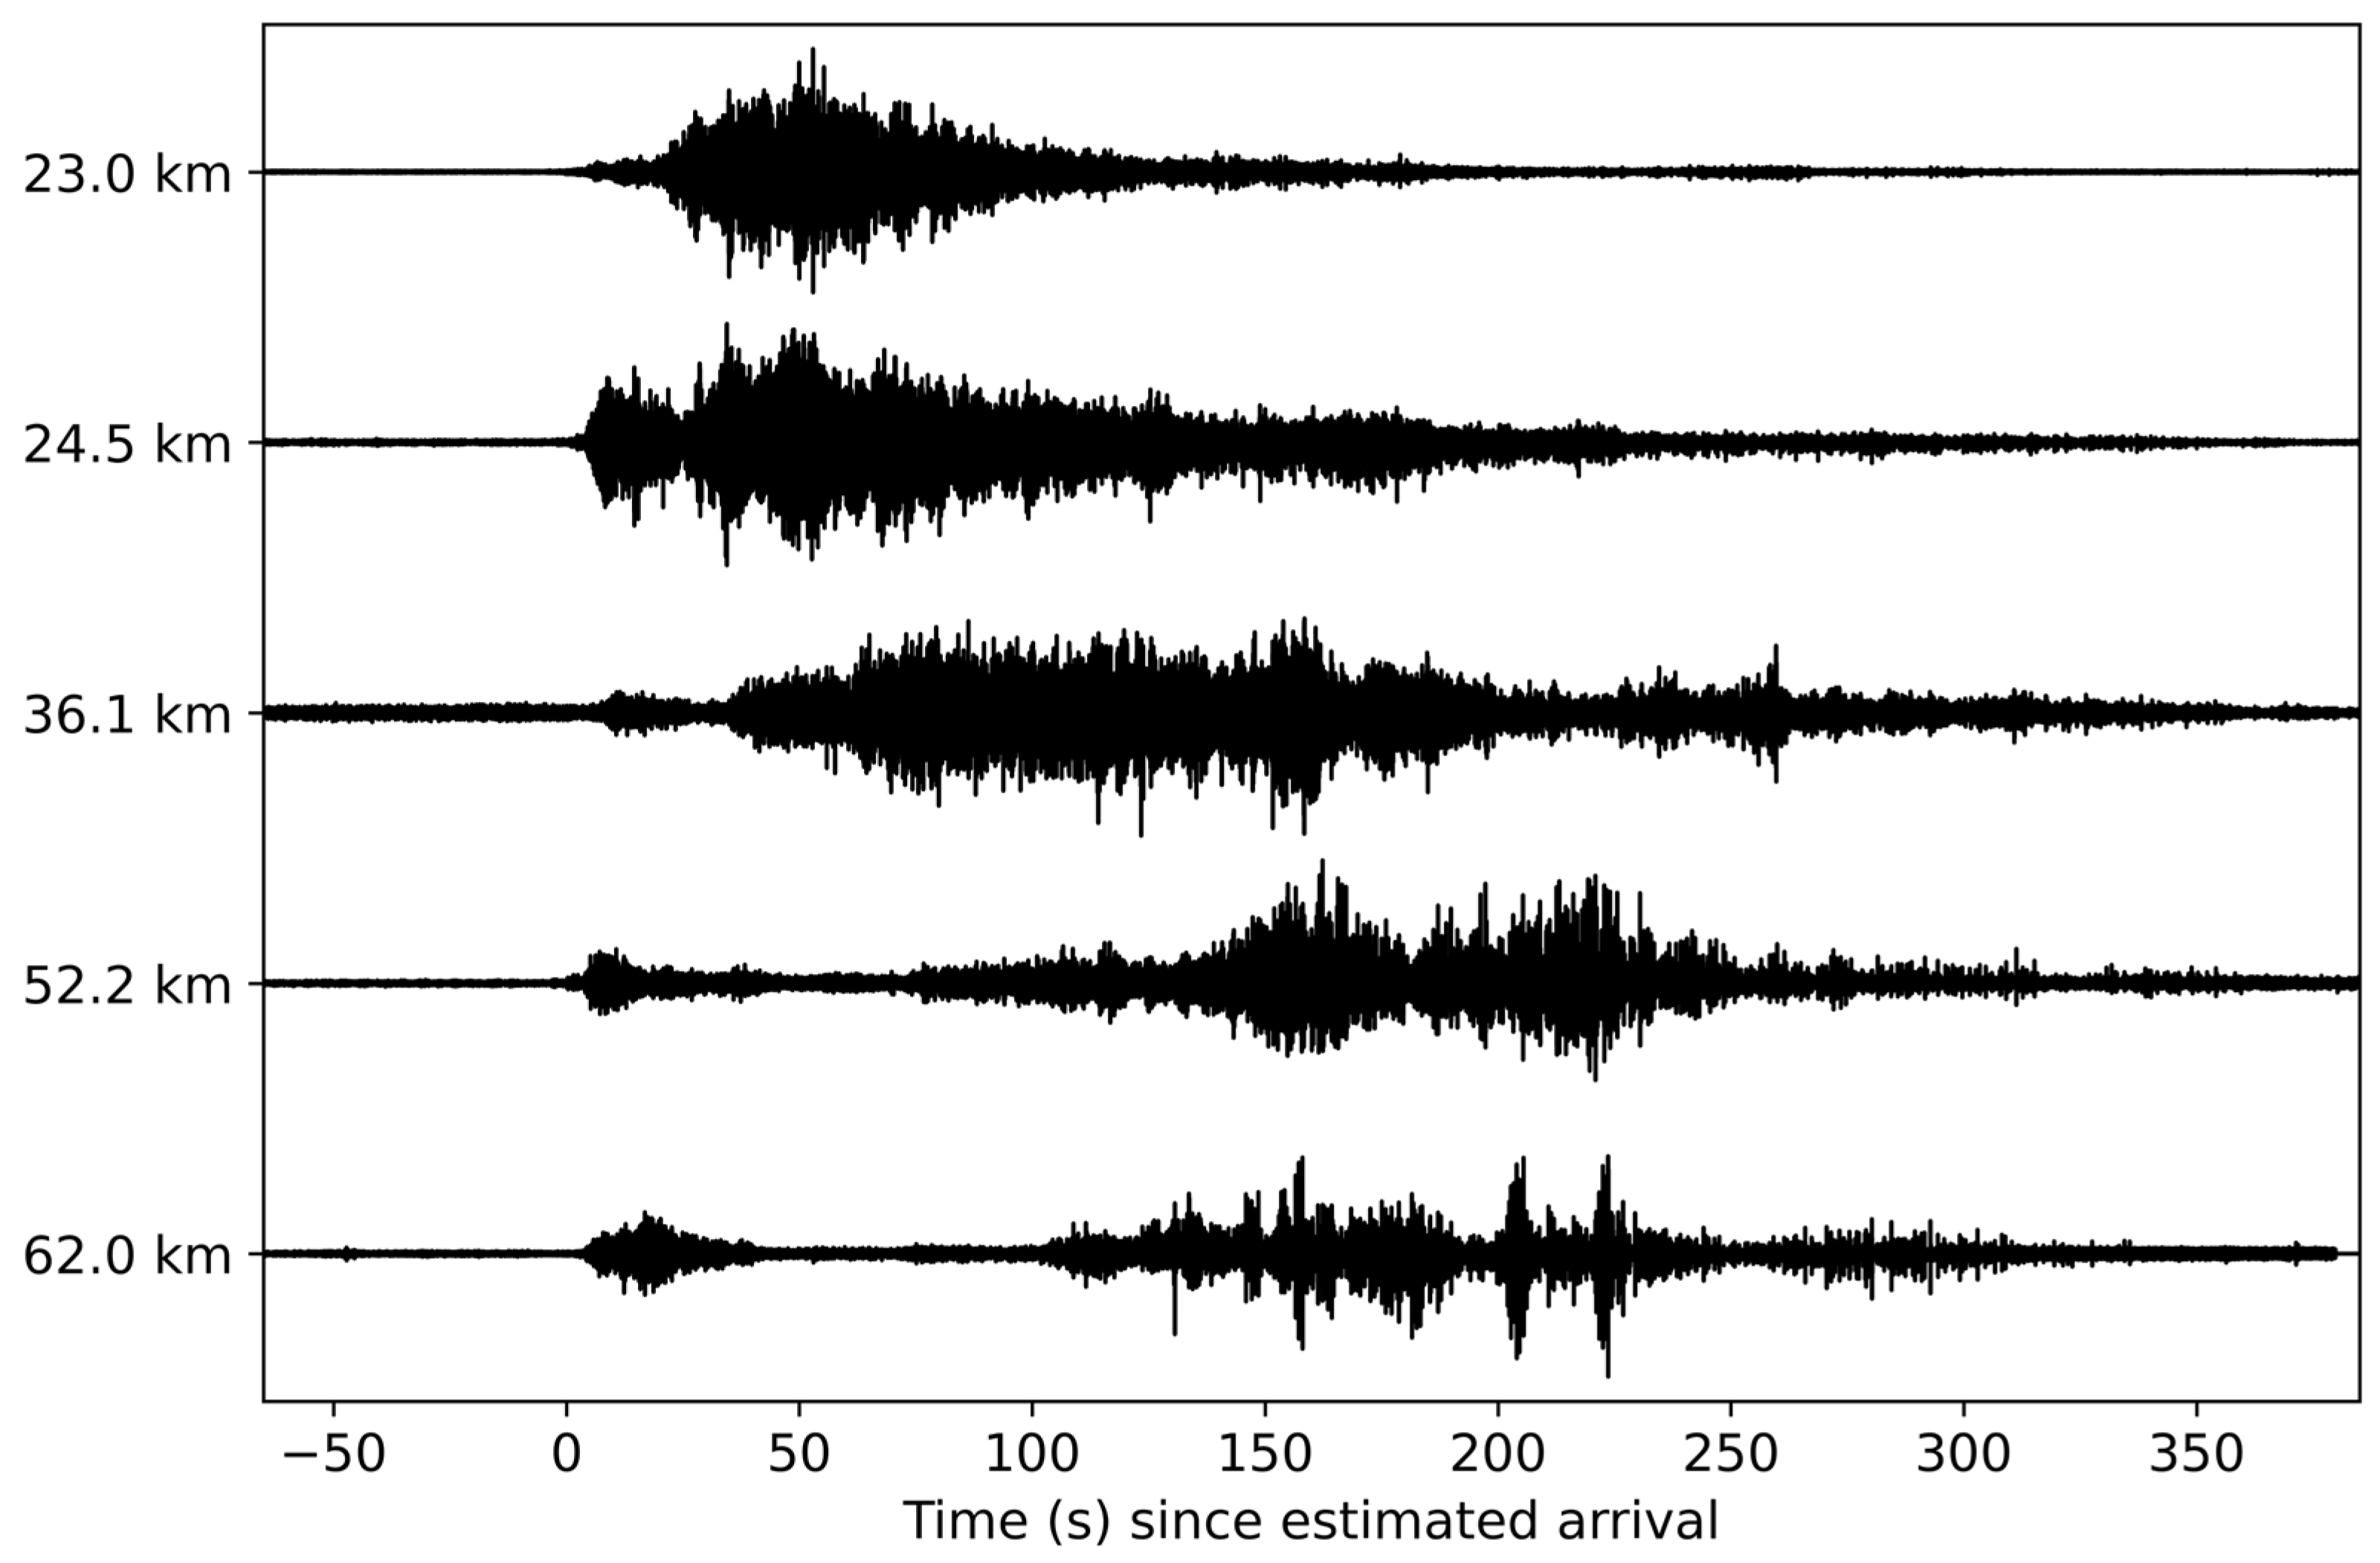
The Falcon Heavy is a super-heavy-lift launch vehicle manufactured by SpaceX. The first stage of its launch is powered by twenty-seven liquid-fueled Merlin 1D engines. It is represented in ASTRA by 40 signals originating from eight individual launches. The five waveforms collected from flight FH-003 are shown in Figure 8. Compared to signals collected at short range from Artemis I, the FH-003 signals at the 23.0 and 24.5 km ranges appear to have significantly less impulsive onsets and longer durations (~100–200 s), and the leading small transients (i.e., short-duration changes in amplitude and/or frequency) seen in the Artemis I data are not present at the closest station. The peak separations seen in the Artemis I data as range increases are also observed here; however, while this pattern was apparent only past the 30 km range in the Artemis I data, it is observed in all but the closest FH-003 signal.
We once again select one signal from each range class to illustrate identified time–frequency characteristics of Falcon Heavy signals. In Figure 9, we see that the increase in power at the start-aligned arrival time estimate is gradual when compared with data from Artemis I, and the high-power bands near 45 and 100 Hz observed in the Artemis I data are not present. The short-range signals still contain more higher-frequency content than the longer-range signals, however, with most of the power over 10 Hz being lost to attenuation as the signal propagates. We once again note the Doppler shift observed at all stations, but it is most clearly illustrated by comparing panels (d) and (f) in Figure 10. The leading transient seen in the longer-range stations has a characteristic frequency near 6 Hz.

3.3. Delta IV Heavy

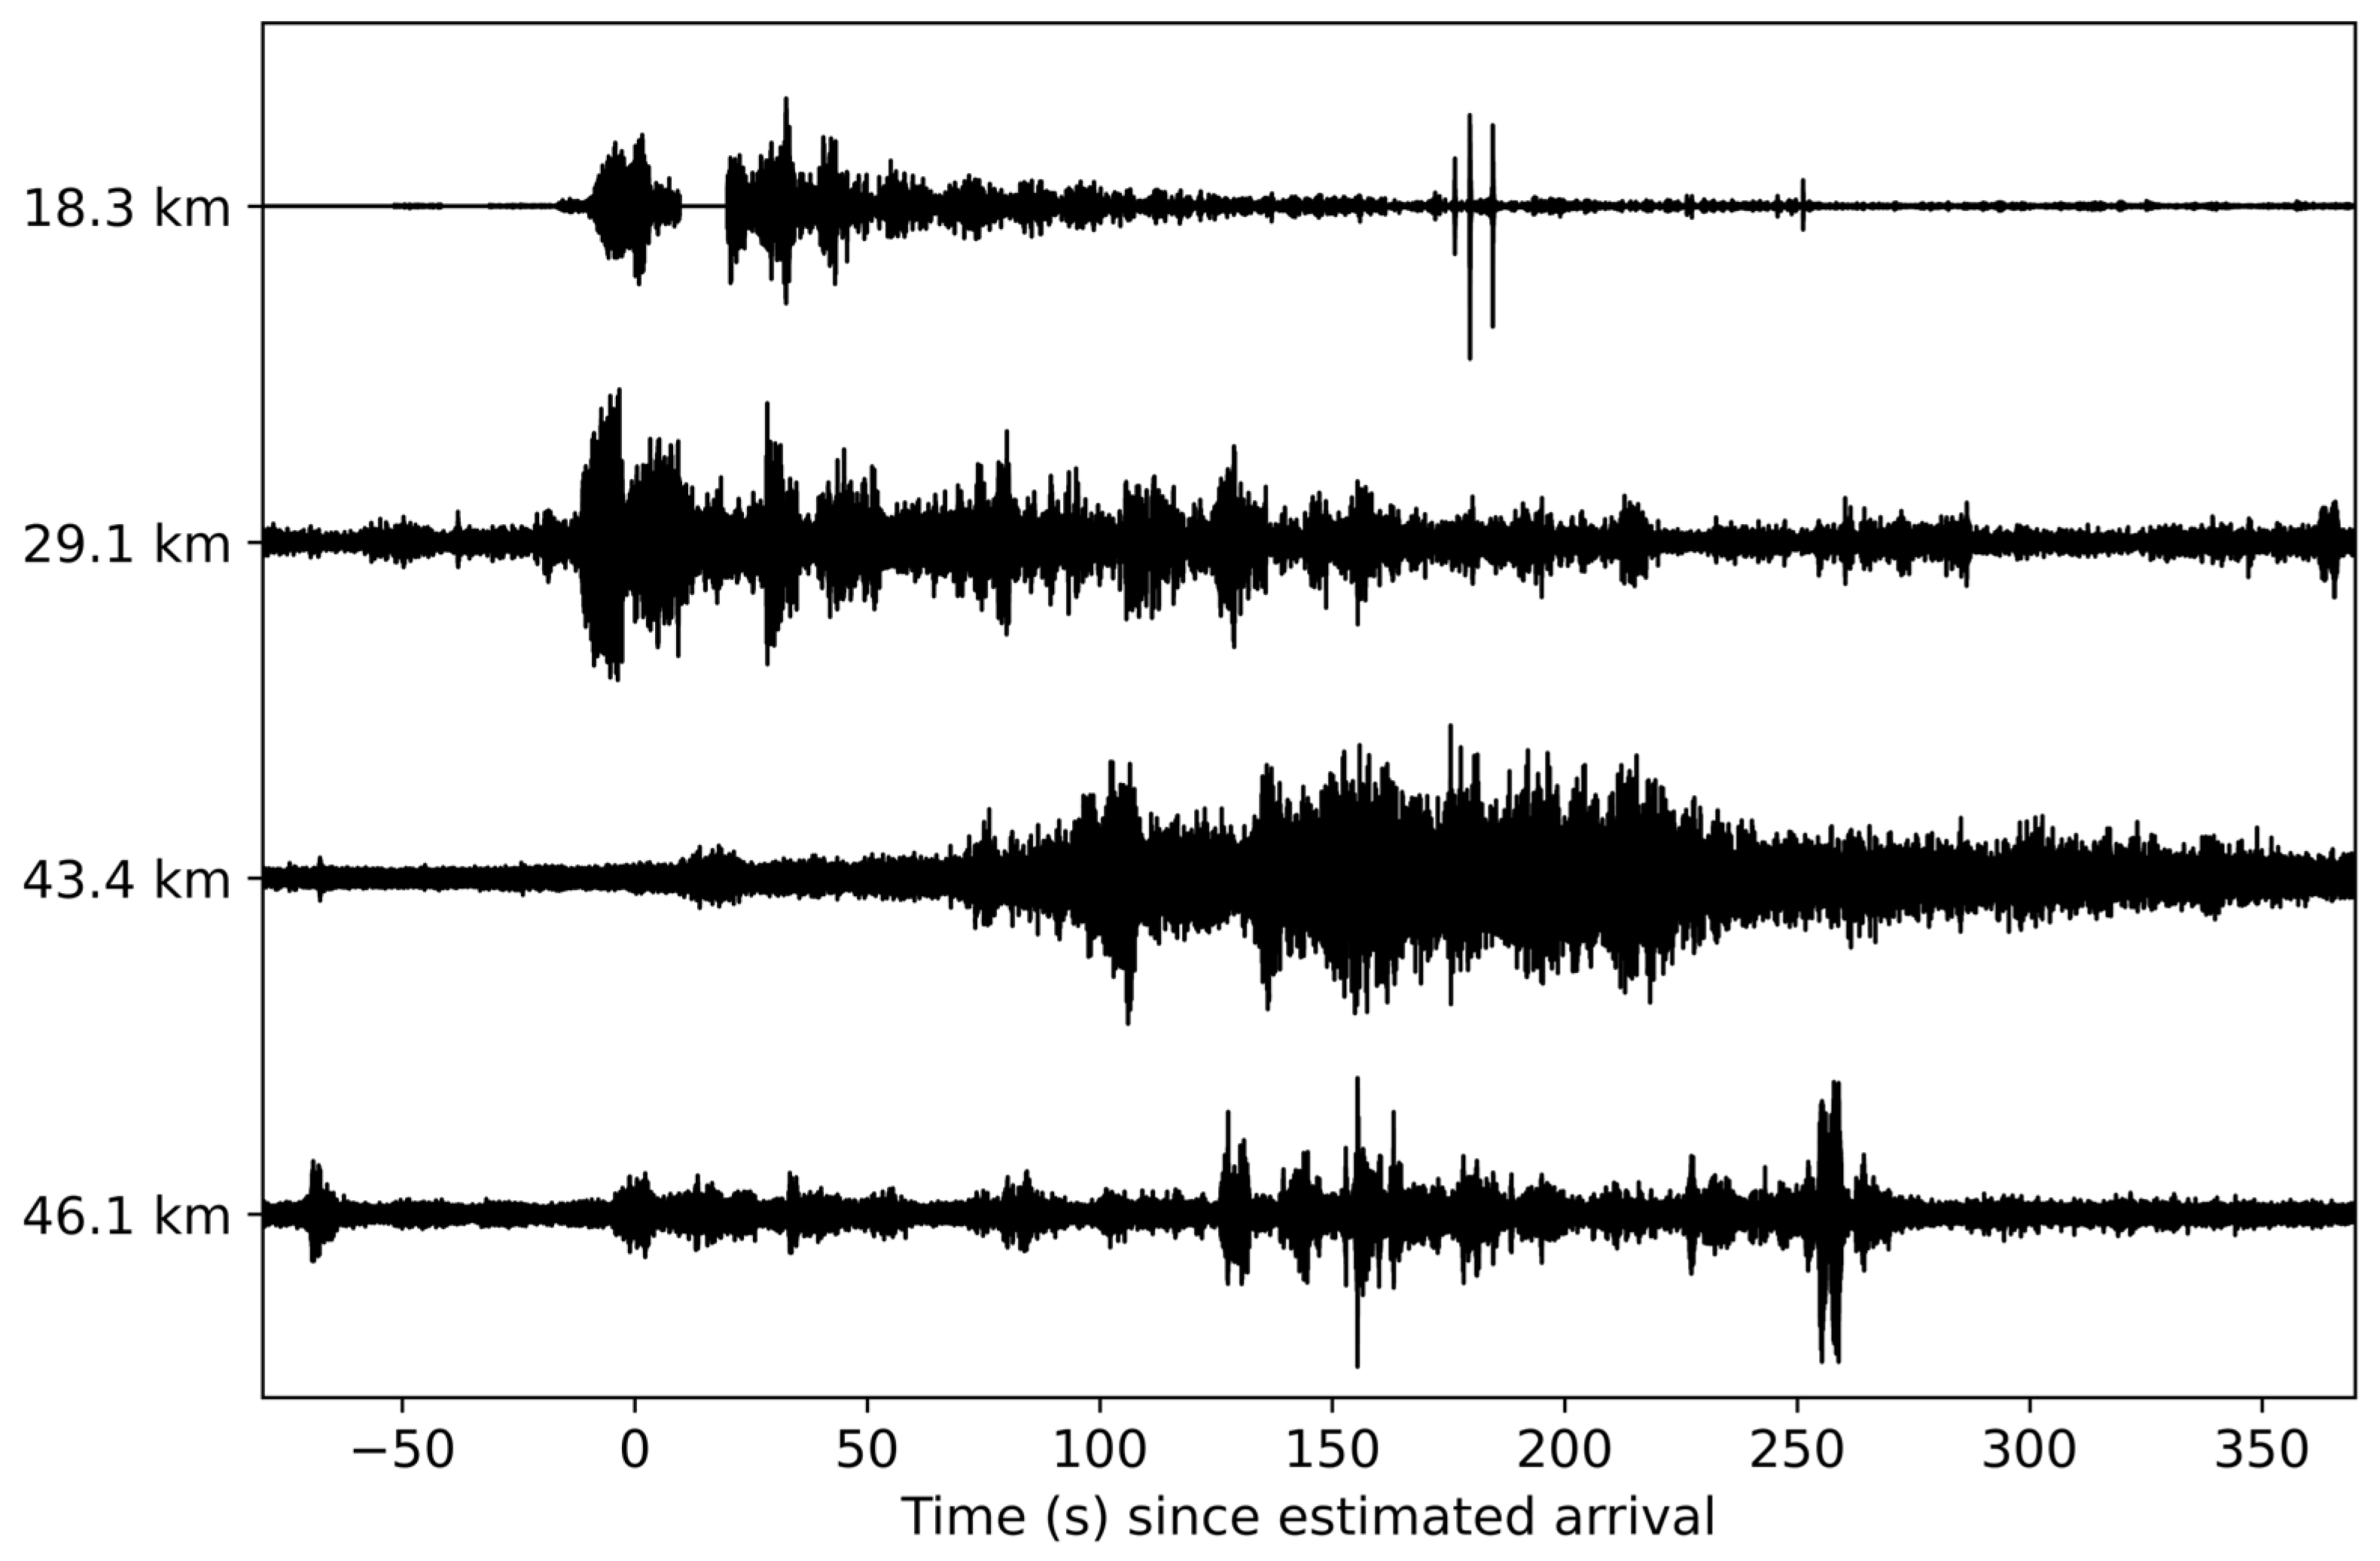
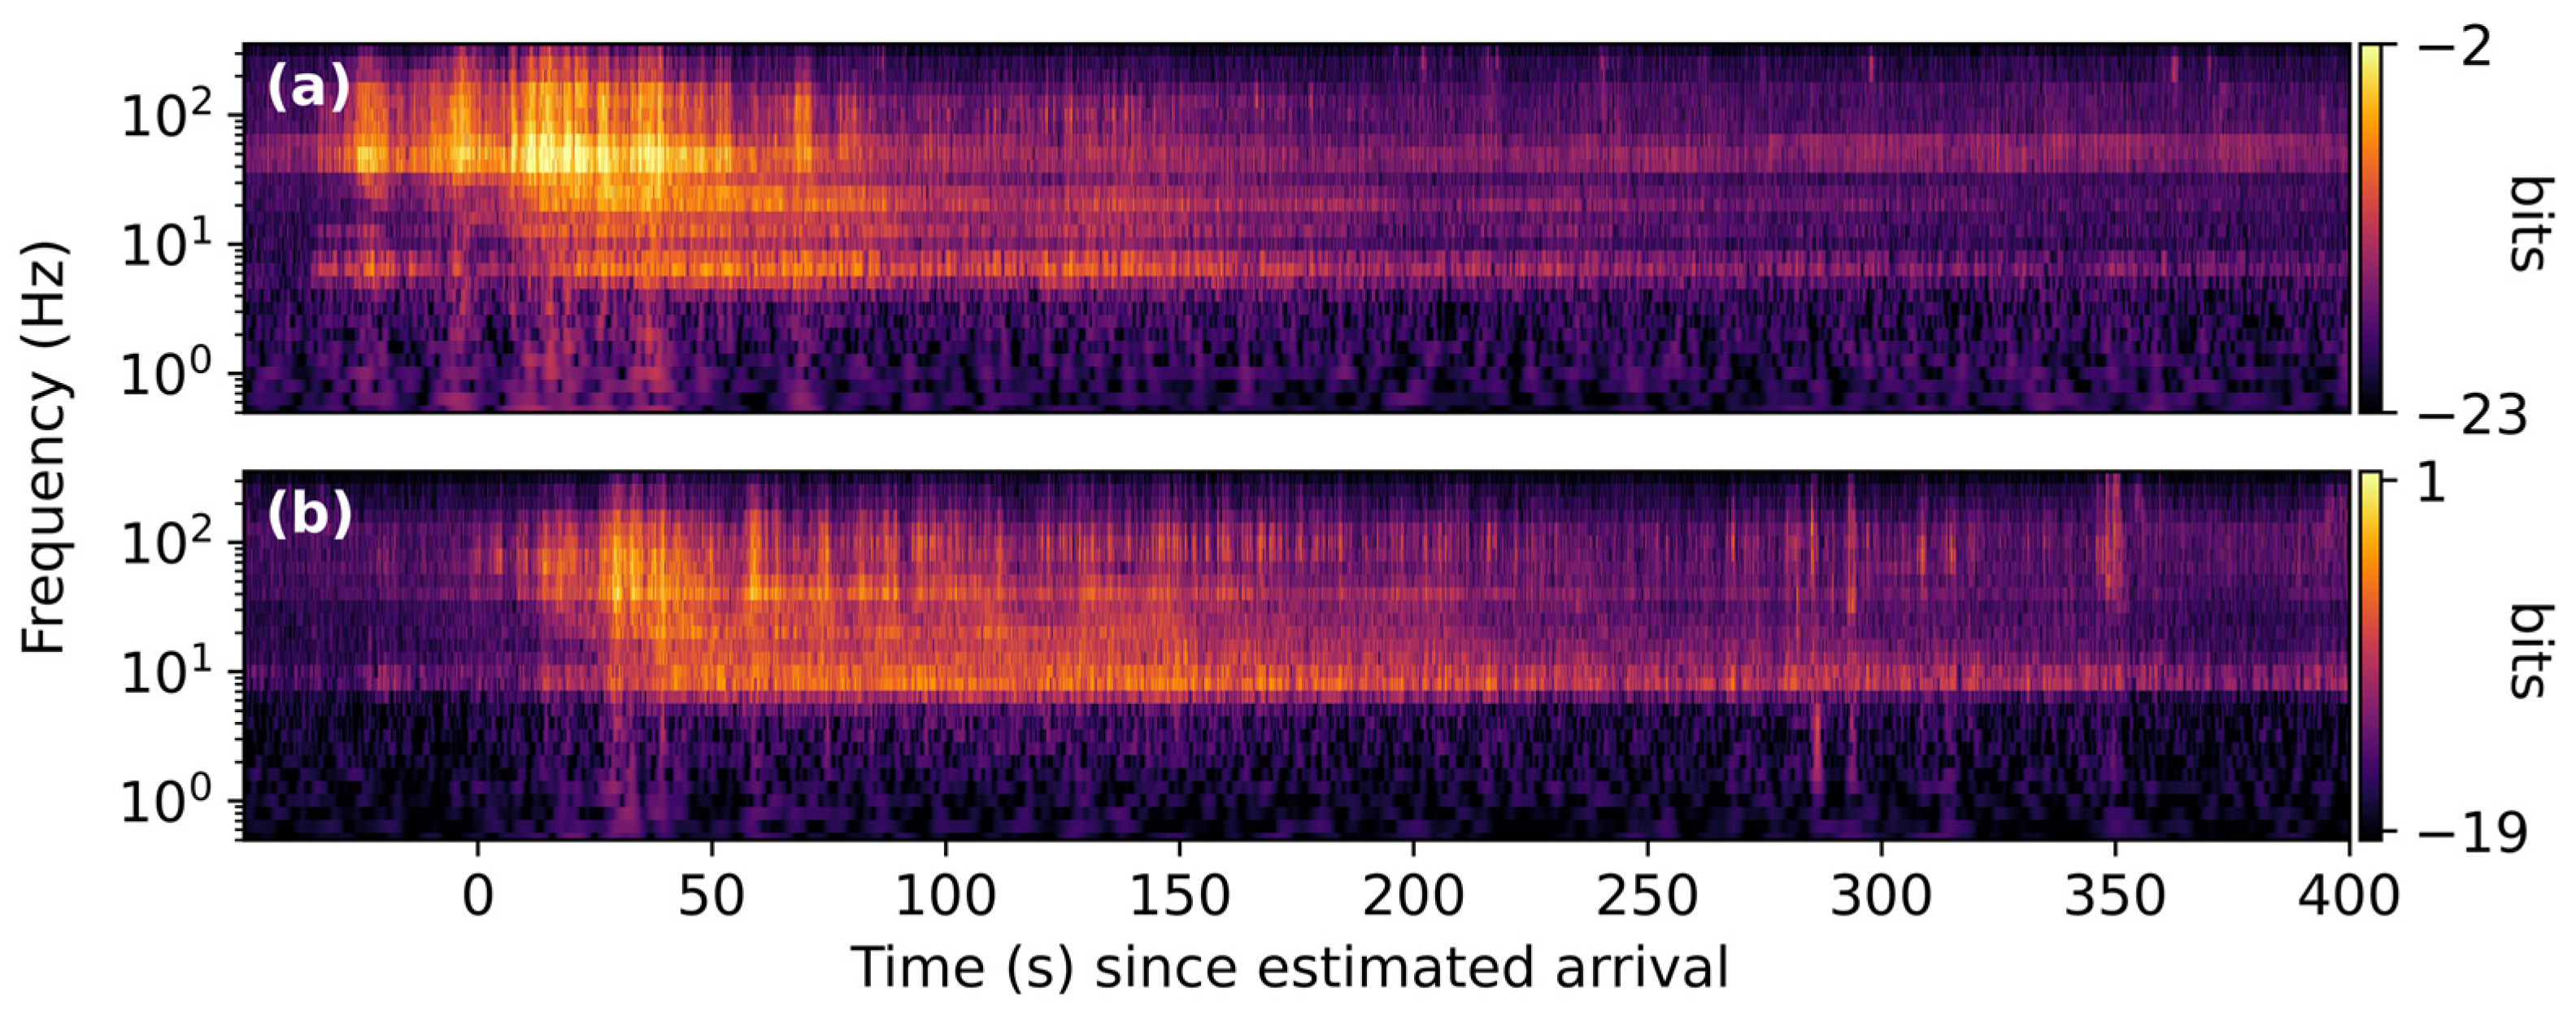
The Delta IV Heavy is a retired heavy-lift launch vehicle manufactured by United Launch Alliance. Its first stage was powered by three RS-68 liquid-fueled engines. All three engines would operate at full thrust for the first 44 s of the launch, after which the central engine would reduce thrust to 55% until the two booster engines separated 242 s after launch, at which point the central engine would return to operating at full thrust. Only the final Delta IV Heavy launch (D-389) is represented in ASTRA, from which one incomplete and three complete signals were collected, the waveforms of which are shown in Figure 11.
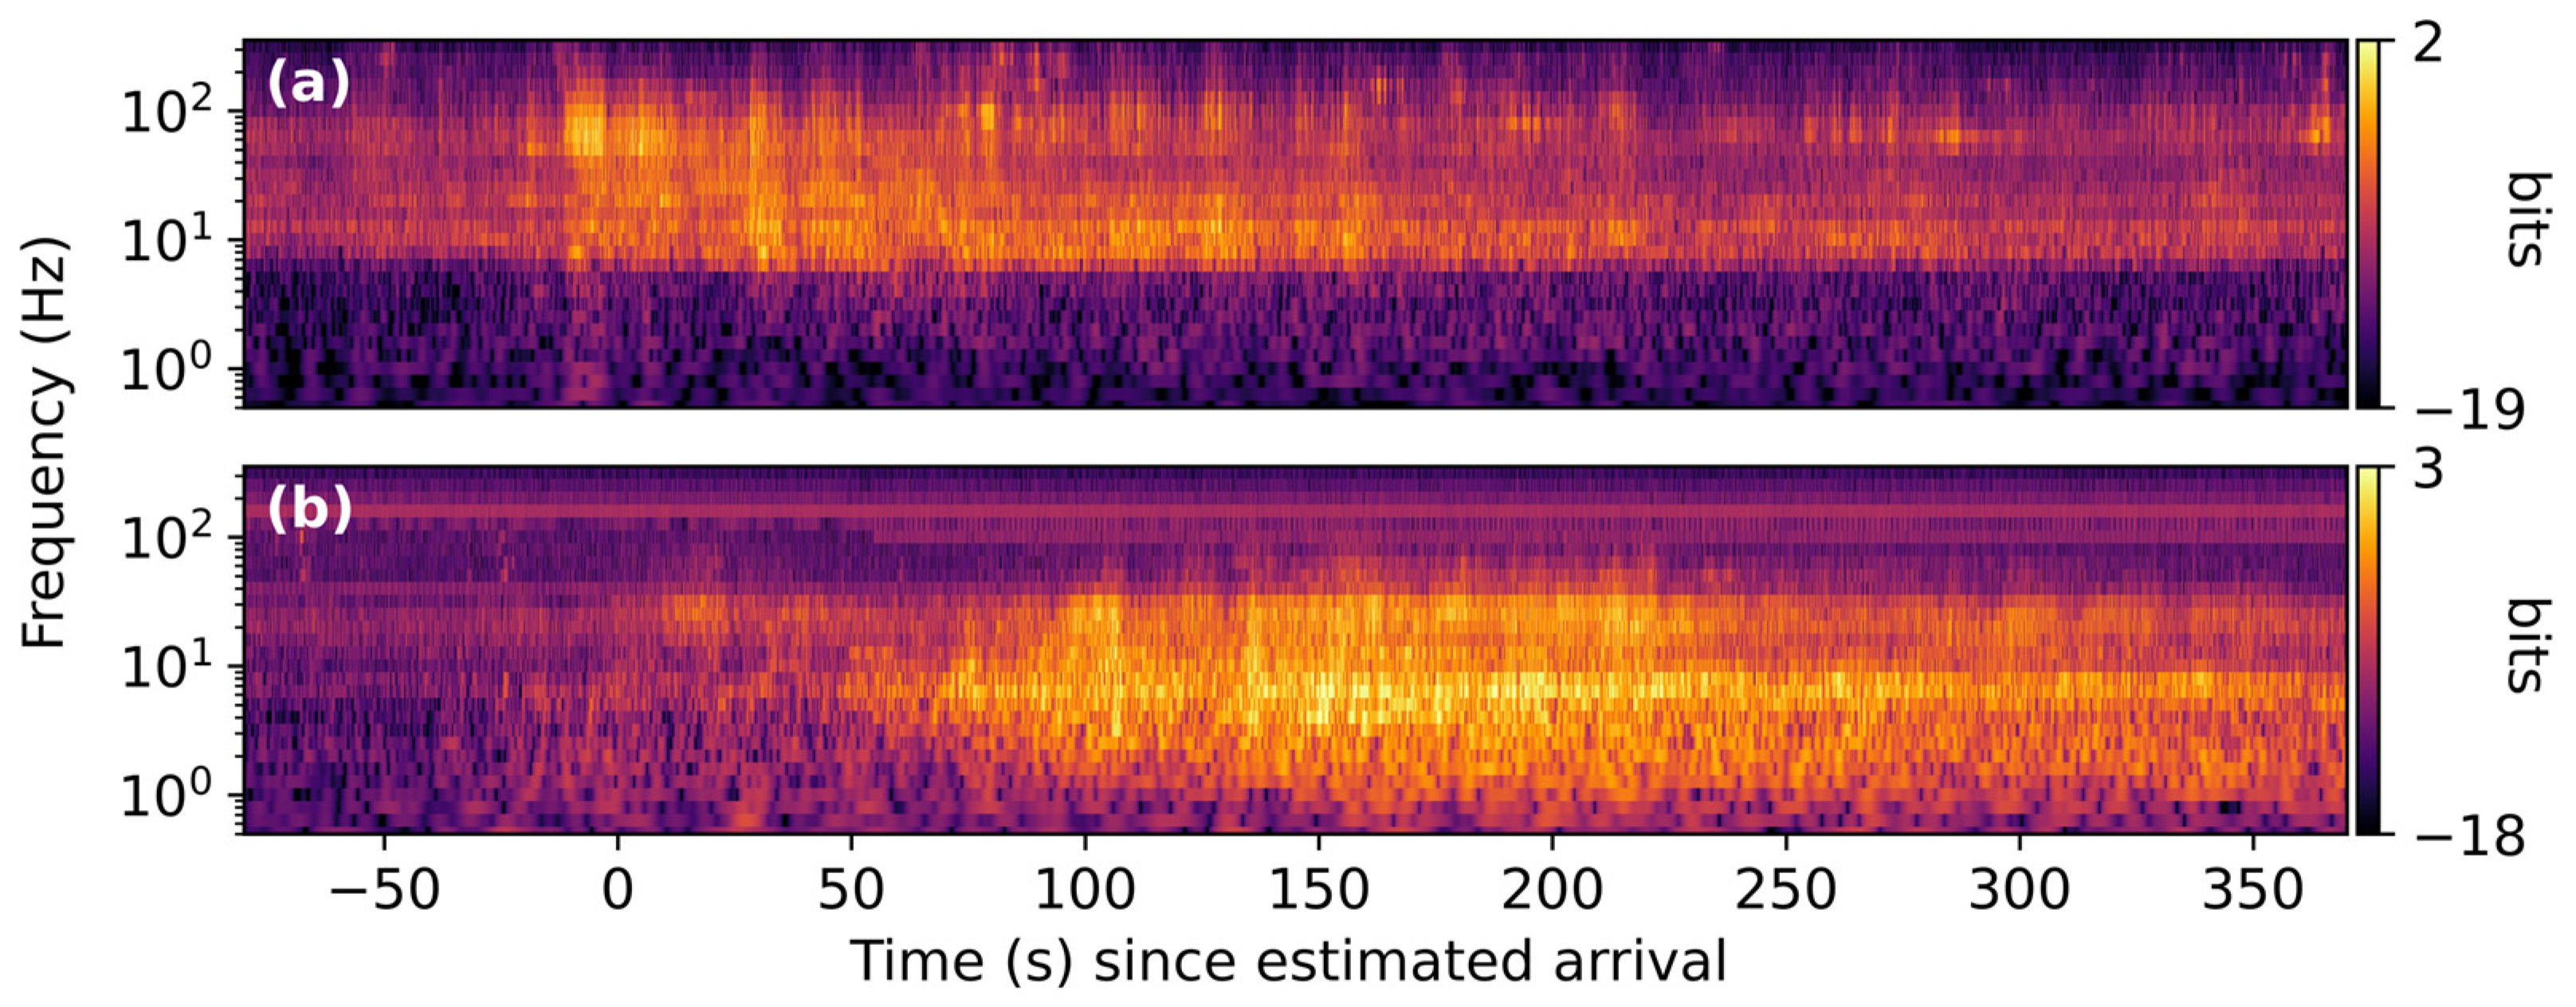
Without any signals in the 50–70 km range class, it is more difficult to assess the effect of propagation on the characteristics of the launch signals. However, the broad trends observed in other rocket types are seen, with the signal onset becoming more emergent and experiencing disproportionate loss of high-frequency content as propagation distance increases, and Doppler shifting of characteristic frequencies as the rocket ascends. In Figure 12a, we see that the frequency distribution of the closest signal is similar to that of the short-range Artemis I data, with power concentrated in bands near 10, 20, and 45 Hz. Like the Falcon Heavy signals, however, there is no leading transient. There is also significantly less power near the start-aligned estimate of arrival time than is seen in the Artemis I or Falcon Heavy signals.

3.4. Vulcan Centaur

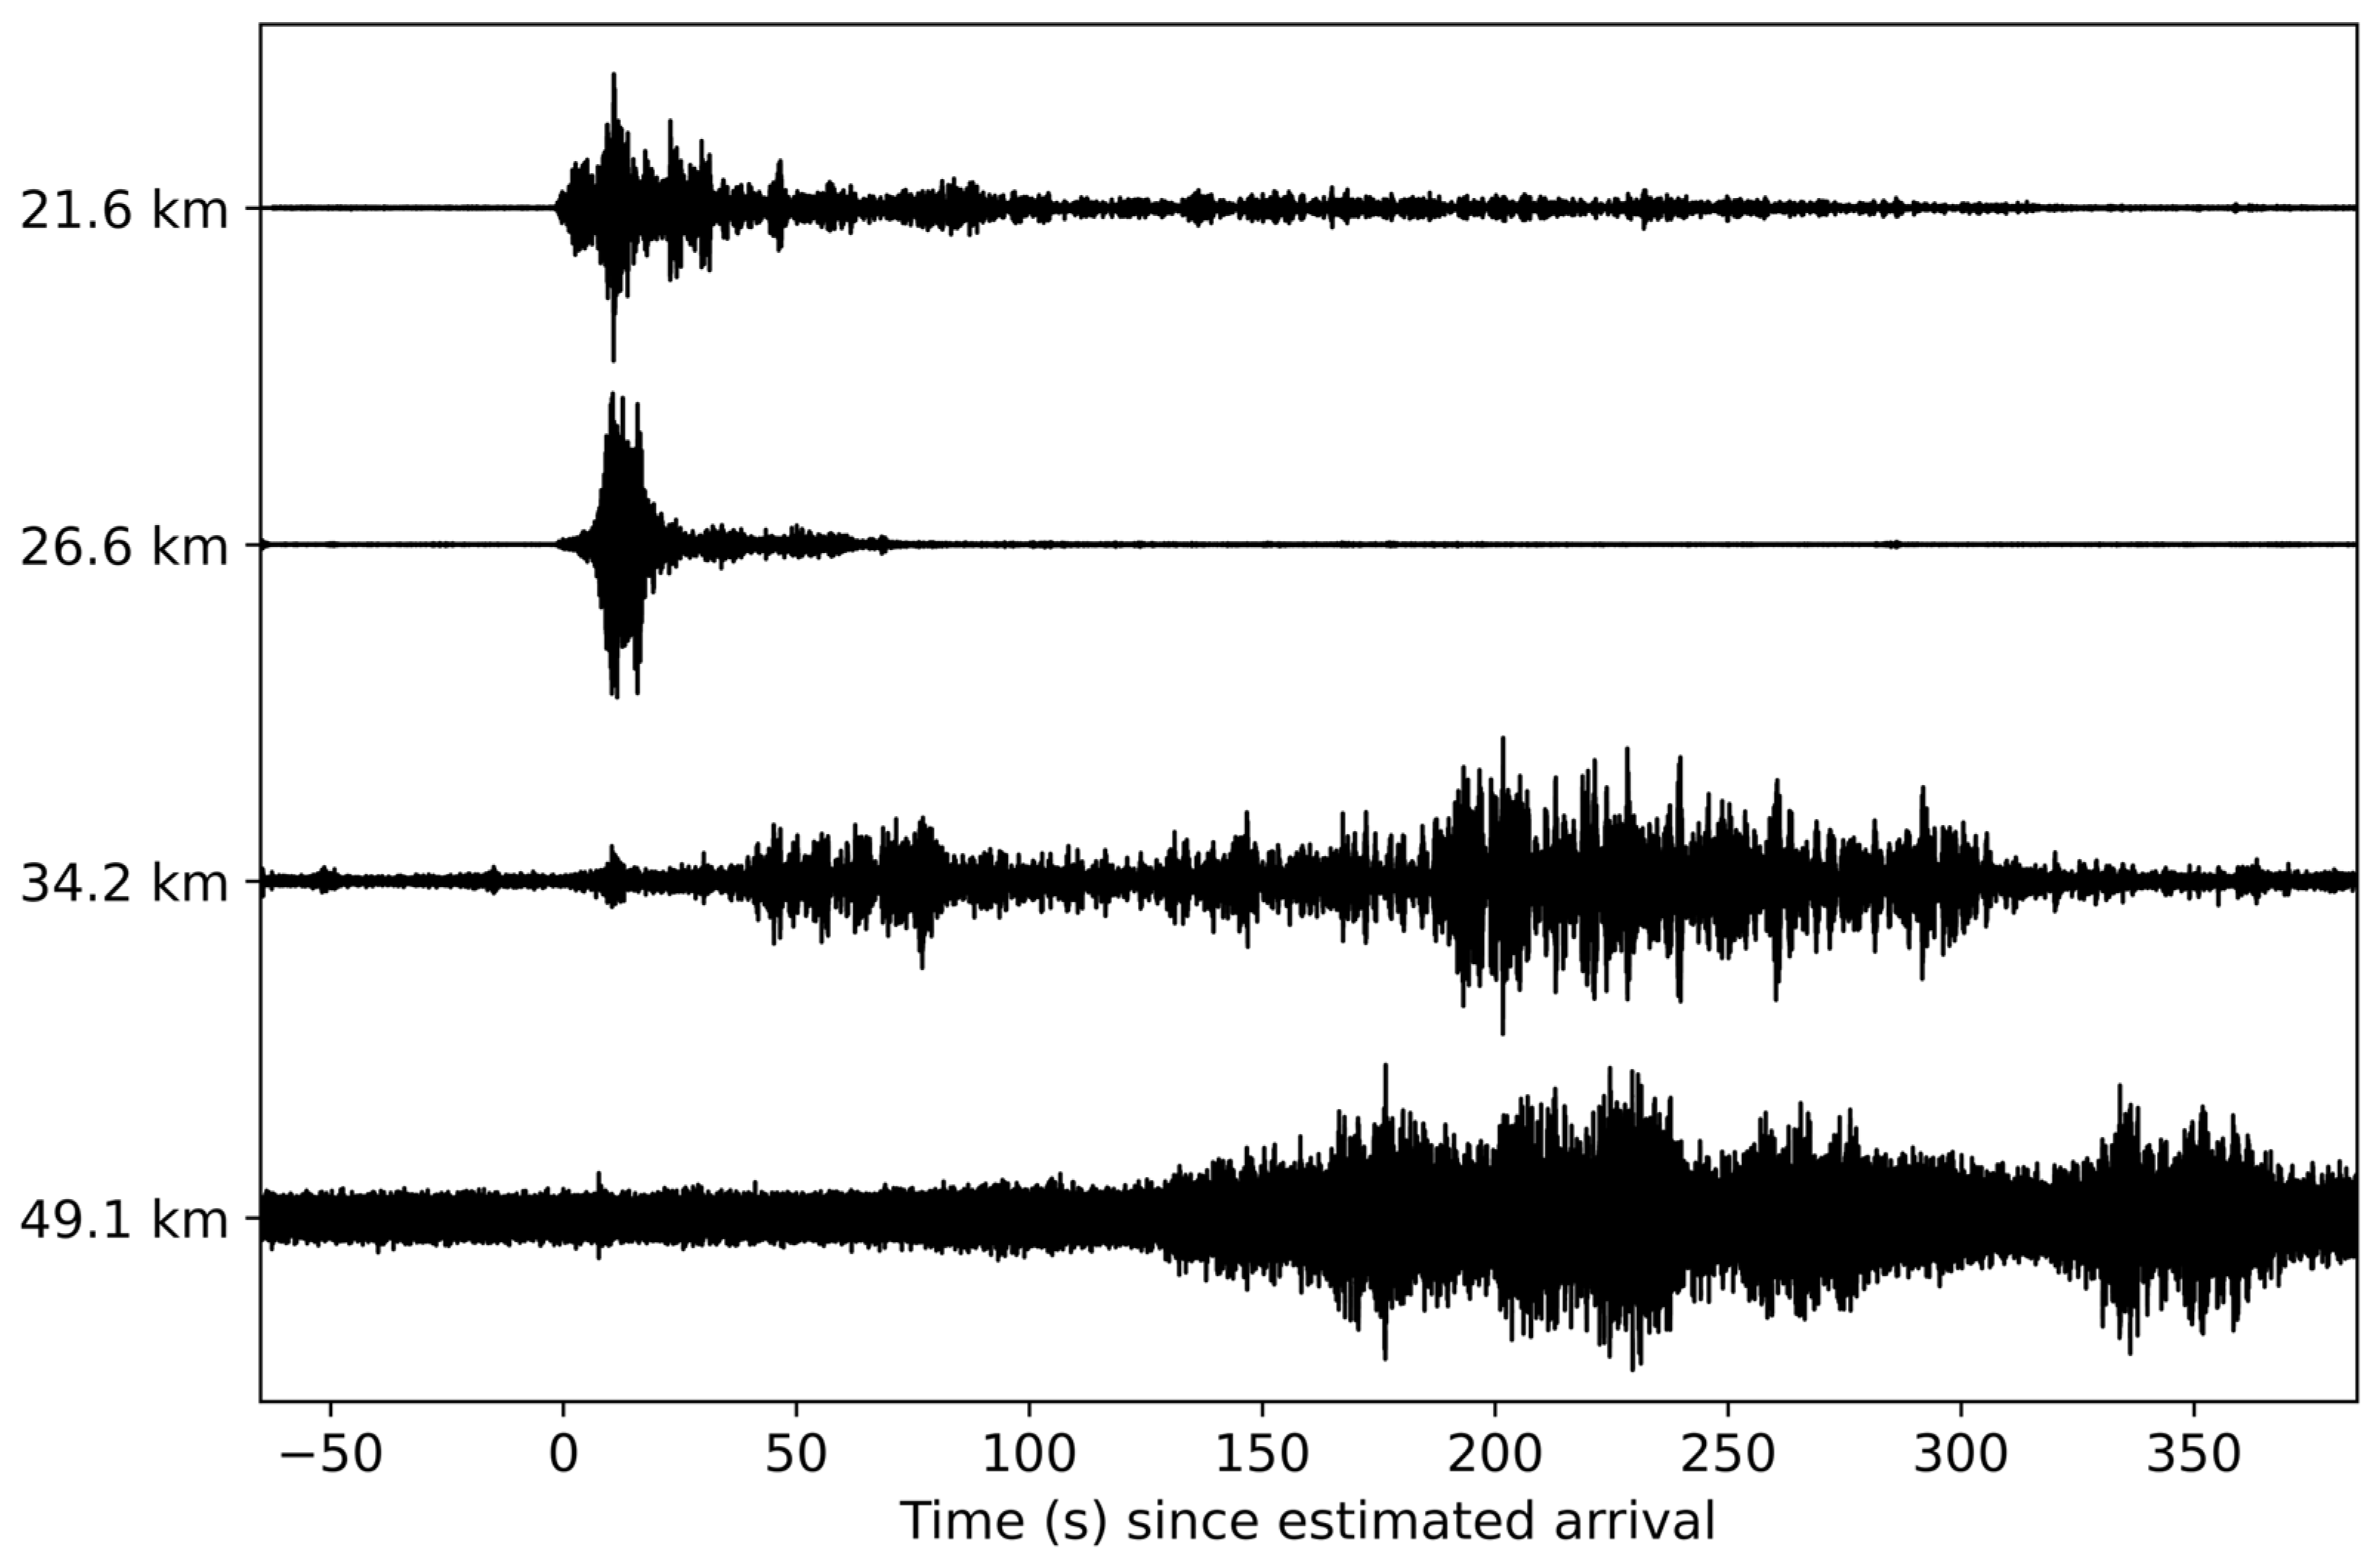
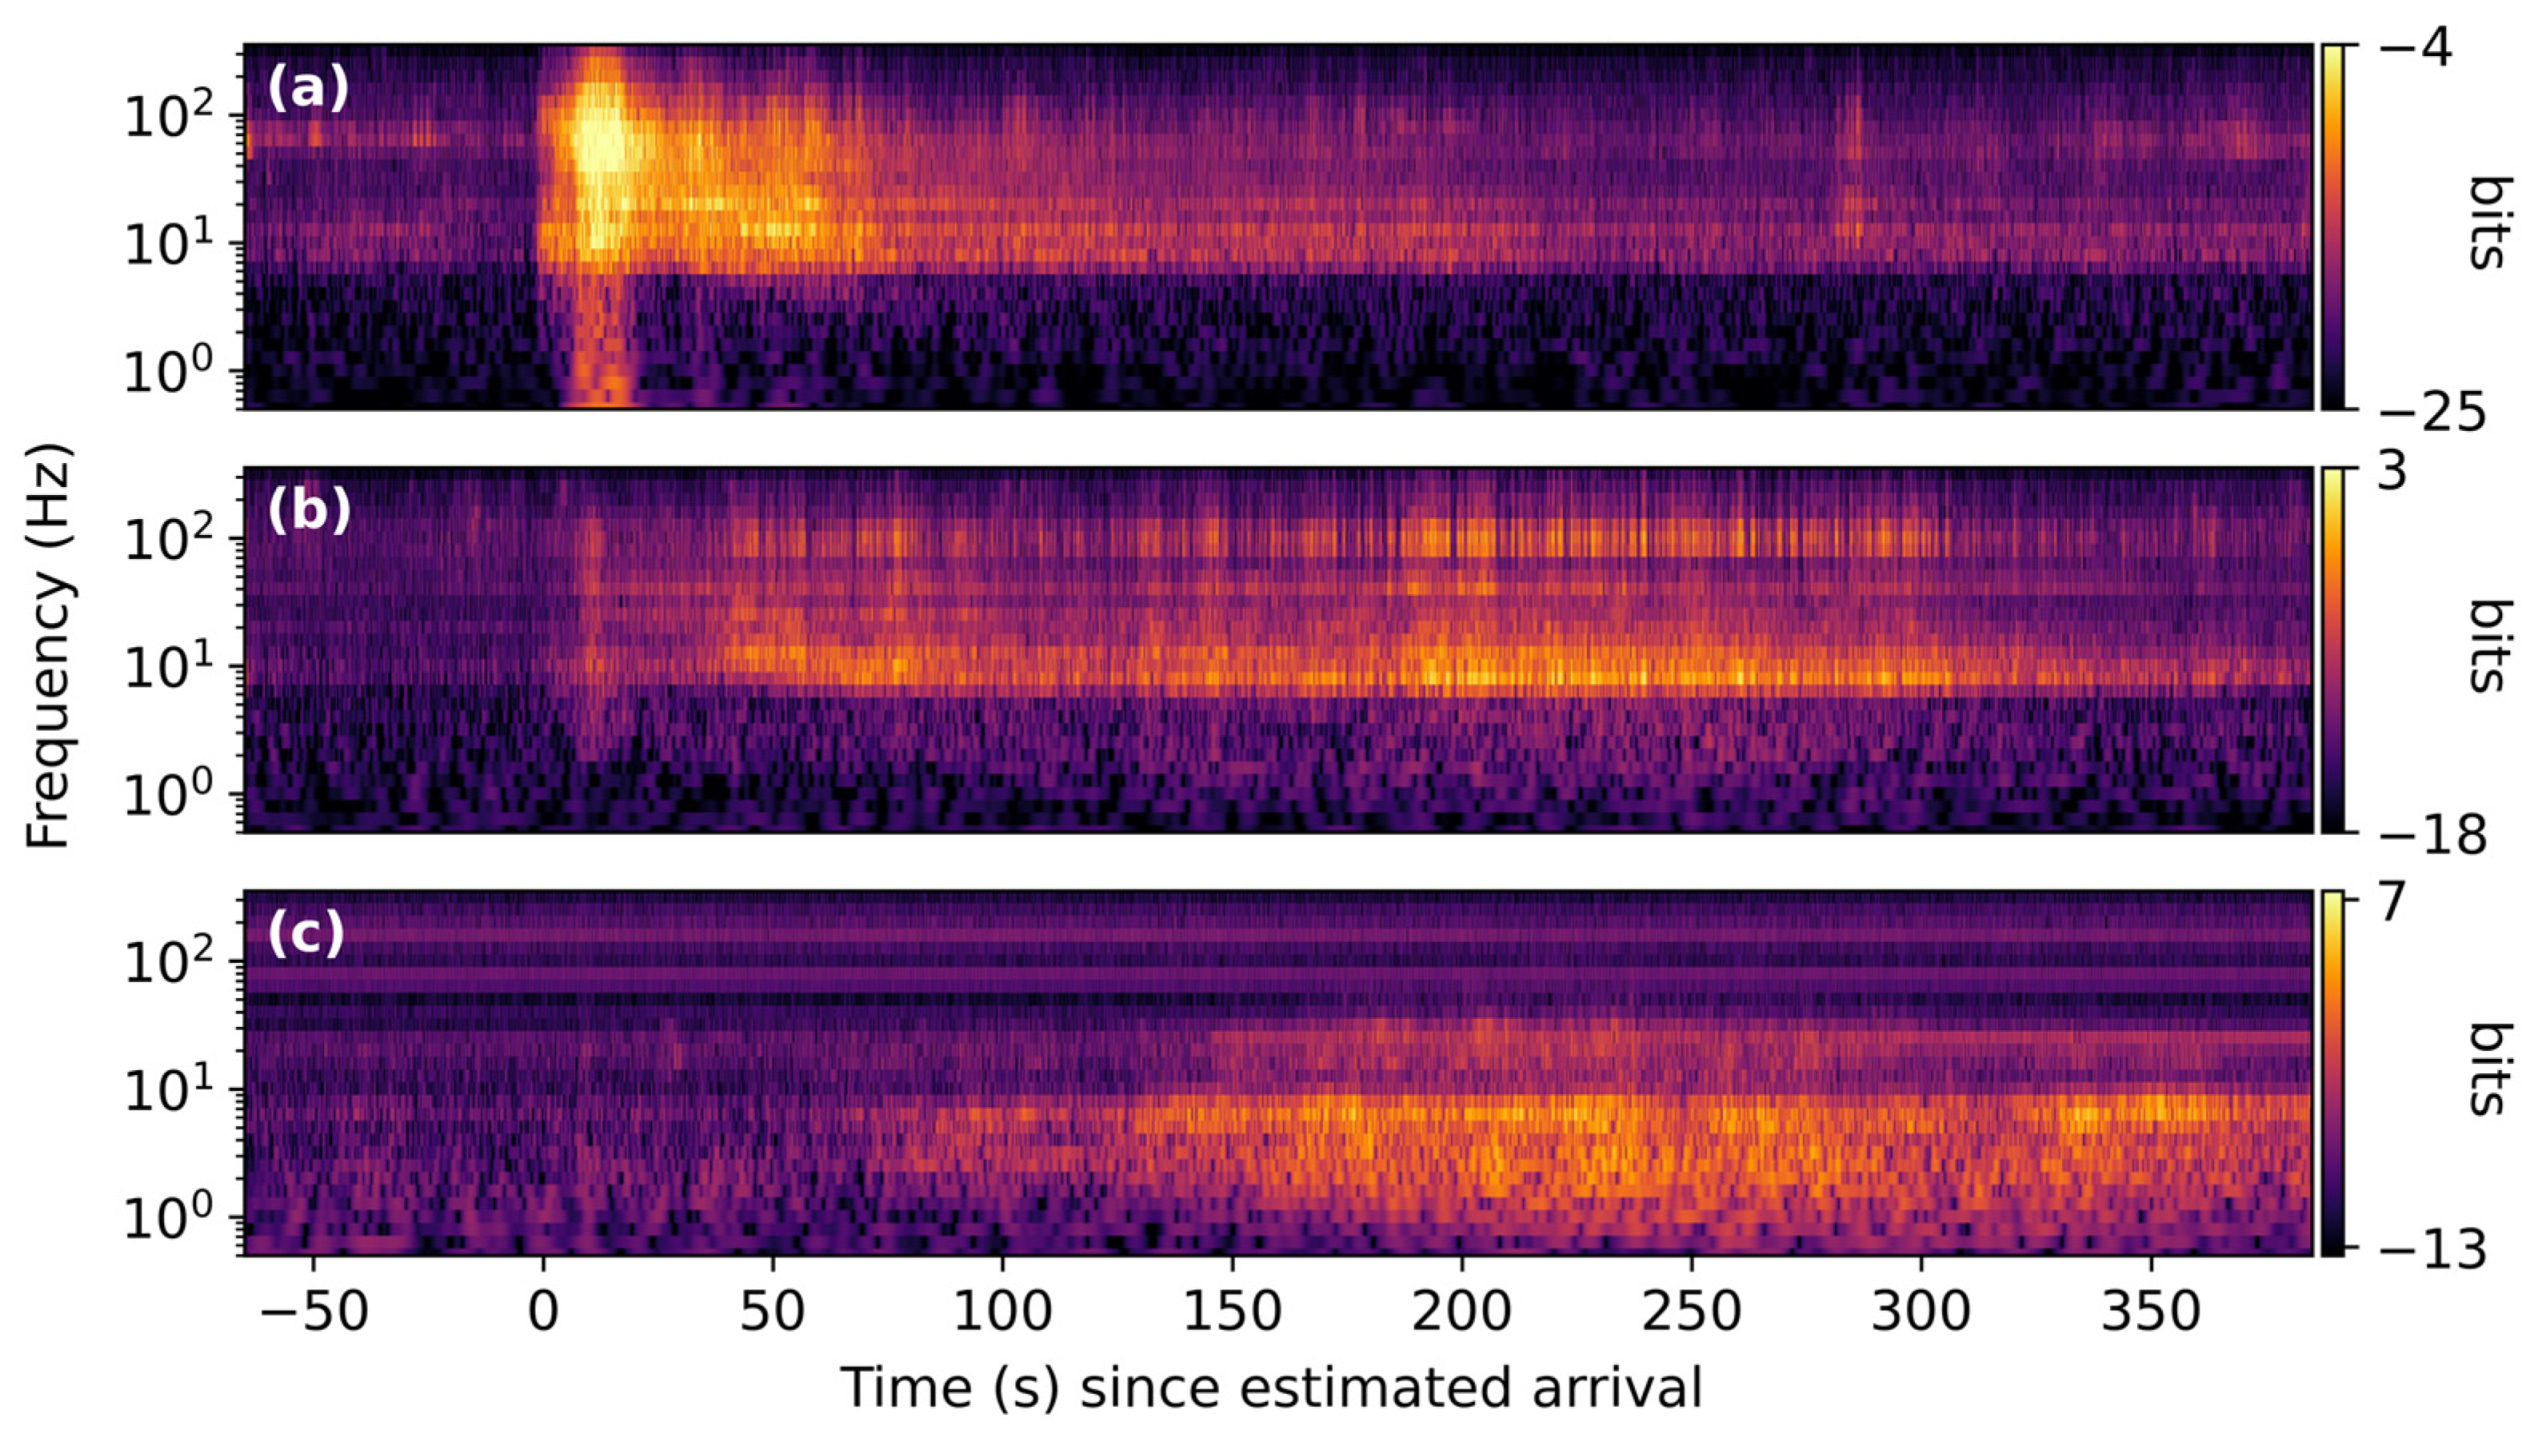
ULA’s Vulcan Centaur is a heavy-lift launch vehicle meant to replace both the Delta IV Heavy and the Atlas V. The first stage of its launch is powered by two liquid-fueled BE-4 engines and zero to six GEM 63XL solid rocket boosters (SRBs). ASTRA contains only four Vulcan Centaur signals, all of which originate from a single launch: Cert-1 V-001, which used two SRBs. The four waveforms collected from the launch are shown in Figure 13. The two signals collected at a less than 30 km range are spindle-shaped, with short-duration high-amplitude segments (~50 s) and no leading transient, as can be seen in Figure 14. The propagation effects and Doppler shifts are similar to those observed for other rockets. However, like the Delta IV Heavy, the Vulcan Centaur signals collected at ranges greater than 30 km show significantly less power near the start-aligned estimate of arrival time than those from Artemis I or Falcon Heavy launches.

3.5. Falcon 9

SpaceX’s Falcon 9 is a medium-lift launch vehicle with a first stage powered by nine Merlin 1D+ liquid-fuel engines. The Falcon 9 is the most represented rocket type in ASTRA by a wide margin, with 949 signals originating from 211 launches. Due to the sheer number of Falcon 9 launches in the dataset, there are numerous outliers. In general, however, the waveforms from most Falcon 9 launches are similar to those shown in Figure 15, which are from launch SL-G607. At a less than 30 km range, the waveforms are spindle-shaped, show high chronological symmetry about the peak amplitude, and have durations of ~60 s. There is no smaller transient leading the high-amplitude, spindle-shaped signal. As the propagation distance increases, the signal elongates and the onset becomes more emergent, but the strong peak separation observed in signals from the super-heavy lift class is not observed.
In the time–frequency domain, we see that power is concentrated in frequency bands near 10, 20, 45, and 100 Hz, with the dominant band shifting to lower frequencies as the propagation distance increases. As with the other examples, the signals are Doppler-shifted as the rocket ascends, seen clearly in Figure 16c.

3.6. Atlas V

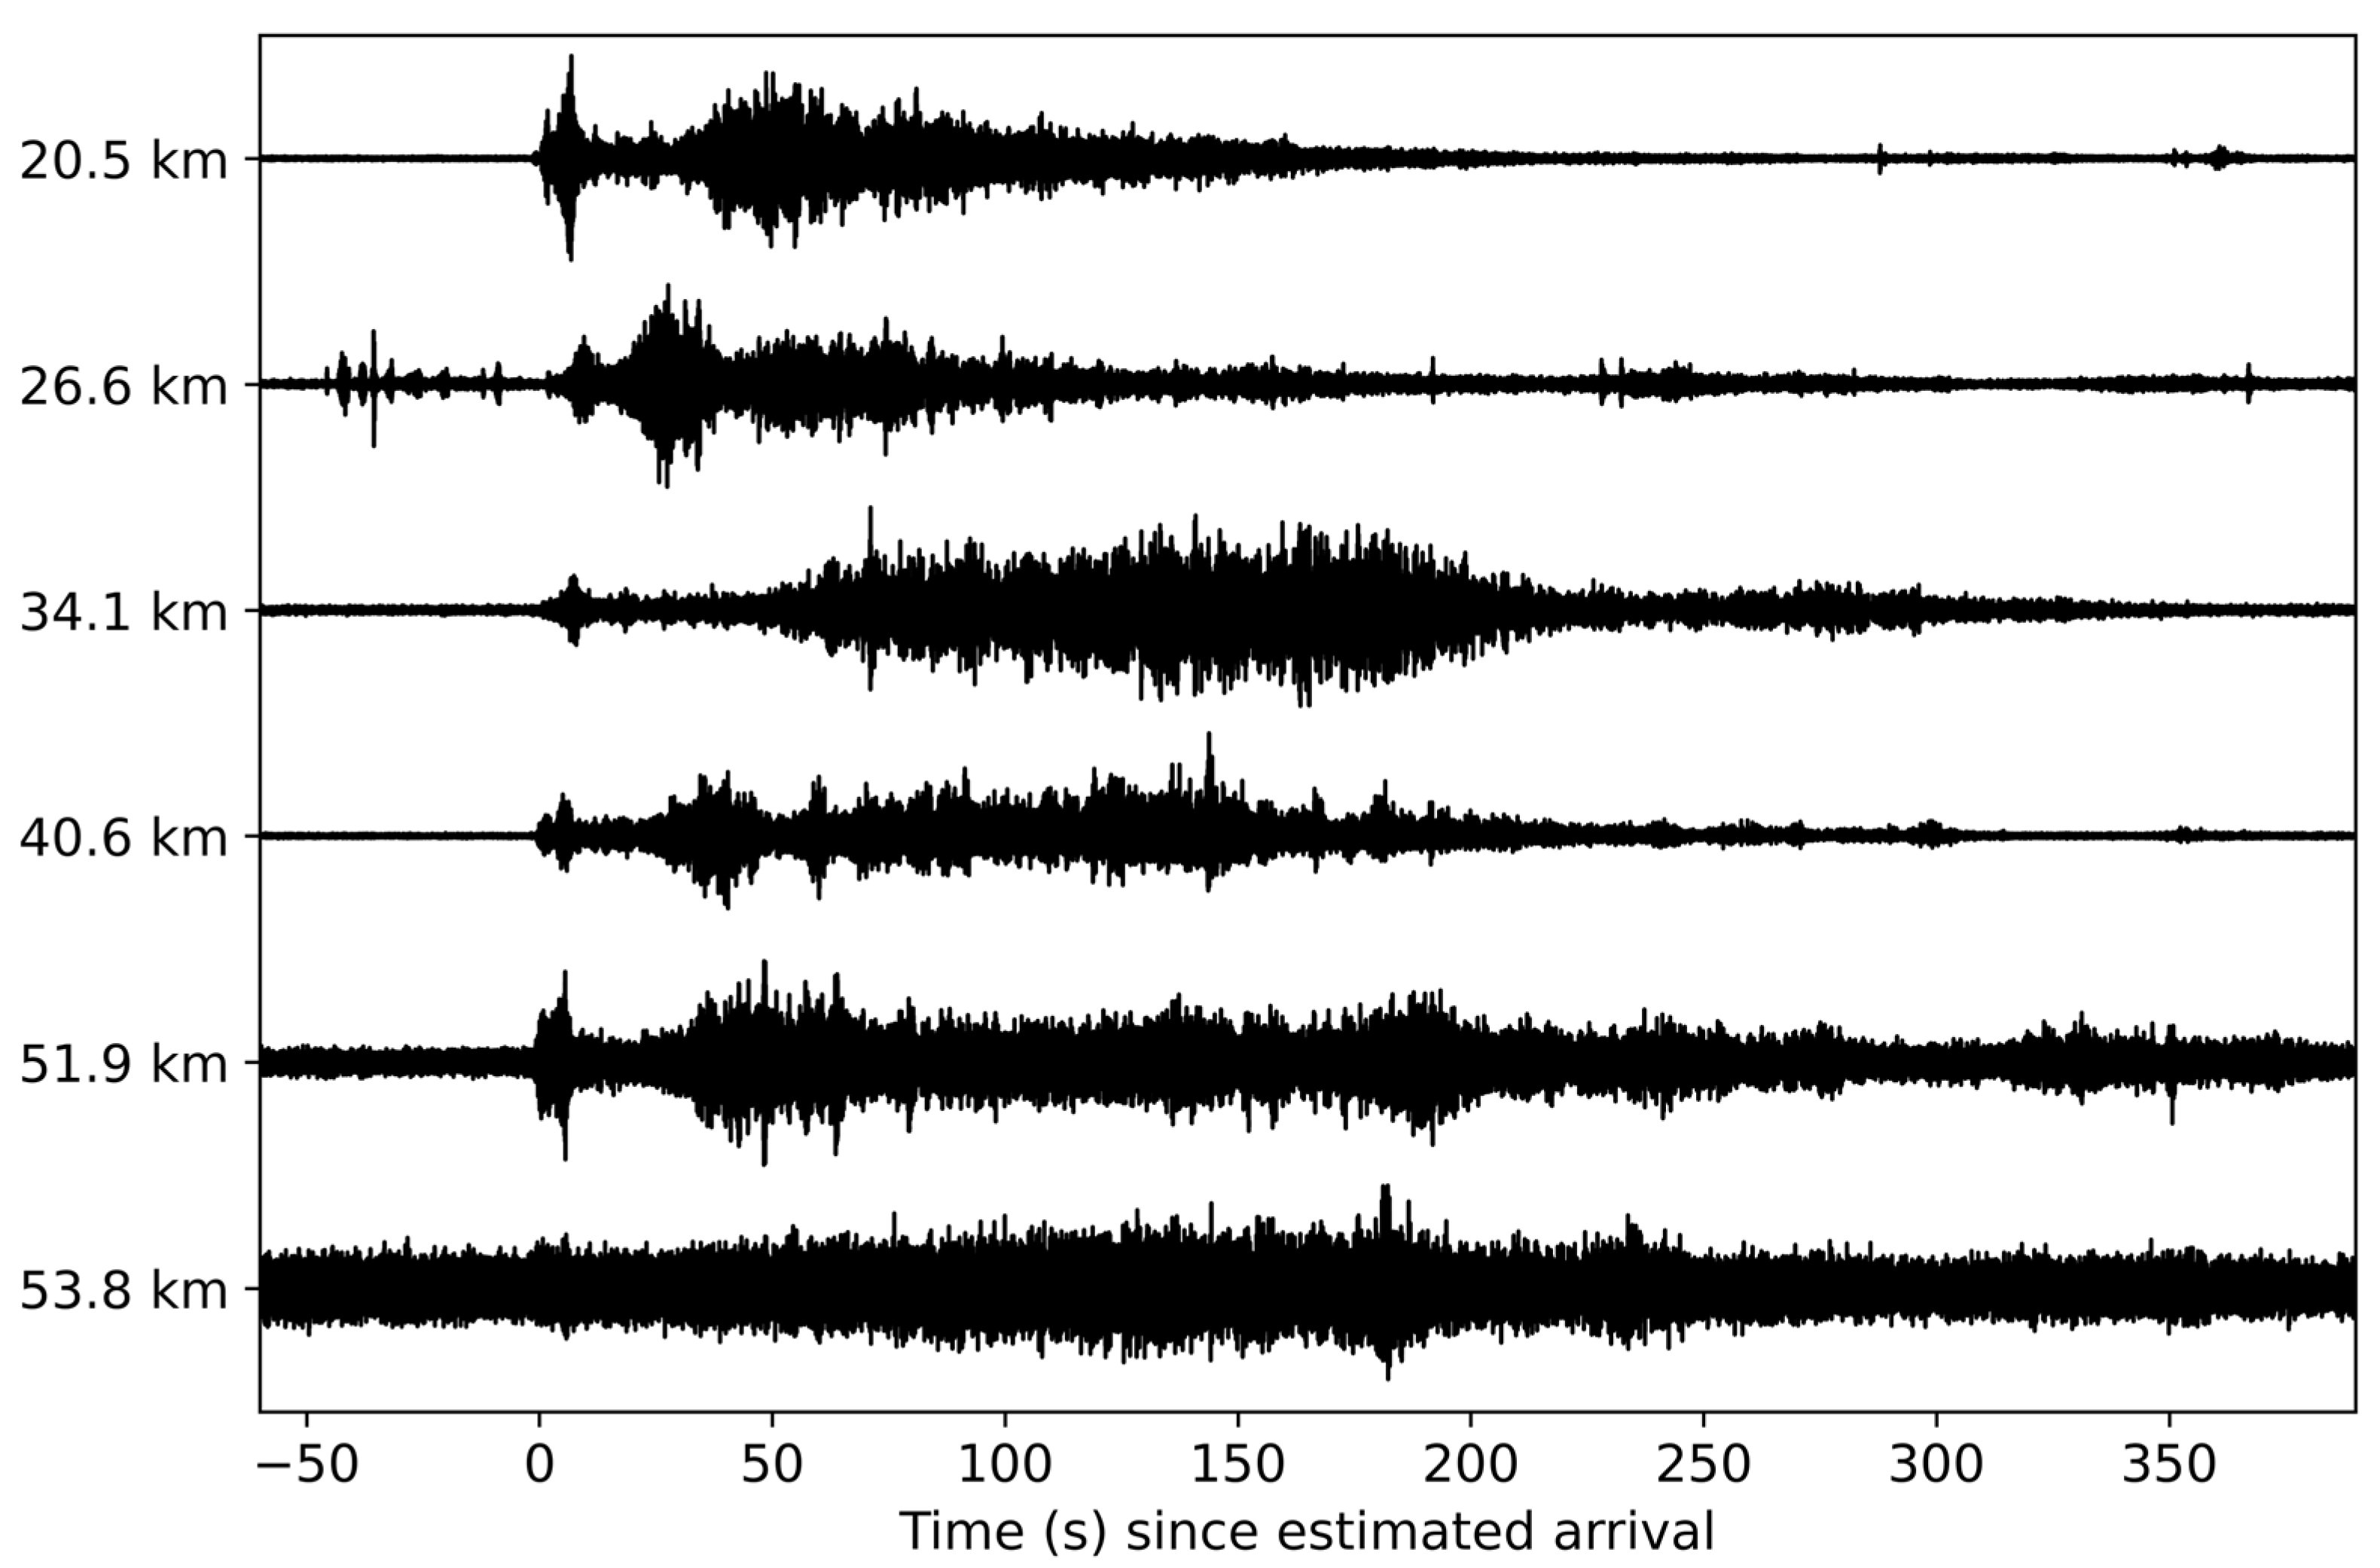
ULA’s Atlas V is a medium-lift launch vehicle with a first stage powered by one NPO Energomash RD-180 liquid-fuel engine and up to five SRBs. It is the second most represented rocket type in the dataset, with 77 signals originating from 19 launches. Due in part to the variable number of SRBs, the characteristics of Atlas V signals can vary significantly from launch to launch. For configurations with four to five SRBs, the waveforms are similar to those shown in Figure 17, which are from a launch using five SRBs. At a less than 30 km range, the waveforms are characterized by impulsive onsets similar to those seen in the Artemis I data, followed shortly thereafter by a more emergent onset, longer duration signal. The expected propagation effects are observed, as is a less extreme version of the peak separation seen in the Artemis I data.
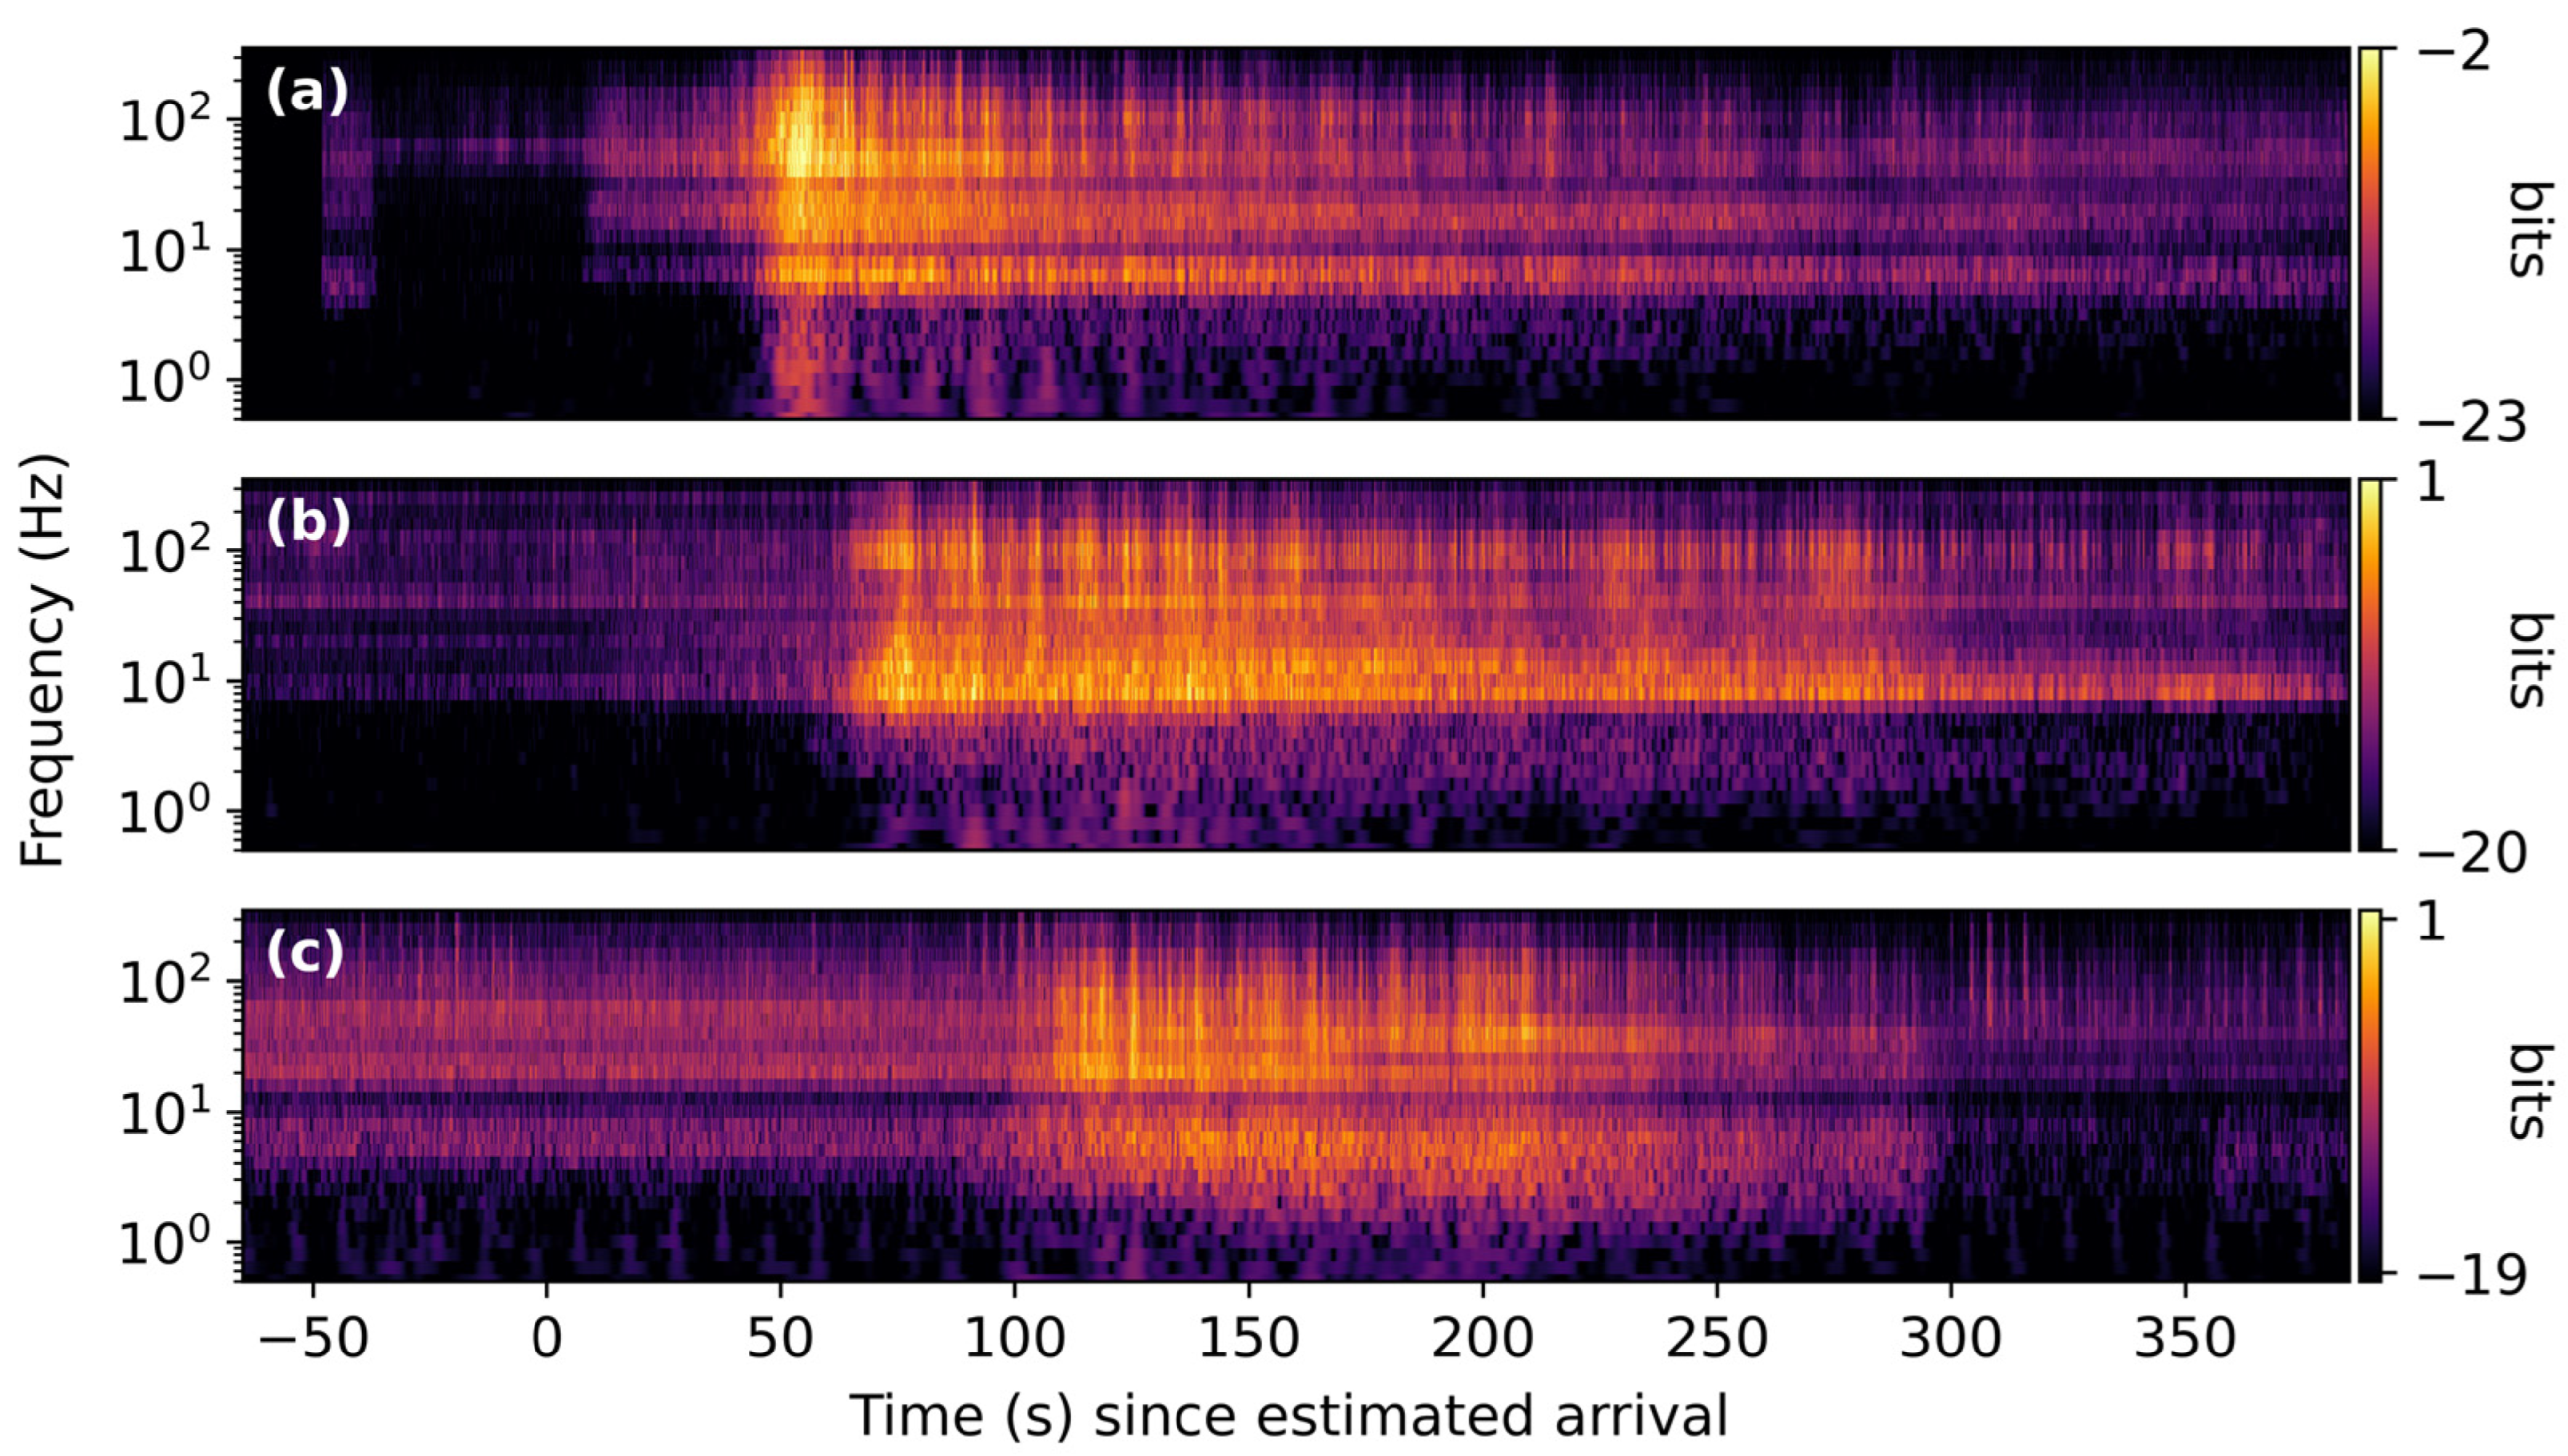
In the time–frequency domain, transient signals near the aligned-start estimate of arrival time are present at all ranges, with a characteristic frequency near 6 Hz, while the power of the main launch signal is concentrated near 10, 20, and 45 Hz, with the 10 Hz band dominating at ranges greater than 30 km, as seen in Figure 18.
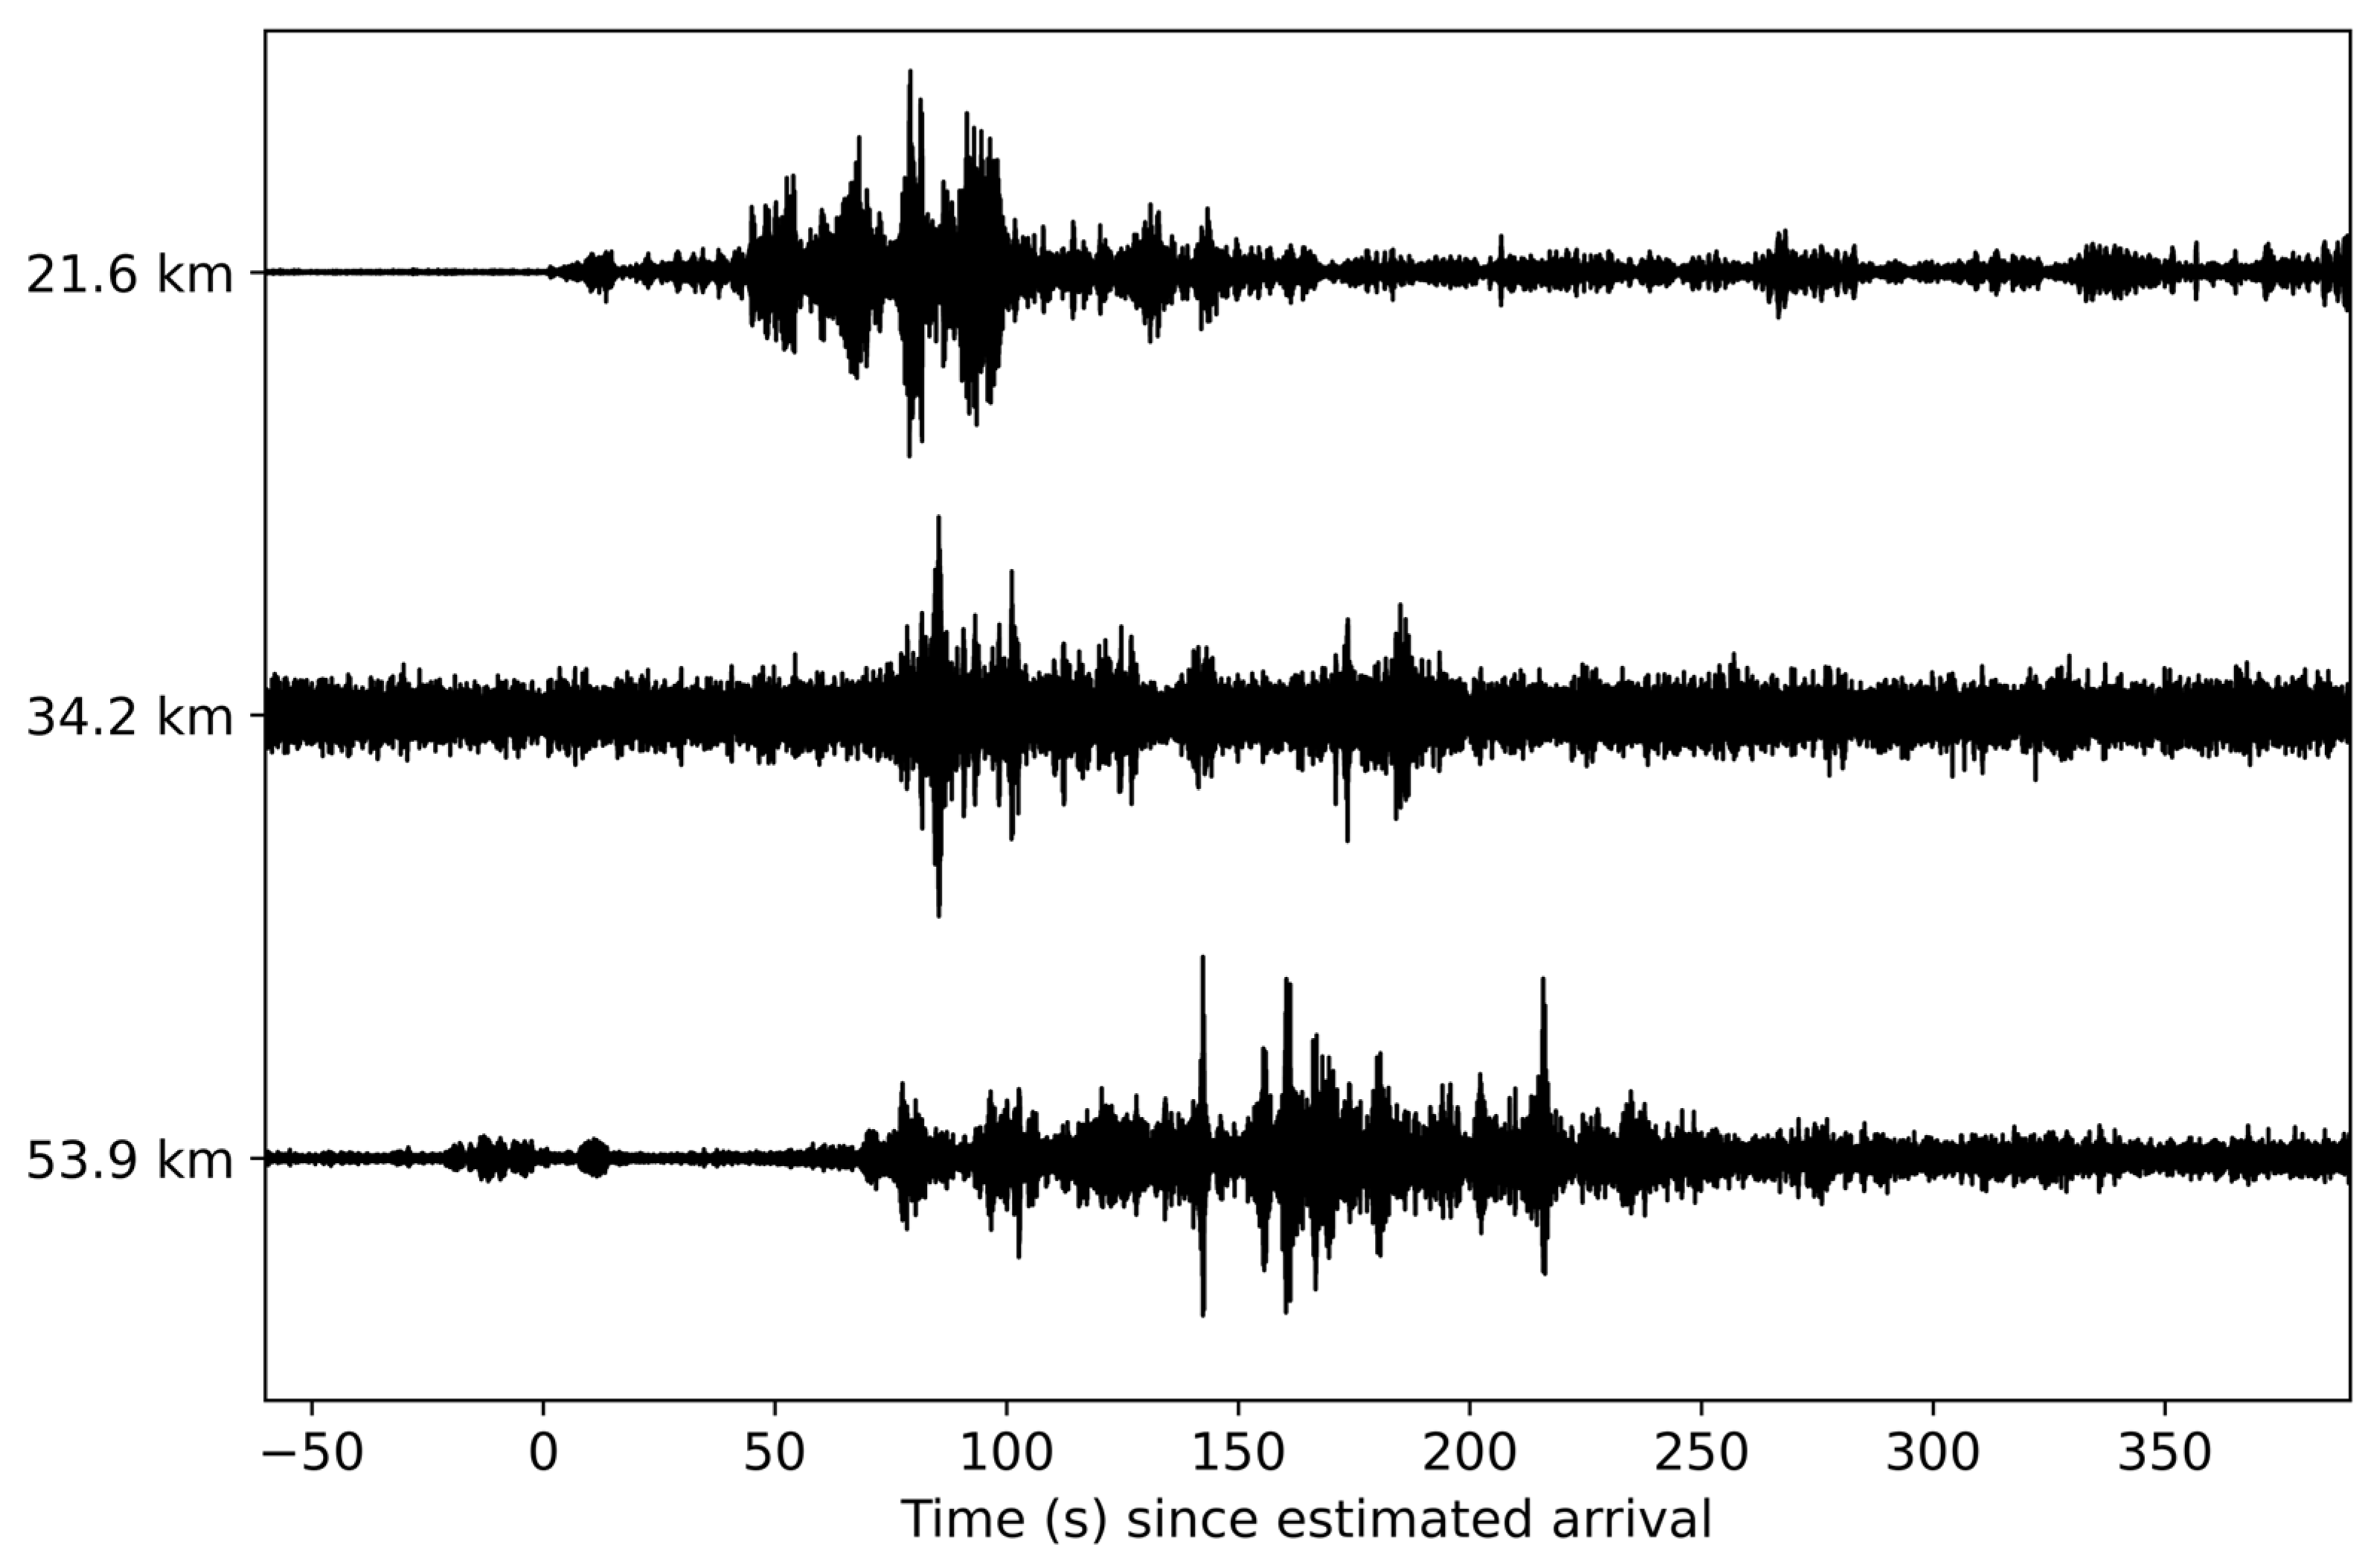
Alternatively, Atlas V configurations without SRBs show fewer similarities with Artemis I data and more with data from Falcon 9 launches. Figure 19 and Figure 20 show data from Atlas V launch AV-104, which used a configuration without SRBs. The 6 Hz transient leading the main launch signal in the previous example does not appear.

3.7. Small-Lift Launch Vehicles

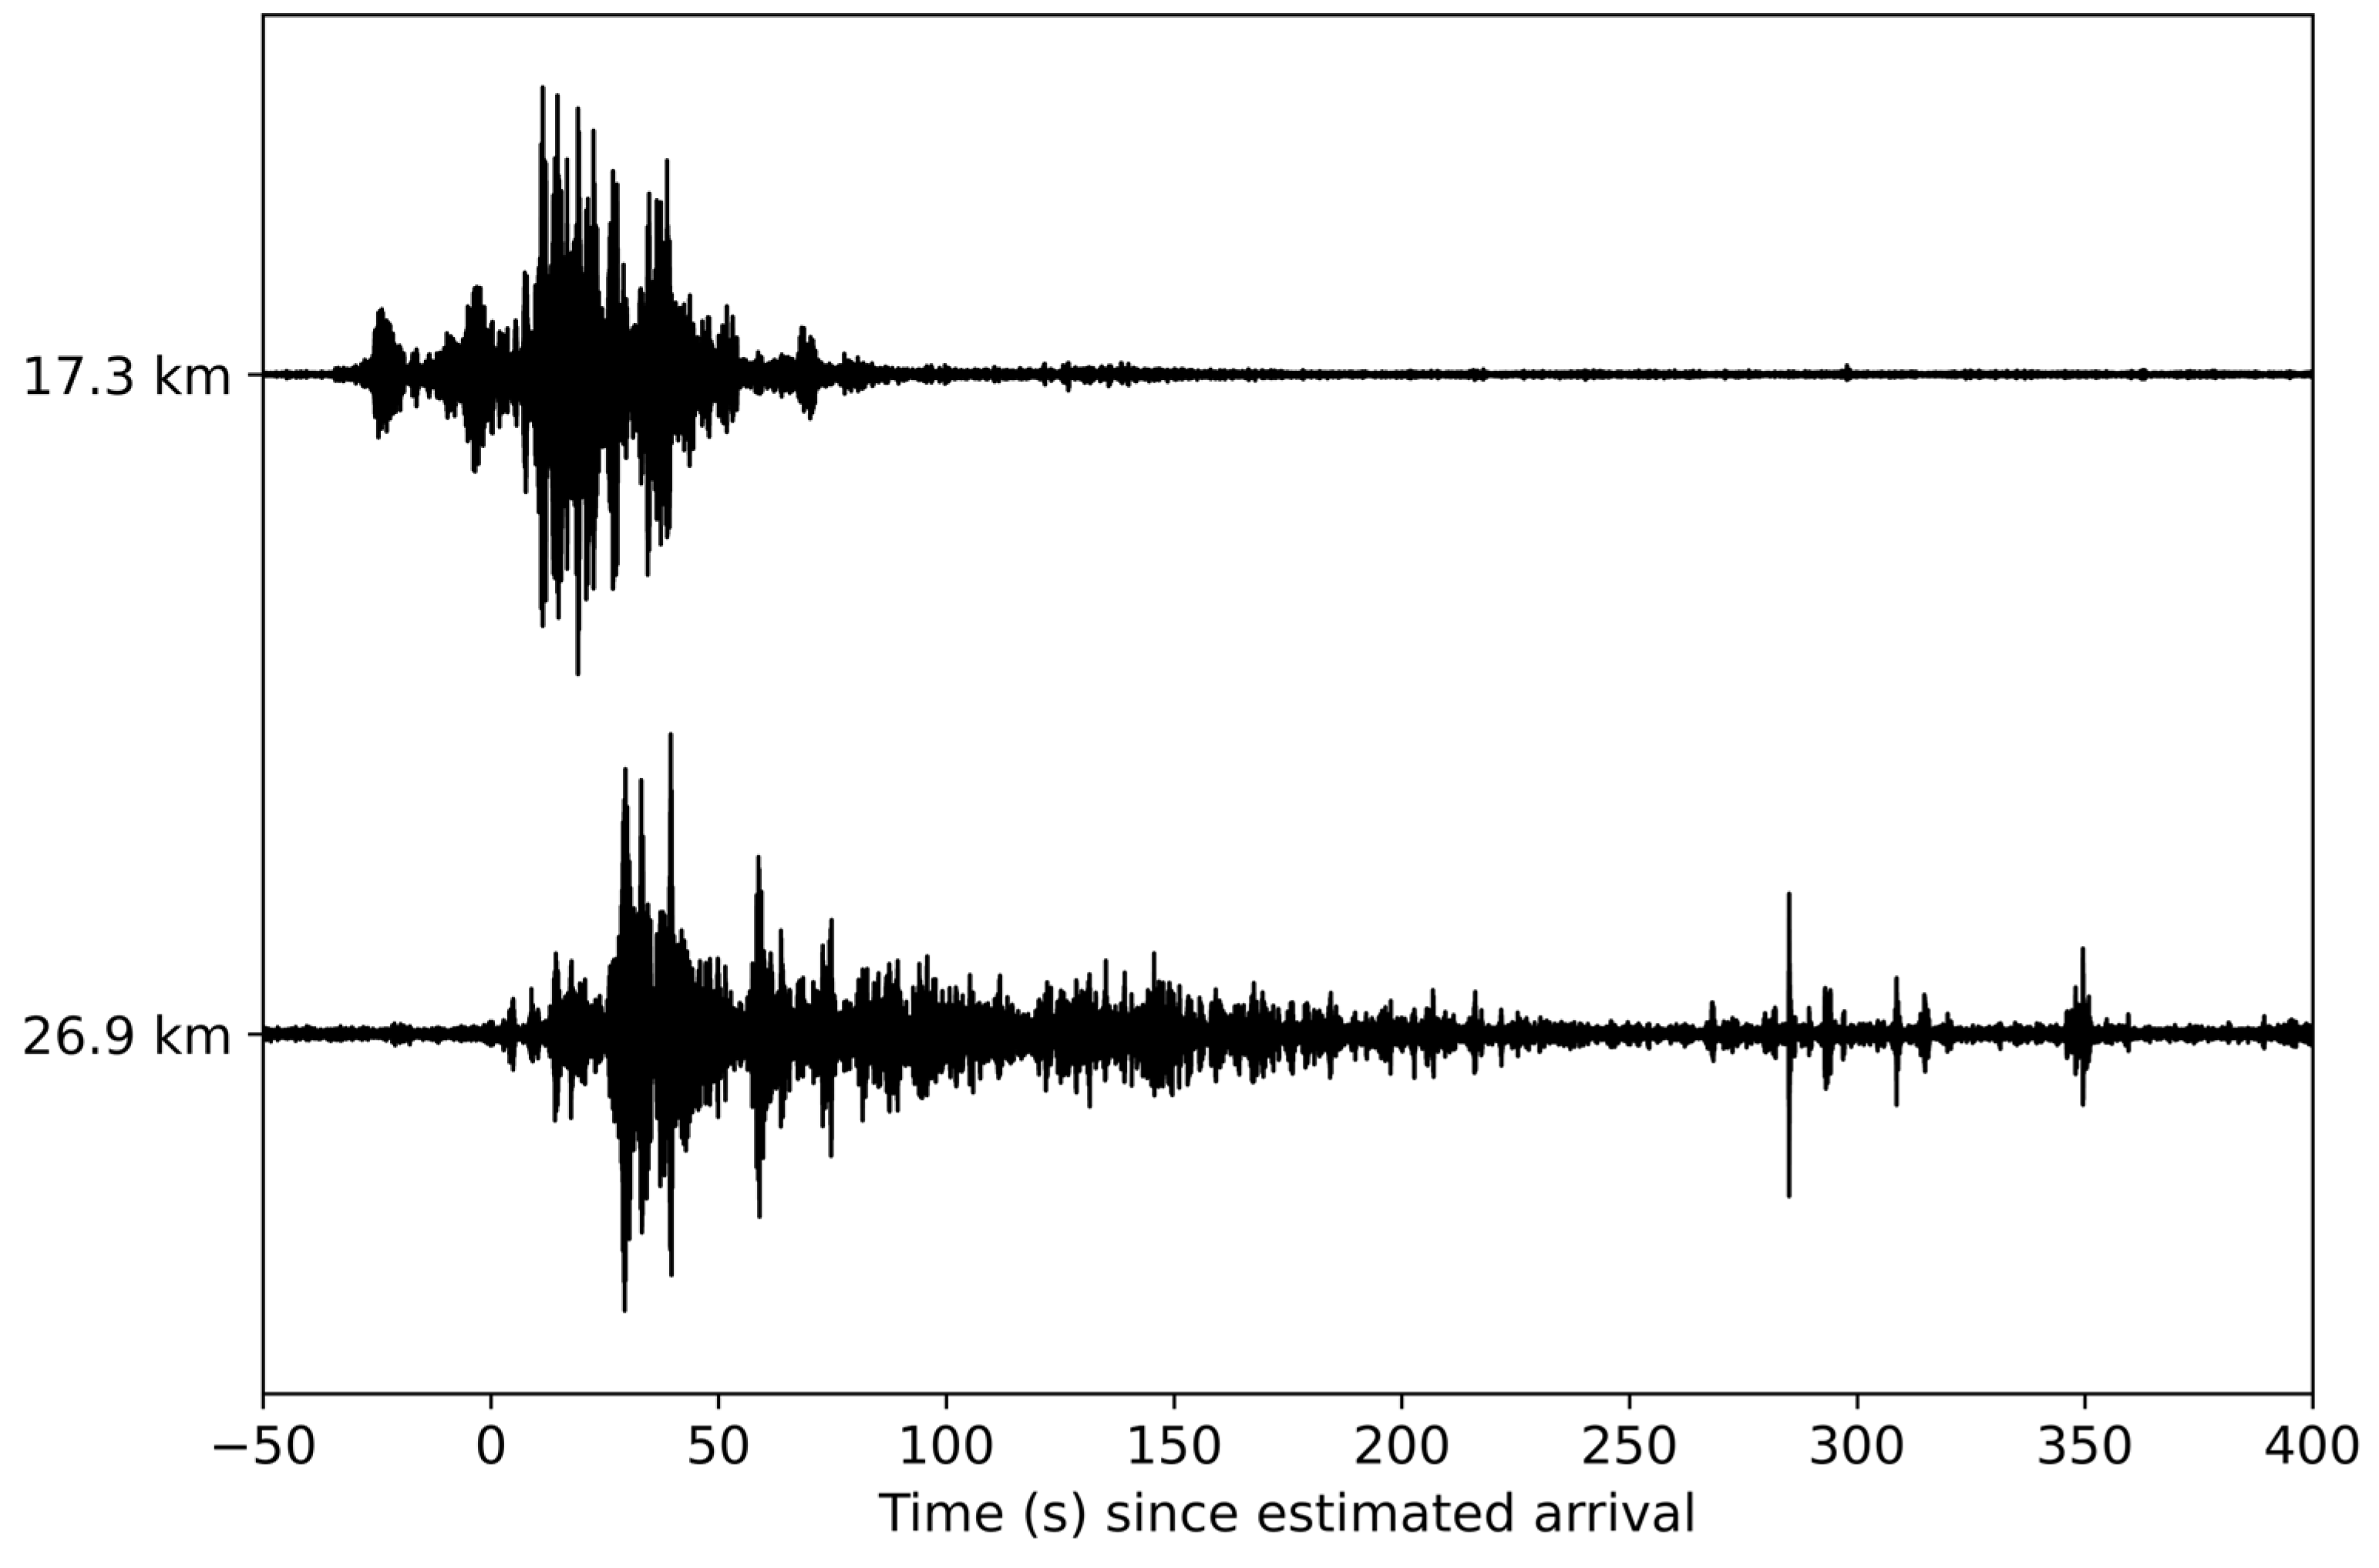
Two small-lift launch vehicles are represented in the dataset: Relativity Space’s Terran 1 and Astra Space’s Rocket 3.3. Both are propelled in the first stage by a single liquid-fuel engine. Only one launch of each is included in ASTRA, and from those launches, few signals have high enough signal-to-noise ratios to visually identify characteristics, likely due to the relatively low energy of these launches compared to launches of heavier-lift rockets. Preliminary analysis indicated, however, that the time–frequency characteristics of the two rockets are similar. The waveforms of the two small-lift signals with the highest signal-to-noise ratios (both from Terran 1) are plotted in Figure 21 and their time–frequency representations are shown in Figure 22.

4. Discussion

Analysis of the acoustic rocket launch dataset presented in this paper shows both similarities and differences with other studies on rocket launch acoustic signatures. In this dataset, the lowest characteristic frequency of the main launch sequence observed is at 10 Hz, while previous studies [4,6,7,8,12,13,14] have found the characteristic energy of rocket launch signals to be significantly lower. This is unsurprising due to the diminished frequency response of smartphone microphones compared to traditional infrasound microphones, which makes detecting frequencies much lower than 5 Hz with on-board smartphone microphones challenging at low amplitudes. Nevertheless, the 10 Hz peak is sufficiently low-frequency to remain detectable over the full range of this dataset, and studies on far-field data [4,6,7,8,12,13,14] can be referenced for insight into the very-low-frequency features of acoustic rocket signatures.
In addition to the detected characteristic main launch frequency, interesting features were also identified earlier in the launch sequence. Acoustic data from some launches showed a transient signal at approximately 6 Hz leading the 10 Hz signal. Previous work found in conference proceedings also noted the existence of this transient and concluded that it was an indication of solid fuel ignition [16]. Preliminary analysis of the data in this work seems to lend some support to that conclusion, as the 6 Hz transient appeared for 9 out of the 19 launches using solid fuels (47%) and only 17.3% of launches using only liquid fuel. The lack of an observed transient in the other 10 solid fuel launches may be due to any number of environmental conditions on the specific day and does not necessarily contradict the solid fuel ignition hypothesis. However, since the 6 Hz transient appears in data from a number of launches using only liquid fuel (such as the Falcon Heavy launch shown in Figure 8, Figure 9 and Figure 10, as well as more than two dozen Falcon 9 launches), we believe the origin of the 6 Hz transient signal is either more complex or it has similar characteristics to another signal with a different source mechanism. The exact origin of the 6 Hz transient, while interesting, is beyond the scope of this paper and will be left for future studies.
ASTRA was curated and released to the public with the intention of facilitating our own research as well as that of professionals, students, and citizen scientists alike who may be interested in replicating and improving upon the presented results. Preliminary research using data included in ASTRA to train machine learning models to detect acoustic rocket launch signatures in the field in near-real-time has shown promising results and further research into this application is ongoing. The dataset can be accessed and downloaded as a pandas DataFrame [31,32], with each recording having its own index and named columns containing the following data: raw acoustic timeseries; epoch time of the first sample; sampling frequency in Hz; smartphone make, model number, identification number, and location; launch identification number, reported epoch time in seconds, and location; estimated source-to-receiver propagation distance in kilometers; time-of-arrival estimates; flight number of the launch; and rocket make, type, model number, and number of SRBs used. To replicate the arrival time estimates, the ERA5 2 m temperature and 10 m u- and v-components of wind data [34,35] are required. The open-source software packages [29,30,31] used for data curation and analysis in this work are available online.

Author Contributions

Conceptualization, S.K.P. and M.A.G.; Data curation, S.K.P.; Formal analysis, S.K.P.; Funding acquisition, M.A.G.; Investigation, S.K.P. and M.A.G.; Methodology, S.K.P.; Project administration, M.A.G.; Resources, M.A.G.; Software, S.K.P. and M.A.G.; Supervision, M.A.G.; Validation, S.K.P.; Visualization, S.K.P.; Writing—original draft, S.K.P.; Writing—review and editing, S.K.P. and M.A.G. All authors have read and agreed to the published version of the manuscript.

Funding

This research was funded by the Department of Energy National Nuclear Security Administration under Awards Nos. DE-NA0003920 (MTV) and DE-NA0003921 (ETI).

Data Availability Statement

ASTRA is available as a pandas DataFrame [31] and can be found in the Harvard Dataverse open-access repository under the Digital Object Identifier doi: 10.7910/DVN/ZKIS2K. The ERA5 temperature and wind data used in this study are available through the Copernicus Climate Change Service [34,35].

Acknowledgments

The authors are grateful for the support of the U.S. Department of Energy, National Nuclear Security Administration, Office of Defense Nuclear Nonproliferation, Research and Development. They would also like to thank the citizen scientists who operated the network during the collection period, Samuel Kei Takazawa for his advice and support, and all those who supplied feedback on this project at MTV and ETI conferences. The temperature and wind data used in this study were downloaded from the Copernicus Climate Change Service (2023) [34,35]. The results contain modified Copernicus Climate Change Service information from 2020. Neither the European Commission nor ECMWF is responsible for any use that may be made of the Copernicus information or data it contains.

Conflicts of Interest

The authors declare no conflicts of interest. The funders had no role in the design of the study; in the collection, analyses, or interpretation of data; in the writing of the manuscript; or in the decision to publish the results.

References

  1. Schwardt, M.; Pilger, C.; Gaebler, P.; Hupe, P.; Ceranna, L. Natural and Anthropogenic Sources of Seismic, Hydroacoustic, and Infrasonic Waves: Waveforms and Spectral Characteristics (and Their Applicability for Sensor Calibration). Surv. Geophys. 2022, 43, 1265–1361. [Google Scholar] [CrossRef]
  2. Lamb, O.D.; Lees, J.M.; Bowman, D.C. Detecting Lightning Infrasound Using a High-Altitude Balloon. Geophys. Res. Lett. 2018, 45, 7176–7183. [Google Scholar] [CrossRef]
  3. Pilger, C.; Gaebler, P.; Hupe, P.; Kalia, A.C.; Schneider, F.M.; Steinberg, A.; Sudhaus, H.; Ceranna, L. Yield Estimation of the 2020 Beirut Explosion Using Open Access Waveform and Remote Sensing Data. Sci. Rep. 2021, 11, 14144. [Google Scholar] [CrossRef] [PubMed]
  4. Pilger, C.; Hupe, P.; Gaebler, P.; Ceranna, L. 1001 Rocket Launches for Space Missions and Their Infrasonic Signature. Geophys. Res. Lett. 2021, 48, e2020GL092262. [Google Scholar] [CrossRef]
  5. Hupe, P.; Ceranna, L.; Le Pichon, A.; Matoza, R.S.; Mialle, P. International Monitoring System Infrasound Data Products for Atmospheric Studies and Civilian Applications. Earth Syst. Sci. Data 2022, 14, 4201–4230. [Google Scholar] [CrossRef]
  6. Donn, W.L.; Posmentier, E.; Fehr, U.; Balachandran, N.K. Infrasound at Long Range from Saturn V, 1967. Science 1968, 162, 1116–1120. [Google Scholar] [CrossRef] [PubMed]
  7. Kaschak, G.; Donn, W.L.; Fehr, U. Long-Range Infrasound from Rockets. J. Acoust. Soc. Am. 1970, 48, 12–20. [Google Scholar] [CrossRef]
  8. Evers, L.G.; Assink, J.D.; Smets, P.S.M. Infrasound from the 2009 and 2017 DPRK Rocket Launches. Geophys. J. Int. 2018, 213, 1785–1791. [Google Scholar] [CrossRef]
  9. Pilger, C.; Hupe, P. The Infrasonic Signature of Three Exceptional Rocket Launches. Proc. Meet. Acoust. 2024, 52, 040006. [Google Scholar] [CrossRef]
  10. Cotten, D.; Donn, W.L. Sound from Apollo Rockets in Space. Science 1971, 12, 565–567. [Google Scholar] [CrossRef] [PubMed]
  11. Cotten, D.E.; Donn, W.L.; Oppenheim, A. On the Generation and Propagation of Shock Waves from Apollo Rockets at Orbital Altitudes. Geophys. J. R. Astron. Soc. 1971, 26, 149–159. [Google Scholar] [CrossRef]
  12. Blom, P.; Marcillo, O.; Arrowsmith, S. Analysis and Modeling of Infrasound from a Four-Stage Rocket Launch. J. Acoust. Soc. Am. 2016, 139, 3134–3138. [Google Scholar] [CrossRef]
  13. Tenney, S.M.; Noble, J.M.; Whitaker, R.W.; ReVelle, D.O. Acoustic/Infrasonic Rocket Engine Signatures. In Unattended Ground Sensor Technologies and Applications V, Proceedings of the AeroSense 2003, Orlando, Florida, USA, 18 September 2003; Carapezza, E.M., Ed.; SPIE: Bellingham, WA, USA, 2003; Volume 5090, pp. 30–41. [Google Scholar]
  14. Balachandran, N.K.; Donn, W.L. Characteristics of Infrasonic Signals from Rockets. Geophys. J. R. Astron. Soc. 1971, 26, 135–148. [Google Scholar] [CrossRef]
  15. Mclaughlin, K.L.; Brown, D.J.; Australia, G. Infrasound Detection of Rocket Launches. In Proceedings of the 22nd Annual DoD/DOE Seismic Research Symposium, New Orleans, LA, USA, 15 September 2000. [Google Scholar]
  16. Olson, J. Infrasound Rocket Signatures. In Proceedings of the Advanced Maui Optical and Space Surveillance Technologies Conference, Maui, HI, USA, 11–14 September 2012; pp. 638–645. [Google Scholar]
  17. Smith, K.; Solomon, M.; Bryan, K.J.; Smith, A.O.; Peter, A.M. Near-Field Infrasound Classification of Rocket Launch Signatures. In Chemical, Biological, Radiological, Nuclear, and Explosives (CBRNE) Sensing XIX, Proceedings of the SPIE Defense + Security, Orlando, FL, USA, 23 May 2018; Guicheteau, J.A., Fountain, A.W., Howle, C.R., Eds.; SPIE: Bellingham, WA, USA, 2018; Volume 10629, p. 106291F. [Google Scholar]
  18. Popenhagen, S.K. Aggregated Smartphone Timeseries of Rocket-Generated Acoustics (ASTRA). Available online: https://dataverse.harvard.edu/dataset.xhtml?persistentId=doi:10.7910/DVN/ZKIS2K (accessed on 21 November 2024).
  19. Takazawa, S.K.; Popenhagen, S.K.; Ocampo Giraldo, L.A.; Hix, J.D.; Thompson, S.J.; Chichester, D.L.; Zeiler, C.P.; Garcés, M.A. Explosion Detection Using Smartphones: Ensemble Learning with the Smartphone High-Explosive Audio Recordings Dataset and the ESC-50 Dataset. Sensors 2024, 24, 6688. [Google Scholar] [CrossRef] [PubMed]
  20. Kong, Q.; Martin-Short, R.; Allen, R.M. Toward Global Earthquake Early Warning with the Myshake Smartphone Seismic Network, Part 1: Simulation Platform and Detection Algorithm. Seismol. Res. Lett. 2020, 91, 2206–2217. [Google Scholar] [CrossRef]
  21. Slad, G.; Merchant, B.J. Evaluation of Low Cost Infrasound Sensor Packages; Sandia National Lab. (SNL-NM): Albuquerque, NM, USA; Livermore, CA, USA, 2021.
  22. Asmar, K.; Garces, M.; Williams, B. A Method for Estimating the Amplitude Response of Smartphone Built-in Microphone Sensors below 4 KHz. J. Acoust. Soc. Am. 2019, 146, 172–178. [Google Scholar] [CrossRef] [PubMed]
  23. Takazawa, S.K.; Popenhagen, S.K.; Ocampo Giraldo, L.A.; Cardenas, E.S.; Hix, J.D.; Thompson, S.J.; Chichester, D.L.; Garcés, M.A. A Comparison of Smartphone and Infrasound Microphone Data from a Fuel Air Explosive and a High Explosive. J. Acoust. Soc. Am. 2024, 156, 1509–1523. [Google Scholar] [CrossRef]
  24. Brown, R.; Evans, L. Acoustics and the Smartphone. In Proceedings of the Acoustics, Gold Coast, Australia, 2 November 2011; Volume 106. [Google Scholar]
  25. Popenhagen, S.K.; Bowman, D.C.; Zeiler, C.; Garcés, M.A. Acoustic Waves From a Distant Explosion Recorded on a Continuously Ascending Balloon in the Middle Stratosphere. Geophys. Res. Lett. 2023, 50, e2023GL104031. [Google Scholar] [CrossRef]
  26. RedVox SDK. Available online: https://pypi.org/project/redvox/ (accessed on 21 November 2024).
  27. Garcés, M.A.; Bowman, D.; Zeiler, C.; Christe, A.; Yoshiyama, T.; Williams, B.; Colet, M.; Takazawa, S.; Popenhagen, S. Skyfall: Signal Fusion from a Smartphone Falling from the Stratosphere. Signals 2022, 3, 209–234. [Google Scholar] [CrossRef]
  28. Python. Available online: https://docs.python.org/release/3.9.1/ (accessed on 21 November 2024).
  29. RedVox-Pandas Framework. Available online: https://pypi.org/project/redvox-pandas/ (accessed on 21 November 2024).
  30. Quantized Information Entropy, Nth Octave. Available online: https://pypi.org/project/quantum-inferno/ (accessed on 21 November 2024).
  31. The Pandas Development Team Pandas-Dev/Pandas: Pandas. Available online: https://zenodo.org/records/13819579 (accessed on 21 November 2024).
  32. McKinney, W. Data Structures for Statistical Computing in Python. In Proceedings of the 9th Python in Science Conference, Austin, TX, USA, 28 June–3 July 2010; van der Walt, S., Millman, J., Eds.; SciPy: Austin, TX, USA, 2010; pp. 56–61. [Google Scholar] [CrossRef]
  33. Harris, C.R.; Millman, K.J.; van der Walt, S.J.; Gommers, R.; Virtanen, P.; Cournapeau, D.; Wieser, E.; Taylor, J.; Berg, S.; Smith, N.J.; et al. Array Programming with NumPy. Nature 2020, 585, 357–362. [Google Scholar] [CrossRef]
  34. Hersbach, H.; Bell, B.; Berrisford, P.; Hirahara, S.; Horányi, A.; Muñoz-Sabater, J.; Nicolas, J.; Peubey, C.; Radu, R.; Schepers, D.; et al. The ERA5 global reanalysis. Q. J. R. Meteorol. Soc. 2020, 146, 1999–2049. [Google Scholar] [CrossRef]
  35. Copernicus Climate Change Service (2023): ERA5 Hourly Data on Single Levels from 1940 to Present. Available online: https://cds.climate.copernicus.eu/datasets/reanalysis-era5-single-levels (accessed on 26 November 2024).
Figure 1. Bar plots showing the distribution in the dataset of signals (a) recorded on different makes and models of smartphones, (b) originating from different types of rockets, and (c) collected in different range categories.
Signals 06 00005 g001
Figure 2. Normalized waveforms collected at three different stations during NASA’s Artemis I launch, plotted relative to the start-aligned estimated time of arrival at each station. A vertical green line indicates the arrival time estimate, and labels on the left-hand y-axis indicate the estimated propagation distance of each signal.
Signals 06 00005 g002
Figure 3. A visualization of the peak alignment estimated arrival time selection process. In panel (a), the normalized, unfiltered waveform is plotted in black, the selection window is indicated by green shading, and a dashed green line marks the closer-range station’s estimated arrival time, which is used to place the window. In panel (b), the windowed, bandpassed, and re-normalized waveform is shown, with the selected median-filter window indicated with darker shading. In panel (c), the result of median filtering the absolute value of the bandpassed waveform from panel (b) is shown, with the selected peak indicated by a solid green line.
Signals 06 00005 g003
Figure 4. Normalized waveforms collected at three different stations during NASA’s Artemis I launch, plotted relative to the peak-aligned estimated time of arrival at each station. A vertical green line indicates the arrival time estimate, and labels on the left-hand y-axis indicate the estimated propagation distance of each signal.
Signals 06 00005 g004
Figure 5. Normalized, start-aligned waveforms of all signals collected from the Artemis I launch. Labels on the left-hand y-axis indicate the estimated propagation distance of each signal.
Signals 06 00005 g005
Figure 6. Continuous wavelet transform (CWT) power of start-aligned signals collected from the Artemis I launch at 24.4 km (a), 37.6 km (b), and 56.9 km (c) from the launch pad.
Signals 06 00005 g006
Figure 7. CWT power of peak-aligned signals collected from the Artemis I launch at 24.4 km (a,b), 37.6 km (c,d), and 56.9 km (e,f). All panels show the CWT power of the normalized signals, with the left-hand panels showing frequency on the y-axis and time on the x-axis, and the right-hand panels showing time on the y-axis and frequency on the x-axis.
Signals 06 00005 g007
Figure 8. Normalized, start-aligned waveforms of all signals collected from launch FH-003 of SpaceX’s Falcon Heavy. Labels on the left-hand y-axis indicate the estimated propagation distance of each signal.
Signals 06 00005 g008
Figure 9. CWT power of start-aligned signals collected from launch FH-003 at 23.0 km (a), 37.1 km (b), and 52.2 km (c) from the launch pad.
Signals 06 00005 g009
Figure 10. CWT power of peak-aligned signals collected from launch FH-003 at 23.0 km (a,b), 37.1 km (c,d), and 52.2 km (e,f). All panels show the CWT power of the normalized signals, with the left-hand panels showing frequency on the y-axis and time on the x-axis, and the right-hand panels showing time on the y-axis and frequency on the x-axis.
Signals 06 00005 g010
Figure 11. Normalized, start-aligned waveforms of all signals collected from Delta IV Heavy launch D-389. Labels on the left-hand y-axis indicate the estimated propagation distance of each signal.
Signals 06 00005 g011
Figure 12. CWT power of start-aligned signals collected from launch D-389 at 29.1 km (a) and 43.4 km (b) from the launch pad.
Signals 06 00005 g012
Figure 13. Normalized, start-aligned waveforms of all signals collected from Vulcan Centaur launch Cert-1 V-001. Labels on the left-hand y-axis indicate the estimated propagation distance of each signal.
Signals 06 00005 g013
Figure 14. CWT power of start-aligned signals collected from Vulcan Centaur launch Cert-1 V-001 at 26.6 km (a), 34.2 km (b), and 49.1 km (c) from the launch pad.
Signals 06 00005 g014
Figure 15. Normalized, start-aligned waveforms of all signals collected from SpaceX Falcon 9 launch SL-G607. Labels on the left-hand y-axis indicate the estimated propagation distance of each signal.
Signals 06 00005 g015
Figure 16. CWT power of start-aligned signals collected from launch SL-G607 at 20.0 km (a), 32.2 km (b), and 51.5 km (c) from the launch pad.
Signals 06 00005 g016
Figure 17. Normalized, start-aligned waveforms of all signals collected from Atlas V launch AV-093. Labels on the left-hand y-axis indicate the estimated propagation distance of each signal.
Signals 06 00005 g017
Figure 18. CWT power of start-aligned signals collected from launch AV-093 at 20.5 km (a), 34.1 km (b), and 51.9 km (c) from the launch pad.
Signals 06 00005 g018
Figure 19. Normalized, start-aligned waveforms of three signals collected from Atlas V launch AV-104. Labels on the left-hand y-axis indicate the estimated propagation distance of each signal.
Signals 06 00005 g019
Figure 20. CWT power of start-aligned signals collected from launch AV-104 at 21.6 km (a), 34.2 km (b), and 53.9 km (c) from the launch pad.
Signals 06 00005 g020
Figure 21. Normalized, start-aligned waveforms of signals collected from Terran 1. Labels on the left-hand y-axis indicate the estimated propagation distance of each signal.
Signals 06 00005 g021
Figure 22. CWT power of start-aligned signals collected from Terran 1 at 17.1 km (a) and 26.9 km (b) from the launch pad.
Signals 06 00005 g022
Disclaimer/Publisher’s Note: The statements, opinions and data contained in all publications are solely those of the individual author(s) and contributor(s) and not of MDPI and/or the editor(s). MDPI and/or the editor(s) disclaim responsibility for any injury to people or property resulting from any ideas, methods, instructions or products referred to in the content.