Article

Vestibular Evoked Myogenic Potentials (VEMPs) in Parkinson’s Disease Patients with Monopolar Deep Brain Stimulation

1
School of Psychology, Faculty of Science, The University of Sydney, Sydney, NSW 2050, Australia
2
Parkinson’s Disease Research Clinic, Macquarie Medical School, Macquarie University, Sydney, NSW 2109, Australia
3
Bionics Institute, St. Vincent’s Hospital, 41 Victoria Parade Fitzroy, Fitzroy, VIC 3065, Australia
4
Medical Bionics Department, University of Melbourne, Melbourne, VIC 3002, Australia
*
Author to whom correspondence should be addressed.
Signals 2025, 6(1), 10; https://doi.org/10.3390/signals6010010
Submission received: 10 September 2024 / Revised: 8 November 2024 / Accepted: 7 February 2025 / Published: 21 February 2025

Abstract

:
Whilst balance disturbances are common in people with advanced Parkinson’s disease, it has not previously been possible to record vestibular evoked myogenic potentials (VEMPs), and thus otolithic function, during monopolar deep brain stimulation (DBS) due to an overwhelming number of signal artifacts. A µVEMP device has been developed with parameters to allow VEMP recording during monopolar DBS. The aim of this proof-of-concept study was to ascertain whether, during DBS, VEMP responses could be accurately identified after signal filtering recordings from the µVEMP device. Both cervical and ocular VEMP responses to taps and clicks were recorded with the µVEMP device in five Parkinson’s disease patients with monopolar deep brain stimulation. Additionally, VEMP responses were recorded in one patient whose deep brain stimulation was switched ON and OFF to allow a direct comparison of the signals. Customised post-filtering analysis allowed successful VEMP response extraction from signal noise in all five patients with deep brain stimulation ON. VEMP responses with deep brain stimulation ON after filtering were similar to VEMP responses with deep brain stimulation OFF, validating the filtering analysis. We present the first study to record VEMP signals with monopolar deep brain stimulation using a µVEMP device coupled with customised post-filtering. This finding will allow patients to be assessed without requiring adjustment of their therapeutic deep brain stimulation.

1. Introduction

Deep brain stimulation (DBS) is an established therapy for people with levodopa-responsive Parkinson’s Disease (PD) whose symptoms are not adequately controlled by medication alone [1]. Many people with PD with DBS use a monopolar configuration [2], in which the implanted pulse generator, typically implanted in a sub-pectoral position, is positive (anode) and one of the four lead contacts, implanted in the target brain area and connected to the implanted pulse generator via an insulated extension wire, is negative (cathode). The implanted pulse generator produces continuous electrical stimulation (with individualised voltage, pulse width, and frequency stimulation parameters) to achieve optimal symptom control. Whilst this is a very successful therapy for advanced PD, the electromagnetic fields generated during stimulation create significant signal artifacts that can limit the interpretation of neurophysiological studies such as electroencephalography, electromyography, magnetoencephalography and vestibular evoked myogenic potentials (VEMPs) [3].
VEMPs are commonly used in the neuro-otological test battery during the assessment of dizziness and imbalance. They specifically measure vestibular otolith organ function and their brainstem reflex pathways [4,5]. There is significant research interest in using VEMPs assessment to improve our understanding of neurodegenerative processes in people with PD due to the known post-mortem morphological changes in brainstem vestibular nuclei [6], suspected central vestibular reflex pathway dysfunction, as well as the significantly increased prevalence of postural instability and falls in people with PD, particularly in those with advanced disease [7]. See Smith (2018) for a review [8]. There has also been research interest in using VEMPs to differentiate between neurodegenerative disorders such as PD and multisystem atrophy [9].
VEMPs represent short-latency vestibular-dependent brainstem reflexes evoked by an air-conducted stimulus (ACS), e.g., sounds; via bone-conducted vibration (BCV); or by galvanic stimulation. Cervical VEMPs (cVEMPs) are a biphasic inhibitory reflex (approximately 100 to 300 µV) measured via surface electrodes on the tonically activated ipsilateral sternocleidomastoid muscle, with early peaks at approximately 13 and 23 ms (known as p13 and n23) post-stimulus. They are predominantly used as a measure of ipsilateral saccular function via the inferior portion of the vestibular nerve [10]. Ocular VEMPs (oVEMP) are recorded from the contralateral inferior oblique extra-ocular muscles with a small excitatory (5–10 µV) early reflex peak at approximately 10 ms and a negative peak at 15 ms (known as n10 and p15, respectively). oVEMPs are used clinically to measure utricular function via the superior portion of the vestibular nerve [4].
Previously, obtaining VEMP recordings using most commercial VEMP recording systems has been impossible in patients with monopolar DBS due to the overwhelming signal noise produced by the implanted pulse generator swamping the input signal detected by surface electrodes. A study by Potter-Nerger et al. (2012) investigated the effects of DBS and L-Dopa on cVEMP amplitudes in people with PD [3]. To manage monopolar DBS signal artifacts, these researchers either switched off the DBS device or adjusted the stimulation parameters to a bipolar mode, where they increased the stimulation voltage by 30% based on an established neurological conversion algorithm. However, it is known that switching off the DBS device can, in some participants, result in an almost immediate worsening of tremors (within 5 min) and subsequent worsening of rigidity and bradykinesia (over 15–60 min) [11]. These re-emerging movement artifacts can have an impact on background electromyographic (EMG) readings during VEMP testing, further obscuring the accurate interpretation of results. Adjusting the stimulation to bipolar mode and increasing the stimulation requires specific knowledge of the DBS device and its settings. With the µVEMP device, VEMP testing can be performed without a neurologist or DBS technician present to adjust stimulation settings.
Given the limitations in the field, we set out to determine whether a new validated portable µVEMP device (described in detail in [12]) could be used in conjunction with a customised signal filtering algorithm to accurately record VEMP reflexes in people with PD without turning off or adjusting their DBS.
The aims of this proof-of-concept study were as follows:
  • To ascertain whether oVEMP and cVEMP responses could be recorded using the µVEMP device during simultaneous monopolar DBS;
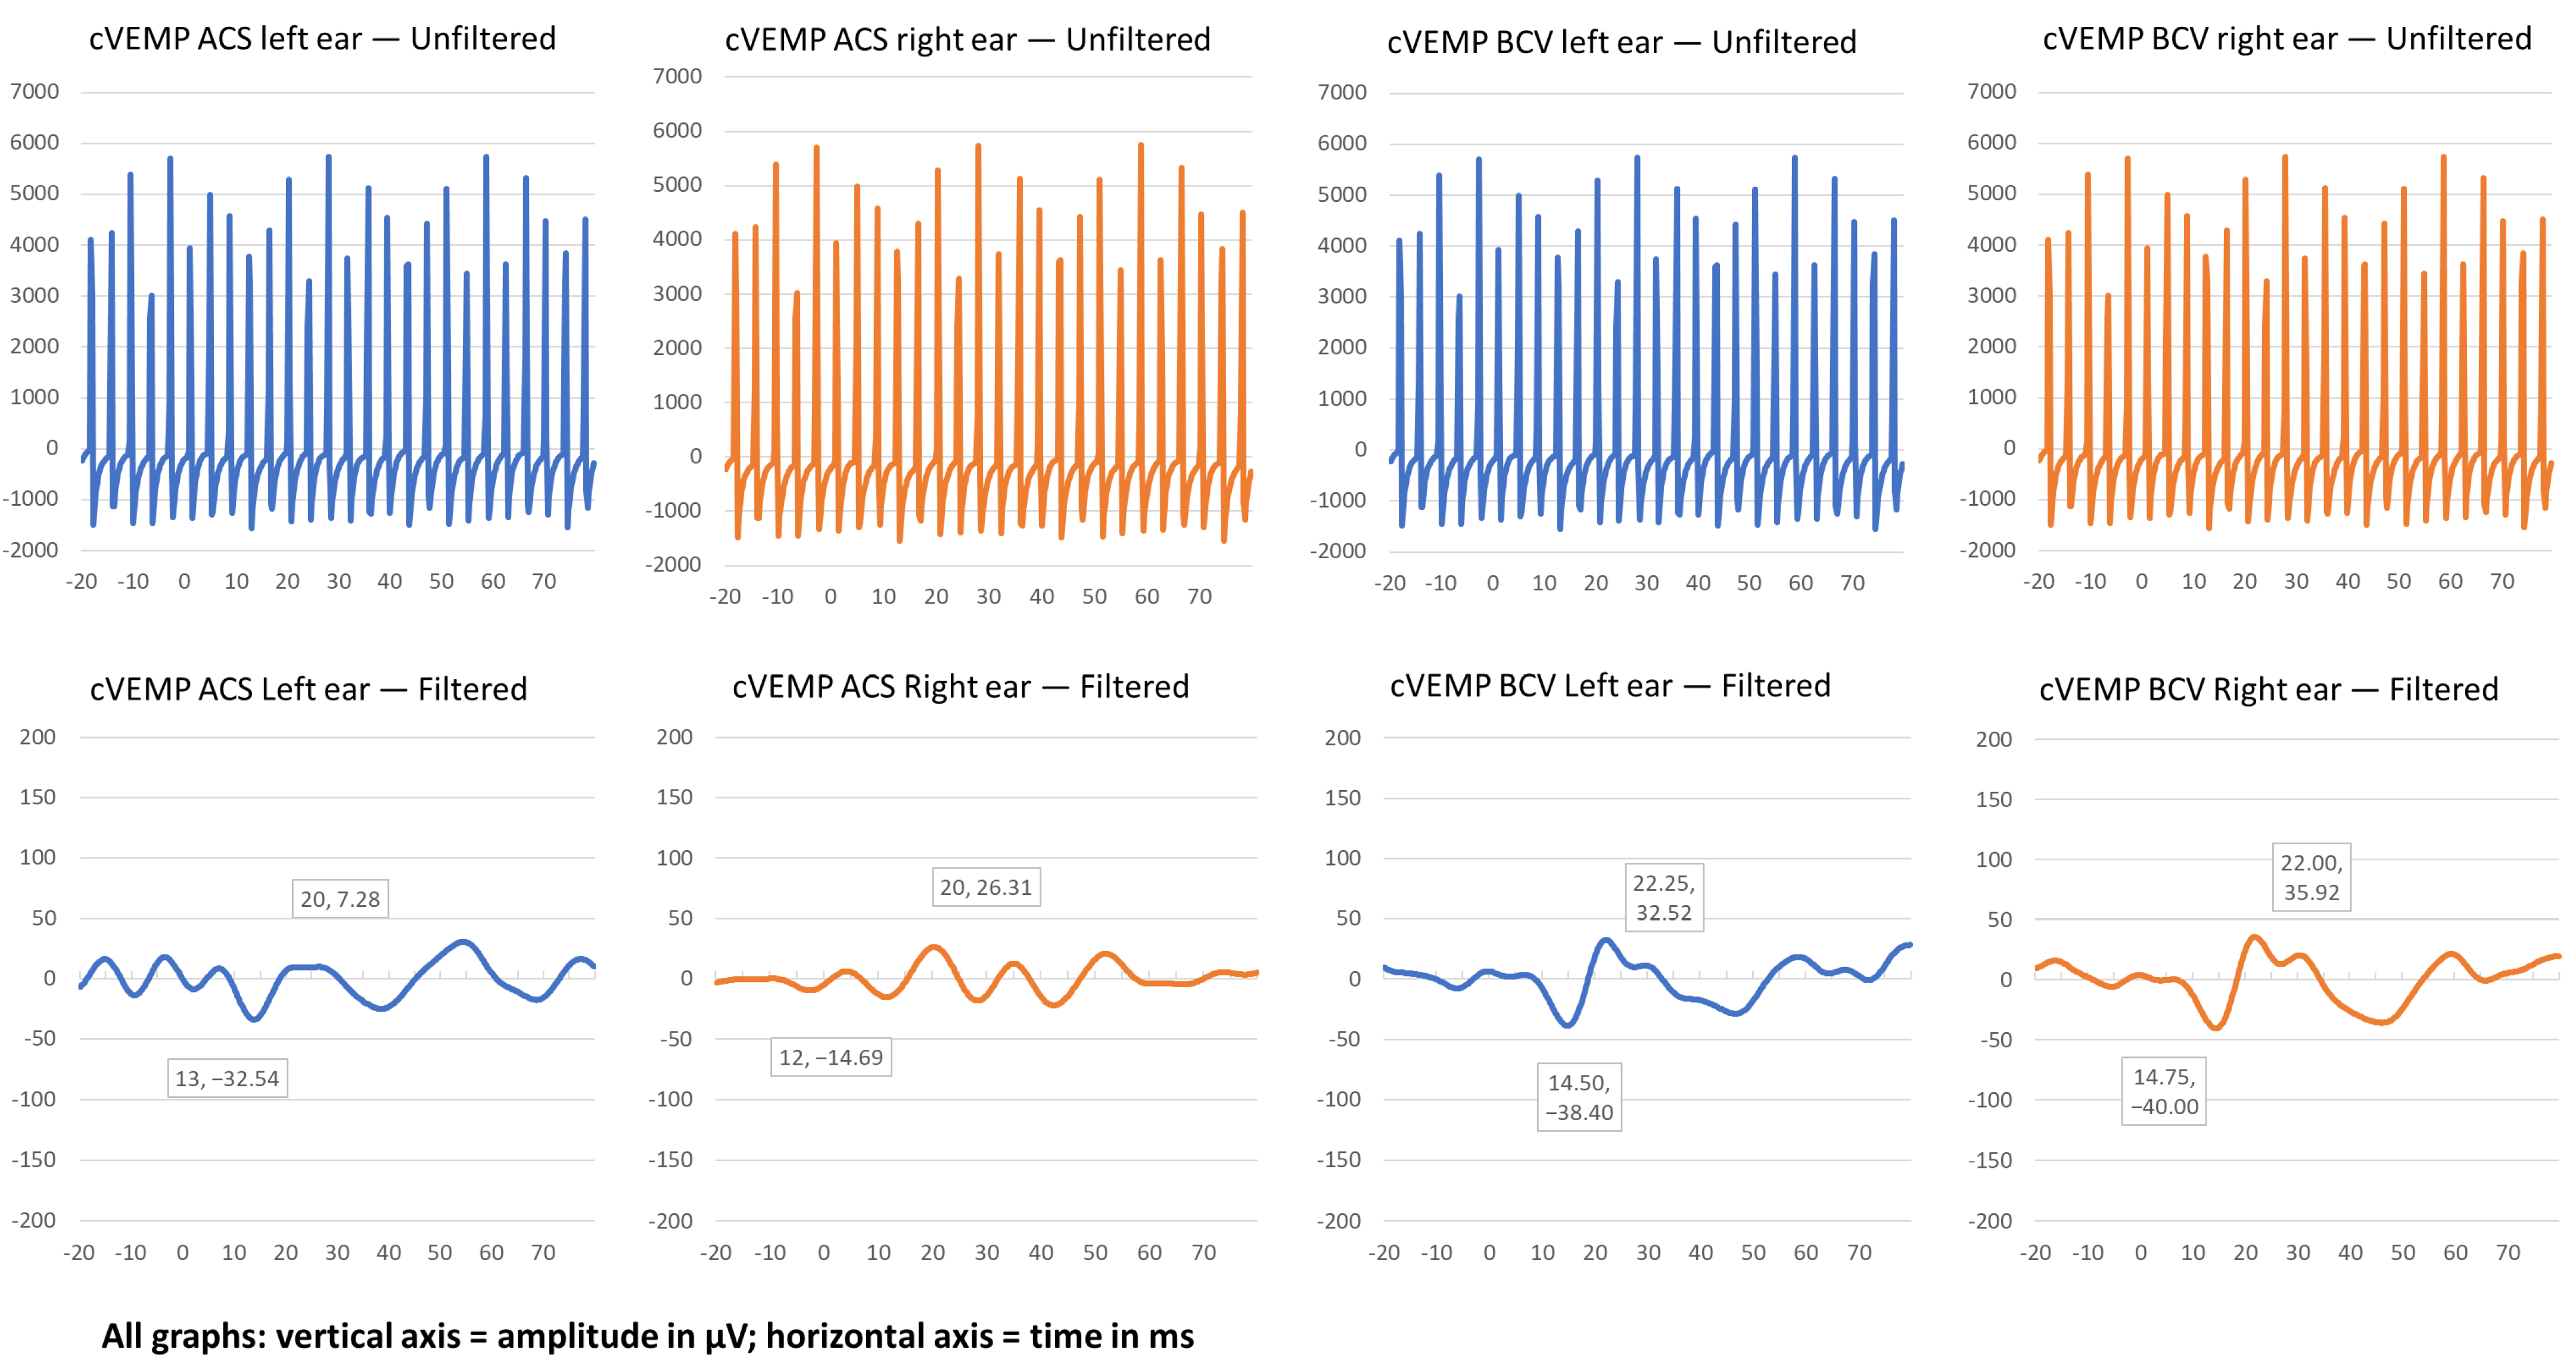
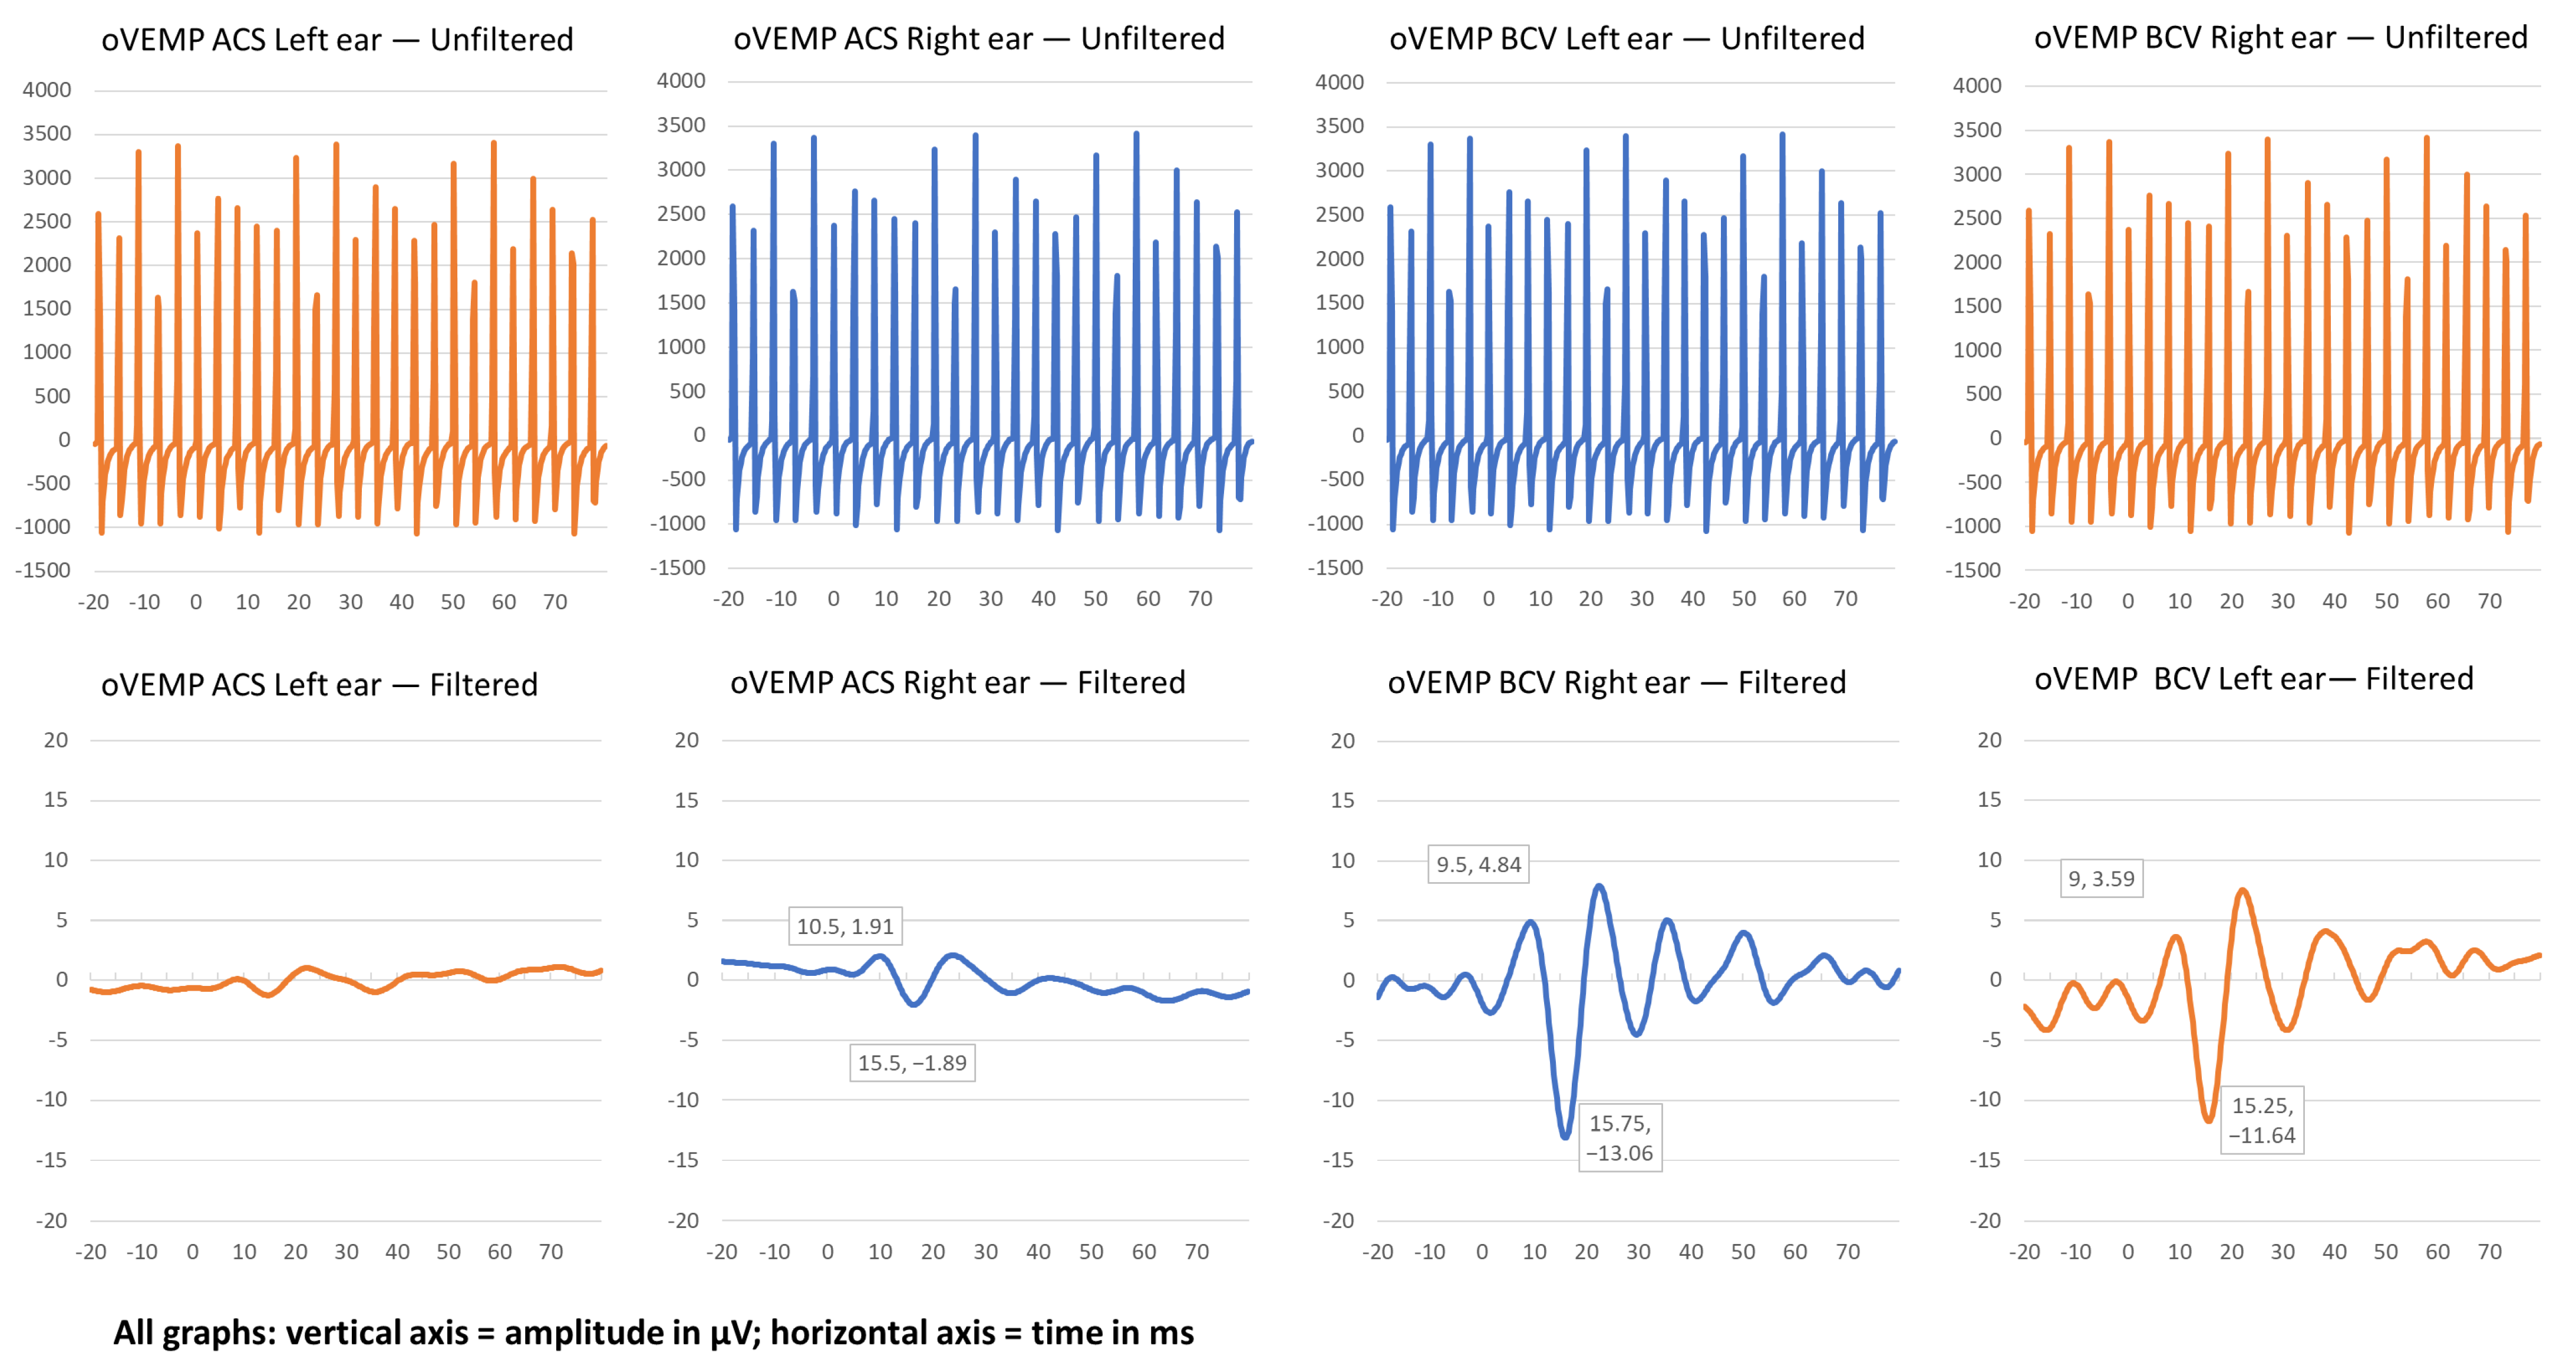
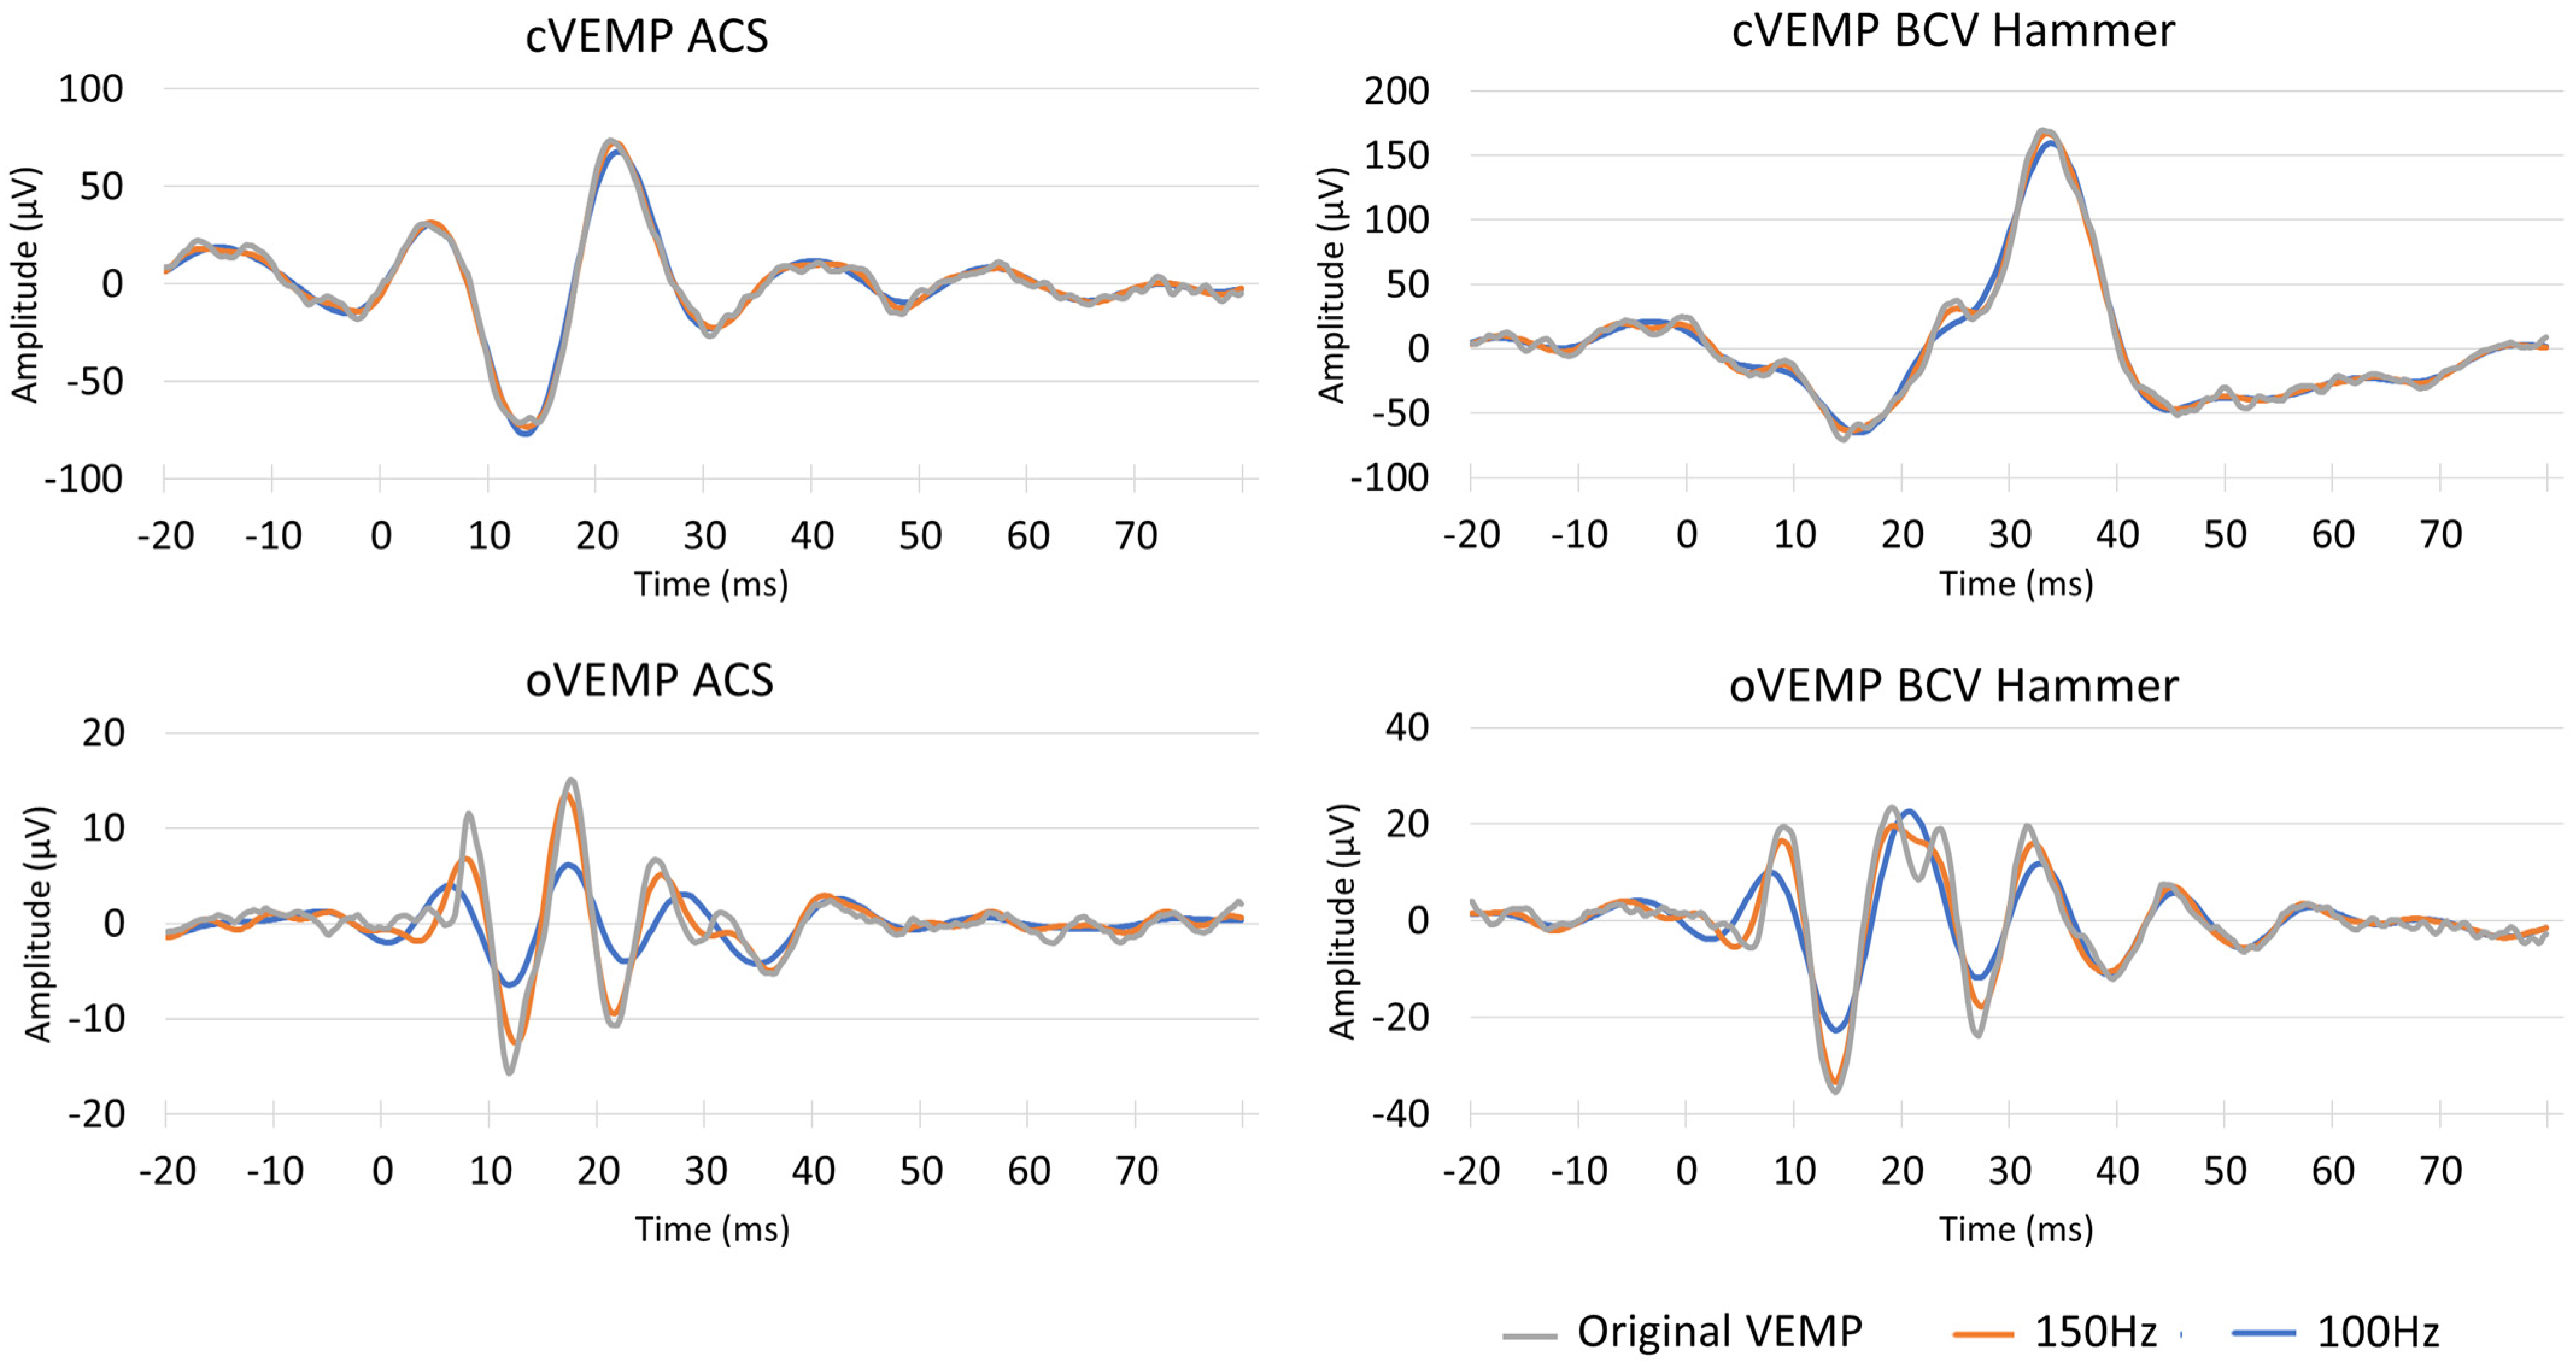
  • To post-filter the signals in order to identify VEMP responses;
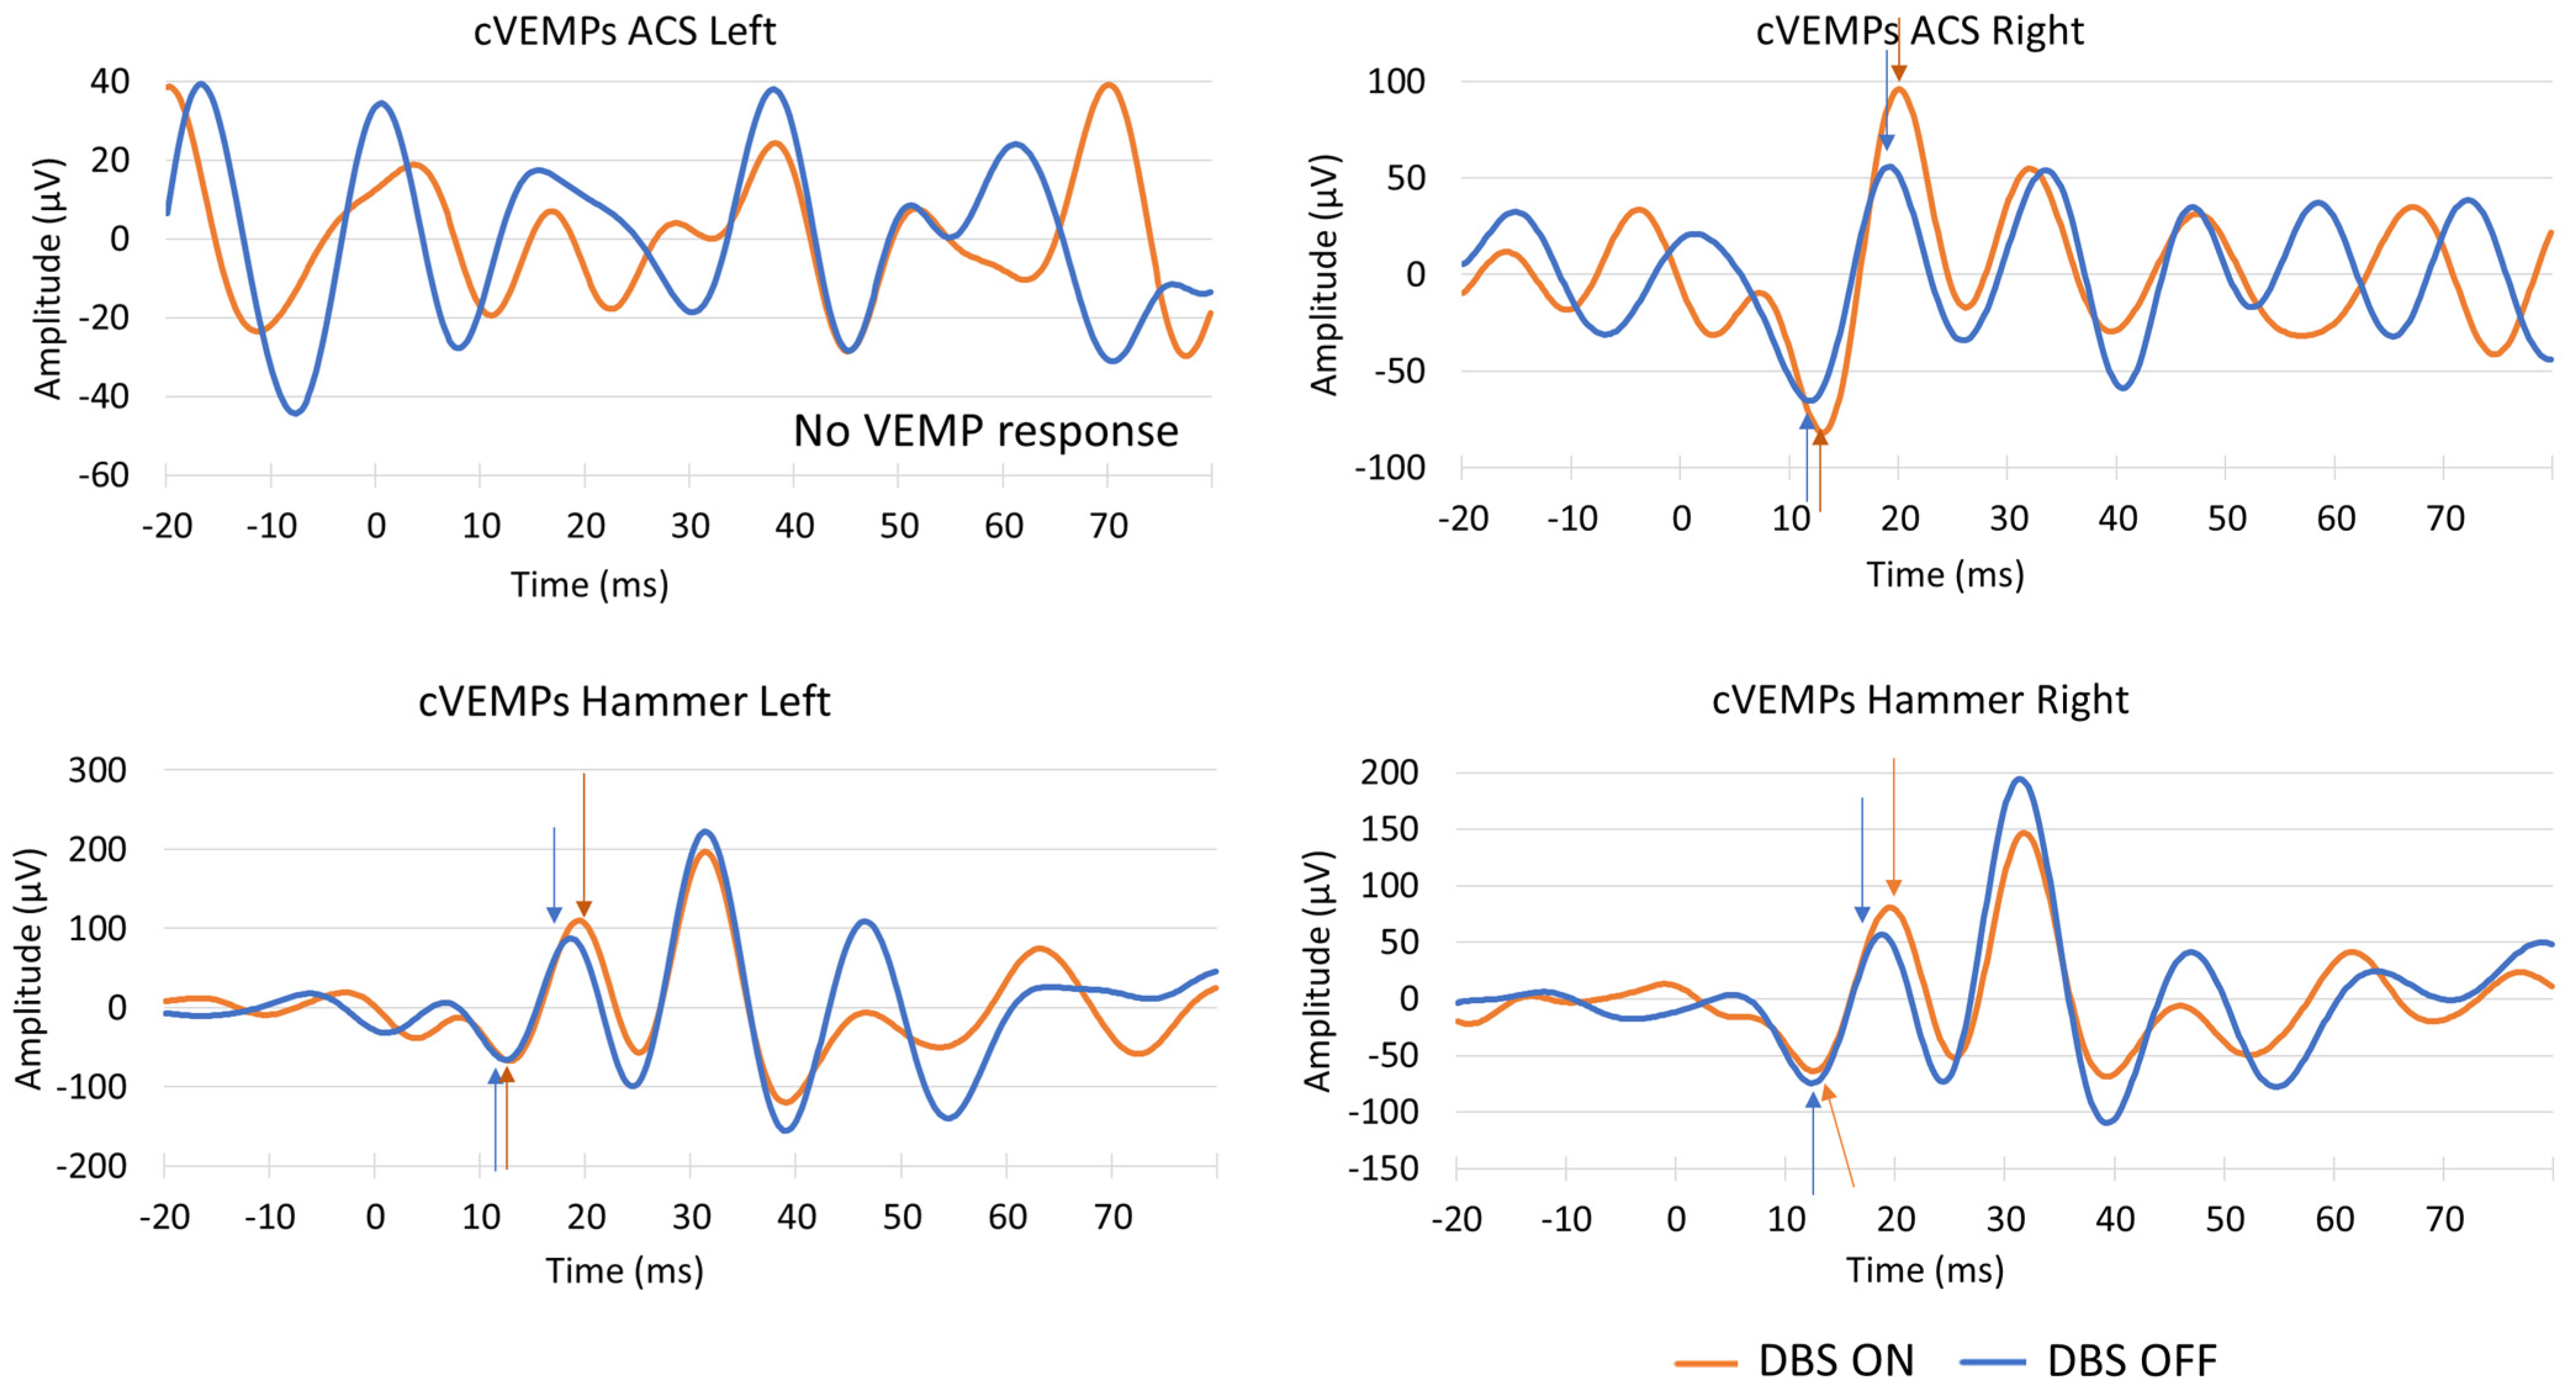
  • To validate the post-filtering analysis by recording the VEMP response in the same participant with their DBS device switched ON and OFF.

2. Materials and Methods

The data collected for this study were part of a larger study investigating vestibular reflexes in PD (see [13,14] for details). This smaller study uses a sub-set of VEMP data in participants with PD and DBS. The study was conducted in accordance with the ethical standards of the Helsinki Declaration of 1975, as revised in 1983. Ethical approval for the larger study and the modification of the DBS component of this study was obtained through The University of Sydney Human Ethics review board (2017/925) and all participants gave written informed consent prior to enrolment.

2.1. Participants

Four PD participants with DBS (see Supplementary Table S2 for sub-group demographics) were recruited as part of the larger study and VEMP testing was performed during the ON phase of their usual PD medication schedule. One further participant with PD was recruited for part two of the DBS VEMP custom post-filter validation (female, age 54) and under a neurologist’s supervision, VEMPS were recorded with the DBS ON and then immediately after switching their DBS device OFF. This participant had prior left ear surgery (tympanoplasty), which was expected to impair left-sided VEMP responses to air-conducted stimulus but not bone-conducted vibration.
All PD participants were community-dwelling volunteers with no known history of vestibular disorders, no known conductive hearing loss and had diagnosed idiopathic Parkinson’s disease. All PD participants had been implanted with Medtronic Deep Brain Stimulators delivering monopolar subthalamic nucleus stimulation. The implanted pulse generator was implanted below the right clavicle in all participants.
One healthy control (female, age 31) without PD and with known healthy VEMP responses was recruited for part one of the validation of the customised filtering protocol.

2.2. VEMP Testing

cVEMP and oVEMP recordings were performed using the validated µVEMP device, [12]. The device was connected via USB 2.0 to an Apple Macintosh laptop (macOS 10.14) running a custom programme for the continuous acquisition of data. Standard EMG electrodes (Clearface, Conmed Corp, Utica, NY, USA) were connected via shielded coaxial cables and alligator clips. The surface electrode montage for cVEMP recording involved an active electrode placed on alcohol-cleaned skin on the upper third of the anterior portion of the sternocleidomastoid muscle and reference electrodes placed on the bony part of the ipsilateral medial clavicles. The ground electrode was placed on the forehead. The sternocleidomastoid muscles were tonically activated by asking the participant to lift and turn their head contralaterally to the stimulated ear for the ACS or lift their head in midline from a semi-reclined position for BCV. The oVEMP responses were taken from active electrodes placed beneath the midpoint of the inferior eye lines with reference electrodes spaced approximately 2 cm below. Participants looked up at a target to tonically activate the inferior oblique muscle during both mono-aural ACS and BCV. The ACS were approximately 100 clicks (0.1 ms, 105 dB LAeq, 5.1 Hz) delivered mono-aurally by acoustically shielded headphones (DD52, 10 Ω ± 1.0 Ω, Rated Power: 1000 mW, Frequency response: 100 Hz-8 kHz, Sensitivity: 108 ± 3 dB SPL@1000 Hz @1 mW, Harmonic distortion below 1% @ 120 dB SPL, f = 1 kHz) to the left then the right ear. Bone-conducted vibration to the forehead (Fz) was delivered via 50 repetitions of tendon hammer taps (with an integrated 3-axis accelerometer to generate trigger signals). cVEMP responses were considered present if the early first positive wave, p13, and second negative wave, n23, were visible. oVEMP responses were considered present if the first negative wave, n10, and second positive wave, p15, were visible. Reflex peak-to-peak amplitudes (µV) and latencies (ms) of the peaks were calculated.

2.3. μVEMP Device and Filtering After VEMP Data Acquisition

The μVEMP [12] is a multi-channel device with programmable input amplifiers feeding simultaneous-sampling 24 bit analogue-to-digital converters sampling at 4 KHz. In this study, the maximum available gain of 24 was used, yielding an input voltage range of ±187 mV. To date, the largest DBS artifact seen was in the range of 10–15 mV for cVEMP recordings, so we predicted that the recording system would have a factor of 10 ’headroom’ before signal distortion was introduced. In addition, the inputs were DC-coupled and 24-bit analogue-to-digital converters were used, allowing small signals to be detected within large offsets and other noise. Most commercial VEMP recording systems use 16-bit analogue-to-digital converters and a high-gain input amplifier to resolve low-amplitude VEMP potentials. The artifacts generated by DBS devices can drive these systems into saturation and a relatively long recovery time can obscure the input signal. The timing for the data acquisition is derived from a high-stability crystal oscillator resulting in low jitter for the sampling interval and a lower spread in spectral components of the data. Continuous raw data have been recorded by the µVEMP device to allow for separation of individual VEMP traces and filtering of DBS noise.
For the analysis, a number of time and frequency domain filters commonly used to reduce DBS artifacts in EEG and ECG signals were evaluated, with the frequency domain Hampel identifier [15] and the time domain forward–backward [16] filter using various-order Butterworth, Chebyshev or Bessel functions being the most common. Ultimately, a fifth order forward–backward Butterworth filter using Matlab achieved the best elimination of the DBS artifacts without distorting the signal profile or, more importantly, introducing delays in the signal. A Butterworth filter has the least ripple in the passband and the forward–backward method produces no phase shifts in the filtered result and doubles the filter order, yielding a 60 dB per octave attenuation in the stop band.
The first part of the validation of the filtering process was performed by taking VEMP data of a healthy subject (female, 31 yo, no DBS) and then adding sampled DBS noise, which was finally filtered and averaged with the same filters. The second part of the validation was performed by testing one participant with PD and DBS, using the same electrodes and stimulation/recording parameters during the same testing session, with their DBS switched ON, then under a neurologist’s supervision, with the DBS switched OFF. The presence of visible VEMP responses and VEMP trace recordings were compared.

3. Results

In line with the first aim of the study, we were able to record c and oVEMP responses from both the left and right ears with mono-aural ACS and tendon hammer Fz tap BCV during simultaneous monopolar DBS in five participants with PD.
As per aim two, post-filtering of the DBS signal noise revealed the presence of c and oVEMP responses in the five participants. See Figure 1 for a typical example of cVEMP non-filtered (top row) and filtered (bottom row) traces and Figure 2 for oVEMP non-filtered (top row) and filtered (bottom row) traces. c and oVEMP peak-to-peak amplitudes and latencies of the first two early VEMP reflex peaks are given in Table 1 and Table 2, respectively.
Aim three of the study was to validate the post-filtering analysis of the VEMP response. Part one of the validation process involved adding sampled DBS noise to VEMP responses from a healthy subject known to have robust VEMP responses, then running the post-filter analysis. See Figure 3, which shows raw original AC and BCV cVEMP and oVEMP data traces of a healthy subject superimposed with the raw trace and added sampled DBS noise then low-pass filtered and averaged. The trace lines match closely for cVEMPs, though the smaller-amplitude oVEMPs are slightly less well matched, though the presence of VEMPs is evident as vestibular peaks remain visible.
Part two of the validation of the filtering process involved recording the VEMP response in the same participant (P5) with their DBS device switched ON and OFF. cVEMP and oVEMP recordings are provided in Figure 4 and Figure 5, respectively. Averaged VEMP traces with the DBS switched ON and filtered are superimposed with VEMP traces with the DBS OFF. To further validate the reproducibility of VEMP traces, first- and second-half recordings were double traced. See Supplementary Material Figures S1 and S2. Table S1 shows VEMP reflex latencies and peak-to-peak amplitudes and differences between DBS ON and filtered versus DBS OFF. All VEMP responses recorded as present post-filtering with DBS ON were also recorded as present with DBS switched OFF. All reflex latency response differences between ON and OFF were under 1 ms. Peak-to-peak amplitude difference between DBS filtered ON and OFF varies between 17.34 µV and 57.88 µV for cVEMP and between 2.81 µV to 0.2 µV for oVEMP. In this participant, P5, no significant tremor re-emerged during the short period of the VEMP testing protocol (10 min) when the DBS device was switched OFF.

4. Discussion

For the first time, accurate recording of both c and oVEMP responses during simultaneous monopolar DBS was possible due to a combination of the µVEMP device parameters and a customised signal filtering algorithm.
Over 160,000 people have undergone DBS surgery worldwide for both neurological and non-neurological health conditions [17]. As well as being an accepted adjunct therapy for PD, DBS is also approved by the US FDA for the neuro-modulation treatment of essential tremor, dystonia, epilepsy and obsessive–compulsive disorder. In addition, DBS is being investigated as a potential treatment for multiple other conditions, including addiction, major depression, chronic pain, Tourette’s syndrome, and cluster headache [18]. As dizziness and imbalance are common presentations in the general population, it is therefore likely that there are significant numbers of people with monopolar DBS attending neuro-otological clinics for vestibular assessment who would not be able to undergo dynamic otolithic functional assessment with VEMPs due to the artifacts produced by their implanted device.
The current study demonstrates that the portable µVEMP device, which connects to a laptop, tablet, or smartphone and which has a large dynamic input range and software for DBS noise filtering, can accurately record the presence of both oVEMPs and cVEMPs during continuous monopolar DBS. This allows VEMP assessments to be performed during the participants’ usual care in the community and without the need for a supervising neurologist to alter the parameters of the DBS device.
The bilaterally absent ACS cVEMP responses in two subjects and bilaterally absent ACS oVEMP responses in three subjects were not unexpected.
The mean age of the four male participants was 67.5 ± 4.93 years, and there are known age-related effects on both oVEMP and cVEMPs with ACS in the healthy population. These include increased oVEMP and cVEMP thresholds [19]; peak-to-peak amplitude reduction; and response rate decline. cVEMP and oVEMP ACS response abnormalities have also been reported in PD [3,20,21,22]. In the healthy population, tap-evoked responses at Fz have been reported to be less affected by age both for cVEMPs [19,23] and oVEMPs. This is also reflected in these results, with 7 out of the 10 ears stimulated having a present hammer oVEMP response and 9 out of 10 ears having present hammer cVEMP responses.
Sensorineural hearing loss does not have an impact on VEMPs’ presence [4], though a limitation of this study was that conductive hearing loss was not specifically screened; however, the use of tap-evoked VEMPs mitigates this potential impact on our findings.
During part one of the validation process, we introduced DBS noise to a non-DBS VEMP response and applied filtering. A smoothing effect of the curve can be shown in the graph due to low-frequency filtering (100 Hz). This filtering is used to remove the artifacts from the DBS, in our case at around 190 Hz. A smooth curve might lose details in the waveform, but the main peaks and troughs used for the metrics are intact, and so the diagnosis remains unaffected.
During part two of the validation process, the absent responses to left ear ACS oVEMP and cVEMP testing in P5 were expected and secondary to the patient’s previous left ear surgery; where such procedures are known to impair ACS VEMP response [24]. The differences in the peak-to-peak amplitudes of the cVEMP responses between the two test conditions (DBS ON and OFF) could be explained by variations in background neck muscle activity between the two tests. A limitation of the study was that during cVEMP testing, participants’ head position against gravity was monitored, and a stable position was encouraged by the researcher, though background sternocleidomastoid EMG activity was not specifically accounted for. Thus, the corrected peak-to-peak amplitudes were not calculated. If this study was to be repeated, with a larger number of subjects, background muscle activity should be taken into account.

5. Conclusions

The µVEMP device allows safe measurement of dynamic otolithic function during continuous monopolar DBS without the need to adjust stimulation parameters. VEMP response recordings and the customised post-filtering analysis were successfully validated by comparing data from a healthy participant without DBS and data from one PD patient with DBS which was switched ON with filtering and then switched OFF.

Supplementary Materials

The following supporting information can be downloaded at https://www.mdpi.com/article/10.3390/signals6010010/s1, Figure S1: Cervical and ocular VEMPs recorded with DBS device OFF; Figure S2: Cervical and ocular VEMPs recorded with DBS device ON after filtration of the data; Table S1: cVEMP and oVEMP characteristics (peak-to-peak amplitudes and latencies) from the left and right ears (P5) with DBS ON, DBS OFF. Table S2: group demographic information.

Author Contributions

K.E.H. collected data, wrote and edited the paper, E.C. collected data and wrote and edited the paper, J.H. developed the µVEMP device and filtering mechanism and wrote part of the paper; S.J.G.L. was the supervising neurologist and edited the paper; I.S.C. wrote and edited the paper. H.G.M. developed the µVEMP device and edited the paper. All authors have read and agreed to the published version of the manuscript.

Funding

S.J.G.L. is supported by NHMRC Leadership Fellowship (#1195830).

Data Availability Statement

The raw data supporting the conclusions of this article will be made available by the authors on request.

Acknowledgments

We gratefully acknowledge previous grant support from the Garnett Passe and Rodney Williams Memorial Foundation.

Conflicts of Interest

The authors declare no conflicts of interest.

References

  1. Reich, S.G.; Savitt, J.M. Parkinson’s Disease. Med. Clin. N. Am. 2019, 103, 337–350. [Google Scholar] [CrossRef] [PubMed]
  2. Hancu, I.; Boutet, A.; Fiveland, E.; Ranjan, M.; Prusik, J.; Dimarzio, M.; Rashid, T.; Ashe, J.; Xu, D.; Kalia, S.K.; et al. On the (Non-)equivalency of monopolar and bipolar settings for deep brain stimulation fMRI studies of Parkinson’s disease patients. J. Magn. Reson. Imaging 2019, 49, 1736–1749. [Google Scholar] [CrossRef] [PubMed]
  3. Potter-Nerger, M.; Reich, M.M.; Colebatch, J.G.; Deuschl, G.; Volkmann, J. Differential effect of dopa and subthalamic stimulation on vestibular activity in Parkinson’s disease. Mov. Disord. 2012, 27, 1268–1275. [Google Scholar] [CrossRef]
  4. Colebatch, J.G.; Rosengren, S.M.; Welgampola, M.S. Vestibular-evoked myogenic potentials. Handb. Clin. Neurol. 2016, 137, 133–155. [Google Scholar] [CrossRef]
  5. Curthoys, I.S.; Vulovic, V.; Burgess, A.M.; Manzari, L.; Sokolic, L.; Pogson, J.; Robins, M.; Mezey, L.E.; Goonetilleke, S.; Cornell, E.D.; et al. Neural basis of new clinical vestibular tests: Otolithic neural responses to sound and vibration. Clin. Exp. Pharmacol. Physiol. 2014, 41, 371–380. [Google Scholar] [CrossRef] [PubMed]
  6. Wellings, T.P.; Brichta, A.M.; Lim, R. Altered neurofilament protein expression in the lateral vestibular nucleus in Parkinson’s disease. Exp. Brain Res. 2017, 235, 3695–3708. [Google Scholar] [CrossRef] [PubMed]
  7. Allen, N.E.; Schwarzel, A.K.; Canning, C.G. Recurrent Falls in Parkinson’s Disease: A Systematic Review. Park. Dis. 2013, 2013, 906274. [Google Scholar] [CrossRef]
  8. Smith, P.F. Vestibular Functions and Parkinson’s Disease. Front. Neurol. 2018, 9, 1085. [Google Scholar] [CrossRef] [PubMed]
  9. Kim, K.T.; Baik, K.; Lee, S.U.; Park, E.; Lee, C.N.; Woo, D.; Kim, Y.; Kwag, S.; Park, H.; Kim, J.S. Ocular Vestibular-Evoked Myogenic Potential Assists in the Differentiation of Multiple System Atrophy From Parkinson’s Disease. J. Mov. Disord. 2024, 17, 398–407. [Google Scholar] [CrossRef]
  10. Curthoys, I.S.; Vulovic, V.; Burgess, A.M.; Sokolic, L.; Goonetilleke, S.C. The response of guinea pig primary utricular and saccular irregular neurons to bone-conducted vibration (BCV) and air-conducted sound (ACS). Hear. Res. 2016, 331, 131–143. [Google Scholar] [CrossRef]
  11. Temperli, P.; Ghika, J.; Villemure, J.G.; Burkhard, P.R.; Bogousslavsky, J.; Vingerhoets, F.J. How do parkinsonian signs return after discontinuation of subthalamic DBS? Neurology 2003, 60, 78–81. [Google Scholar] [CrossRef] [PubMed]
  12. MacDougall, H.G.; Holden, J.; Rosengren, S.M.; Chiarovano, E. μVEMP: A Portable Interface to Record Vestibular Evoked Myogenic Potentials (VEMPs) With a Smart Phone or Tablet. Front. Neurol. 2018, 9, 543. [Google Scholar] [CrossRef] [PubMed]
  13. Hawkins, K.E.; Chiarovano, E.; Paul, S.S.; MacDougall, H.G.; Curthoys, I.S. Static and dynamic otolith reflex function in people with Parkinson’s disease. Eur. Arch. Oto-Rhino-Laryngol. 2021, 278, 2057–2065. [Google Scholar] [CrossRef]
  14. Hawkins, K.E.; Paul, S.S.; Chiarovano, E.; Curthoys, I.S. Using virtual reality to assess vestibulo-visual interaction in people with Parkinson’s disease compared to healthy controls. Exp. Brain Res. 2021, 239, 3553–3564. [Google Scholar] [CrossRef] [PubMed]
  15. Pearson, R.K. Data cleaning for dynamic modeling and control. In Proceedings of the European Control Conference, Karlsruhe, Germany, 31 August–3 September 1999; ETH Zurich: Zurich, Switzerland, 1999. [Google Scholar]
  16. Gustafsson, F. Determining the initial states in forward-backward filtering. IEEE Trans. Signal Process. 1996, 44, 988–992. [Google Scholar] [CrossRef] [PubMed]
  17. Lozano, A.M.; Lipsman, N. Probing and regulating dysfunctional circuits using deep brain stimulation. Neuron 2013, 77, 406–424. [Google Scholar] [CrossRef] [PubMed]
  18. Budman, E.; Deeb, W.; Martinez-Ramirez, D.; Pilitsis, J.G.; Peng-Chen, Z.; Okun, M.S.; Ramirez-Zamora, A. Potential indications for deep brain stimulation in neurological disorders: An evolving field. Eur. J. Neurol. 2018, 25, 434-e30. [Google Scholar] [CrossRef] [PubMed]
  19. Welgampola, M.S.; Colebatch, J.G. Vestibulocollic reflexes: Normal values and the effect of age. Clin. Neurophysiol. 2001, 112, 1971–1979. [Google Scholar] [CrossRef]
  20. de Natale, E.; Ginatempo, F.; Paulus, K.; Manca, A.; Mercante, B.; Pes, G.; Agnetti, V.; Tolu, E.; Deriu, F. Paired neurophysiological and clinical study of the brainstem at different stages of Parkinson’s Disease. Clin. Neurophysiol. 2015, 126, 1871–1878. [Google Scholar] [CrossRef]
  21. Shalash, A.S.; Hassan, D.M.; Elrassas, H.H.; Salama, M.M.; Méndez-Hernández, E.; Salas-Pacheco, J.M.; Arias-Carrión, O. Auditory-and Vestibular-Evoked Potentials Correlate with Motor and Non-Motor Features of Parkinson’s Disease. Front. Neurol. 2017, 8, 55. [Google Scholar] [CrossRef] [PubMed]
  22. Venhovens, J.; Meulstee, J.; Bloem, B.R.; Verhagen, W.I.M. Neurovestibular analysis and falls in Parkinson’s disease and atypical parkinsonism. Eur. J. Neurosci. 2016, 43, 1636–1646. [Google Scholar] [CrossRef] [PubMed]
  23. Rosengren, S.M.; Govender, S.; Colebatch, J.G. Ocular and cervical vestibular evoked myogenic potentials produced by air- and bone-conducted stimuli: Comparative properties and effects of age. Clin. Neurophysiol. 2011, 122, 2282–2289. [Google Scholar] [CrossRef] [PubMed]
  24. Tramontani, O.; Gkoritsa, E.; Ferekidis, E.; Korres, S.G. Contribution of Vestibular-Evoked Myogenic Potential (VEMP) testing in the assessment and the differential diagnosis of otosclerosis. Med. Sci. Monit. 2014, 20, 205–213. [Google Scholar] [CrossRef]
Figure 1. Graphs showing left and right ears’ cVEMP responses to ACS and BCV recorded from one participant (P2) with DBS ON. Raw data (unfiltered) are shown on the top row and filtered data are shown on the bottom row. Note the scale difference between the unfiltered and filtered graphs. Vertical axis: amplitude in µV; horizontal axis: latency in ms. ACS—air-conducted stimulus, BCV—Bone-conducted vibration, DBS—deep brain stimulation, cVEMP—cervical vestibular evoked myogenic potential.
Signals 06 00010 g001
Figure 2. Graphs showing left and right ears’ oVEMP responses to ACS and BCV recorded from one participant (P2) with DBS ON. Raw data (unfiltered) are shown on the top row and filtered data are shown on the bottom row. Note the scale difference between the unfiltered and filtered graphs. Vertical axis: amplitude in µV; horizontal axis: latency in ms. ACS—air-conducted stimulus, BCV—bone-conducted vibration, DBS—deep brain stimulation, oVEMP—ocular vestibular evoked myogenic potential.
Signals 06 00010 g002
Figure 3. Graph showing cVEMP and oVEMP responses to BCV hammer and ACS clicks recorded from one healthy participant. Original data are shown by the grey curve and data after DBS noise combination and filtering are shown by the blue curve. Note the similarity between the two curves particularly for the cVEMPs. cVEMP—cervical vestibular evoked myogenic potential; BCV—bone-conducted vibration; DBS—deep brain stimulation.
Signals 06 00010 g003
Figure 4. Graphs showing left (left-hand-side panel) and right (right-hand-side panel) ear cVEMP responses to ACS (top row) and BCV (bottom row) recorded from one participant (P5) with DBS ON after the signal was filtered (orange curve) and DBS was OFF (blue curve). Coloured arrows indicate first positive and negative vestibular reflex peaks. ACS—air-conducted stimulus, BCV—bone-conducted vibration, DBS—deep brain stimulation, cVEMP—cervical vestibular evoked myogenic potential.
Signals 06 00010 g004
Figure 5. Validation part 2. oVEMP responses from one participant (P5) with DBS ON with filtering vs. DBS OFF. The graphs show an averaged 100 ms epoch starting 20 ms prior to stimulus at 0 to 80 ms post-stimulus. X axis is in ms. Y axis is the reflex amplitude in µV. The orange line shows a trace with DBS ON post filtering. The blue line shows a trace with DBS OFF. Coloured arrows indicate first positive and negative vestibular reflex peaks. Note the similarities between the two curves. DBS—deep brain stimulation, oVEMP—ocular vestibular evoked myogenic potential.
Signals 06 00010 g005
Table 1. Left and right ears’ cervical vestibular evoked myogenic potential (cVEMP) peak-to-peak amplitudes in µV and p13 and n23 peak latencies in ms for each five participants in response to ACS and BCV stimulations. ACS—air-conducted stimulus; BCV—bone-conducted vibration.
cVEMP ACS Left Ear cVEMP ACS Right Ear cVEMP BCV Left Ear cVEMP BCV Right Ear
Subject Pp Amp
μV
p1 Latency
ms
n1 Latency msPp Amp
μV
p1 Latency msn1 Latency
ms
Pp Amp μVp1 Latency
ms
n1 Latency
ms
Pp Amp μVp1 Latency
ms
n1 Latency
ms
P1 88.0712.7520.7589.3513.020.2530.1213.518.50105.2014.523.0
P2 39.8213.020.041.012.020.0070.9215.022.2575.9214.7522.0
P3 0--0--29.4116.2525.250--
P4 0--0--30.8313.7520.2571.1313.7520.75
P50 --177.311319.25176.671319.25143.001319.5
Table 2. Left and right ears’ ocular vestibular evoked myogenic potential (oVEMP) peak-to-peak amplitudes in μV and n10 and p15 peak latencies in ms for each five participants in response to ACS and BCV stimulations. ACS—air-conducted stimulus; BCV—bone-conducted vibration.
oVEMP ACS Left Ear oVEMP ACS Right Ear oVEMP BCV Left Ear oVEMP BCV Right Ear
PatientPp Amp
μV
n1 Latency P1 LatencyPp Amp
μV
n1 Latencyp1 LatencyPp Amp
μV
n1 Latencyp1 LatencyPp Amp
μV
n1 Latencyp1 Latency
P10--0--2.019.2514.502.08.514.0
P20--3.8010.515.515.399.515.7515.239.015.25
P30--0--0--4.611016.5
P40--0--0--0--
P50--2.12713.513.218.2514.510.628.2513.75
Disclaimer/Publisher’s Note: The statements, opinions and data contained in all publications are solely those of the individual author(s) and contributor(s) and not of MDPI and/or the editor(s). MDPI and/or the editor(s) disclaim responsibility for any injury to people or property resulting from any ideas, methods, instructions or products referred to in the content.

