Article

Search Space Reduction for Localization and Tracking of an Acoustic Source

by
Orlando Camargo Rodríguez
1,*,
Lilun Zhang
2 and
Xinghua Cheng
2
1
LARSyS, Campus de Gambelas, Universidade do Algarve, 8005-139 Faro, Portugal
2
College of Meteorology and Oceanography, National University of Defense Technology, 109 DeYa Road, Kaifu District, Changsha 410073, China
*
Author to whom correspondence should be addressed.
Signals 2023, 4(3), 478-488; https://doi.org/10.3390/signals4030025
Submission received: 13 March 2023 / Revised: 26 May 2023 / Accepted: 13 June 2023 / Published: 26 June 2023

Abstract

:
Experimental data from the SACLANTCEN 1993 Mediterranean Experiment are reviewed to assess the reduction of the search space for the localization and tracking of an acoustic source in a three-dimensional environment. Key to this goal is the availability of an initial estimate of source range and depth (called the 2D initial guess); an ambiguous estimate of source bearing can be obtained from the 2D initial guess through Environmental Signal Processing, and the ambiguity can be removed by searching for the source only in the range/bearing regions where bearing estimates are higher. This search provides a new estimate of source range and a single bearing, which together with the estimate for source depth constitute the center of the reduced search space for source localization and tracking. The suggested approach is tested on experimental data from the SACLANTCEN experiment considering different frequencies, as well as a stationary and a moving source.

1. Introduction

Source localization is at the core of Matched Field Processing (MFP) [1], a fundamental technique of Underwater Acoustics that generalizes the concept of plane-wave beamforming [2]. In MFP, a set of candidate predictions of the acoustic field (called replicas) are to be compared with a given set of signal observations acquired at a single array; the replica with the better fit to the observations can be used to infer the position of the source. A critical condition for MFP to be successful is to have a proper knowledge of the sound speed profile, bottom properties, and local bathymetry and to take advantage of a reliable underwater acoustic model. Generally speaking, there are two different types of source localization: the first one is two-dimensional (2D) source localization, which can be seen as the problem of finding the source coordinates ( r s , z s ) within the search space defined by [ r min , r max ] × [ z min , z max ] ; the second case is three-dimensional (3D) source localization, which corresponds to the problem of finding the source coordinates ( r s , z s , ϕ s ) within the search space defined by [ r min , r max ] × [ z min , z max ] × [ ϕ min , ϕ max ] , where ϕ stands for source bearing, and in general ϕ max ϕ min = 360 (the choice of cylindrical coordinates is a typical convention). In both cases, the calculation of replicas takes place among all possible combinations of coordinates within the search space; for obvious reasons, the number of combinations is much higher in 3D source localization than in 2D source localization. Strictly speaking, 2D environments do not exist because ocean bathymetries are always 3D; however, there are often configurations of the source and the array in which the sea bottom transect can be approximated as flat. In such cases, one can replace 3D source localization with 2D source localization and rely on a normal mode model to provide an efficient calculation of replicas over a given interval of source depths; this replacement is attractive in order to reduce the size of the search space but is achieved at the cost of losing the source bearing because the calculation of replicas depends on range and depth only. Two-dimensional MFP-based localization had been discussed in detail considering simulations and experimental data for both the narrowband and broadband cases [3,4,5,6,7,8]; additionally, non-MFP 2D localization with a single hydrophone has been shown to be possible as well [9,10]. Environmental Signal Processing (ESP) was proposed to overcome the bearing limitations of 2D source localization in [11] by suggesting to take advantage of the bathymetry. To this end, one can consider two different approaches: the first one is the so-called N × 2D modeling, in which replicas are to be calculated along 2D transects over N bearings; in the second approach, replicas are to be calculated taking into account all the variability of the 3D environment. Environmental Signal Processing based on the N × 2D approach using the KRAKEN normal mode model [12] was discussed in detail for experimental data in [13], but only for a subset of all possible bearings; under such conditions, the particular bounds on the source bearing certainly allow us to reduce the size of the search space, but this is a specific type of a priori information that cannot be expected to be always available. Current computational resources certainly allow us to handle 3D source localization successfully for all combinations of parameters of the search space. However, by proceeding in this manner, the method seems to be missing one important fact, namely that the calculation of replicas over the entire 3D search space is undesirable because of the corresponding computational burden; besides, such calculation is also inefficient because a large percentage of the replicas will provide a low fit to the observations. The approach described in this discussion looks forward to the reduction of the search space for 3D localization through the identification of reliable bearings; to this end, source localization starts with a “2D initial guess”, which is nothing more than the result of 2D localization obtained under the assumption that the waveguide is flat. The 2D initial guess is then combined with ESP to identify regions of reliable bearings, and these reliable bearings are further reduced to a single bearing by searching over the bearing/range space. This search provides a unique bearing and a new range, which, together with the source depth of the 2D initial guess, represent the center of a reduced neighborhood in which the 3D search can take place. Certainly, there are cases, like cross-slope propagation in a wedge environment [14], for which it is very unlikely to obtain a reliable 2D initial guess. However, the diversity of scenarios for which the 2D initial guess can be obtained is too broad to be considered here; it would be necessary to compare vertical versus horizontal arrays, narrowband versus broadband processing, mild versus rough bathymetries, single versus multiple hydrophone arrays, etc. This complex issue deserves to be addressed in future independent discussions. The proposed approach is exemplified here using the exceptional data from the SACLANTCEN 1993 Mediterranean Experiment, which are available online. (http://spib.linse.ufsc.br/sonar.html accessed on: 14 June 2023) [15]. The experiment itself is described in brief in Section 2, together with the corresponding experimental data and the 2D initial guess. Localization and tracking are discussed in Section 3, while conclusions and future work are presented in Section 4.

2. The Experiment

The SACLANTCEN 1993 Mediterranean Experiment is described in detail in the literature [16]; thus, a compact description is presented in this section. Transmissions took place in a shallow water area north of the island of Elba in an environment with a mild bathymetry and over a two day period on 26 and 27 October 1993. A vertical array (VLA) with 48 hydrophones spanning the water column from 18.7 to 112.7 m was deployed on the morning of the 26th, and on the same day, a source was deployed at a stationary position 5.8 km north of the VLA; on the 27th starting at 14:00 h, a support ship moving northward towed a source with similar characteristics to the one deployed at the stationary position. The stationary source was attached to a surface buoy, which was itself tethered to a ballast lying on the bottom; the length of the tether cable was such that the position of the stationary source was only known to be within a circle of radius 200 m with its center at the ballast. Depending on wind conditions, the stationary source could be closer to or further from the VLA within that circle. GPS coordinates for the VLA and the source ballast are indicated in Table 1; the corresponding accuracy for each position was around 100 m. Two signals, called RM2 and RM5, were transmitted at different moments by the stationary source, while the moving source transmitted only the RM5 signal; both RM2 and RM5 were transmissions of pseudorandom noise with bit shift registers for which there is no available information. According to the literature, center frequencies for RM2 and RM5 corresponded to 335 and 170 Hz, respectively [16]; however, frequency-based optimization indicated that a better fit between replicas and data could be achieved using slightly different values of frequency (see Section 2.2).

2.1. The Experimental Data

The received signals are distributed in MATLAB mat files, each containing around 1 min of transmissions with a sampling rate of 1 kHz; every file stores the time series in matrix form, with every row containing the data of one of the 48 hydrophones. The data were recorded on 26 and 27 October 1993 and after additional processing were organized in the following way:
  • Five files for the stationary source, RM2 signal, recorded on 26 October.
  • Ten files for the stationary source, RM5 signal, recorded on 26 October.
  • Ten files for the moving source, RM5 signal, recorded on 27 October.
Timestamps are not available for the files; navigation coordinates for the moving source are also not available.

2.2. The 2D Initial Guess

Personal archival data with the site bathymetry in geographical coordinates were converted to UTM coordinates, as well as the VLA and stationary source GPS positions. To simplify the calculation of replicas, the obtained cartesian coordinates were further shifted in order to place the VLA at the origin of the bathymetry (see Figure 1); the expected range between the stationary source and the VLA range was calculated from these coordinates, providing the value r s = 5836 m. The source bearing relative to the VLA was found to be ϕ s = 93 . 3 . Combined errors of GPS positions and wind-induced source drifting provide an error in the source range of approximately 400 m and a source bearing between 91 and 95 . From the description of experimental conditions, bearing estimates for the stationary and moving sources were expected to lie within this interval. The map shown in Figure 1 reveals a bathymetry in which depth increases mildly from right to left, with almost vertical isobaths; in particular, the isobath passing at the source slightly misses the VLA and gently deviates to the left in the region with Y < 0 .
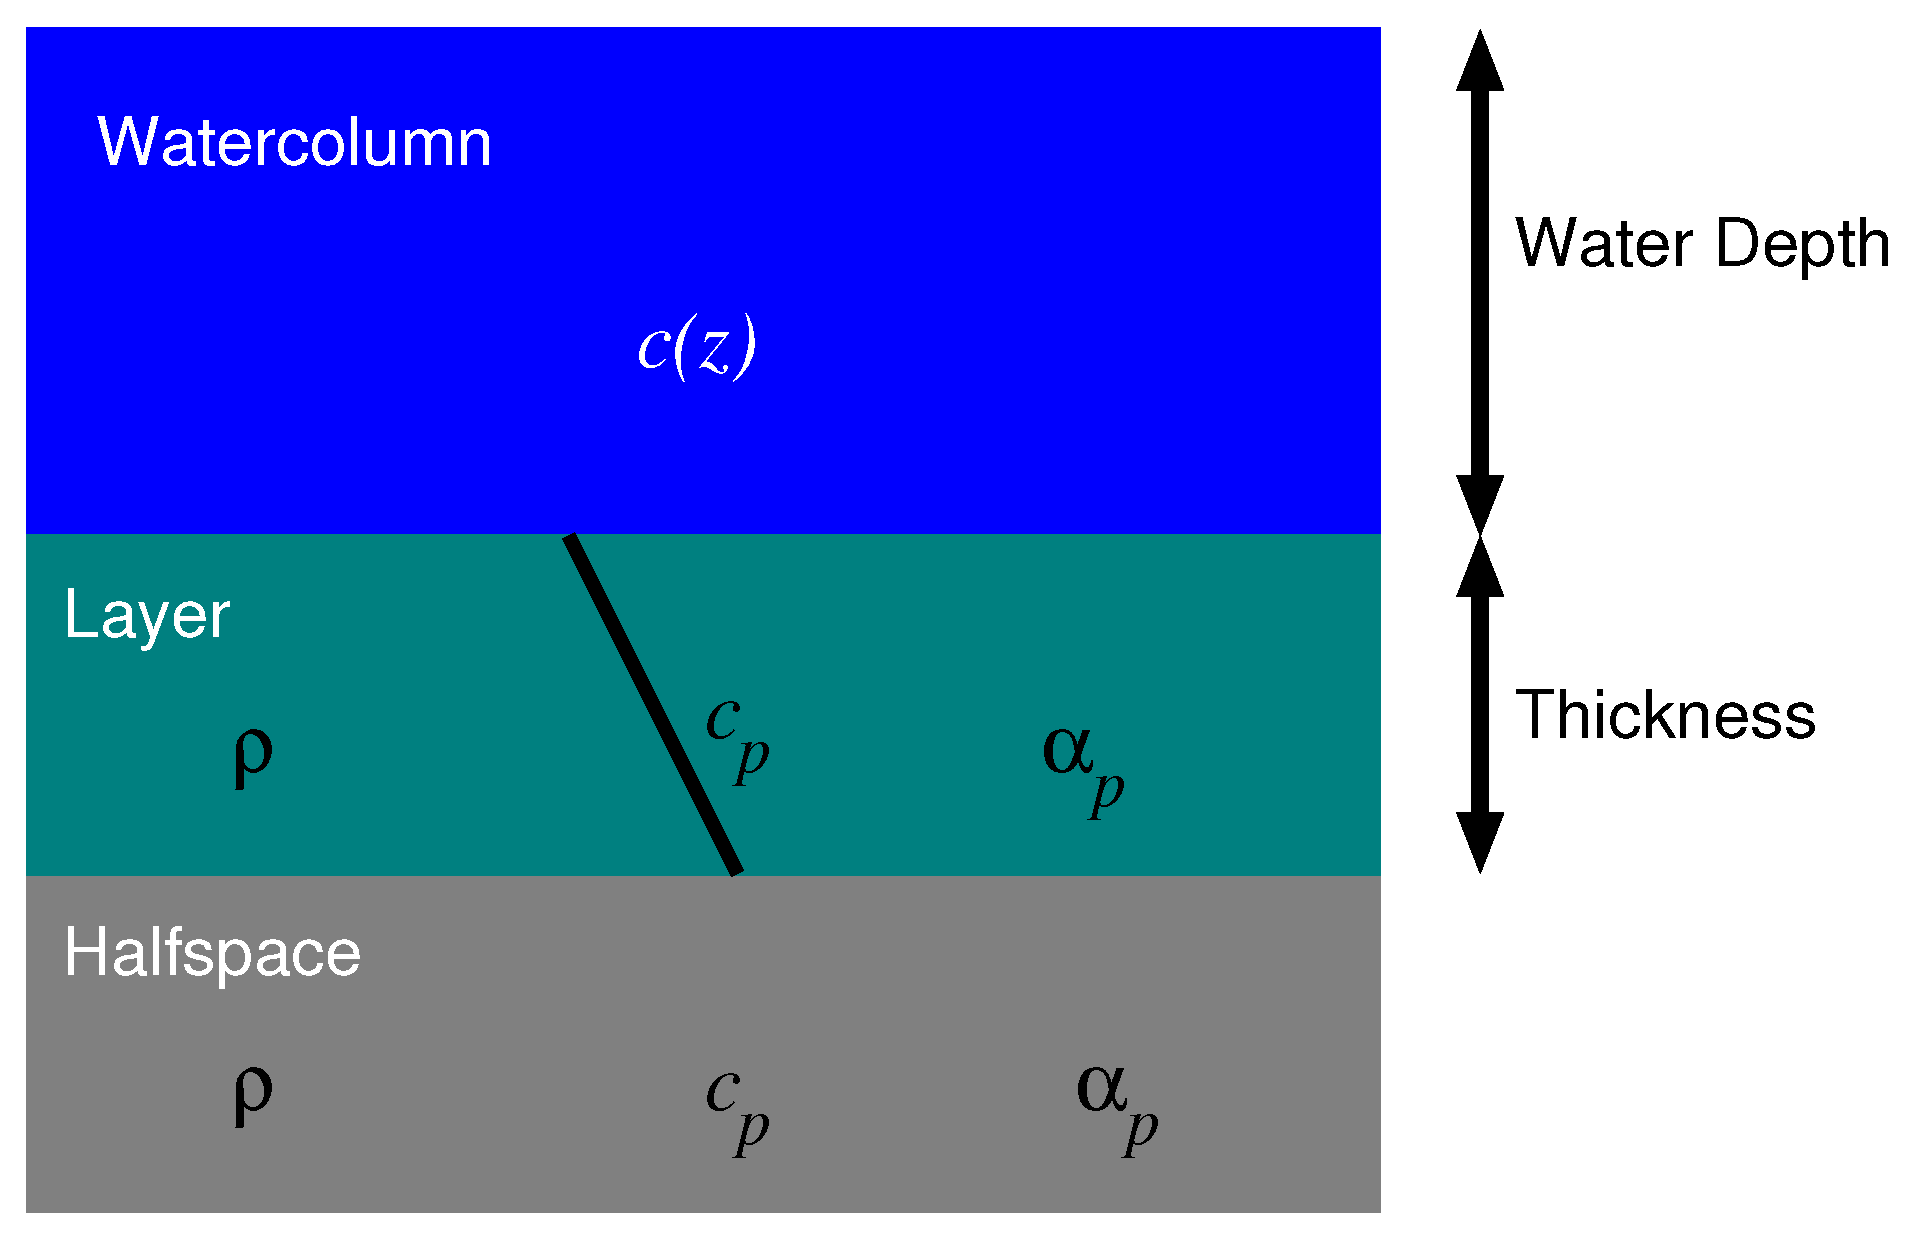
The bottom model adopted considered a single layer over a half space (see Figure 2); this model was adopted from the literature (see [5,17]). The corresponding properties are shown in Table 2.
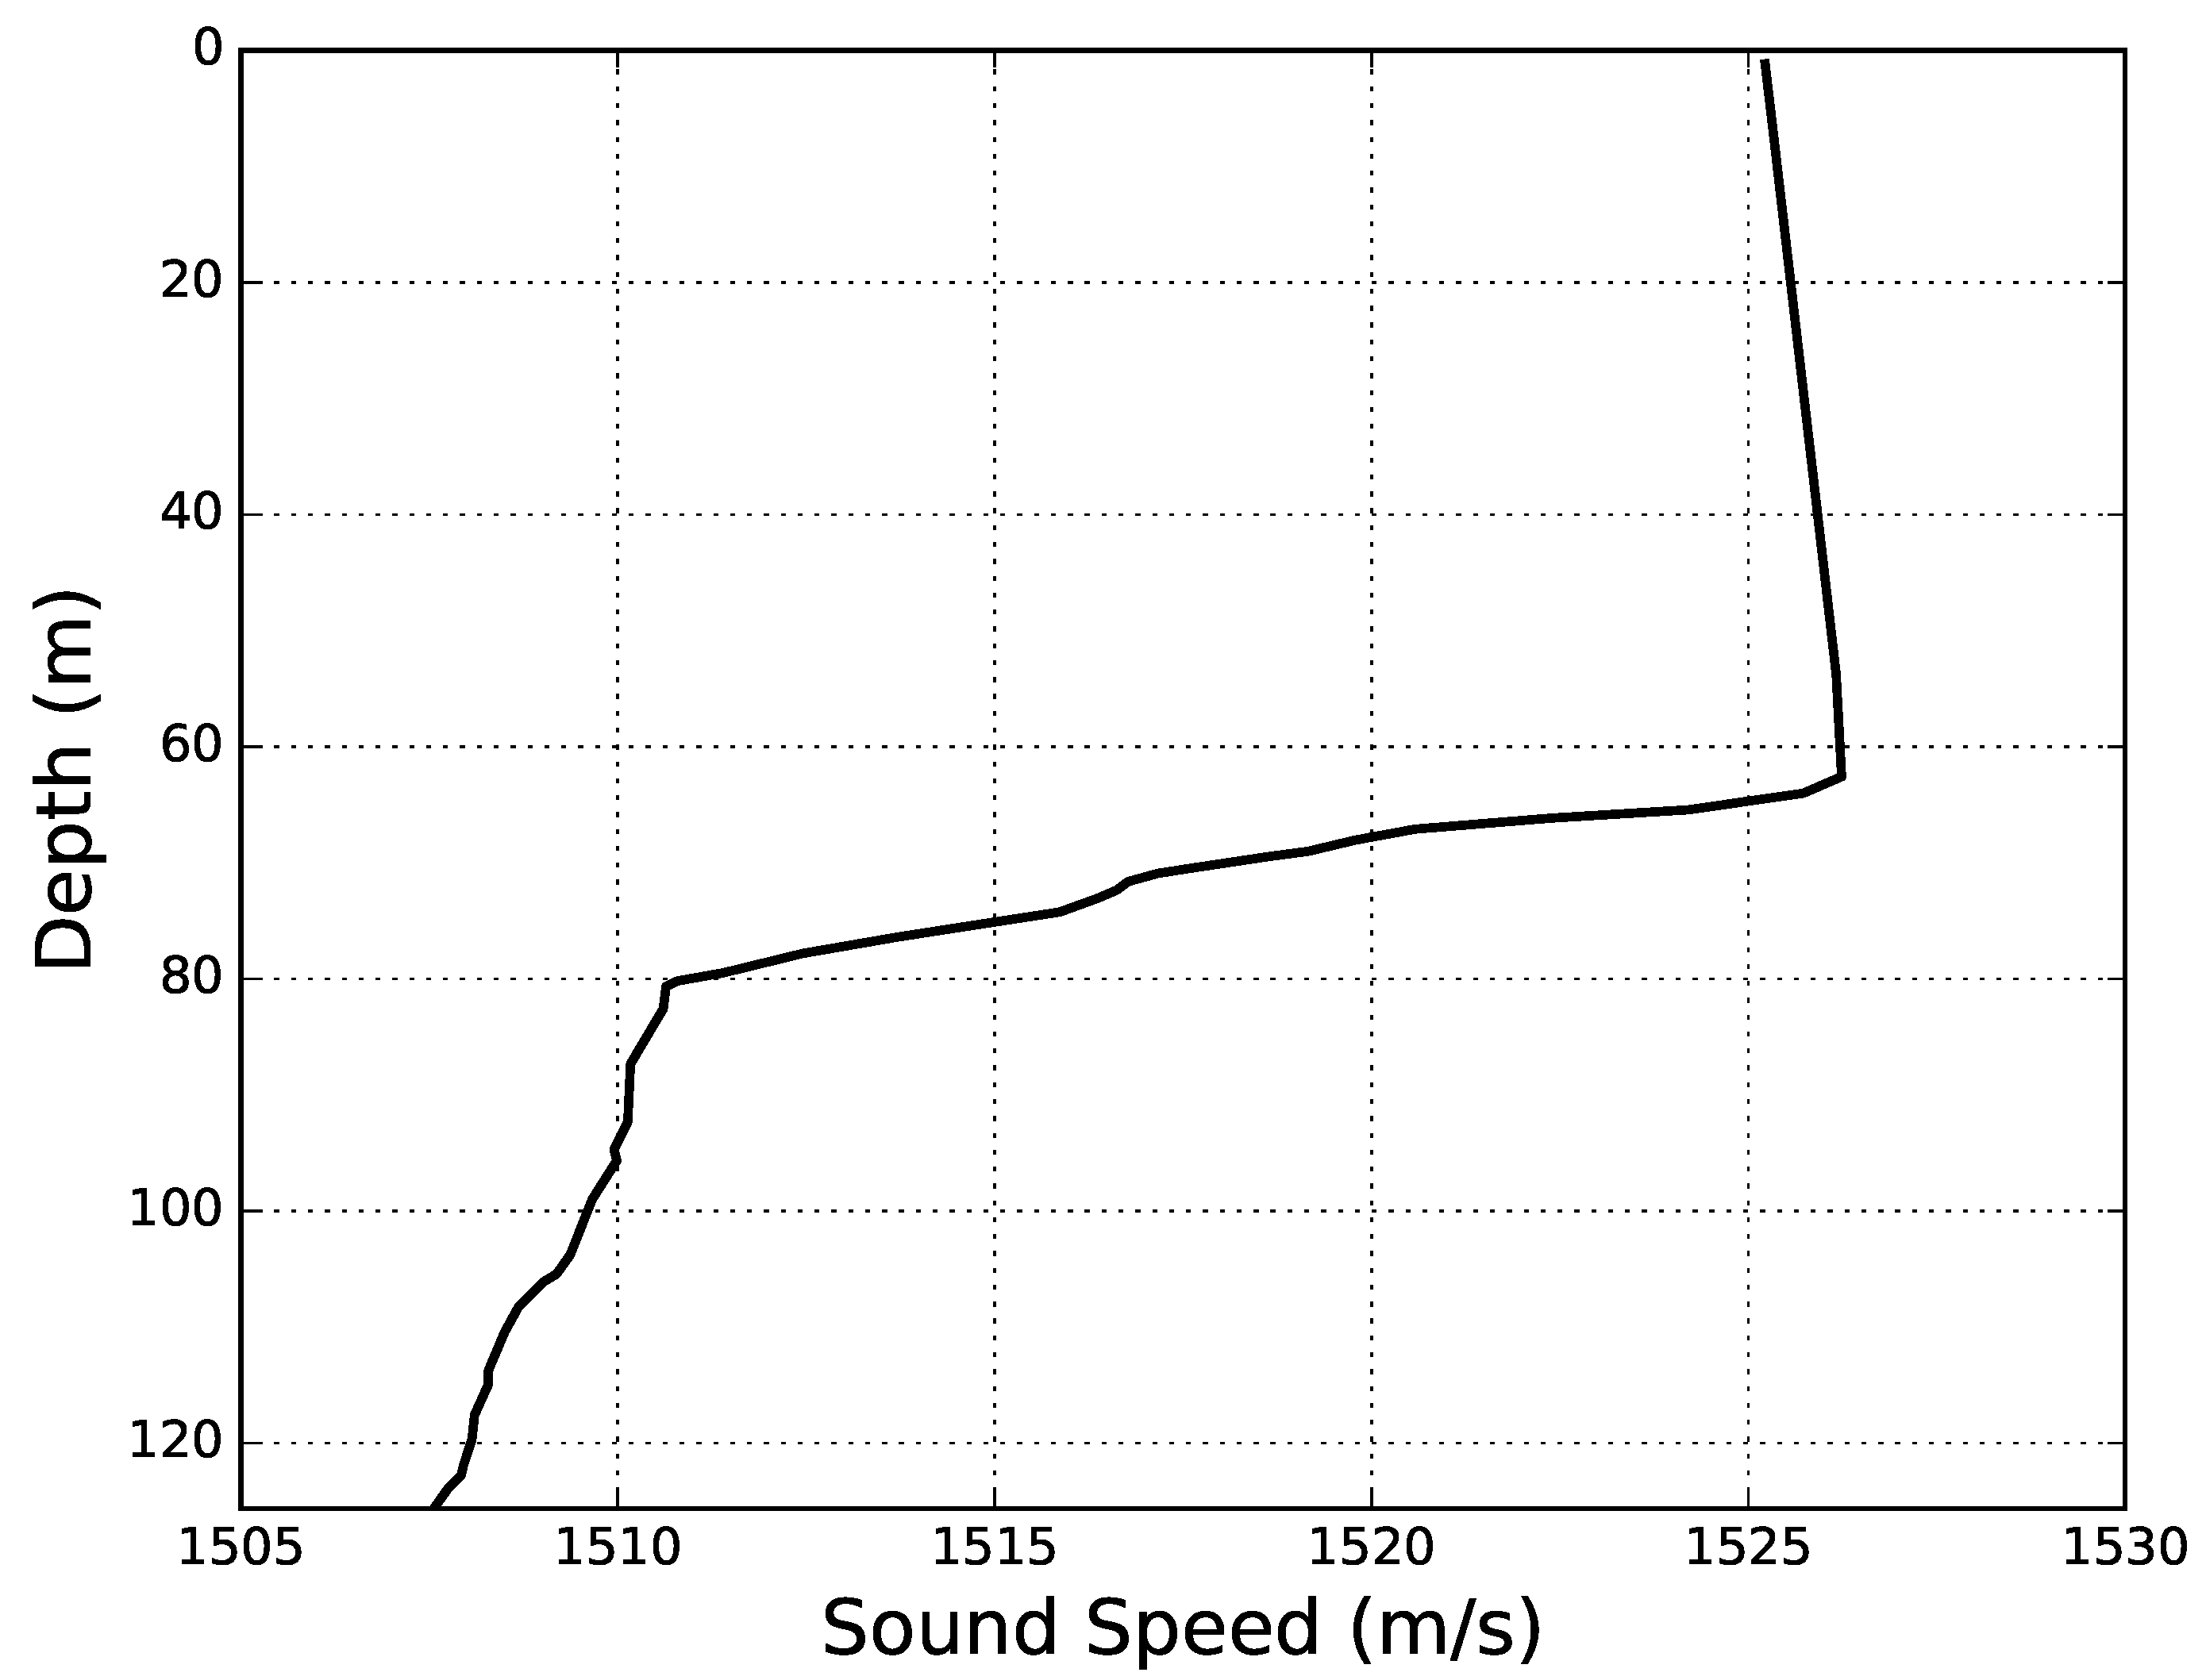
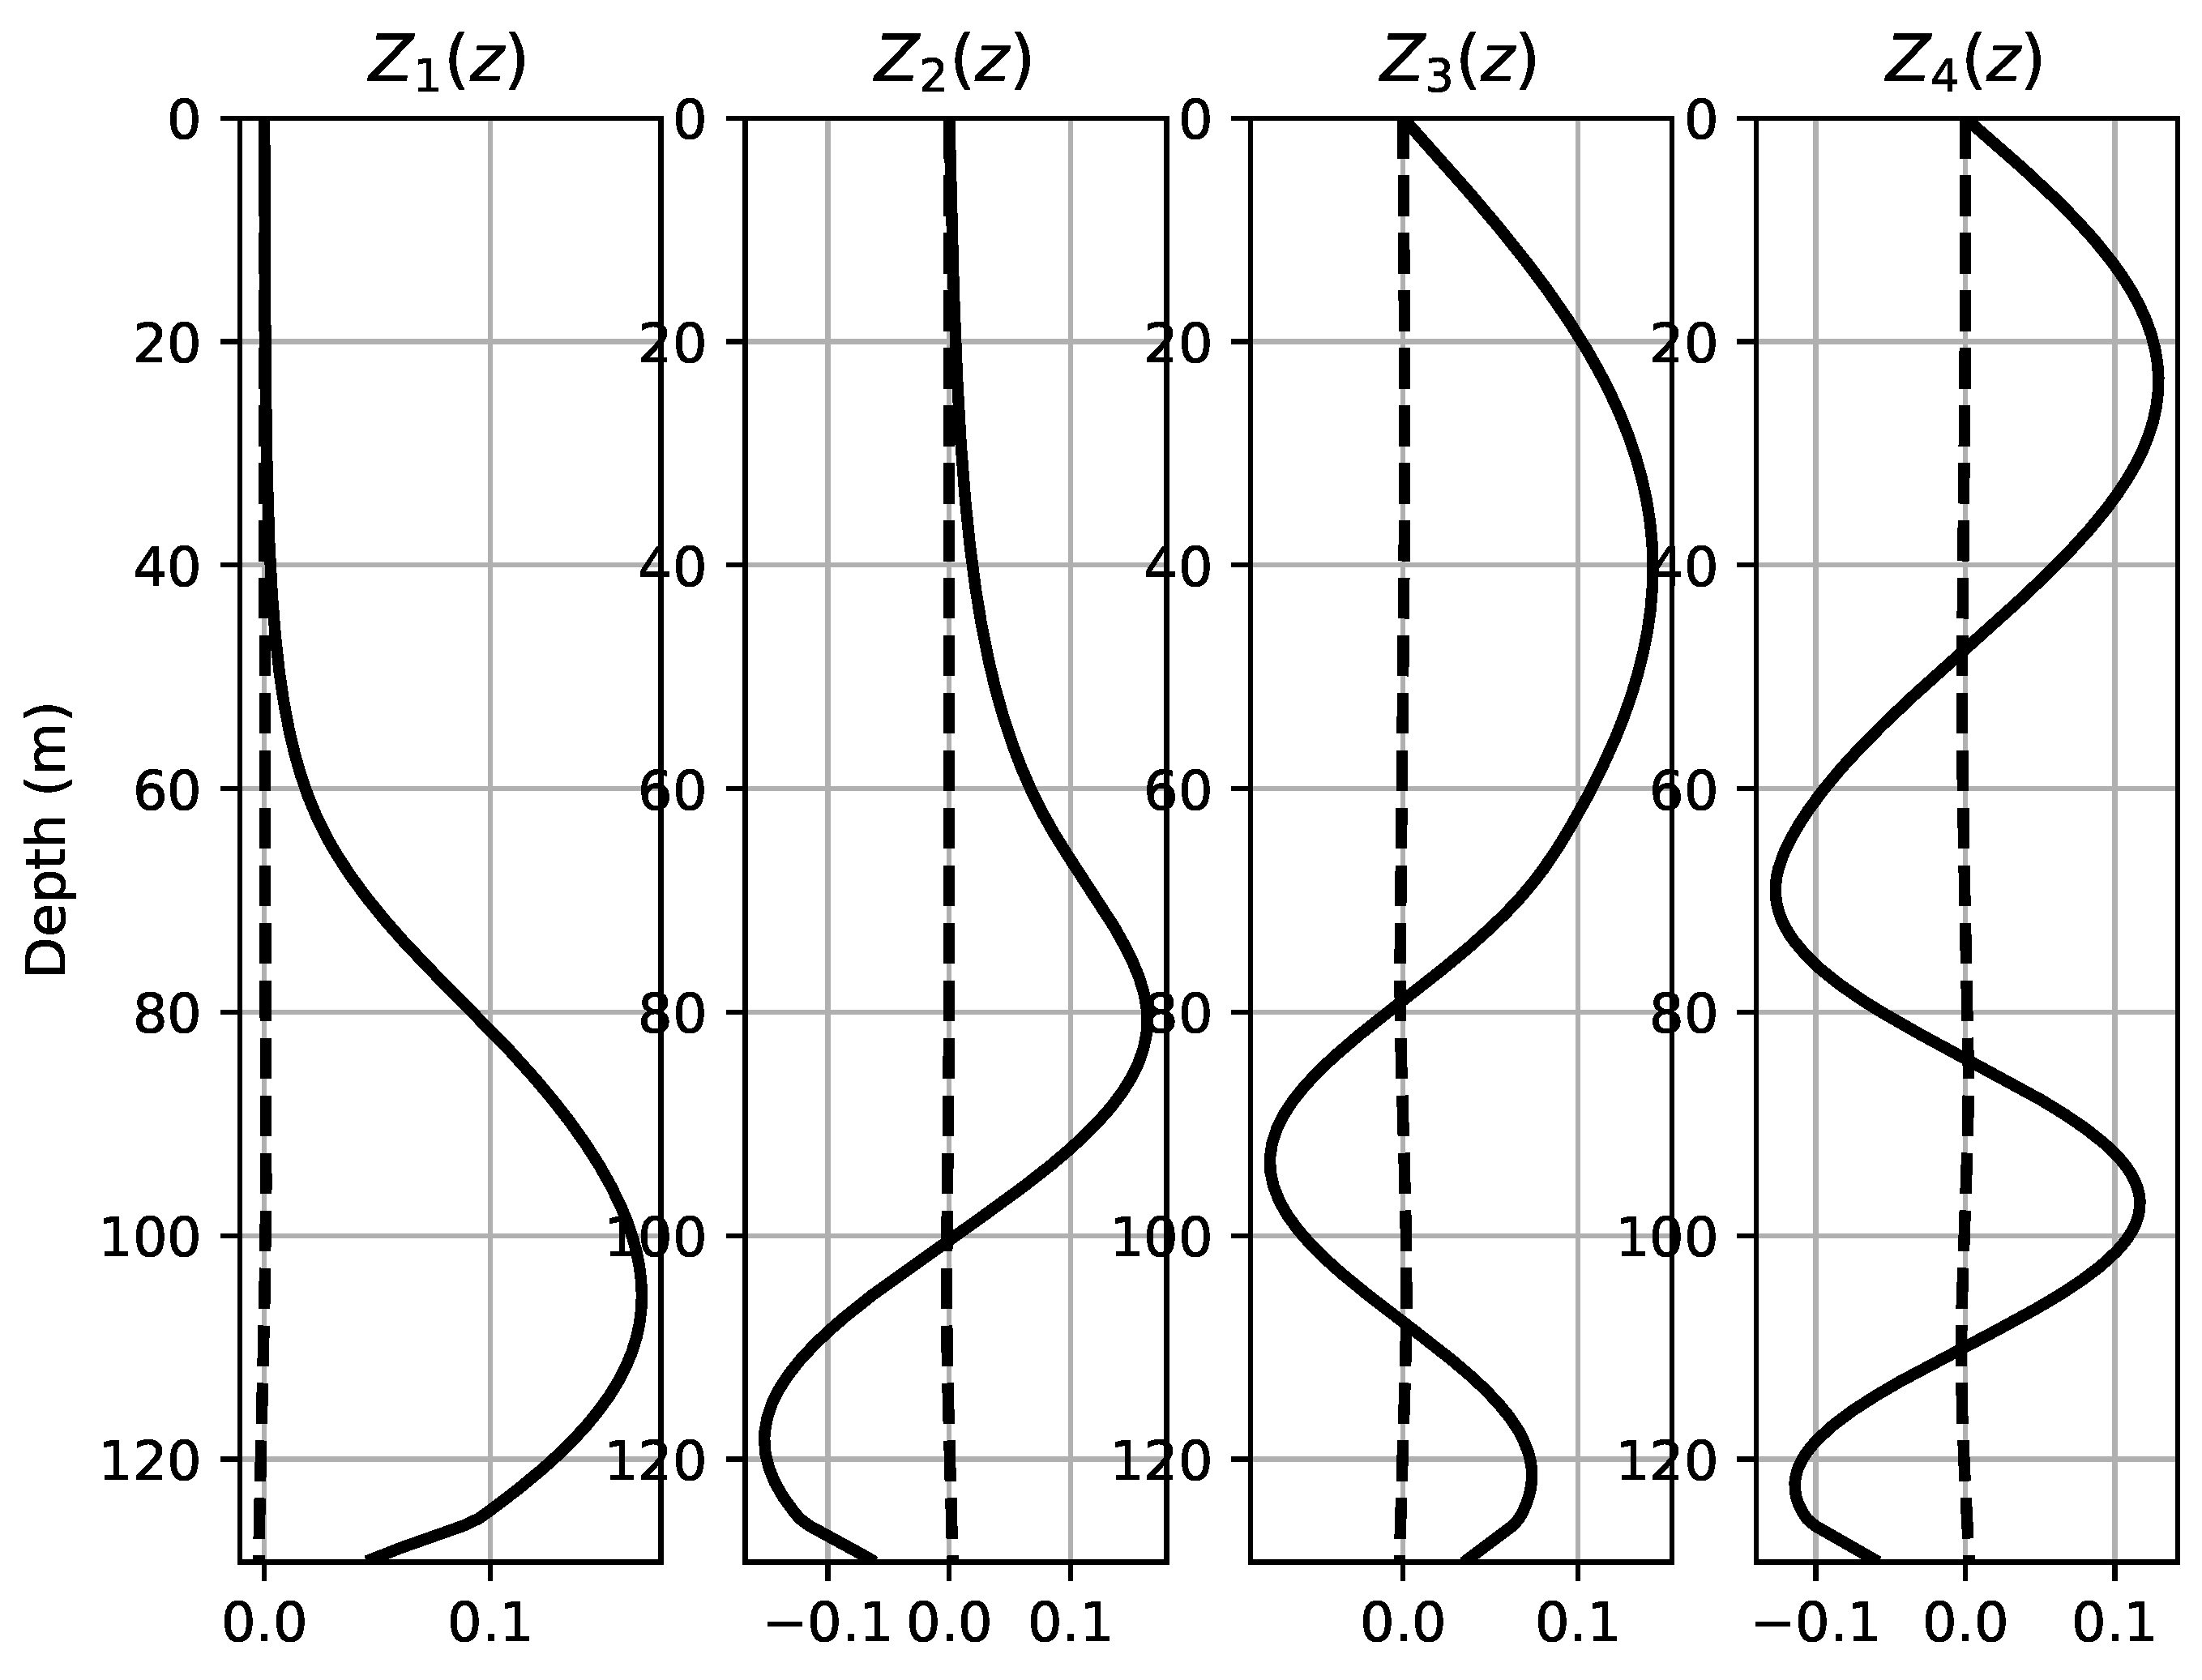
Several sound speed profiles (SSPs) are provided with the acoustic data; however, different trials of replica generation demonstrated that the only SSP that can provide consistent estimates of source position for the 2D initial guess is the one shown in Figure 3. This is somehow surprising in terms of the stationarity of sound speed over two days of transmissions, and this is an issue that deserves future discussions. The SSP has unusual features: above 60 m depth, it is almost constant, while in the interval from 60 to 80 m, it exhibits a strong thermocline, with a negative gradient; below 80 m depth, it decreases almost linearly. In terms of ray propagation, the SSP divides the water column into two different waveguides: for a source placed above 60 m, rays will bounce within the surface and the bottom, no matter what the launching angle is, while for a source placed below 60 m, rays with small launching angles will bounce on the bottom repeatedly, and steeper rays will “escape” the thermocline and bounce within the two boundaries. However, ray field predictions were not used in source localization due to the fine-scale irregularities of the SSP and because ray models cannot account for layer properties; replicas were instead calculated with the KRAKEN normal mode model, which provides rather smooth predictions of the modes (see Figure 4) and easily accommodates the different parameters of the bottom model.
During calculations, it was noticed through optimization than an additional tuning of water depth and signal frequency allowed us to improve the fit between replicas and observations, relative to the values indicated in the literature; thus, the 2D initial guess was generated using the tuned values shown in Table 3.
In all cases, the fit between the replicas and the observations was calculated considering the narrowband Bartlett estimator, which can be written as [18]
B ^ ( r , z , ϕ ) = e * R ( r s , z s , ϕ s ) e ,
where e ( r , z , ϕ ) is the normalized replica calculated for a fixed frequency, * denotes the conjugate transpose, and R stands for the covariance matrix, which was calculated from received signals with MATLAB code provided with the acoustic data. When the dependence on the bearing is weak, B ^ ( r , z , ϕ ) = B ^ ( r , z ) and 2D localization can be achieved from the condition
B ^ ( r s , z s ) = max ( r , z ) B ^ ( r , z ) .
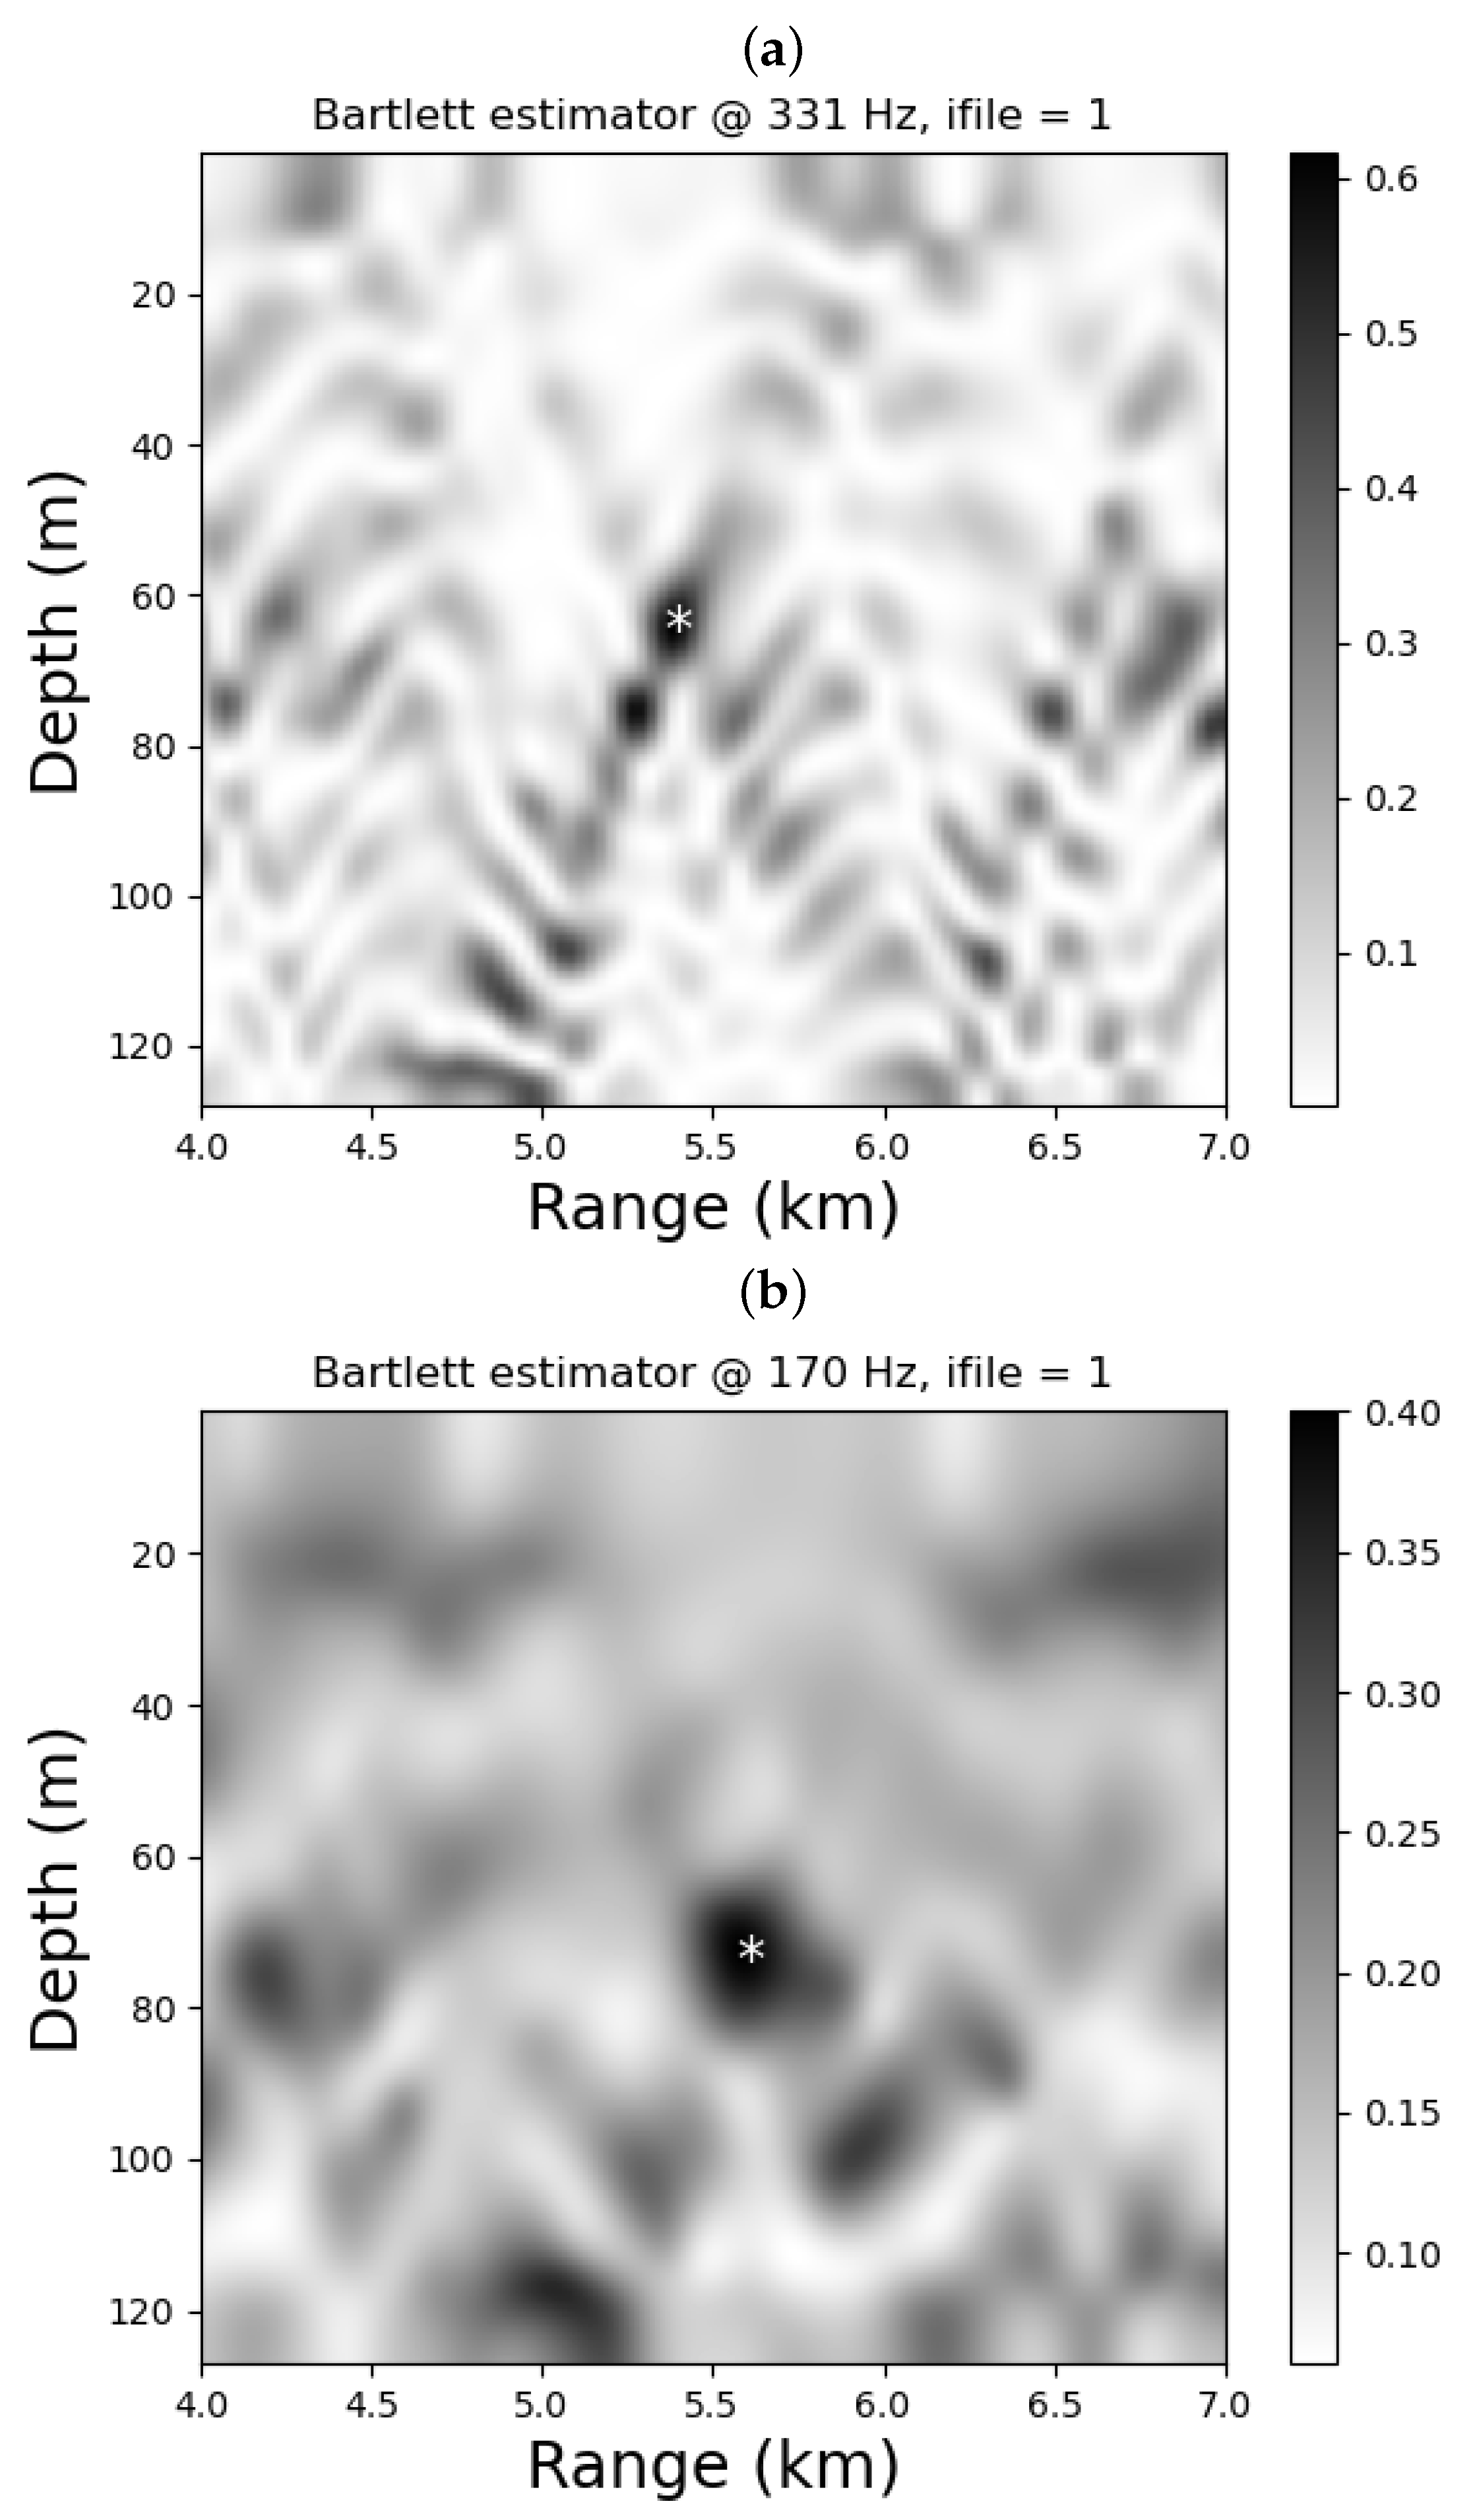
The set with 2D initial guesses for the acoustic data was obtained considering frequencies that maximized the Bartlett estimator, but ignoring any wind influence; the corresponding results are shown in Table 4. The Bartlett estimator is shown in two particular cases in Figure 5. The 2D initial guess for the stationary source at 331 Hz is rather consistent for all files, but underestimates the source–VLA range by almost 500 m; the corresponding source position is also different from the estimate for the stationary source at 171 Hz, which is itself very consistent and lies within the range of error. The guess for the moving source at 170 Hz clearly indicates a source moving away from the VLA. The exact nature of the differences in position for the stationary sources is unclear; it seems reasonable to consider that they reflect changes in wind direction and ocean currents along transmissions.

3. Three-Dimensional Localization and Tracking

Calculations of the 2D initial guess with the KRAKEN model require a reduced amount of computational time because bottom properties and sound speed are known; the next step for 3D localization and tracking consists in generating estimates of source bearing. To this end, one can rely on ESP for the generation of replicas; the source at depth z s is idealized as rotating around the VLA along a circle with a radius r s and N different bearings, and each bearing defines a different source–array configuration relative to the bathymetry and corresponds to a different set of replicas, to be calculated either through 3D or N × 2D modeling. Thus, bearing estimation can take place in the search space ( r s , z s ) × [ ϕ min , ϕ max ] with ϕ max ϕ min = 360 . To reduce calculations as much as possible, the VLA is considered to be always at the origin; the bathymetry is also corrected, so the bottom depth at the VLA corresponds to the tuned value indicated in Table 3. As shown in Figure 6a, this approach produces a butterfly-like shape when the Bartlett estimator is displayed in polar coordinates. The butterfly’s “wings” point in the directions where bearing estimation is more reliable, although the alignment of isobaths makes the estimation ambiguous. In the case of Figure 6a, the upper wing is aligned along ϕ u p 89 , while the lower wing aligns at a sort of antipode at ϕ d o w n 250 , which in fact has a higher Bartlett power. Thus, blind acceptance at this stage of the highest Bartlett would provide a source bearing, which deviates almost 180 from the true bearing. Similar results can be seen in Figure 6b,c; for Figure 6b, the wings tend to be wider, and the Bartlett curves practically overlap each other, while in Figure 6c, the wings are somehow between the two cases of the stationary sources but with a Bartlett power that increases as the source–array distance increases. Results for the moving source are remarkable because of the constant wing alignment, a feature of Figure 6c that is consistent with the description of source motion presented in Section 2.
While the Bartlett estimators shown in Figure 6 do not resolve source bearing, they drastically reduce the search space from ( r s , z s ) × [ ϕ min , ϕ max ] to ( r s , z s ) × [ ϕ u p ± δ ϕ ] [ ϕ d o w n ± δ ϕ ] . Since the error in the estimation of source depth can be expected to be much smaller than the error in source range, the strategy used to remove bearing ambiguity consisted in calculating additional replicas in the search space [ r s ± δ r ] × z s × [ ϕ u p ± δ ϕ ] [ ϕ d o w n ± δ ϕ ] , where δ r is to be chosen to be sufficiently “small”; a faulty choice of δ r can be detected when the localization result is found at one extreme of the search space. This strategy was applied to all files, and in each case it produced a “wing motion”, in which the estimator wings extend or contract as range changes (see Figure 7). Bearing ambiguity was removed in all cases by noticing that the region ϕ u p ± δ ϕ exhibits the highest Bartlett power at a range r * [ r s ± δ r ] and a bearing ϕ * [ ϕ u p ± δ ϕ ] .
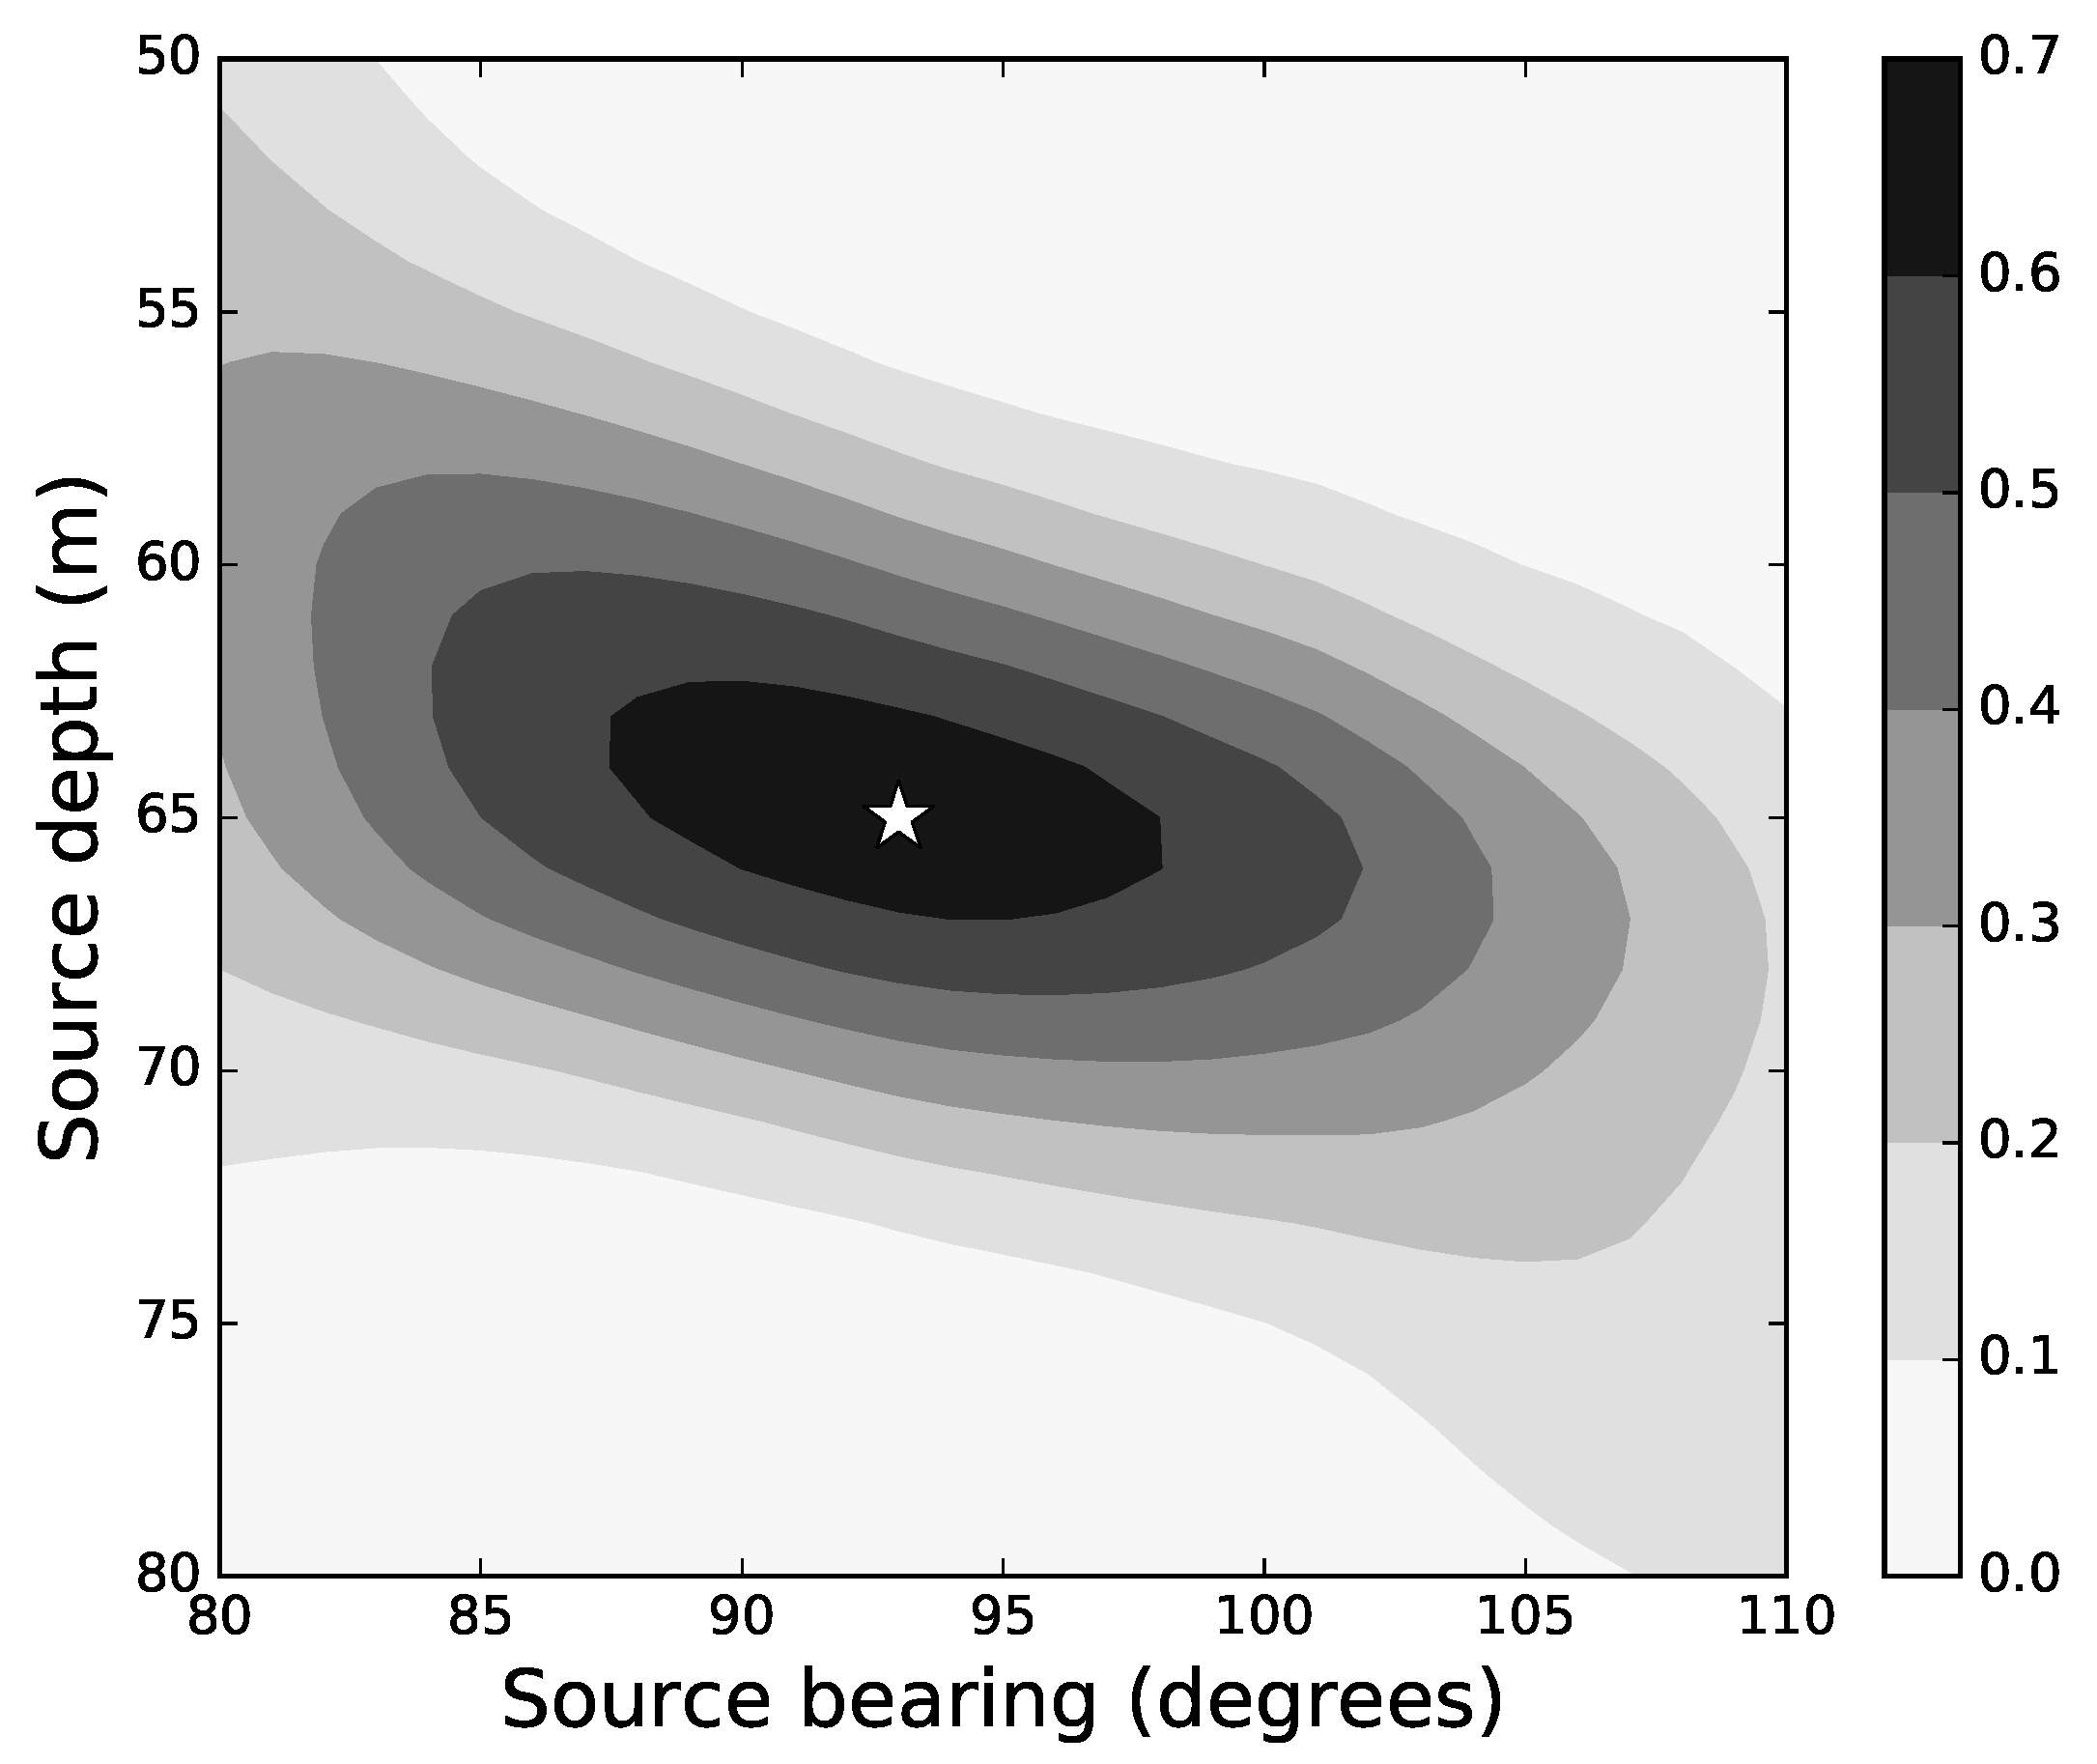
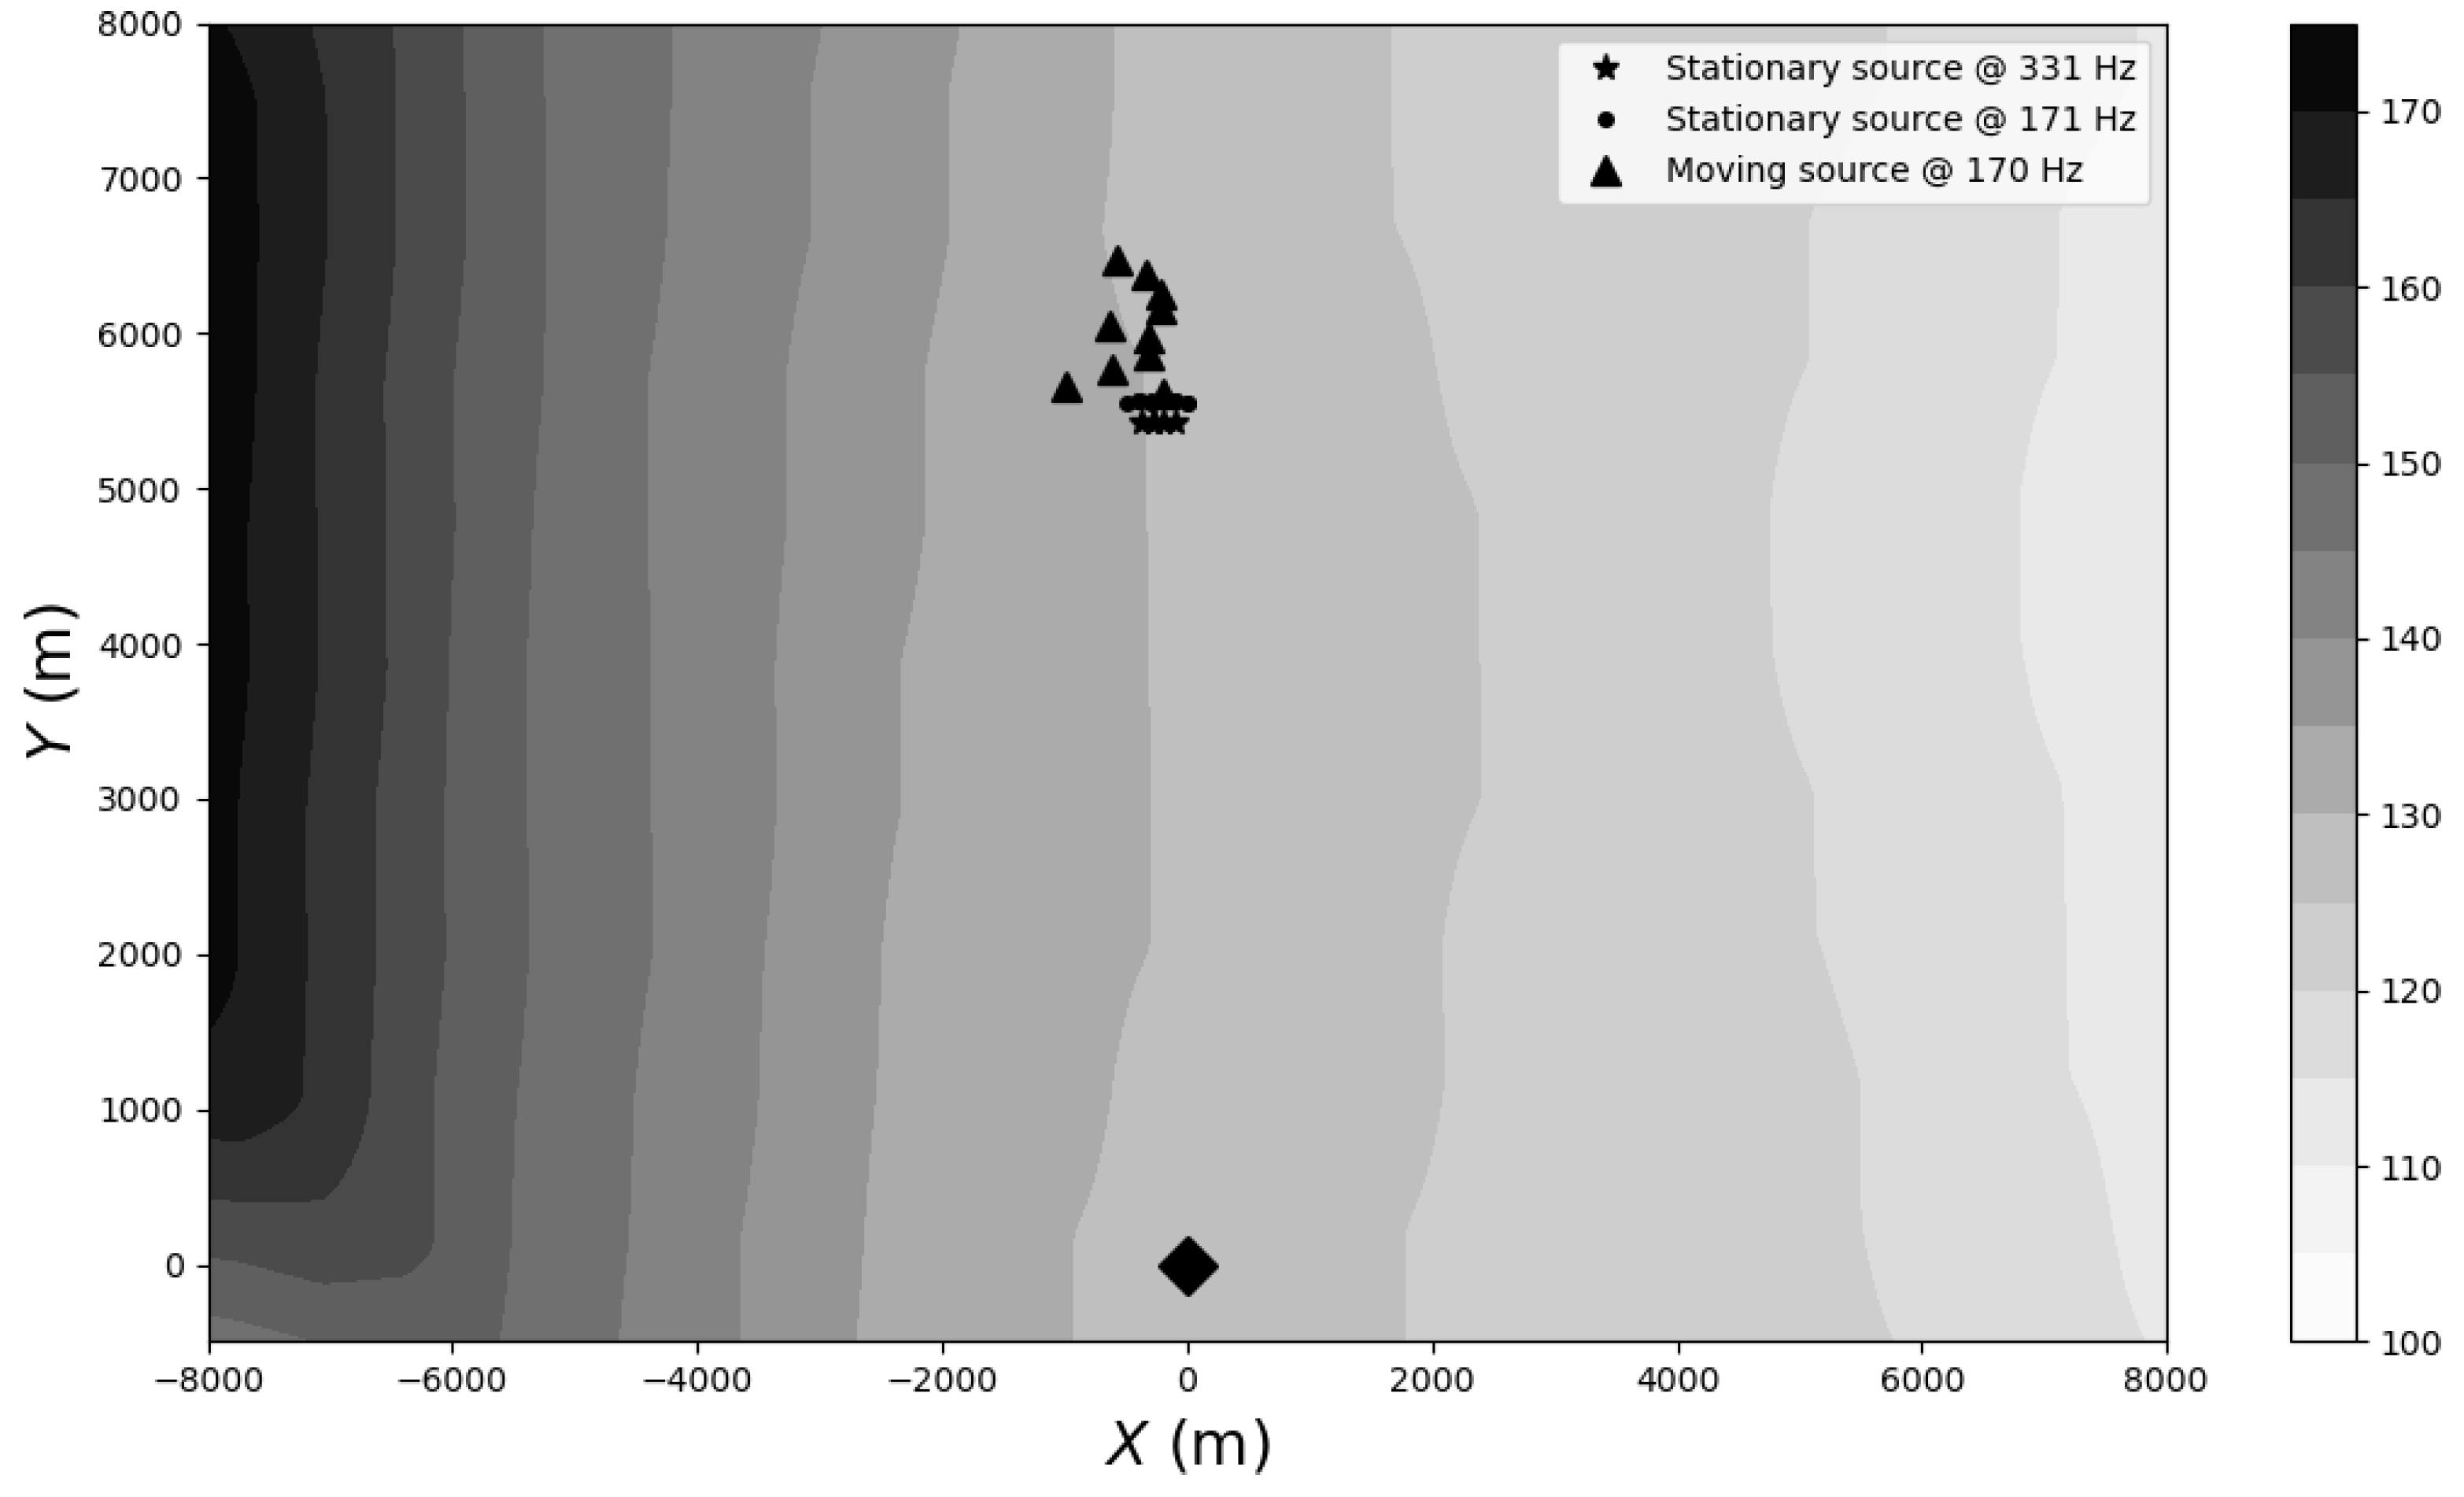
The wing motion provides a new estimate of source position, given by ( r * , z s , ϕ * ) ; the adoption of this result as final depends on the desired degree of accuracy. However, further refinement can proceed inside the search space given by [ r * ± δ r ] × [ z s ± δ z ] × [ ϕ * ± δ ϕ ] with a new set of small parameters ( δ r , δ z , δ ϕ ) , with the advantage that the calculation of replicas inside this search space is not computationally demanding; this provides the final 3D estimate of source position ( r , z , ϕ ) . For instance, for the stationary source at 331 Hz and file 1, it was found that ( r , z ) = ( 5435 , 65 ) m and ϕ = 93 (see Figure 8); this 3D estimate corrects r s by almost 60 m, has no effect on source depth, and provides a value for the source bearing close to the expected one. A summary of localization results at 331 Hz for all files is presented in Table 5; one can notice that all range and bearing estimates are now within the expected boundaries of range and bearing errors. Corresponding results for the other two cases are presented in Table 6 and Table 7; source positions over the ( X , Y ) plane are shown in Figure 9. Discretization values for range, depth, and bearing corresponded in all cases to 5 m, 1 m, and 1 , respectively. Unlike the results for the stationary source at 331 Hz, there are a few cases with bearing estimates outside the expected boundaries of error; this issue indicates perhaps that the assumption of a fixed VLA needs additional analysis.

4. Conclusions and Future Work

An approach to reduce the search space for the 3D localization and tracking of an acoustic source was proposed and tested on experimental data, with encouraging results. Critical to the success of this approach was the availability of a 2D initial guess, which was explored to determine a particular interval of source bearings; from this, it followed that the guess significantly reduced the search space of parameter combinations required to obtain the position of the source in a three-dimensional environment. Certainly, this guess cannot be expected to be available in all types of scenarios; this is an issue that will require further analysis considering additional sets of experimental data, particularly those in which out-of-plane propagation is known to be relevant. The broadband processing of acoustic receptions also needs to be considered, as well as replica calculations for a three-dimensional field of sound speed. Finally, the lack of navigational data does not allow us to determine the error of source localization and tracking; this issue is expected to be reviewed considering observations for which the geographical coordinates of the source are known. An association of the suggested approach with parallel processing and/or neural network architectures can be expected to speed up significantly the processing of acoustic data, which is required to locate an underwater source.

Author Contributions

Conceptualization, methodology and validation: O.C.R., L.Z. and X.C.; software: O.C.R. All authors have read and agreed to the published version of the manuscript.

Funding

This research received no external funding.

Data Availability Statement

Contact first author.

Acknowledgments

The authors are deeply grateful to the CMRE (former SACLANTCEN) for sharing online the experimental data, together with supporting MATLAB code for the calculation of the covariance matrix and relevant documentation of the 1993 Mediterranean Experiment.

Conflicts of Interest

The authors declare no conflict of interest.

References

  1. Bucker, H.P. Use of calculated sound fields and matched field detection to locate sound sources in shallow water. J. Acoust. Soc. Am. 1976, 59, 363–373. [Google Scholar] [CrossRef]
  2. Pierce, D.D. Matched Field Processing for Underwater Source Localization. Master’s Thesis, Naval Postgraduate School, Monterey, CA, USA, 1989. [Google Scholar]
  3. Porter, M.B. Simulations of Matched-Field Processing in a Deep-Water Pacific Environment. IEEE J. Ocean. Eng. 1987, 12, 173–181. [Google Scholar] [CrossRef] [Green Version]
  4. Westwood, E.K. Broadband matched-field source localization. J. Acoust. Soc. Am. 1992, 91, 2777–2789. [Google Scholar] [CrossRef] [Green Version]
  5. Gingras, D.; Gerstoft, P. Inversion for geometric parameters in shallow water: Experimental results. J. Acoust. Soc. Am. 1995, 97, 3589–3598. [Google Scholar] [CrossRef] [Green Version]
  6. Gerstoft, P.; Gingras, D. Parameter estimation using multifrequency range-dependent acoustic data in shallow water. J. Acoust. Soc. Am. 1996, 99, 2839–2850. [Google Scholar] [CrossRef]
  7. Soares, C.; Waldhorst, A.; Jesus, S.M. Matched Field Processing: Environmental focusing and source tracking with application to the North Elba data set. In Proceedings of the Oceans’99 MTS/IEEE Conference, Seattle, WA, USA, 13–16 September 1999; pp. 1598–1602. [Google Scholar]
  8. Michalopoulou, Z.-H.; Porter, M.B. Matched-Field Processing for Broad-Band Source Localization. IEEE J. Ocean. Eng. 1996, 21, 384–392. [Google Scholar] [CrossRef] [Green Version]
  9. Porter, M.B.; Jesus, S.M.; Stéphan, Y.; Démoulin, X.; Coelho, E. Single-phone source tracking in a variable environment. In Proceedings of the 4th European Conference on Underwater Acoustics, Rome, Italy, 21–25 September 1998; pp. 575–580. [Google Scholar]
  10. Jesus, S.; Porter, M.; Stéphan, Y.; Démoulin, X.; Rodríguez, O.C.; Coelho, E. Single hydrophone source localization. IEEE J. Ocean. Eng. 2000, 25, 337–346. [Google Scholar] [CrossRef] [Green Version]
  11. Perkins, J.S.; Kuperman, W.A. Environmental signal processing: Three-dimensional matched-field processing with a vertical array. J. Acoust. Soc. Am. 1990, 87, 1553–1556. [Google Scholar] [CrossRef]
  12. Porter, M. The KRAKEN Normal Mode Program; Technical Report; Saclant Undersea Research (memorandum): San Bartolomeo, Italy, 1991. [Google Scholar]
  13. Fawcett, J.A.; Yeremy, M.L.; Chapman, N.R. Matched-field source localization in a range-dependent environment. J. Acoust. Soc. Am. 1996, 99, 272–282. [Google Scholar] [CrossRef]
  14. Rodríguez, O.C.; Sturm, F.; Petrov, P.; Porter, M. Three-dimensional model benchmarking for cross-slope wedge propagation. In Proceedings of the 173rd Meeting of Acoustical Society of America and 8th Forum Acusticum, Boston, MA, USA, 25–29 June 2017. [Google Scholar]
  15. Available online: http://spib.linse.ufsc.br/sonar.html (accessed on 14 June 2023).
  16. Gingras, D.F. North Elba Sea Trial Summary; Technical Report; SACLANT Centre: La Spezia, Italy, 1994. [Google Scholar]
  17. Gerstoft, P. SAGA User Manual 3.0: An Inversion Software Package; Saclant Undersea Research Centre: La Spezia, Italy, 1999. [Google Scholar]
  18. Porter, M.; Tolstoy, A. The Matched Field Processing Benchmark Problems. J. Comput. Acoust. 1994, 2, 161–184. [Google Scholar] [CrossRef]
Figure 1. Bathymetry of the experimental site in cartesian coordinates, with the VLA (black diamond) placed at the origin; the black circle represents the stationary source position.
Signals 04 00025 g001
Figure 2. Scheme of bottom properties.
Signals 04 00025 g002
Figure 3. Sound speed profile used for localization and tracking.
Signals 04 00025 g003
Figure 4. Modes 1 to 4 at 171 Hz (continuous line: real part; dashed line: imaginary part).
Signals 04 00025 g004
Figure 5. Bartlett estimator of the 2D initial guess for (a) the stationary source at 331 Hz, ifile = 1, (b) the moving source at 170 Hz, ifile = 1. In both cases, the asterisk indicates the position of the source.
Signals 04 00025 g005
Figure 6. B ( r s , z s , ϕ ) calculated with the KRAKEN model and N × 2D modeling: (a) stationary source at 331 Hz, all 5 files; (b) stationary source at 171 Hz, file 1 (the shape is identical for the remaining files); (c) moving source at 170 Hz, even files only.
Signals 04 00025 g006
Figure 7. Wing “motion” for the stationary source at 331 Hz, file 4: the Bartlett power moves from the left to the right, starting at 5370 m and ending at 5440 m, with a step of 5 m. The highest power is obtained at ϕ * = 92 and r * = 5425 m.
Signals 04 00025 g007
Figure 8. Slice of B ^ ( r , z , ϕ ) at r = 5435 m for the stationary source at 331 Hz, file 1, with the start marking the source position at z = 65 m and ϕ = 93 .
Signals 04 00025 g008
Figure 9. Cartesian coordinates for source localization and tracking.
Signals 04 00025 g009
Table 1. Source ballast and VLA GPS positions.
Latitude (Degrees)Longitude (Degrees)
Source4306.01 N1009.91 E
VLA4302.86 N1010.01 E
Table 2. Bottom model properties.
PropertyValueUnits
water depth128.9m
layer thickness3.3m
layer density ρ 2.0g/cm3
layer initial compressional speed c p 1505m/s
layer final compressional speed c p 1556m/s
layer attenuation α p 0.11dB/ λ
half space density ρ 1.06g/cm3
half space compressional speed c p 1556m/s
half space attenuation α p 0.18dB/ λ
Table 3. Tuned parameters.
SignalSourceWater Depth (m)Frequency (Hz)
RM2Stationary129331
RM5Stationary129.2171
RM5Moving128.3170
Table 4. Two-dimensional initial guess.
SourceFrequency (Hz)File ( r s , z s ) (m)
Stationary3311–5(5380, 64)
Stationary1711–4(5530, 75)
Stationary1715–10(5530, 74)
Moving1701(5590, 73)
Moving1702(5650, 67)
Moving1703(5710, 64)
Moving1704(5800, 64)
Moving1705(5890, 63)
Moving1706(5980, 65)
Moving1707(6130, 65)
Moving1708(6190, 64)
Moving1709(6310, 62)
Moving17010(6400, 62)
Table 5. Stationary source at 331 Hz, localization results.
FileRange (m)Depth (m)Bearing (Degrees)
154356593
254356593
354206491
454356594
554256492
Table 6. Stationary source at 171 Hz, localization results.
FileRange (m)Depth (m)Bearing (Degrees)
155657693
255707693
355757694
455757694
555657591
655557590
755557590
855607591
955807695
1055807694
Table 7. Moving source at 170 Hz, tracking results.
FileRange (m)Depth (m)Bearing (Degrees)
156207392
2575069100
357956596
458656593
559806493
660806696
761706592
862656492
963906293
1065006395
Disclaimer/Publisher’s Note: The statements, opinions and data contained in all publications are solely those of the individual author(s) and contributor(s) and not of MDPI and/or the editor(s). MDPI and/or the editor(s) disclaim responsibility for any injury to people or property resulting from any ideas, methods, instructions or products referred to in the content.