Article

Omnidirectional Haptic Guidance for the Hearing Impaired to Track Sound Sources

by
Ryuichi Shimoyama
Department of Electrical and Electronic Engineering, College of Industrial Technology, Nihon University, Tsudanuma 275-8575, Japan
Signals 2021, 2(3), 490-507; https://doi.org/10.3390/signals2030030
Submission received: 10 March 2021 / Revised: 21 June 2021 / Accepted: 22 July 2021 / Published: 6 August 2021

Abstract

:
We developed a hearing assistance system that enables hearing-impaired people to track the horizontal movement of a single sound source. The movement of the sound source is presented to the subject by vibrating vibrators on both shoulders according to the distance to and direction of the sound source, which are estimated from the acoustic signals detected by microphones attached to both ears. We presented the direction of and distance to the sound source to the subject by changing the ratio of the intensity of the two vibrators according to the direction and by increasing the intensity the closer the person got to the sound source. The subject could recognize the approaching sound source as a change in the vibration intensity by turning their face in the direction where the intensity of both vibrators was equal. The direction of the moving sound source can be tracked with an accuracy of less than 5° when an analog vibration pattern is added to indicate the direction of the sound source. By presenting the direction of the sound source with high accuracy, it is possible to show subjects the approach and departure of a sound source.

1. Introduction

We use our five senses to grasp our surroundings, and it is said that vision accounts for about 90% of the information we receive. However, it is thought that people use auditory information to compensate for information that cannot be confirmed visually because it is hidden to the side, behind, or in the shadows. For example, when we cross a road at dusk or at night, when visibility is limited, and a stopped vehicle suddenly moves or turns at an intersection and suddenly comes into view, visual information alone is not enough to quickly detect it; auditory information is also required. When crossing the road, we often unconsciously turn our head in the direction of the sound of the vehicle. Due to the anxiety caused by auditory information alone, we may turn our face to reconfirm the sound source visually.
On the other hand, hearing-impaired (deaf) people and young people who walk around with earphones listening to music at high volume may not be able to hear the sounds around them, which is assumed to increase the risk of experiencing traffic accidents. Hearing dogs play a role in supporting the daily lives of the hearing impaired. Indoors, they listen to various sounds such as ringing telephones, doorbells, boiling kettles, fire alarms, and human voices on behalf of hearing-impaired people; communicate what the sounds are; and lead them to respond appropriately. A hearing dog does not convey detailed information about the sound source but merely attracts the person’s attention through direct contact or special behavior. It is assumed that the hearing-impaired person, given simple information by the dog, knows what action to take after visually confirming the situation.
In this study, we focus on auditory support for the hearing impaired to cross roads safely. The purpose of this study was to develop a hearing assistance system that can detect the location of vehicles on roads and to present it to people. In order to confirm that a vehicle is approaching on the road, it is necessary to continuously track the position of the sound source. If we can develop a hearing assistance system that detects sounds with a microphone, identifies the sound source, and notifies the user of its location, we can improve the quality of life for the hearing impaired. Some basic ideas and technologies related to this system are described below.
Devices that convert sound characteristics into patterns of vibrating tactile stimuli have been proposed as a way for the hearing impaired to understand their acoustic environment [1,2,3,4,5,6,7,8,9,10,11,12,13]. In pioneering work in this field, Bekesy (1955, 1959) created two artificial cochleae and fixed them to a subject’s forearms [1,2]. The sound generated by loudspeakers drove two spatially separated microphones, in which the output was amplified to operate the two artificial cochleae, which vibrated on the subject’s arms. As a result, the subject was able to accurately determine the direction of the sound. Bekesy reported that auditory sound source localization depends only on the difference in intensity of sounds. Richardson et al. (1979) reported that, by transmitting sound information through vibration on the skin, subjects can estimate the distance to and direction of the sound source at the same time [4]. They supported Bekesy’s claim by pointing out that sound localization by vibration based on differences in intensity is better than that based on phase or time differences. Frost et al. (1976) showed that tactile localization of a sound source is possible with accuracy comparable to that of normal hearing, that a moving sound source can be tracked, and that attention can be selectively directed by tactile sensation [5]. It has also been reported that people with cochlear implants can track moving sound sources [6]. The distance and direction to the sound source, which are higher-order information from the perceived tactile stimuli, are left to the subject’s own judgment. The subject learns the pattern of the tactile stimuli and makes a correspondence to the acoustic environment. With a certain amount of training, it is possible not only to localize a sound source but also to track and selectively pay attention to it.
On the other hand, no robot can act like a hearing dog, but many elemental technologies have been proposed to realize the function of assisting a disabled person after determining their acoustic environment. Many studies have been reported on the use of microphone array systems for sound source localization, estimation of the trajectory of moving sound sources, and sound source tracking [14,15,16]. A microphone array system consists of many microphones placed far apart, which makes the overall size of the array unsuitable for mobile platforms and places a heavy computational load on the computer. Argentieri et al. listed the following four constraints that are required for mobile platforms [17]: (1) geometric constraints: there must be a trade-off between the combined size of all sensors and the performance of the platform in motion; (2) real-time constraints: short processing time should be guaranteed; (3) wide frequency bands: the computer must be able to process at high speed; and (4) environmental constraints: they must be operable in dynamic and unpredictable environments. Microphone array systems violate constraints 1, 2, and 3. Acoustic processing using binaural microphones that can be easily mounted on a mobile platform and at least satisfy constraint 1 is known, and there are many reports on sound source localization, detection of multiple sound sources, and tracking of moving sound sources [17,18,19,20,21,22,23,24]. By mounting the microphones on a mobile platform, their orientation can change. This is used for acoustic processing in active audition [18].
In this study, we used an ear microphone that is easy to wear and to fix. When a hearing-impaired person wearing an ear microphone moves his or her head, the direction of the microphone changes. Active audition is often installed in moving robots, and tracking of moving sound sources by robots has been reported [24]. An algorithm should be adopted that satisfies all of the above constraints among the algorithms that use such computers to localize and track moving sound sources.
Let us assume that the location of the sound source can be estimated by a computer. Then, how can we convey this information to someone who is hearing impaired? Various methods of presenting the information have been proposed [25,26,27,28,29,30,31,32]. Presenting information on a cell phone screen is the easiest and most convenient way. However, visual communication is not appropriate as a human–machine interface in this case because hearing-impaired people use their vision to understand their surroundings. Ross et al. (2000) proposed a method of using a 3 × 3 array of vibrators on a visually impaired person’s back to indicate the direction of walking by changing the waving pattern [26]. Nine vibrators are heavy, and it is difficult to gather all of them close together. A tactile display using piezoelectric elements was developed [27], Khin et al. proposed a soft tactile actuator that can be assembled [31], and Ontenna, a hearing aid for the deaf, is a hairpin-type device that can convert sound intensity into light or vibration intensity [32].
Haptic interfaces are also used in visual aids for the visually impaired [33,34,35,36,37,38]. In addition to skin stimulation by physical vibration, electrical stimulation of muscles has been proposed as a tactile stimulus [33]. There are proposals to show walking routes to visually impaired persons while avoiding obstacles in the road detected by ultrasonic sensors and to give instructions for a walking route by referring to GPS location information and a map [36,37,38]. In these examples, a computer determines the walking direction of the visually impaired person by using obstacles in front and the position of the person detected by sensors and conveys the direction to the person by tactile stimuli. A tactile stimulus is more easily transmitted when it is applied to the skin, which has high sensory sensitivity, but it is not suitable for long-term use because direct stimulation of the skin tends to cause abrasions. The authors previously proposed a wearable hearing assistance system that estimates the direction of a sound source by computer from acoustic signals detected by ear microphones and notifies the person of the direction of the sound source by vibrators attached to the shoulders [39].
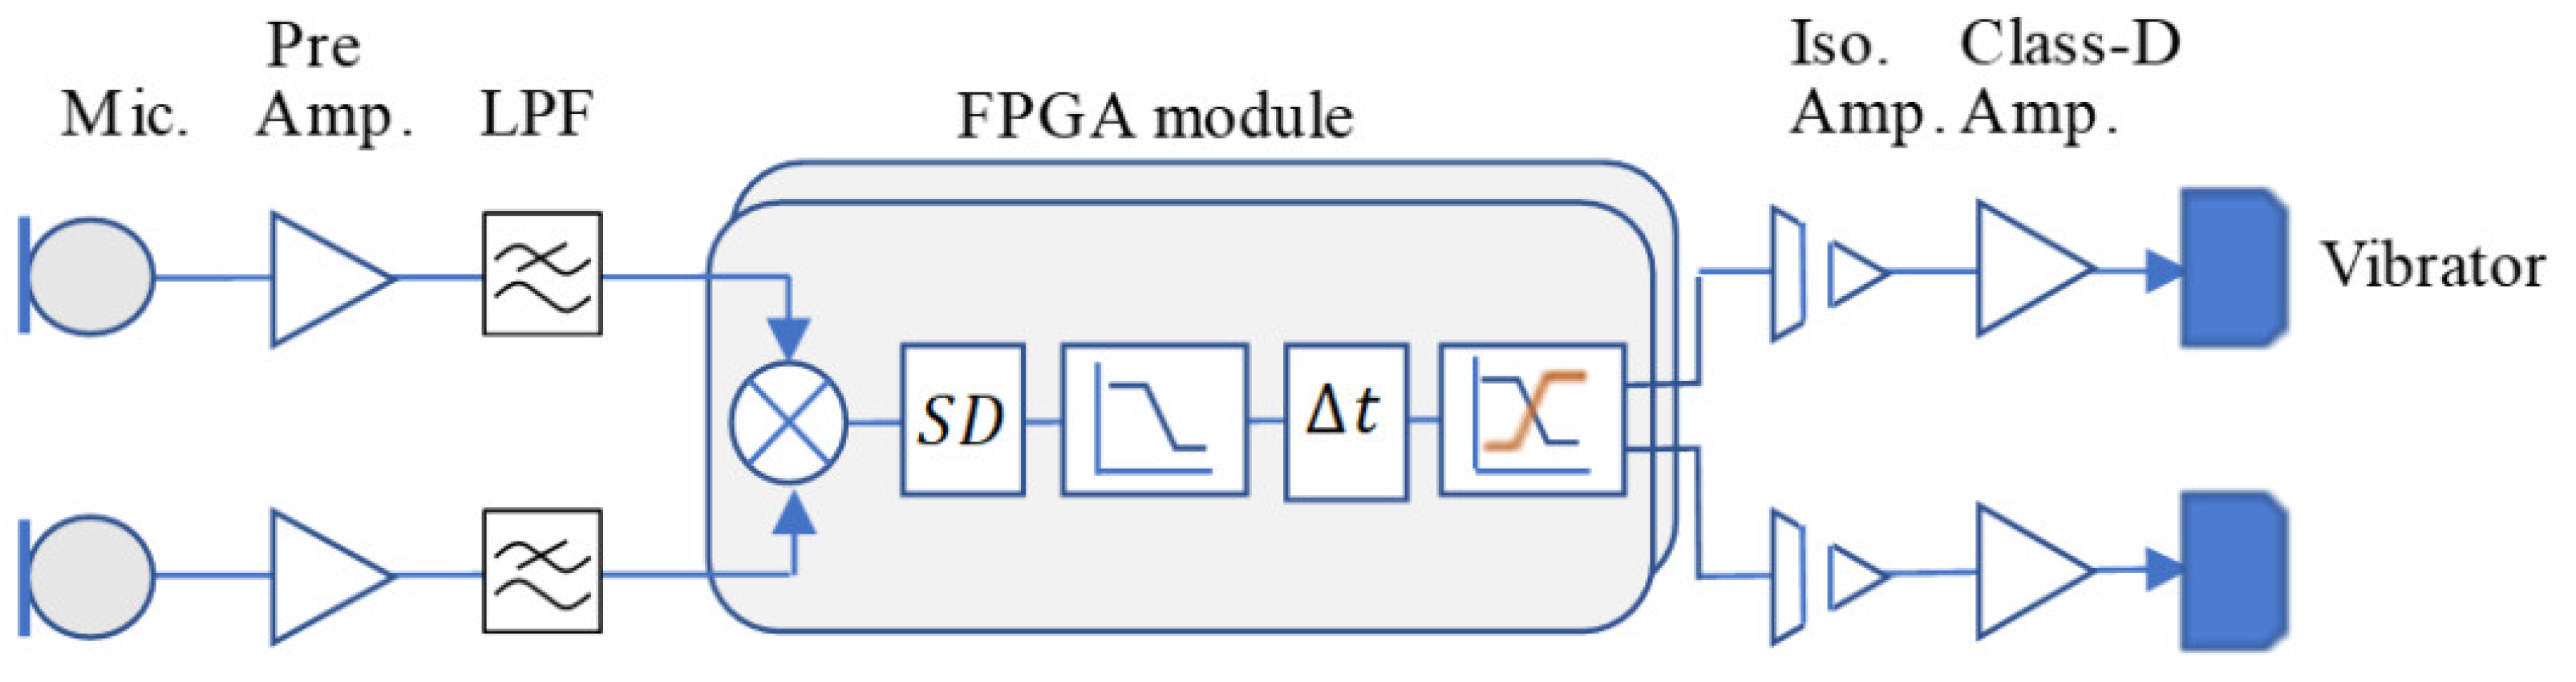
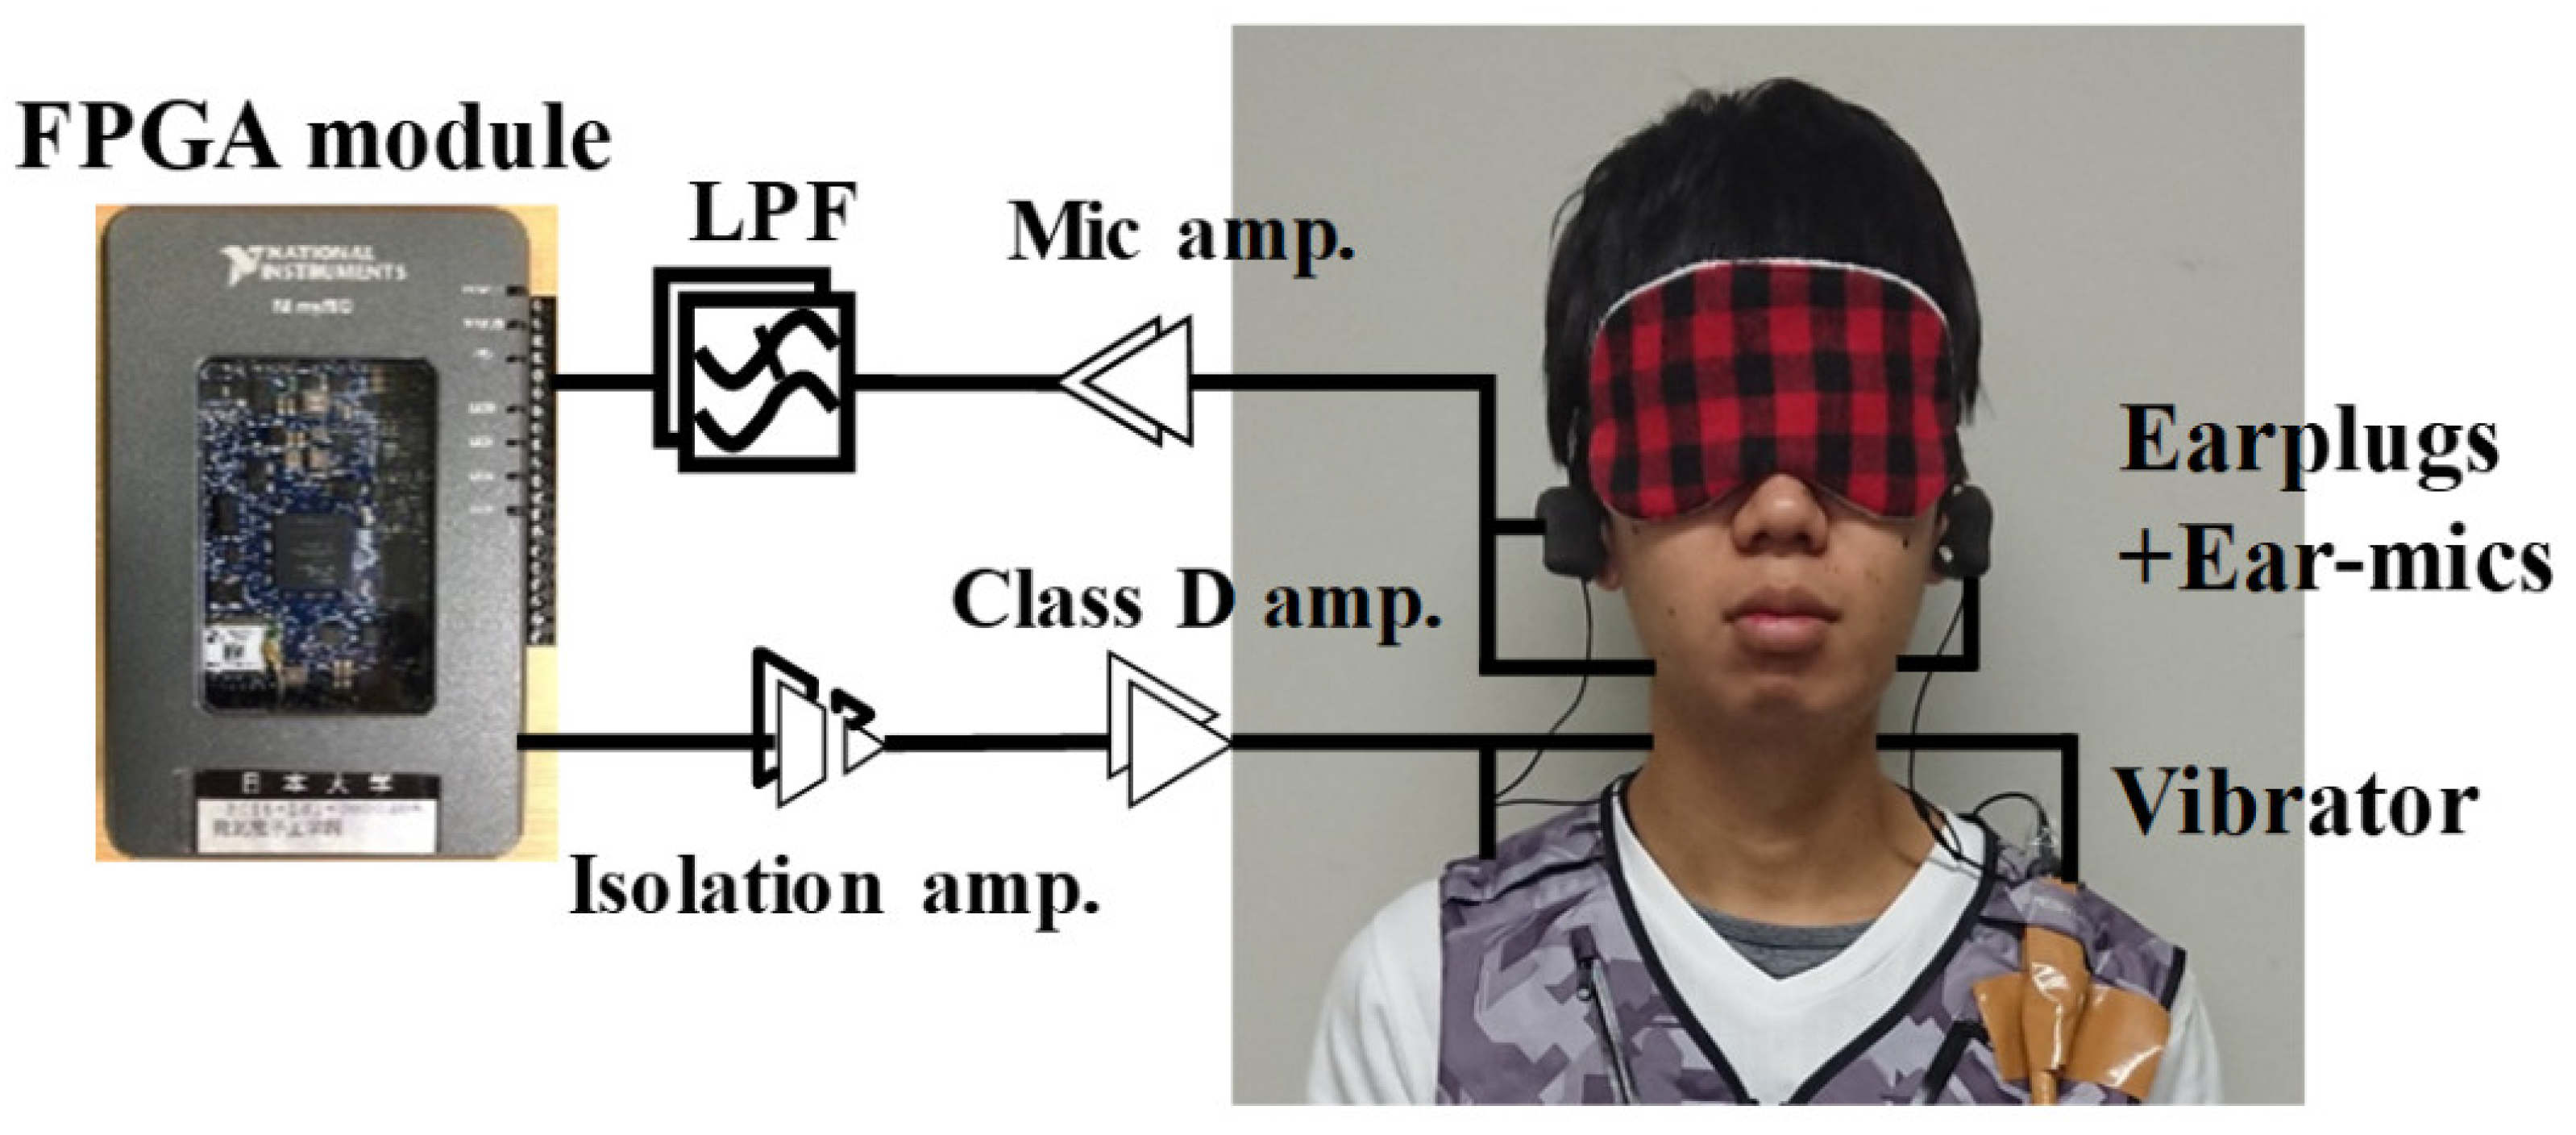
In this study, we modified the previous hearing assistance system so that it can present not only the direction of the sound source but also the distance to the source. The system presents the horizontal movement of the sound source to the person through the vibrators on both shoulders according to the distance to and direction of the sound source estimated from the acoustic signals detected by the ear microphones. Two small speaker drivers attached to a vest are used as vibrators so that they can be worn on top outdoors. The ratio of the vibration intensity of the two vibrators varies according to the angle of the sound source: the closer to the sound source, the stronger the vibration intensity, thereby presenting the relative angle of and distance to the sound source to the person. By turning their face in the direction where the vibration intensity on both shoulders is equal, the person can perceive the approach of the sound source as a change in vibration intensity. We conducted an experiment in which a subject wearing an eye mask and the hearing assistance system tracked a single sound source. The system can track the direction of a moving sound source with an accuracy of less than 5° by adding an analog vibration pattern to the direction of the sound source. By presenting the direction of the sound source with high accuracy, it is possible to show the approach and departure of the sound source to the subject.
Section 2 describes the methods. Section 3 describes the configuration of the hearing assistance system, the structure, vibration characteristics of the vibrators, which can be used outdoors and a flowchart including the subject’s behavior. Section 4 describes the tracking of a moving sound source by a subject wearing the system. Section 5 describes the discussion. Finally, the conclusions and future plans are provided.

2. Methods

2.1. Estimation Method of Short-Time Interaural Time Difference in Sound Pressure

The direction of the sound source was estimated by using the arrival time difference between the two ears. The interaural time difference (ITD) between the ears was calculated from the short-time interaural phase difference of sound pressure [39]. In this section, we briefly explain the estimation method.
First, let us explain the ambiguity of the phase difference of sound pressure. A schematic diagram of the pressure waveforms detected by the left and right microphones is shown in Figure 1. Comparing the phases of the two sound pressure waveforms, the left waveform is delayed by Δ φ compared to the right waveform, suggesting that the phase difference is Δ φ . However, the left waveform is also considered delayed by Δ φ + 2 π due to the periodicity of the waveform. This means that there are multiple phase differences to be defined and the phase difference can generally be expressed as Δ φ + 2 n π , where n is an arbitrary integer. This is known as the ambiguity of the phase difference of sound pressure. Since there are multiple short-time interaural phase differences of sound pressure, there are also multiple ITDs, and therefore, the direction of a sound source cannot be estimated accurately.
Next, we describe a method for estimating the true short-time interaural time difference from the ambiguous difference using acoustic signals detected by two microphone systems. The short-time interaural phase difference of sound pressure at frequency f i , Δ φ n i is as follows:
Δ φ n i = X L ( f i ) X R ( f i ) + 2 π n i ( f i ) ,
where X L ( f i ) and X R ( f i ) are the spectra obtained by the discrete Fourier transform (DFT) of the two time functions x L ( t ) and x R ( t ) , respectively, and n i ( f i ) . is an integer that is a function of frequency. The interaural time difference Δ t n i is as follows:
Δ t n i = Δ φ n i 2 π f i .
Due to the ambiguity of phase differences, multiple interaural time differences can be calculated for any given value of integer n at any given frequency. However, the direction of sound arriving from a single fixed source should be constant, independent of frequency. Therefore, in the histogram of the interaural time difference, the ∆t where the evaluation function shown in Equation (3) is the maximum obtained, and this is regarded as the true interaural time difference.
L ( Δ t ) = n i Δ t n i
Figure 2a shows an example of the frequency response of the interaural time difference when the sound source is located at 140° behind and to the left. Many streak patterns are seen, and multiple interaural time differences are displayed. Figure 2b shows the corresponding histogram. In this example, the interaural time difference is ∆t, where the evaluation function is the maximum. In this example, the time difference between the two ears is 360 μs.

2.2. Relationship between Interaural Time Difference and Source Direction

The relationship between the interaural time difference and the direction of the sound source was determined by experiment. In order to measure the sound source direction accurately, the experiment was conducted using a binaural head–torso simulator instead of a human subject. The loudspeaker was fixed at a distance of 2 m from the head–torso simulator, and the direction of the simulator was changed to measure the interaural time difference. The relationship between the interaural time difference and the sound source direction is shown in Figure 3.
When the interaural time difference was 0 μs, the source direction was considered 0°. It can be seen that the interaural time difference increases in proportion to the source direction. Using this relationship, we can estimate the source direction from the interaural time difference. When a robot’s head is mechanically rotated, it is preferable to calculate the angle at which it should be rotated, but when a person’s head is pointed in the direction of the sound source, as in this study, even if the person is told the angle, they cannot rotate their head accurately. Therefore, a relationship such as the one shown in Figure 3 is not necessary; it is sufficient to convert the time difference between the two ears, which has a one-to-one relationship with the direction of the sound source, into the intensity of the vibrations of the vibrator.

2.3. Relationship between Mean Standard Deviation and Distance to Sound Source

The distance to a sound source was estimated by using the variation of the frequency response of the short-term interaural phase difference of sound pressure. This section describes a method for evaluating the variation of the frequency response of the short-time interaural phase difference of sound pressure [40]. Let us explain its method briefly. In the frequency characteristics of the short-time interaural phase difference shown in Figure 4a, the amount of data included in frequency band Δ f near center frequency f i is 2 m + 1 , and the phase difference at center frequency f i is φ i . If the average value of the phase difference within Δ f is φ ¯ i , the standard deviation ρ i is expressed by Equation (4):
ρ i = 1 2 m + 1 j = i m i + m ( φ j φ ¯ i ) 2
If we calculate the standard deviation of the data in frequency band Δ f while changing center frequency f i , we can obtain the frequency characteristics of the standard deviation, as shown in Figure 4b. The average value of the standard deviation within frequency band Δ F , where the standard deviation value fluctuates relatively with the distance to the sound source, was used to evaluate the variation. The relationship between the mean value of the standard deviation and the distance to the sound source was obtained experimentally, and then the distance to the sound source was estimated from the standard deviation value using Figure 5. For example, when the mean value of the standard deviation is 65°, the estimated distance is about 2.4 m.
Shimoyama et al. (2019) reported that the average value of this standard deviation depends on the direction of the sound source [41]. Let us briefly touch on this here. The directional characteristics of the mean standard deviation are shown in Figure 6. The radial axis is the mean value of the standard deviation (in degrees). It can be seen that this value is relatively low when the sound source is located either directly in front (180°) or directly behind (0°), and it becomes higher as the sound source locates to the side. The farther to the side the sound source is located, the more difficult it is to detect the distance, because the mean value of the standard deviation changes little even when the distance to the sound source changes and the dynamic range becomes narrower. To estimate the change in distance to the sound source, the direction of the sound source should be fixed, for example, directly in front or directly behind, where the dynamic range is large. This feature is one of the reasons for tracking the sound source in Section 4 below.

3. System Configuration and Procedure

3.1. System Configuration

The configuration and appearance of the hearing assist system are shown in Figure 7 and Figure 8, respectively. The acoustic signal detected by the ear microphone (MDR-EX31BN, Sony) is amplified by the microphone amplifier and input to the FPGA module (myRIO-1900, N.I.) through the LPF. The LPF is used to remove aliasing noise. The sound played back through the loudspeakers in this study was a motorcycle engine. The principal components in this sound are distributed in a frequency range of 1 to 5 kHz. In order to detect the sound generated by a vehicle on the road from a distance, the cutoff frequency was set at 6.07 kHz because sound with a relatively low frequency that can easily propagate far is the target of detection. The sampling frequency was set at 15.4 kHz. To shorten the processing time, the distance to the sound source and the direction of the sound source were estimated by separate FPGA modules; then, the vibrators on both shoulders were activated. The two FPGA modules were synchronized in operation. An isolation amplifier was provided to prevent the output signal to the vibrators from interfering with the input signal. The analog signal output of the module was amplified by a class D amplifier and input to the vibrator. The gain of the class D amplifier is adjustable, in case the subject feels pain or cannot perceive the vibration. Therefore, the subject perceives changes in the intensity of the vibration rather than the absolute value of the intensity. The subject’s appearance is shown in Figure 8. The subject was a 21-year-old man with normal hearing, who wore earplugs in both ears and an ear microphone. The sound level was turned down until he could no longer hear it. To avoid visual effects, he wore an eye mask. He was instructed to turn his face in the direction where the vibration intensity of the vibrators on both shoulders was equal.

3.2. Vibrators and Vibration Characteristics

This section describes the structure and vibration characteristics of the vibrator, which is used to convey information about the direction and distance of the sound source to the user. The vibrator is not in direct contact with the skin and is designed to work even when the user wears layers of clothing outdoors, or thick clothing. For the vibrator, we used a speaker driver with a diameter of about 3 cm, from which the frame and cone of the small loudspeaker were removed (Figure 9a). A plastic plate was glued to the speaker driver so that the vibration could be transmitted easily. The speaker drivers were driven by the analog signal output terminal of the FPGA module through an isolation amplifier and a class D power amplifier. Two vibrators were attached on the back of a vest, as shown in Figure 9b. The relationship between the input voltage of the vibrator and the vibration amplitude of the plastic plate is shown in Figure 10. The vibration amplitude of the plastic was measured with a laser displacement meter (LK-G35, Keyence). The resolution of the laser displacement meter was 0.05 μm. It can be seen that the vibration amplitude increased almost in proportion to the input voltage. The vibration of the vibrators can be easily perceived even when wearing layers of clothing outdoors. The class D amplifier shown in Figure 7 and Figure 8 has an adjustable gain, and if the user feels pain or cannot perceive the vibrations, the gain of the amplifier can be adjusted. Therefore, the user perceives variation of vibration relatively but absolutely, since humans have logarithmic sensitivity.

3.3. Driving the Vibrator Using the Interaural Time Difference

As shown in Figure 3, if the sign of the time difference between the two ears is positive, the sound source is located on the left side of the user, and if it is negative, it is located on the right side. The larger the time difference, the larger the angle of the sound source. How should we convey this information to the user by vibrating the vibrator? Figure 11 shows the relationship of the time difference between the two ears and the X-shaped voltage output from the FPGA module to the left and right vibrators. Different voltages are output to the two vibrators depending on the time difference between the two ears. When the time difference between the ears is 0 μs, the output voltage to the vibrators is equal. When the time difference between the ears is +150 μs, the sound source is located on the left side of the subject, so the vibration intensity of the left vibrator is increased so that the output voltage to the right and left vibrators is 1:3. In other words, when the sound source is located on the right side, the right vibrator is vibrated more strongly, and when it is located on the left side, the left vibrator is vibrated more strongly. Note that both vibrators are always vibrating during the sound. In Figure 11, the output voltage to the vibrator on the left side is increased proportional to the time difference between the ears, while it is decreased inversely on the right side. In this way, the subject can know the direction of the sound source through the vibrations of both vibrators because the ratio of the vibration intensity of the two vibrators changes continuously according to the value of the interaural time difference. The output voltage to the vibrators was assumed to change linearly in the range of −300 to +300 μs in the time difference between the ears and to be constant otherwise. The narrower the range of the linearly varying time difference, the more the ratio of vibration intensity of the vibrators changes, so further study of the user’s reaction speed may be necessary.

3.4. Driving the Vibrator Using the Mean of the Standard Deviation

We mentioned in Section 2.3 that, the farther the sound source, the more the frequency response of the interaural phase difference of the sound pressure measured in the room will vary (Figure 5). When the degree of variation along the frequency axis of the interaural phase difference is expressed as the mean value of the standard deviation, that value increases almost in proportion to the distance to the sound source. Using this relationship, we can estimate the distance from the interaural phase difference of sound pressure measured indoors. However, this difference depends on the direction of the sound source and has directivity (Figure 6). It is maximum in the direction of 90° from the user and minimum in the front–back direction. Therefore, the relationship described in Figure 5 requires that the direction of the sound source be kept constant. In general, it is difficult to satisfy such a condition. Thus, we can estimate the motion of the sound source by estimating the distance to the sound source with it always in front of our face. If we always keep the sound source in front of our face, we can tell whether the source is approaching or moving away. Therefore, if the user can always face the direction of the sound source while wearing vibrators driven by the time difference between the two ears, as described in the previous section, it is possible to provide the user with information about the distance to the sound source. In this study, information about the distance is also transmitted by changing the vibration intensity of the left and right vibrators.
Figure 12 shows the relationship between the average value of the standard deviation and the output voltage of the vibrators. The smaller the mean value of the standard deviation (the closer to the sound source), the stronger the vibration intensity. The range of the mean value of the standard deviation that causes the output voltage to change linearly is 40 to 70°. When the average value of the standard deviation is 40°, the coefficient value is multiplied by 1, and when it is 70°, the coefficient value is multiplied by 0.25. If we convert this standard deviation value into distance, it covers a range of 1.2 to 2.8 m (Figure 5). The left and right output voltages are multiplied by the same factor.

3.5. Procedures

A flowchart of the hearing assistance system including the subject’s movement (colored) is shown in Figure 13. If the voltage of the acoustic signal on one side of the ear microphone is less than the threshold value ( V t h ), we return to the beginning and repeat the signal detection. If the voltage exceeds the threshold value, we proceed to the next step. The threshold value is adjusted so that it is not affected by external noise. Acoustic signals are detected by the ear microphone, and the phase difference between the two ears is calculated for a short time. From this phase difference, we calculate the short-time interaural time difference and change the ratio of the vibration intensity of the two vibrators according to the direction of the sound source. In parallel with this process, we calculate the average value of the standard deviation of the variation of the short-time interaural phase difference along the frequency, and the vibration intensity of both shoulder vibrators is changed correspondingly. The subject was instructed to turn his face in the direction where the vibration intensity of both vibrators was equal. If the subject felt that the vibration intensity on the left shoulder was stronger, he turned his face to the left, and similarly for the right shoulder. This flowchart does not have a stop condition, as people always listen to sounds to make decisions. As long as the power is on, the system continues to detect sounds.

4. Results

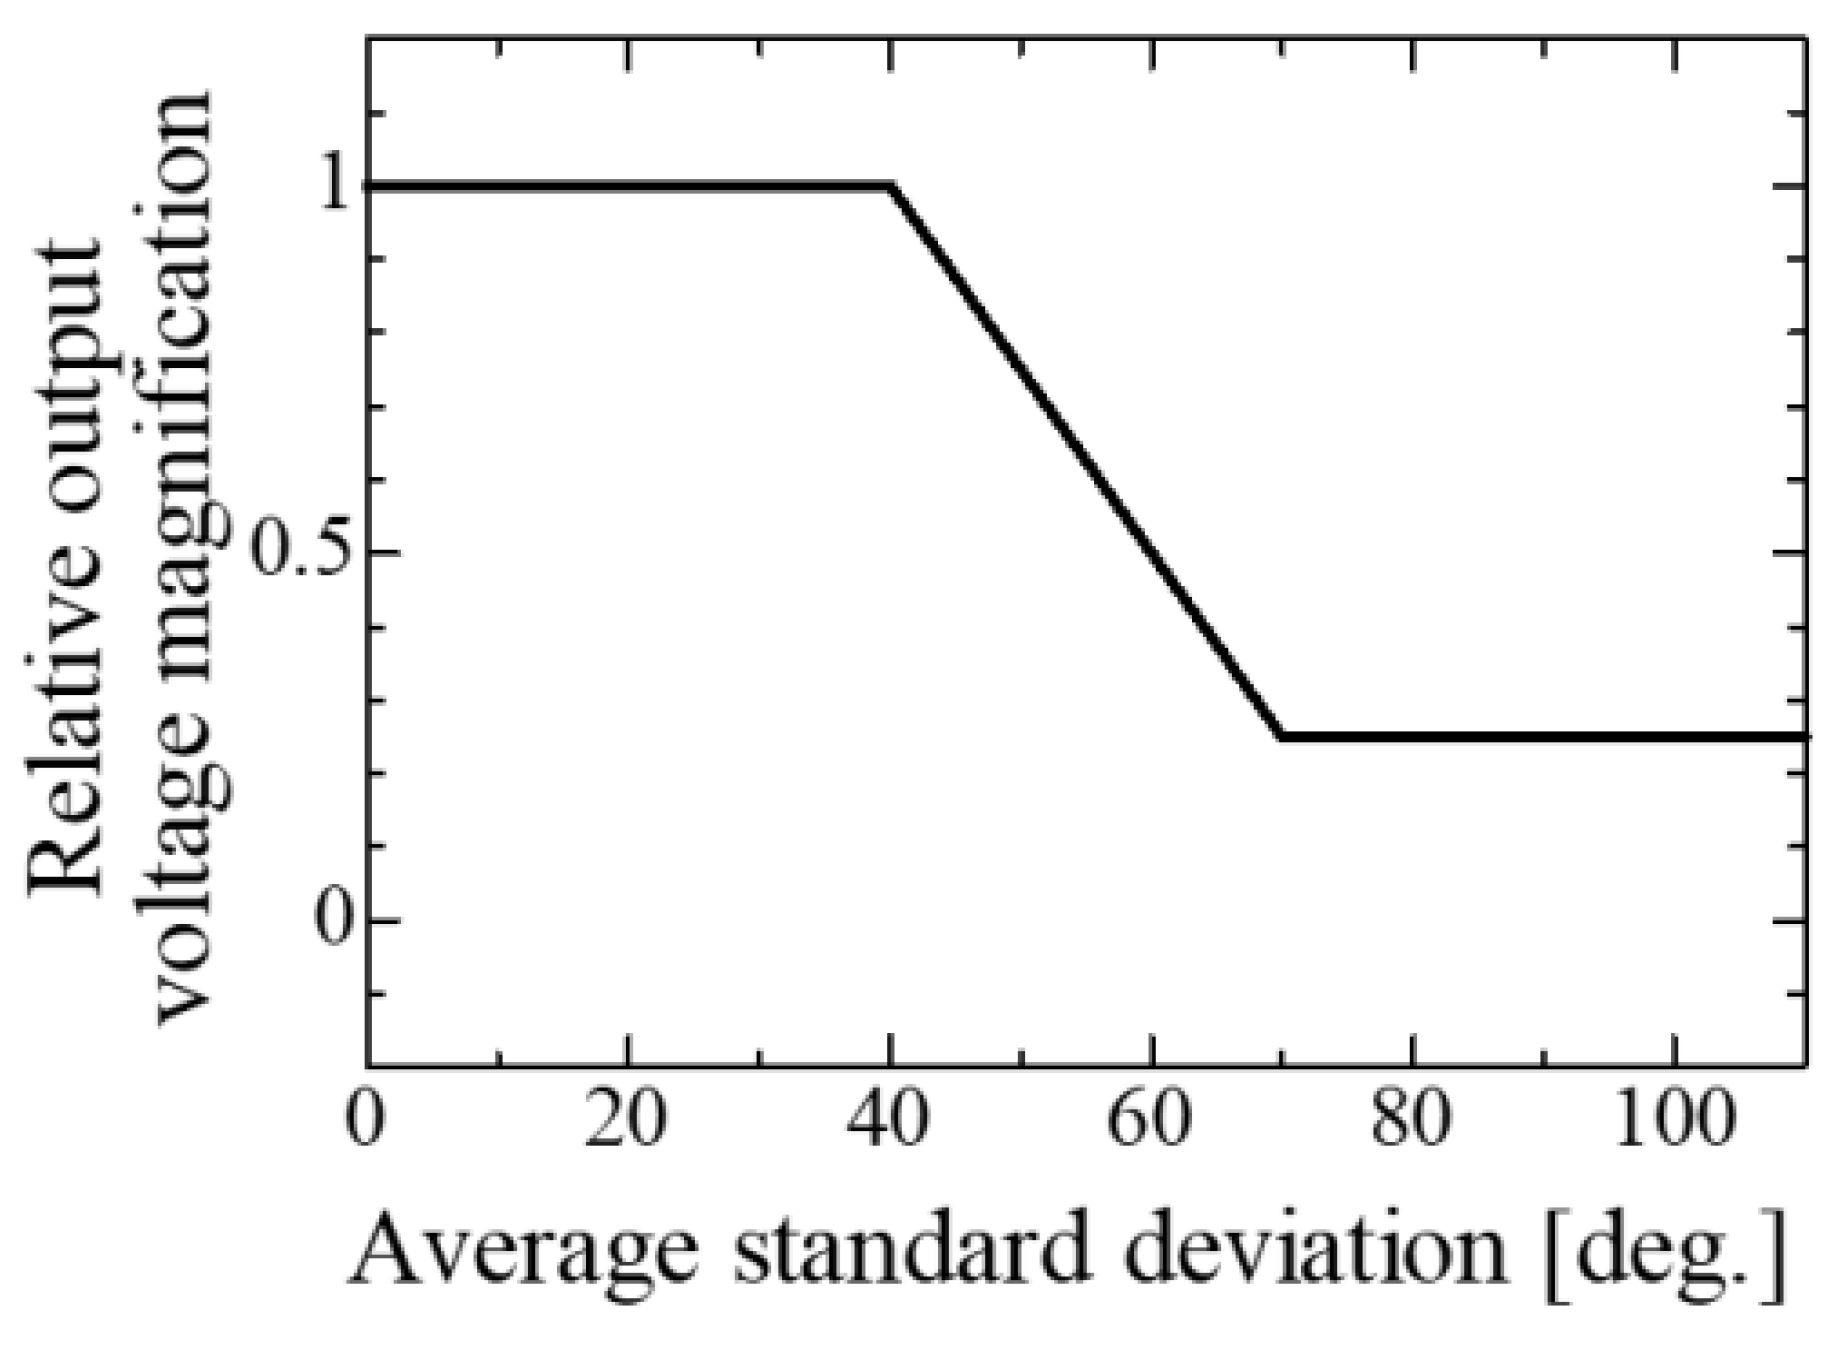
By combining the two ways of driving the vibrators, as described above, it is possible to convey information to the user about the direction of the sound source and the distance to the source through vibration. The vibration intensity ratio of the left and right vibrators indicates the direction of the sound source, and the vibration intensity itself indicates the distance to the source. In principle, if only the intensity of the vibrations is increased without changing the intensity ratio of the vibrators, the user should be able to see the source approaching from any direction. However, the directional dependence (directionality) of the mean value of the standard deviation introduces uncertainty into the distance estimate, and thus, it is considered more effective for estimating relative distance rather than absolute distance. In other words, it may only tell us whether the sound source is approaching or moving away from its current position. In order to simplify the evaluation of the system, the subject tracked a moving sound source.
When a loudspeaker fixed on a linearly moving platform crossed a point 2 m away from the subject, we examined whether the subject, wearing an eye mask, could track the moving loudspeaker. The subject, a 21-year-old male student with no hearing impairment, was instructed to turn his face in the direction where the vibration intensity of the left and right vibrators was equal. Four seconds after the start of the loudspeaker motion, the loudspeaker continuously generated the sound of a motorcycle engine. A schematic diagram of the experiment is shown in Figure 14.
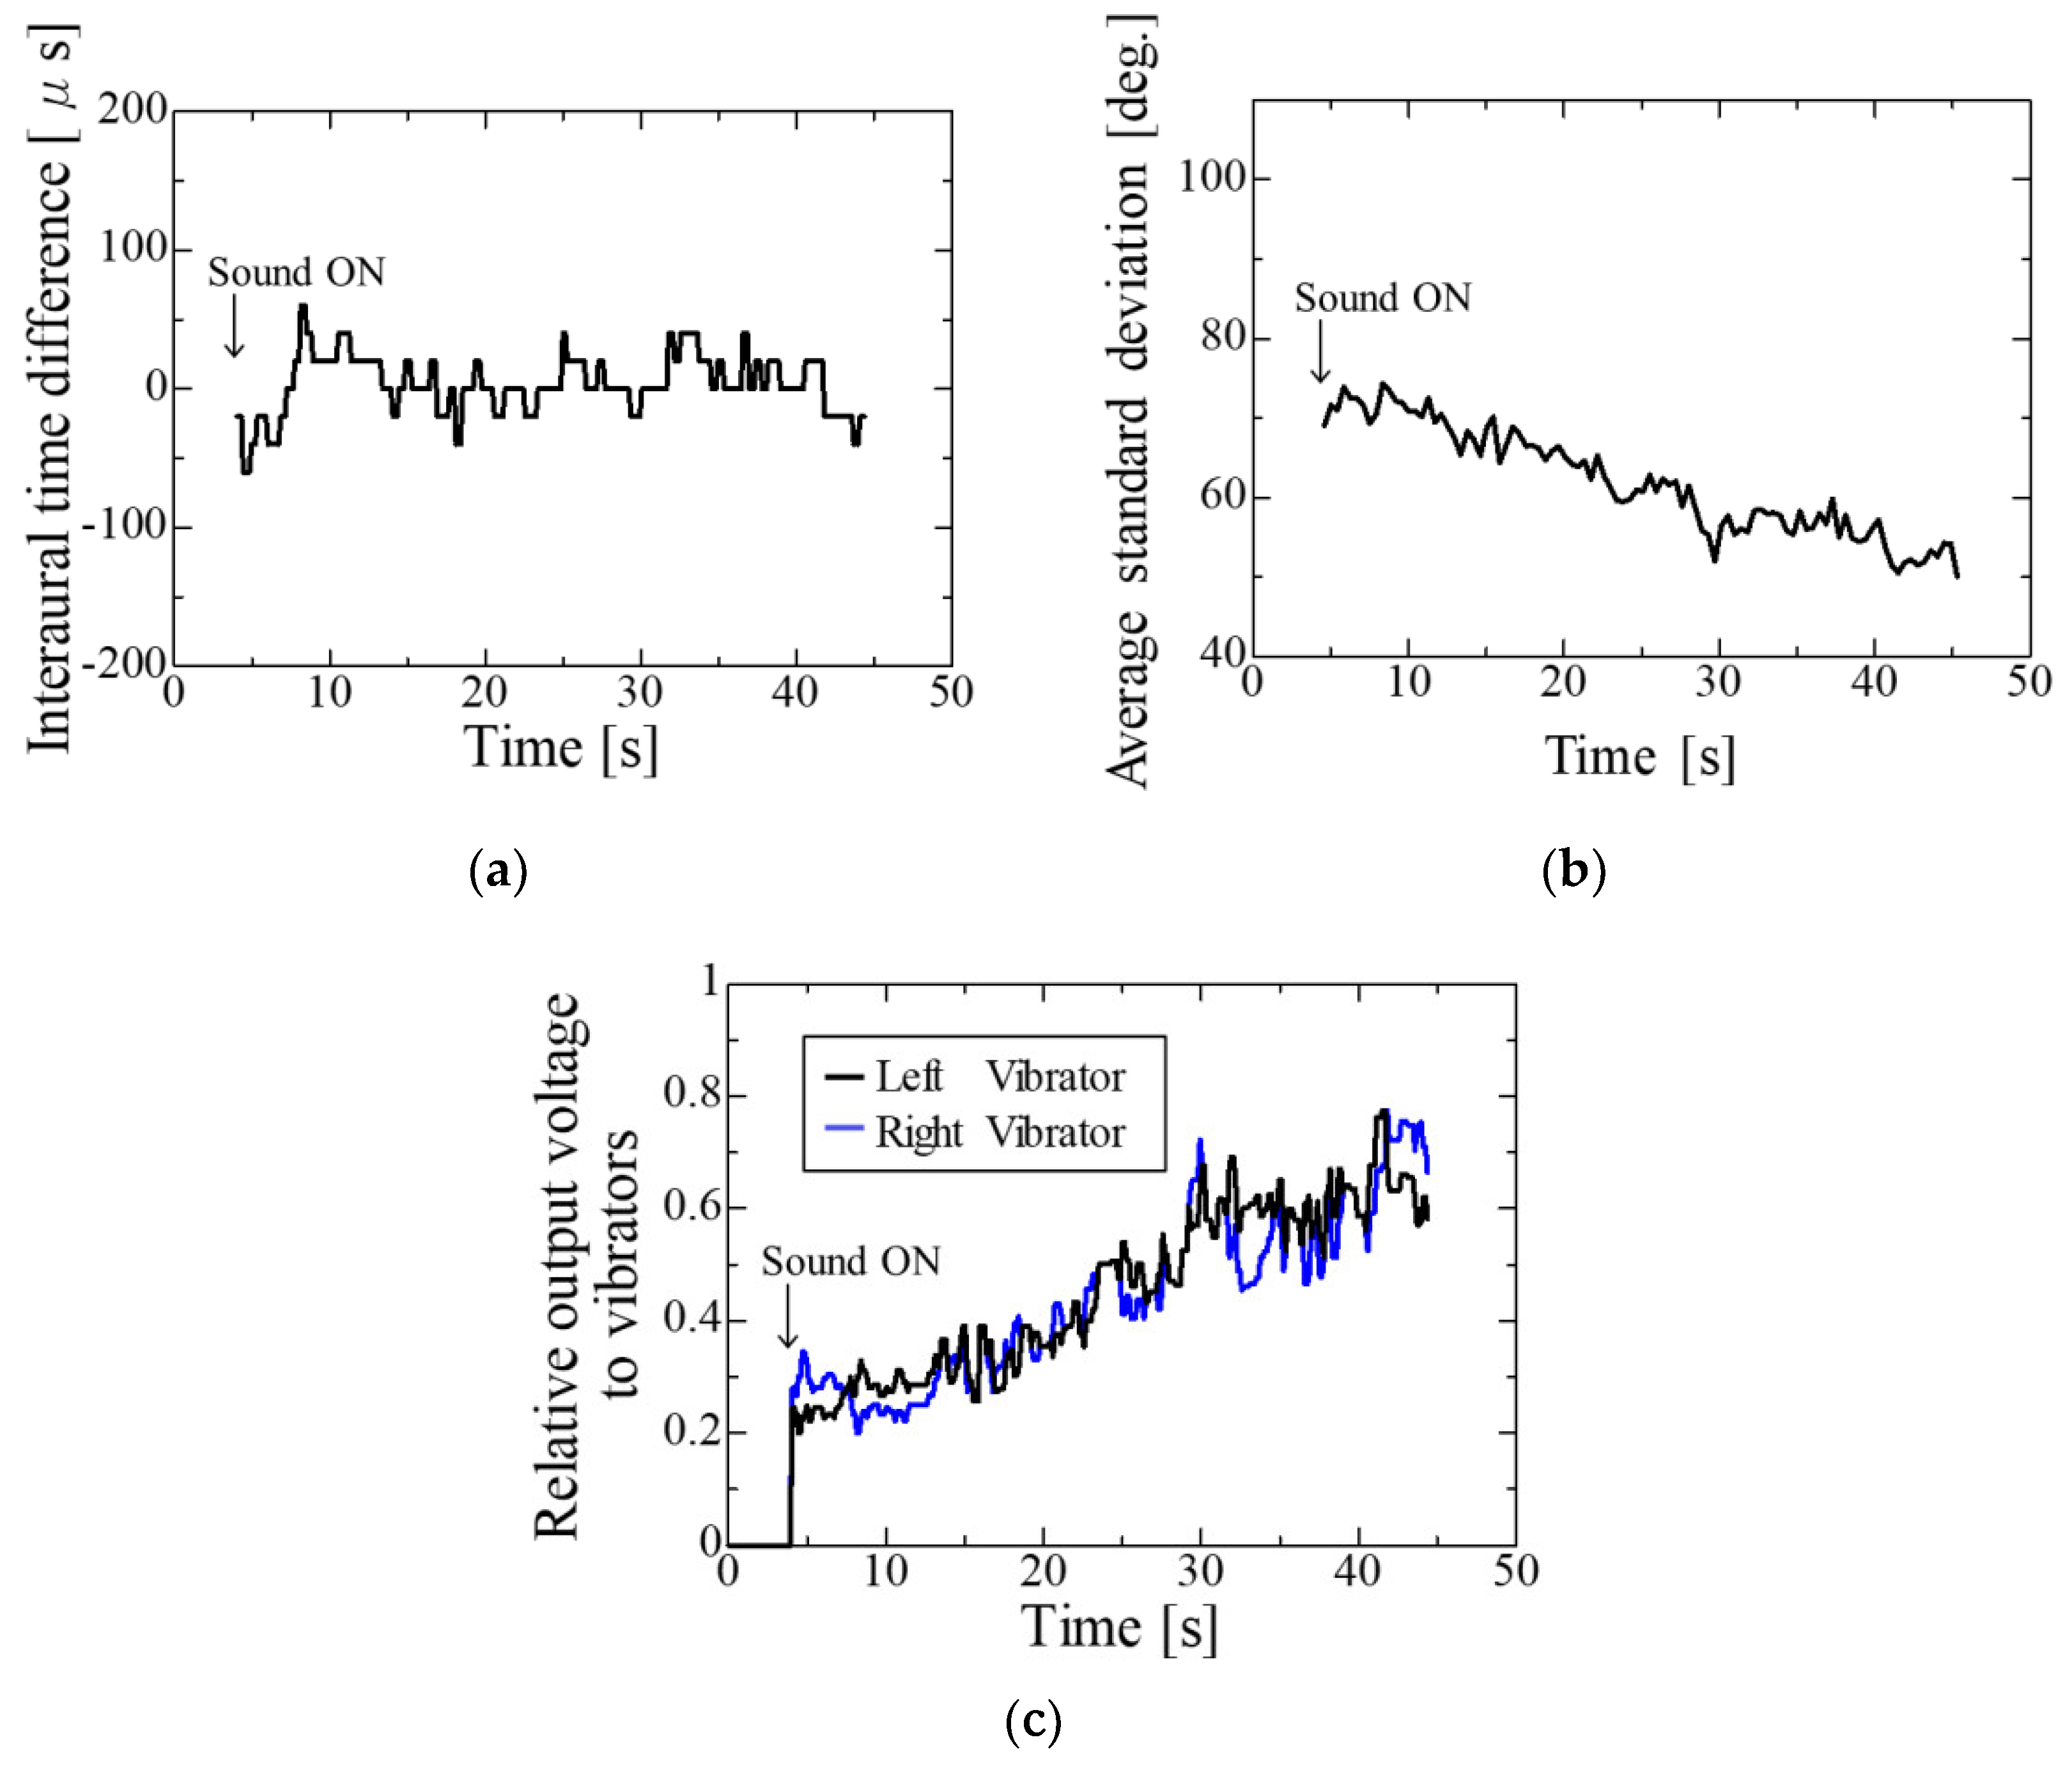
The measurement results are shown in Figure 15; Figure 15a shows the time variation of the time difference between the two ears, Figure 15b shows the time variation of the mean value of the standard deviation, and Figure 15c shows the output voltage to the left and right vibrators. Immediately after the onset of sound, the value of the interaural time difference was as low as −60 μs because the speaker was located on the subject’s right side (Figure 15a). At that time, the output voltage of the vibrator was higher on the right (
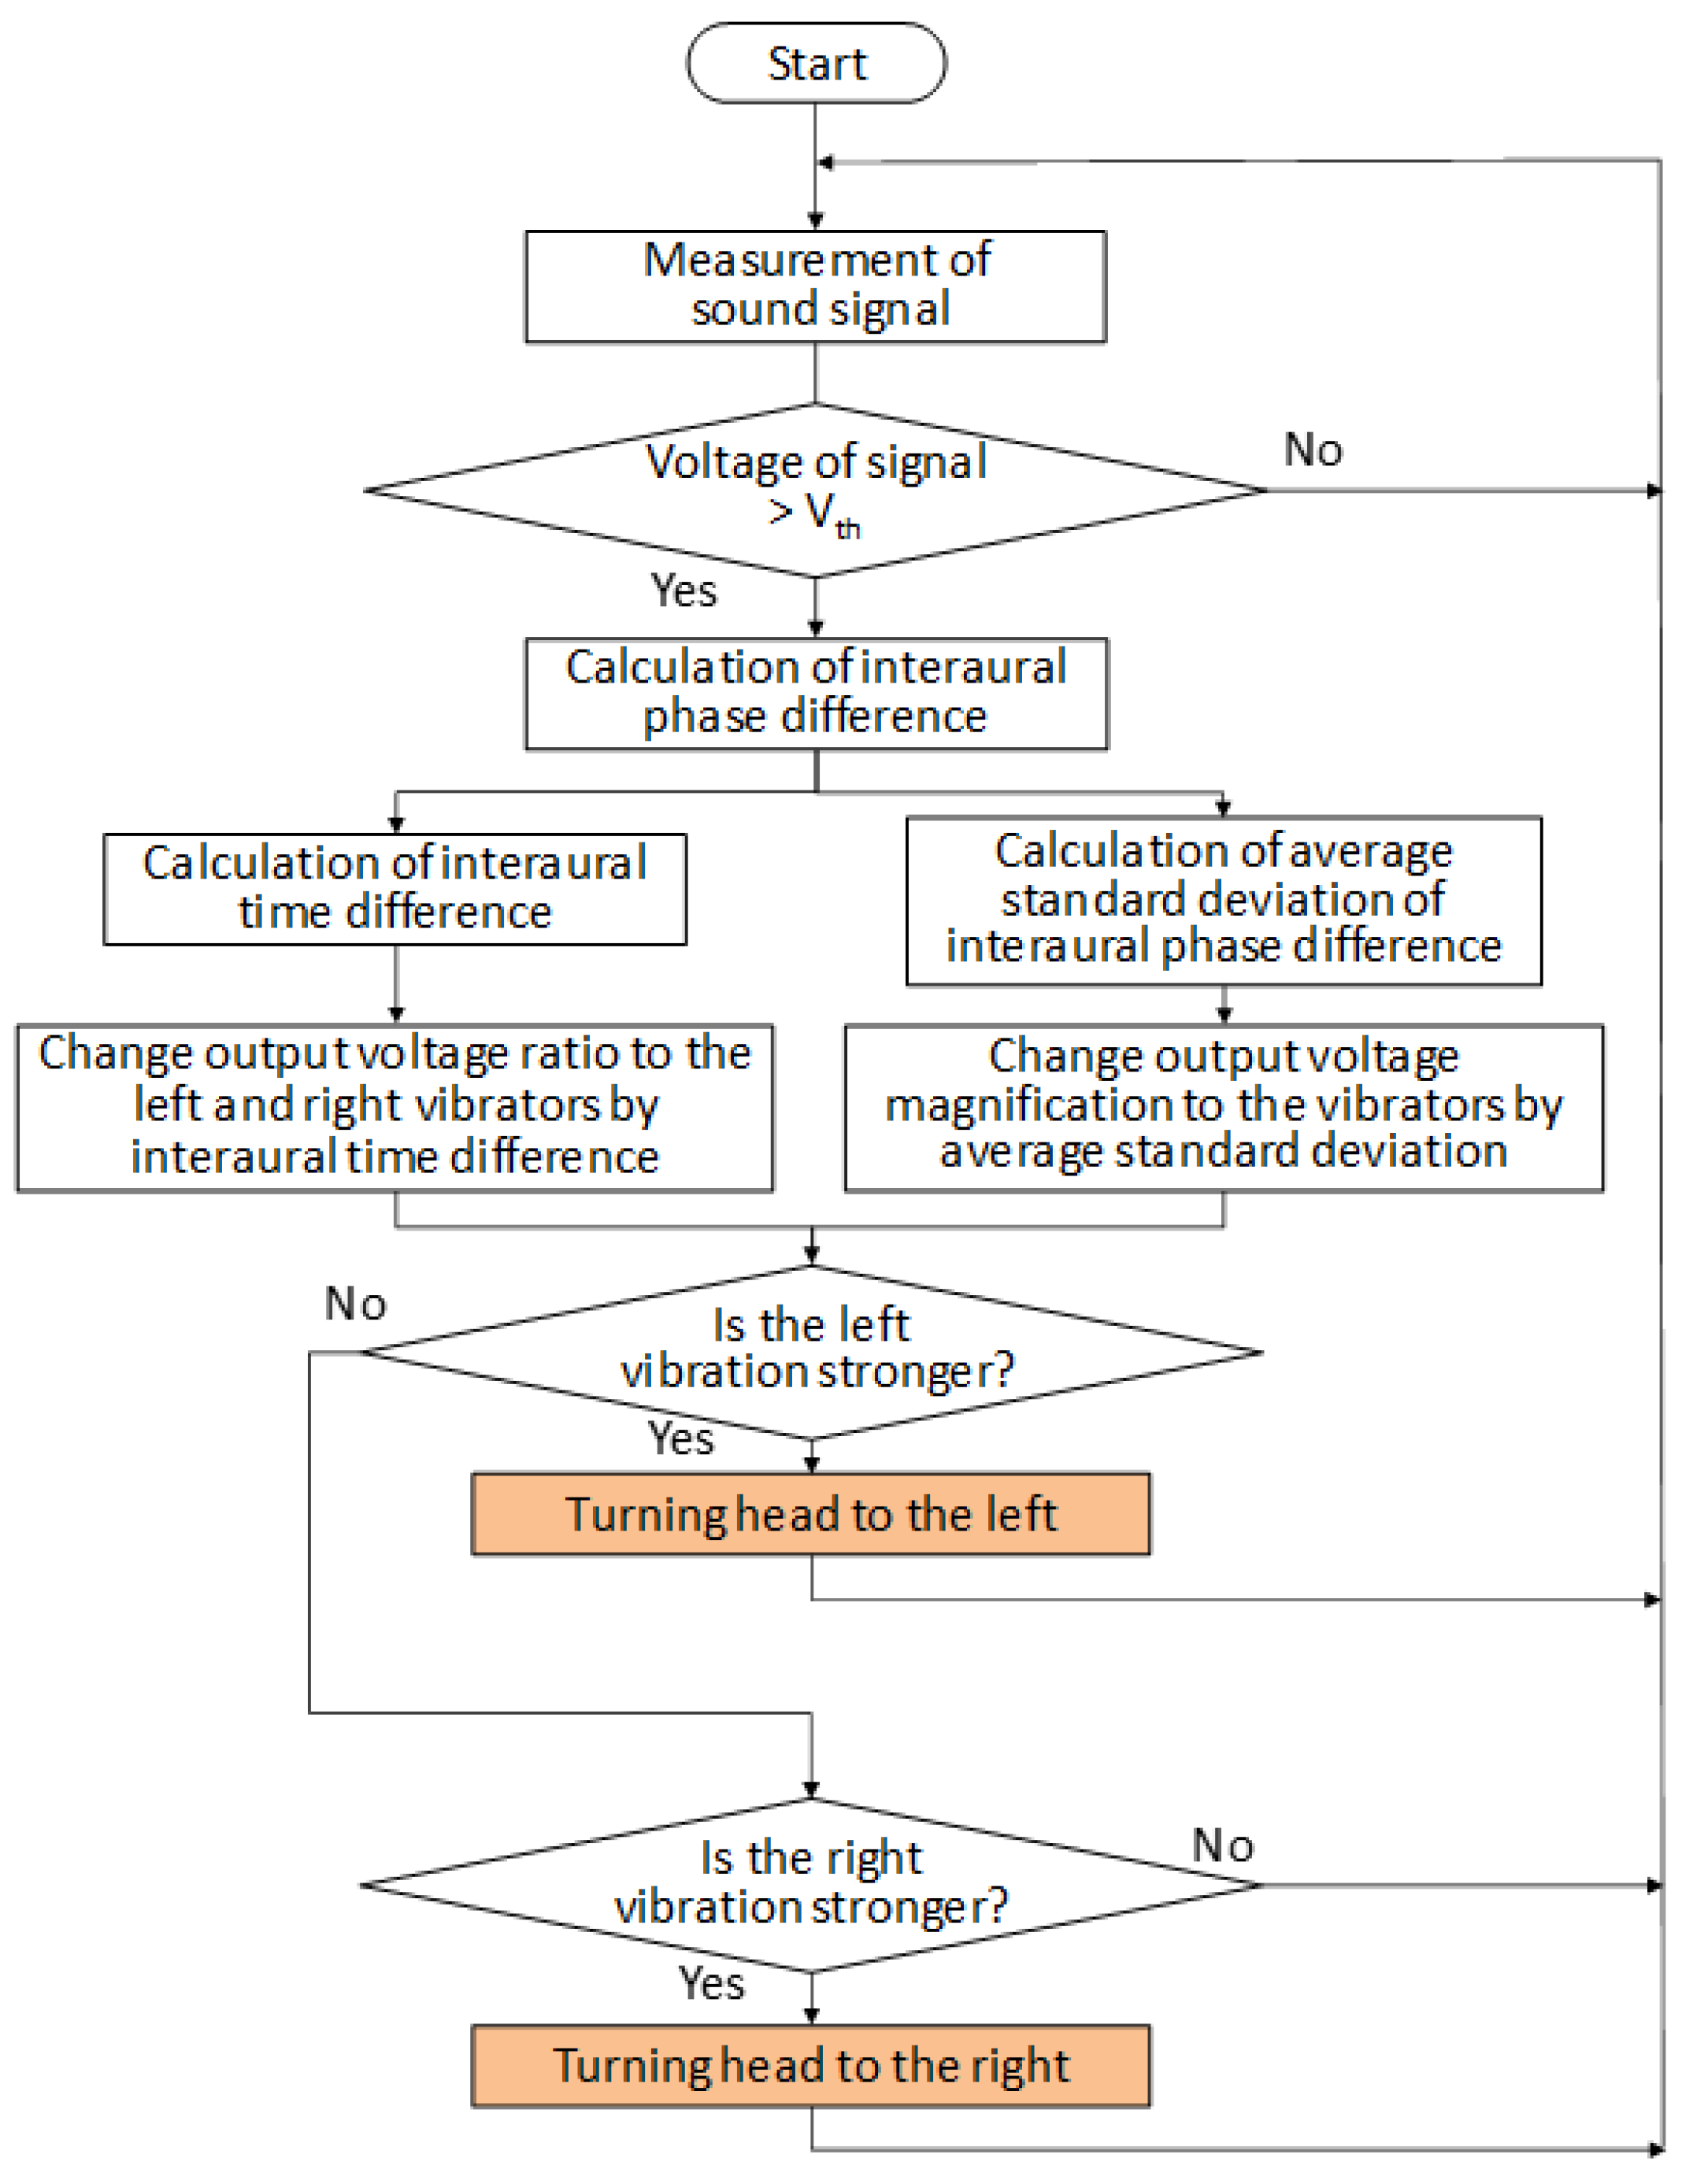
Figure 15c), so the subject turned his face to the right. After that, the time difference between the two ears was gradually corrected to around zero. This is because the subject continued to face the direction of the moving loudspeaker according to the vibration of the vibrator. The average value of the standard deviation was 70° immediately after the onset of the sound but decreased to around 50° as the loudspeaker approached. The output voltage to the left and right vibrators increased accordingly. As the loudspeaker approached, the vibration of the vibrators gradually intensified, so the subject could see how the loudspeaker was approaching. For an indoor sound source that is moving a relatively short distance, it is possible to accurately notify the subject of its movement. As shown in the flowchart in Figure 13, since the subject’s motion is included in the control loop, individual differences in tracking motion are likely to occur. The action of pointing the head in the direction where the vibrations of both vibrators are equal to the movement of the sound source is not always easy, especially when the movement is fast. If the subject does not accurately point in the direction of the sound source, the vibration intensity does not correspond to the distance to the source. By training the subject, the accuracy of the motion of pointing the head in the direction of the sound source could be improved to some extent and the effect of individual differences can be controlled.

5. Discussion

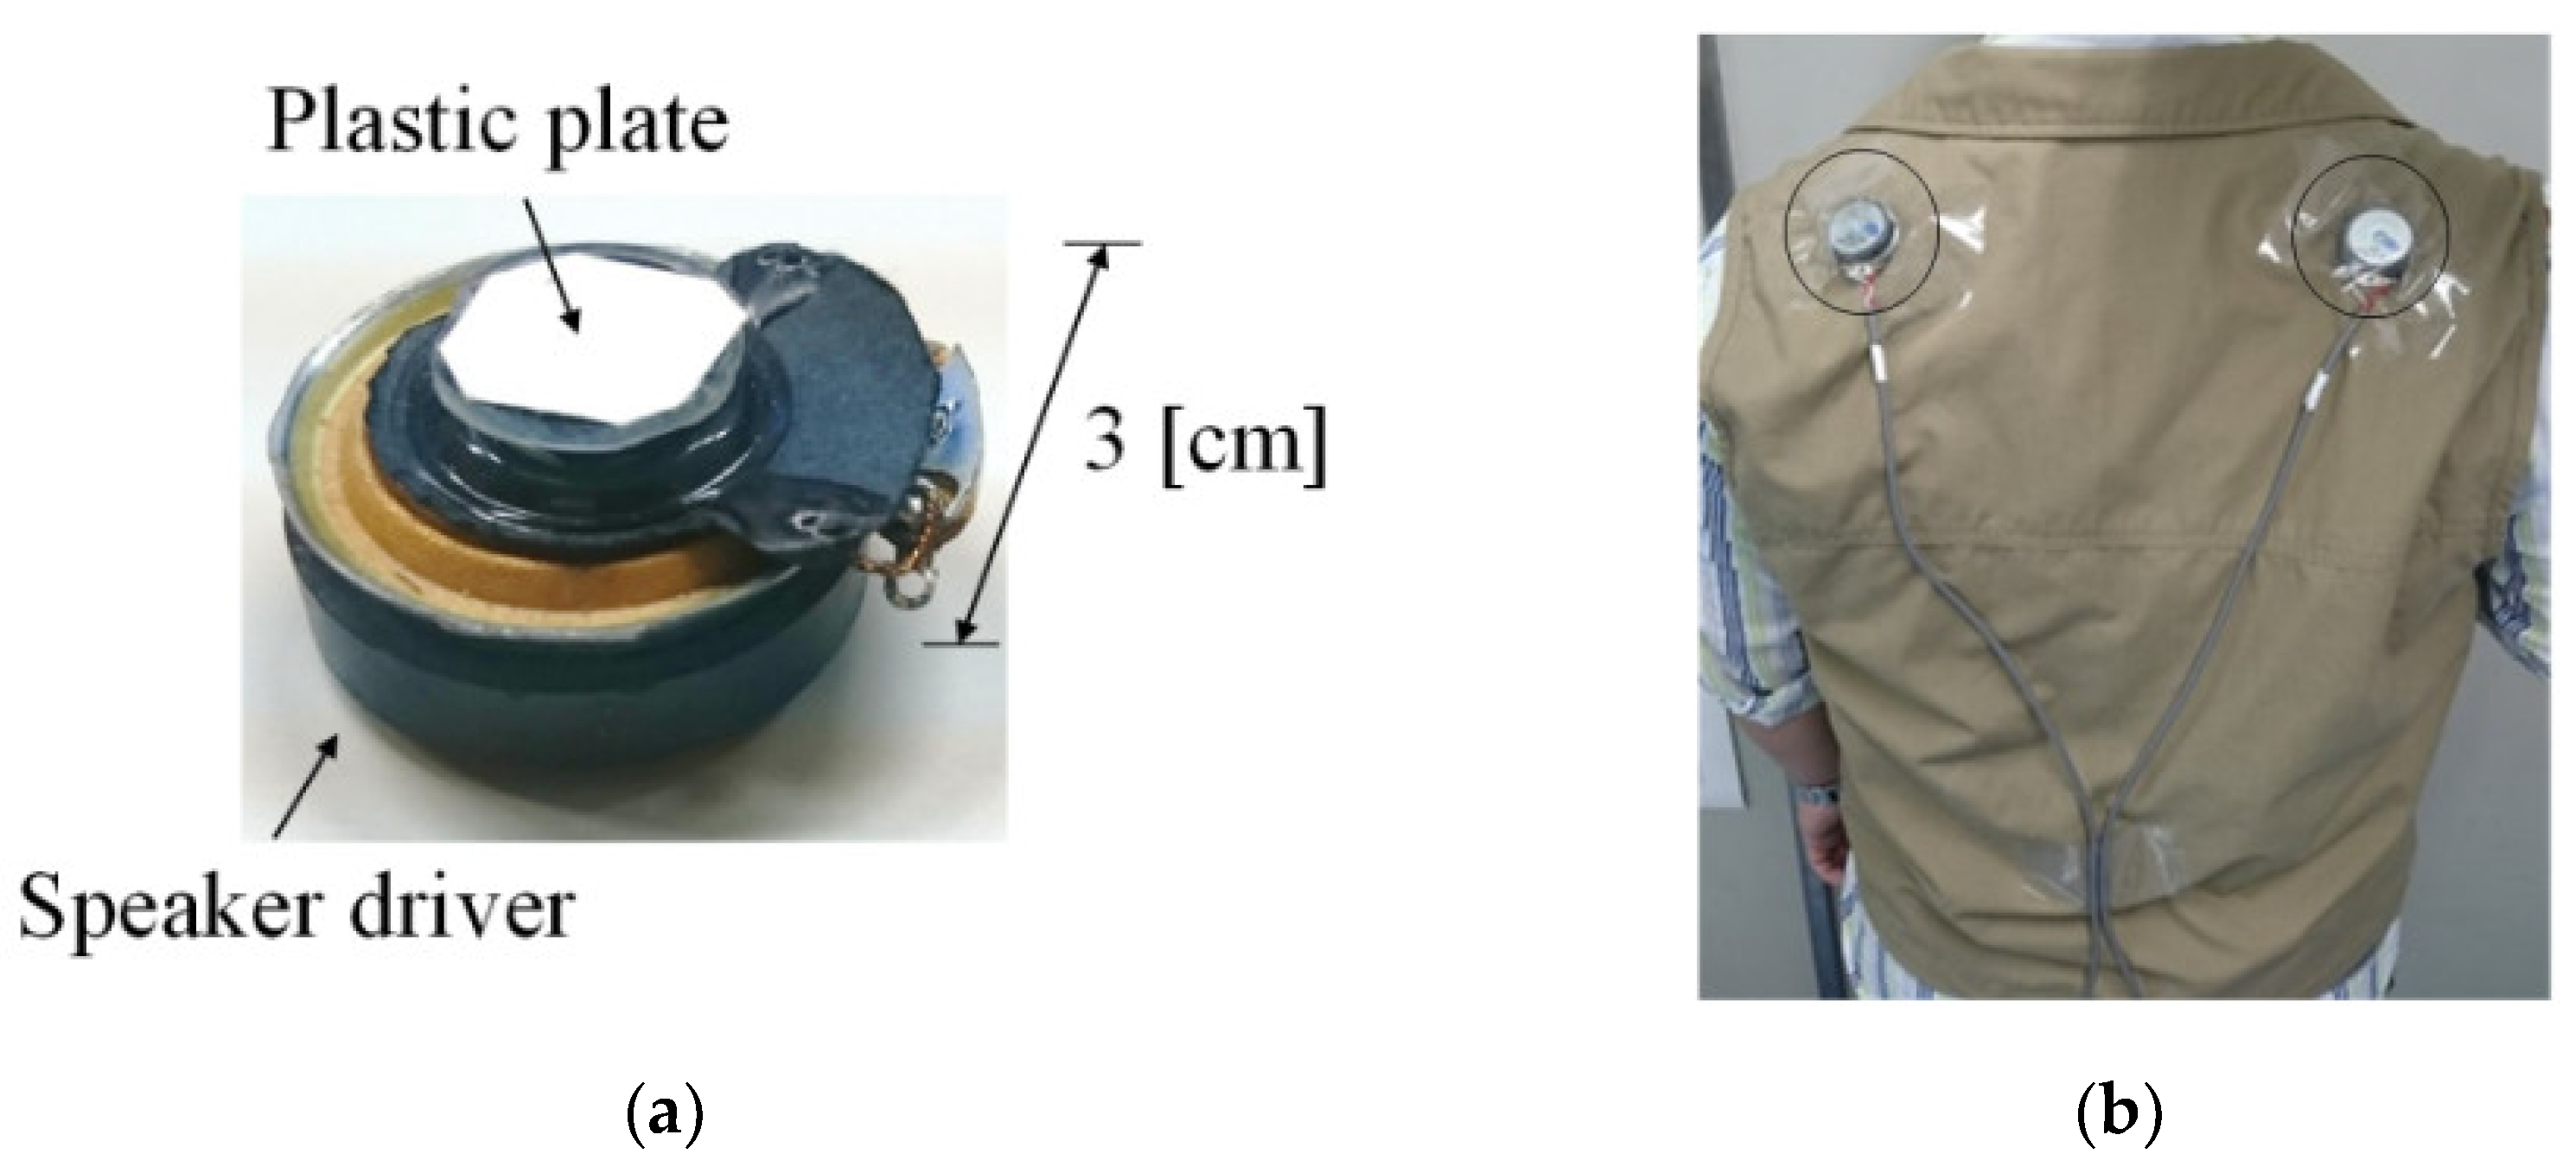
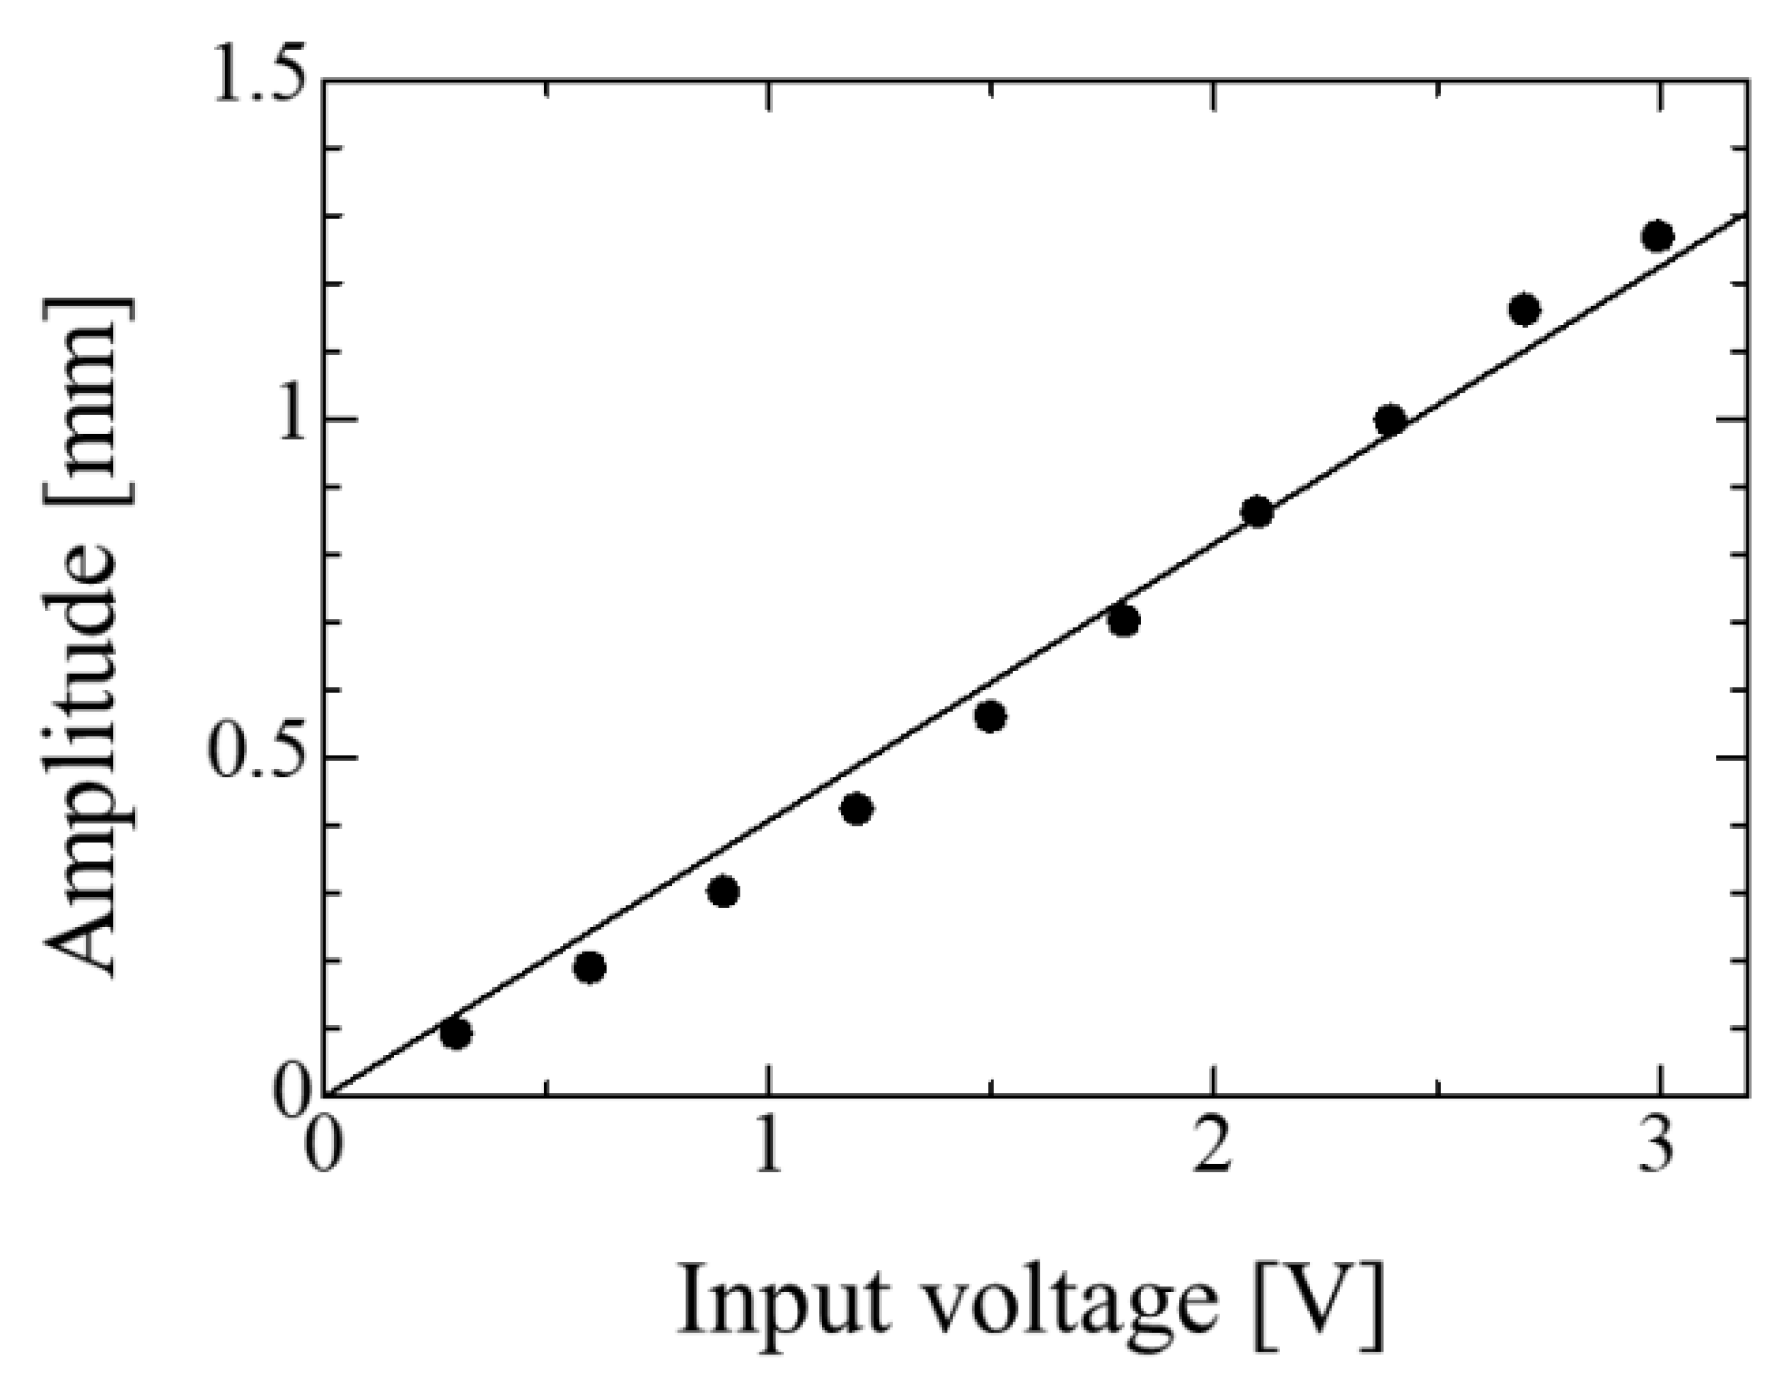
It is more effective to apply tactile stimuli directly to the skin, which is extremely sensitive to perception, in order to encourage the behavior of hearing-impaired people. However, the application of electrical or vibrating stimuli to the skin is not appropriate for long-term use because it tends to cause rashes and abrasions due to friction. In this study, two small loudspeaker drivers attached to a vest were used as vibrators so that the vest could be worn outdoors in layers (Figure 9). The vibration amplitude is up to 1.5 mm, which means that a hearing-impaired person could wear this vest over his or her clothes when going out, even when wearing layers. The placement of the vibrators, shown in Figure 9b, is an important factor that affects the perceptibility of the vibrations. When we tested the placement of the vibrators on the subject’s shoulders and back, we found that the protruding area around the scapula was more sensitive to vibration than the area above the muscles. The shape and size of the scapula varies from person to person, and there may also be individual differences in the sensitivity to vibration and the location where it is easily perceived. The best position to place the vibrator needs to be adjusted individually. The degree of adhesion of the vibrator is also important for perception. This can be solved by choosing the best size that is optimal for the hearing-impaired person. The subject who participated in this experiment was not inconvenienced by wearing the hearing assist system.
In this study, we tracked a moving sound source in a room to verify whether the hearing aid system could transmit information to the subject about the direction of the sound source and the distance to the sound source through vibration. The vibration intensity ratio of the left and right vibrators indicates the direction of the sound source, and the vibration intensity itself indicates the distance to the source. In principle, if the vibration intensity is increased without changing the intensity ratio, the subject should be able to identify the source approaching from any direction. However, as mentioned in the previous section, the directional dependence of the mean value of the standard deviation (directivity) is expected to cause uncertainty in the distance estimate. Therefore, we examined whether the subject, wearing an eye mask, could track a loudspeaker when it was fixed on a linearly moving platform and crossed a point 2 m away from the subject indoors.
As mentioned in Section 1, the purpose of this study is to provide hearing assistance to the hearing impaired by detecting the location of a vehicle traveling on a road outdoors. Further improvements are needed in the future. Richardson et al. (1979) reported that the location of a sound source placed at a predetermined discrete direction and distance could be estimated by subjects through learning. In our system, the sound was detected and processed in real time, and the position of the sound source was tracked continuously by the vibration of the vibrator alone, without the subject having to learn. The subject wore an eye mask and did not use visual information to track the loudspeaker. The time variation of the interaural time difference (Figure 15a) shows that immediately after the onset of the sound, the value of the interaural time difference was −60 μs. This indicates that the subject’s face was initially oriented about 5° to the loudspeaker. As the subject continued to face the direction of the moving loudspeaker according to the vibration of the vibrator, the interaural time difference was gradually corrected to near zero. Since the interaural time difference remained below about 60 μs, the direction of the sound source was below about 5°. As shown in 
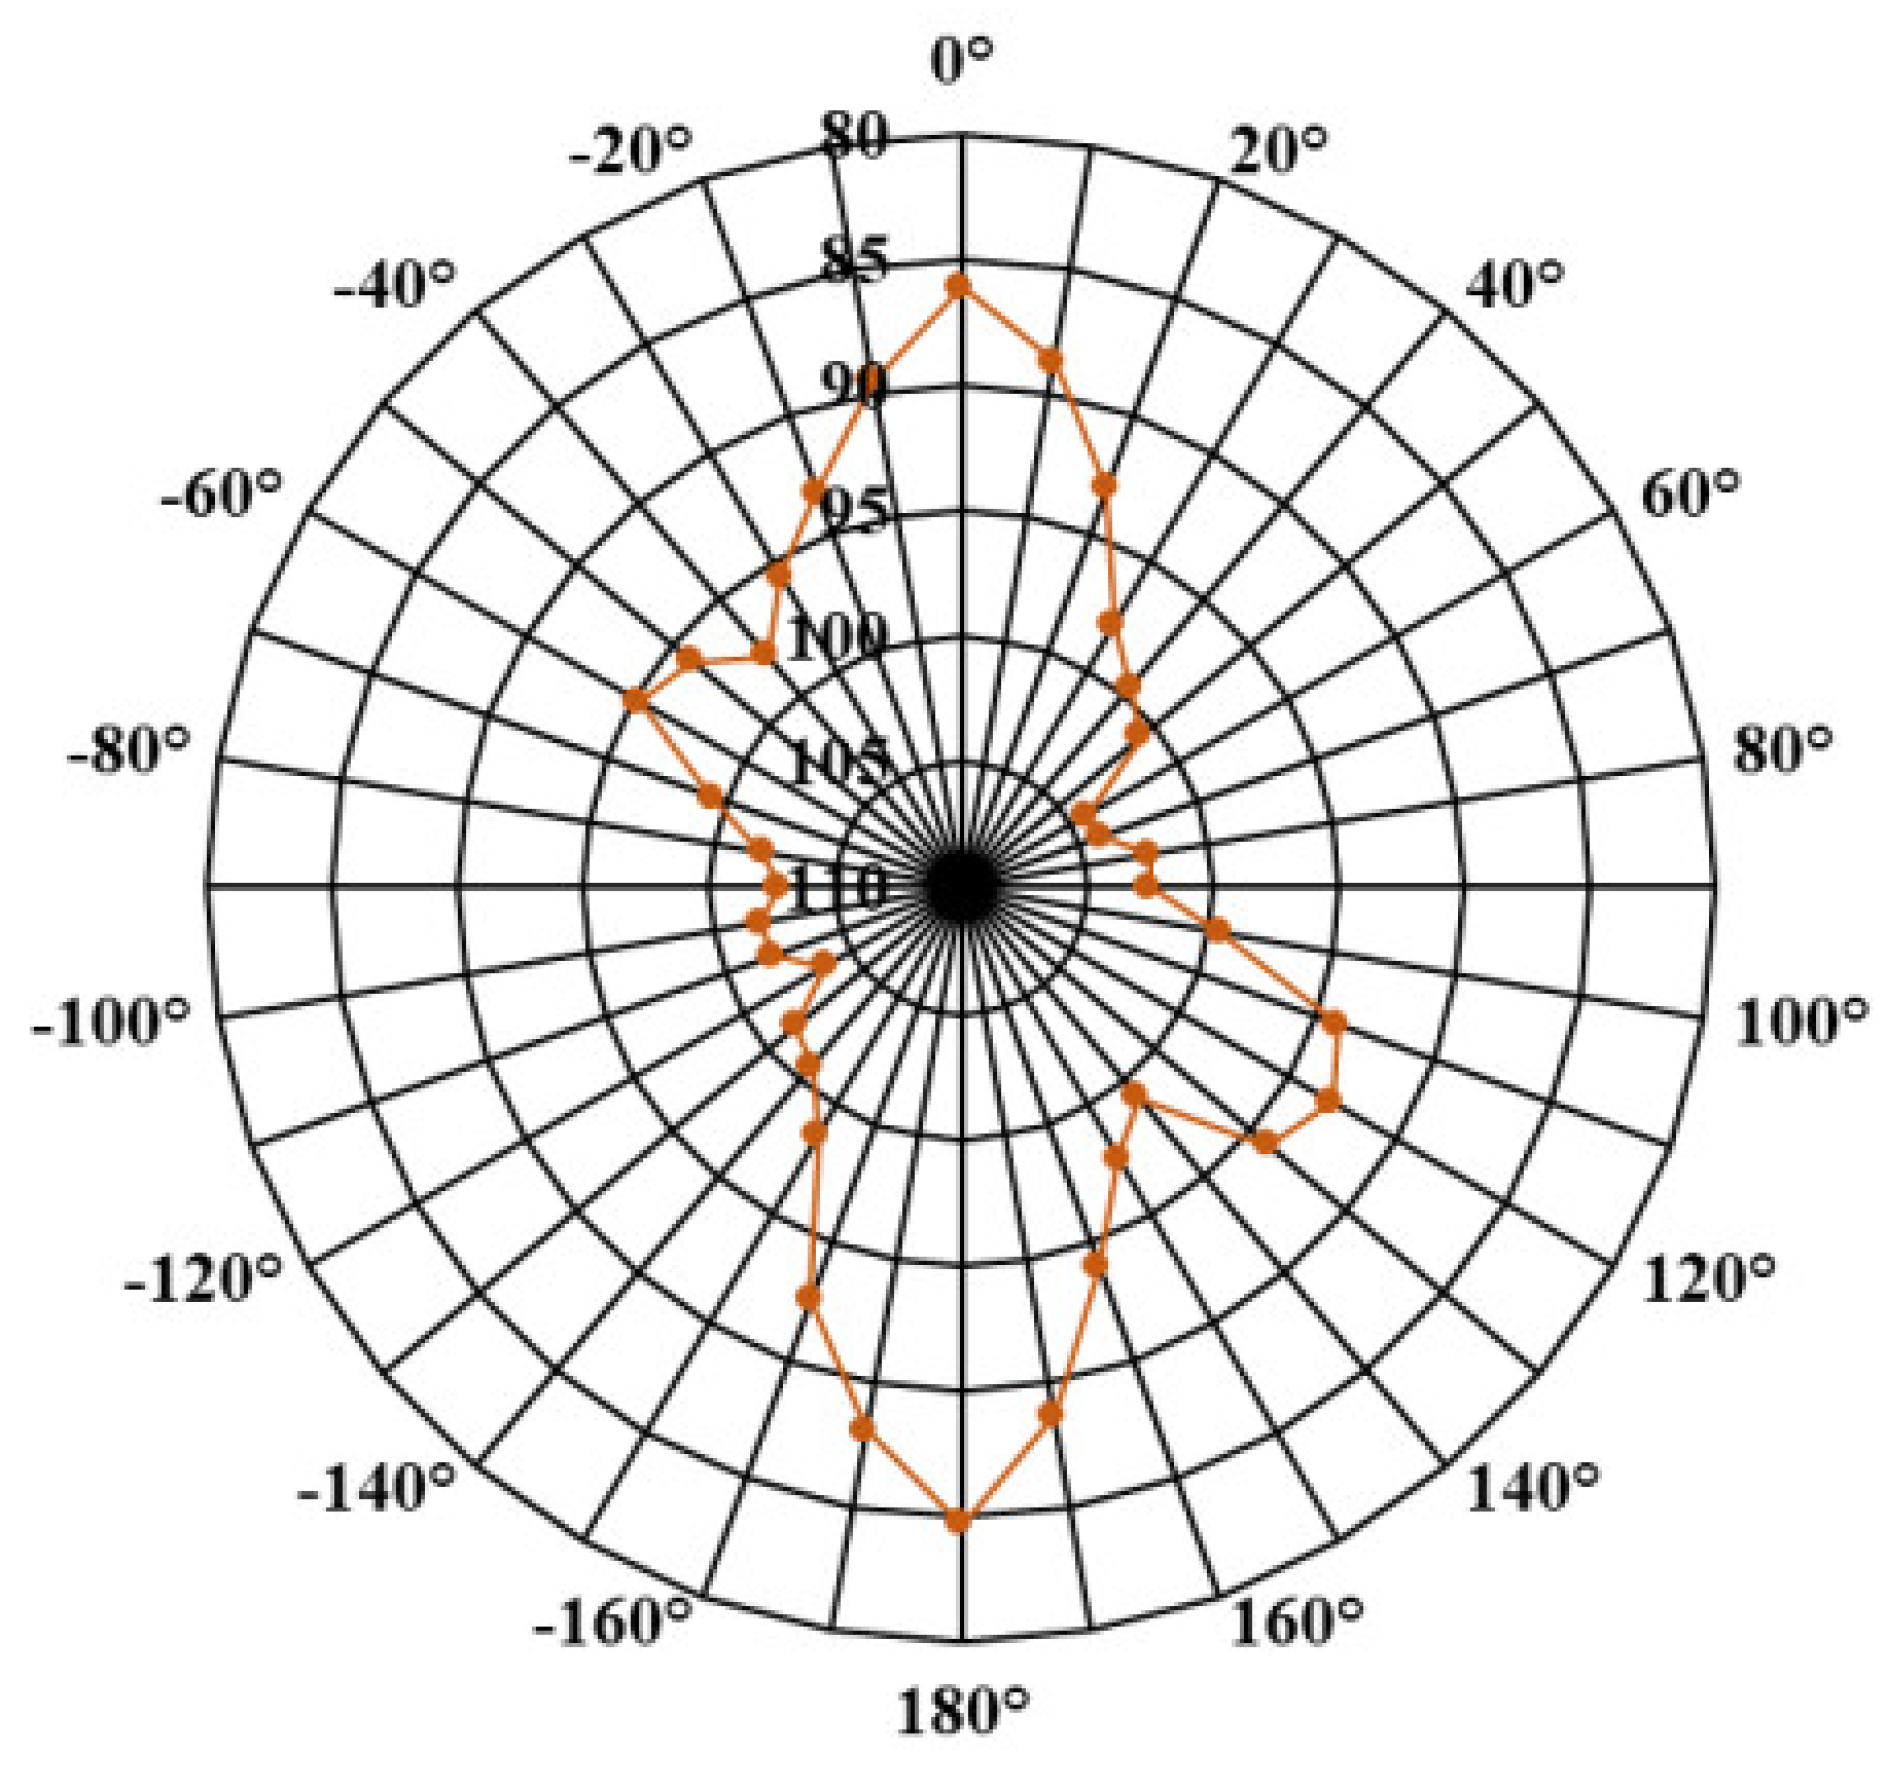
Figure 3, the subject was almost facing the front of the loudspeaker, and the increase in the mean value of the standard deviation estimated from the directional characteristics of the mean was slight (about 2–3°; Figure 6). Therefore, the time variation of the mean of the standard deviation (Figure 15b) can be obtained without having to depend on the source direction. As the distance between the subject and the loudspeaker reached about 2.69 to 1.40 m, the mean value of the standard deviation gradually decreased from about 70 to 50°. The time difference between the two ears was near zero, indicating that the subject was directly facing the direction of the loudspeaker. Even though the direction of the loudspeaker from the subject’s point of view changed totally by about 24° before and after the movement, the output voltage to the left and right vibrators (Figure 15c) remained almost the same. This indicates that the subject kept changing the direction of his face so that the vibration intensity of the vibrators on both shoulders became equal. The movement of the loudspeaker was set to a relatively slow speed of 3.8 cm/s. The speed at which the sound source direction changed from the subject’s perspective was about 0.6°/s. When tracking the sound of a vehicle on a road, it is necessary to consider the validity of the moving speed. The farther away the vehicle, the lower the speed should be at which the direction of the sound source changes.
In real scenarios, hearing-impaired people would benefit most if it were possible for them to perceive sound sources from directions that are not included in their visual field. Although experimental data are not shown, the proposed system is capable of detecting the direction of a sound source not only in front but also to the side and rear of the subject’s field of vision and of providing notification. The authors reported a method of detecting the direction of lateral and backward sound sources and of providing notification with vibrating vibrators attached to the subject’s shoulders [39]. The method of driving the vibrators is simpler than that shown in Figure 11. If the sign of the time difference between the two ears is positive, the left vibrator is driven by constant voltage, and if it is negative, the right vibrator is driven by constant voltage. The subject was instructed to turn his face to the vibrating side. Both vibrators vibrated only when the subject faced the direction of the sound source. The subject could continue to change the direction of his face by relying on the vibrations to indicate the direction of the sound source, not only in front but also to the side or behind. In this system, the right and left vibrators are driven by constant voltage when the time difference between the two ears is less than −300 μm and more than +300 μm, respectively, as shown in Figure 11, so it should be able to present the direction of lateral and backward sound sources as well as the previous system. Therefore, even if the hearing-impaired person is looking to the right in order to see a vehicle when crossing the road, this system can still provide notification of a vehicle approaching from the left or rear.
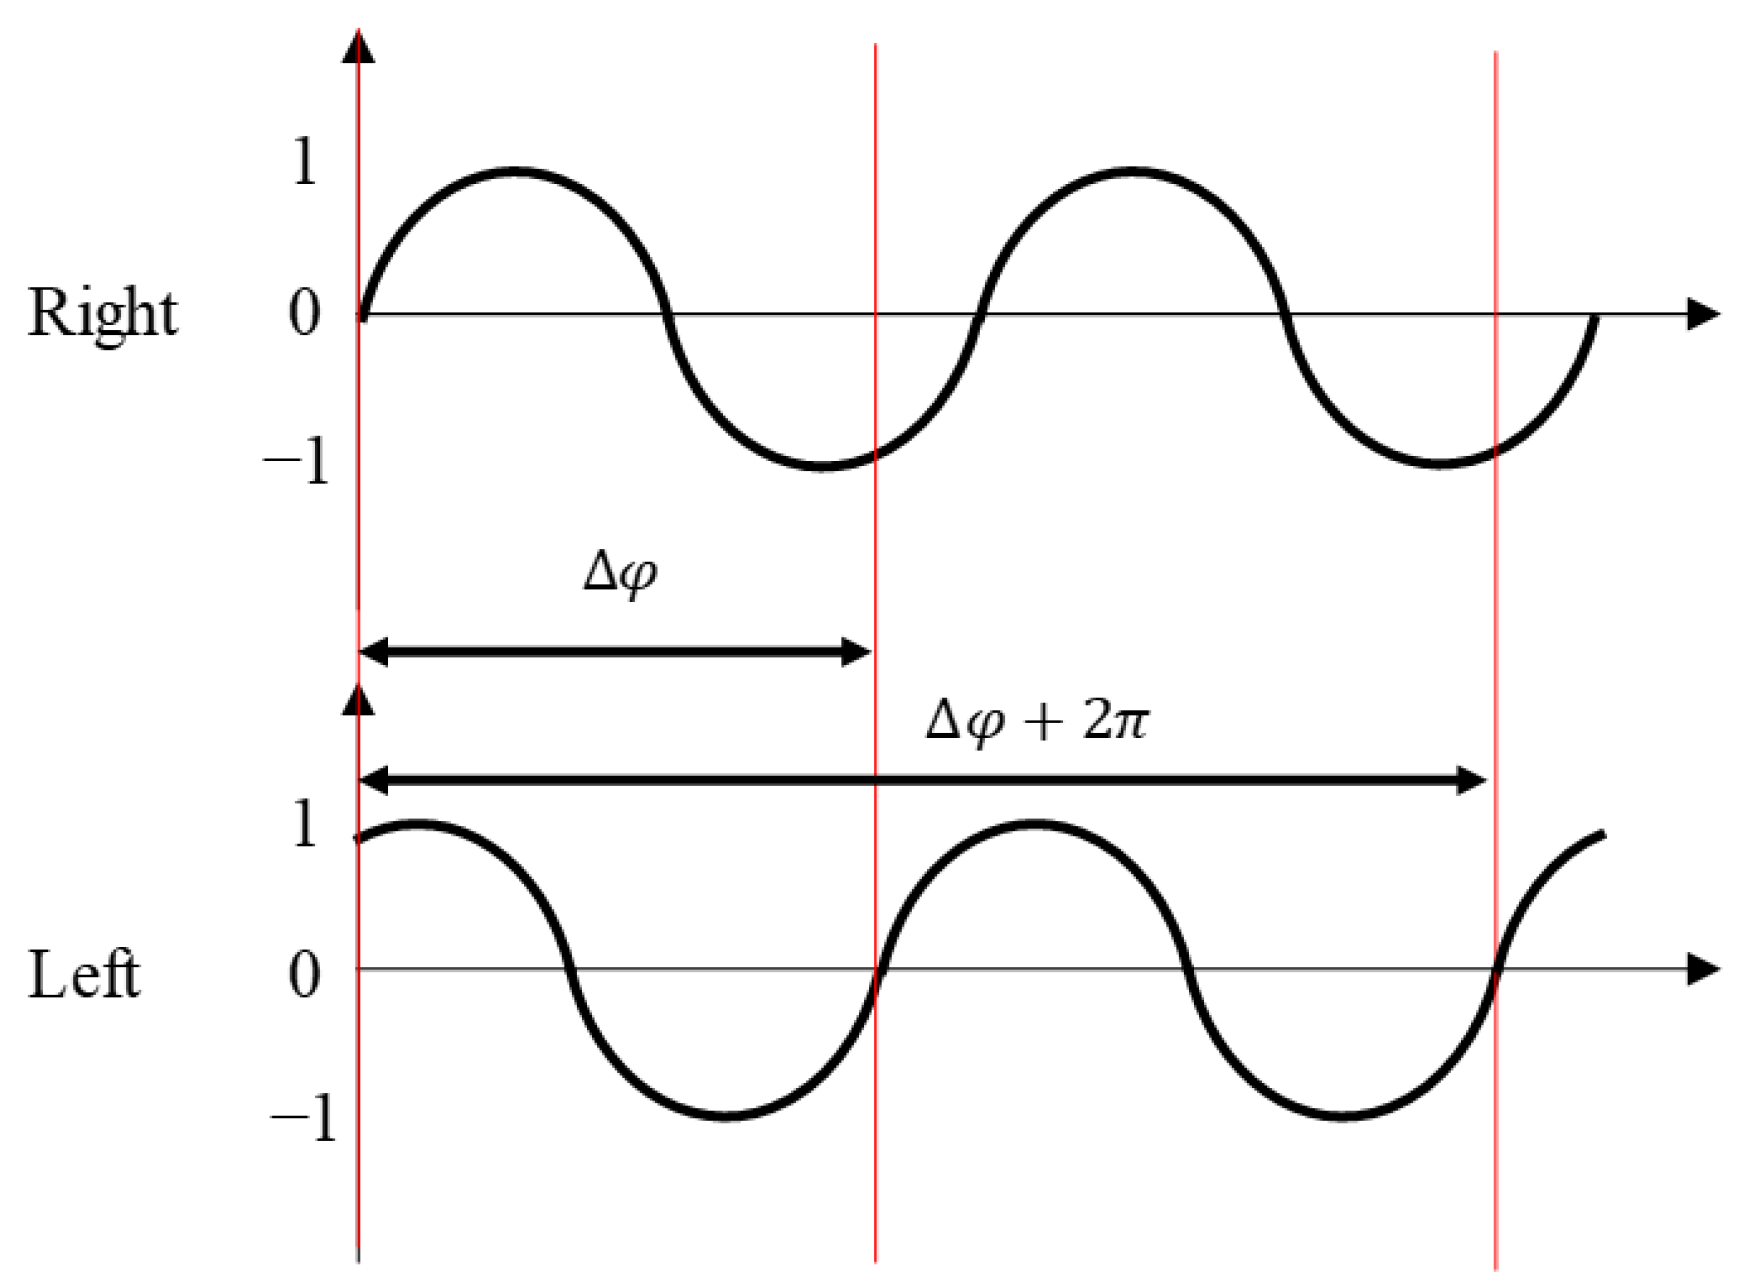
The evaluation was performed by conducting measurements of a sound source with the sound of a motorcycle engine. For real applications, common sound sources (e.g., sound of a car motor) need to be considered. In this system, both the direction of the sound source and the distance to the source were obtained from the interaural phase difference of the sound pressure. This is performed to take advantage of the fact that phase is independent of amplitude. The phase difference spectrum can be obtained independently of the sound quality. The authors reported that the spectra of the phase difference detected by two spatially separated microphones are almost equal when noise and voice are generated from loudspeakers [42]. In other words, the same results should be obtained when the same experiment is conducted with vehicle sounds instead of the sound of a motorcycle engine. This property of being independent of sound quality is also a drawback in another sense. This is especially apparent when the system is used outdoors. The system reacts to wind noise, which it is not necessary to alert the user about. In order to solve this problem, it will be necessary to add a function to the system that can recognize environmental sounds through artificial intelligence.
In this study, the number of sound sources to be tracked was limited to one. Ideally, a hearing assistance system should be able to track the locations of multiple sound sources, to analyze the sound quality of each, and to then prioritize them in order to provide notification. However, tracking multiple sound sources and analyzing the sound quality using artificial intelligence is too computationally demanding to be implemented on a mobile platform, which may violate constraints 2 and 3 in Section 1. The proposed system notifies the user of the direction of the loudest sound source in the vicinity. The acoustic signal detected by the microphone is a composite of sounds arriving from various directions. Physically, sound is a scalar quantity because it is pressure fluctuation in the atmosphere, but it can be treated as a vector quantity with a propagation direction by using two microphones. We assume that the direction of a composite vector, which is a combination of several vectors of different sizes, can be approximated by the direction of the vector with the largest amplitude. Strictly speaking, we track one sound source per time frame, and the detected sound source is not limited to one but may switch to others as time passes. In other words, even if the hearing-impaired person happens to be looking to the right when crossing the street, if the sound of a truck approaching from the left (corresponding to the rear) is loud, the system can alert the person to the presence of the approaching truck.
Finally, we compared the function of this system with that of the previous hearing assist system [39]. This system is similar in that it can present the direction of a single sound source in all horizontal directions (including lateral and backward directions) to the subject, but it has an additional function of estimating the distance to the sound source. By adding analog vibration patterns for presenting the direction of the sound source, we were able to show the direction of a moving sound source with an accuracy of less than 5°. The high accuracy of the direction overcame the uncertainty in the estimation of the distance and made it possible to show the approach and departure of the sound source to the subject.

6. Conclusions

We conducted an experiment in which a subject wearing an eye mask and the developed hearing assistance system was able to track a single sound source. The subject was notified of the movement of the sound source by the vibration of vibrators on both shoulders according to the distance and direction to the sound source estimated from acoustic signals detected by the ear microphone. The ratio of the vibration intensity of the two vibrators varied according to the angle of the sound source: the closer to the sound source, the stronger the vibration intensity, thereby presenting the relative angle of and distance to the sound source to the subject.
(1)
A subject wearing an eye mask and a hearing assistance system was able to track the direction of a sound source moving across the room 2 m in front of him with an accuracy of less than 5°.
(2)
When the subject turned his face in the direction where the vibration intensity of both vibrators became equal, he could perceive the approach of the sound source as a change in vibration intensity.
We conducted a tracking experiment for a sound source moving only 2 m ahead in a room. Although the experimental conditions were not very practical, the original purpose of this study was to detect the location of a vehicle driving on the road outdoors and to provide hearing assistance for the hearing impaired. The method described here is not always effective in detecting the direction and distance of distant sound sources. This is because the system can be affected by environmental sounds such as wind noise when outdoors. We plan to overcome this problem by introducing environmental sound recognition using artificial intelligence. A wearable assistance system such as that adopted in this study will surely help hearing-impaired people go out safely. It is not yet clear whether a world in which all vehicles are electrically powered and run almost silently, with no need to detect running sounds, will be safe for people, including able-bodied people.

Funding

This research received no external funding.

Institutional Review Board Statement

Not applicable.

Informed Consent Statement

Informed consent was obtained from all subjects involved in the study.

Data Availability Statement

Not applicable.

Acknowledgments

The author thanks J. Seki and S. Ishitsuka especially for developing the present system, for conducting several experiments, and for processing the data as graduate students.

Conflicts of Interest

The authors declare no conflict of interest.

References

  1. Von Bekesy, G. Human skin perception of traveling waves similar to those on the cochlea. J. Acoust. Soc. Am. 1955, 27, 830–841. [Google Scholar] [CrossRef]
  2. Von Bekesy, G. Similarities between hearing and skin sensation. Psychol. Rev. 1959, 66, 1–22. [Google Scholar] [CrossRef]
  3. Gescheider, G.A. Cutaneous sound localization. J. Exp. Psychol. 1965, 70, 617–625. [Google Scholar] [CrossRef]
  4. Richardson, B.L.; Frost, B.J. Tactile localization of the direction and distance of sounds. J. Acoust. Soc. Am. 1979, 25, 336–344. [Google Scholar] [CrossRef] [PubMed]
  5. Frost, B.J.; Richardson, B.L. Tactile localization of sounds’ Acuity, tracking moving sources, and selective attention. J. Acoust. Soc. Am. 1976, 25, 907–914. [Google Scholar] [CrossRef] [PubMed]
  6. Moua, K.; Kan, A.; Jones, H.G.; Misurelli, S.M.; Litovsky, R.Y. Auditory motion tracking of adults with normal hearing and with bilateral cochlear implants. J. Acoust. Soc. Am. 2019, 145, 2498. [Google Scholar] [CrossRef]
  7. Weisenberger, J.M.; Miller, J.D. The role of tactile aids in providing information about acoustic stimuli. J. Acoust. Soc. Am. 1987, 82, 906–916. [Google Scholar] [CrossRef]
  8. Gescheider, G.A. Some comparisons between touch and hearing. IEEE Trans. Man-Mach. Syst. 1970, 11, 28–35. [Google Scholar] [CrossRef]
  9. Sherrick, C.E. Basic and applied research on tactile aids for deaf people’ progress and prospects. J. Acoust. Soc. Am. 1983, 75, 1325–1342. [Google Scholar] [CrossRef]
  10. Weisenberger, J.M.; Heidbreder, A.F.; Miller, J.D. Development and preliminary evaluation of an earmold sound-to-tactile aid for the hearing-impaired. J. Rehabillitation Res. Dev. 1987, 24, 51–66. [Google Scholar]
  11. Rinker, M.A.; Craig, J.C. Amplitude and period discrimination of haptic stimuli. J. Acoust. Soc. Am. 1998, 104, 453–463. [Google Scholar] [CrossRef]
  12. Caclin, A.; Faraco, S.S.; Kingstone, A.; Spence, C. Tactile “capture” of audition. Percept. Psychophys. 2002, 64, 616–630. [Google Scholar] [CrossRef] [Green Version]
  13. Roder, B.; Bruns, P. Tactile capture of auditory localization ‘ an event-related potential study. Eur. J. Neurosci. 2010, 31, 1844–1857. [Google Scholar]
  14. Liang, Z.; Ma, X.; Dai, X. Robust tracking of moving sound source using multiple model kalman filter. Appl. Acoust. 2008, 69, 1350–1355. [Google Scholar] [CrossRef]
  15. Valin, J.M.; Michaud, F.; Rouat, J. Robust localization and tracking of simultaneous moving sound sources using beamforming and particle filtering. Robot. Auton. Syst. 2007, 55, 216–228. [Google Scholar] [CrossRef] [Green Version]
  16. Samaragdis, P.; Boufounos, P. Position and trajectory learning for microphone arrays. IEEE Trans. Audio Speech Lang. 2007, 15, 358–368. [Google Scholar] [CrossRef]
  17. Argentieri, S.; Danes, P.; Soueres, P. A survey and sound source localization in robotics from binaural to array processing methods. Comput. Speech Lang. 2015, 34, 87–112. [Google Scholar] [CrossRef] [Green Version]
  18. Okuno, H.G.; Nakadai, K.; Lourens, T.; Kitano, H. Sound and visual tracking for humanoid robot. Appl. Intell. 2004, 20, 253–266. [Google Scholar] [CrossRef]
  19. Wang, D.; Brown, G.J. Computational Auditory Scene Analysis—Principles, Algorithms, and Applications; John Wiley &Sons Inc.: Hoboken, NJ, USA, 2006. [Google Scholar]
  20. Zannini, C.M.; Parisi, Z.; Uncini, A. Binaural sound source localization in the presence of reberberation. In Proceedings of the 2011 17th International Conference on Digital Signal Processing (DSP), Corfu, Greece, 6–8 July 2011; pp. 1–6. [Google Scholar]
  21. Youssef, K.; Argentieri, S.; Zarader, J.L. A binaural sound source localization method using auditive cues and vision. In Proceedings of the 2012 IEEE International Conference on Acoustics, Speech and Signal Processing (ICASSP), Kyoto, Japan, 25–30 March 2012; pp. 217–220. [Google Scholar]
  22. Rascon, C.; Meza, I. Localization of sound sources in robotics: A review. Robot. Auton. Syst. 2017, 96, 184–210. [Google Scholar] [CrossRef]
  23. Ho, C.; Spence, C. Head orientation biases tactile localization. Brain Res. 2007, 1144, 136–141. [Google Scholar] [CrossRef]
  24. Perez-Pena, F.; Cerezuela-Escudero, E.; Jimennez-Fernandez, A.; Morgado-Estevez, A. Live demonstration: Real-time neuro-inspired sound source localization and tracking architecture applied to a robotic platform. In Proceedings of the 2018 IEEE International Symposium on Circuits and Systems (ISCAS), Florence, Italy, 27–30 May 2018; p. 1. [Google Scholar]
  25. Funahashi, M.; Nakamura, T.; Kanoh, K.; Yamada, K. Haptic communication robot for urgent notification of hearing-impaired people. In Proceedings of the 2016 11th ACM/IEEE International Conference on Human-Robot Interaction (HRI), Christchurch, New Zealand, 7–10 March 2016; pp. 7–10. [Google Scholar]
  26. Ross, D.A.; Blasch, B.B. Wearable interfaces for orientation and wayfinding. In Proceedings of the Fourth International ACM Conference On Assistive Technologies, Arlington, VA, USA, 13–15 November 2000; pp. 193–200. [Google Scholar]
  27. Spelmezan, D.; Jacobs, M.; Hilgers, A.; Borchers, J. Tactile motion instructions for physical activities. In Proceedings of the SIGCHI Conference on Human Factors in Computing Systems, Boston, MA, USA, 4–9 April 2009. [Google Scholar]
  28. Yatani, K.; Banovic, N.; Khai, N. Truong, SpaceSence: Representing geographical information to visually impaired people using spatial tactile feedback. In Proceedings of the SIGCHI Conference on Human Factors in Computing Systems, Austin, TX, USA, 5–10 May 2012. [Google Scholar]
  29. Jiang, I.; Ishikawa, Y.; Lindsay, J.; Hannaford, B. Design and optimization of support structures for tactile feedback. In Proceedings of the 2013 World Haptics Conference (WHC), Daejeon, Korea, 14–17 April 2013. [Google Scholar]
  30. Vaijapurkar, V.B.; Ravinder, Y. A survey on recent trends and technologies in tactile interfaces with sensing perspective. In Proceedings of the 2015 Annual IEEE India Conference (INDICON), New Delhi, India, 17–20 December 2015. [Google Scholar]
  31. Khin, P.M.; Low, J.H.; Lee, W.W.; Kukreja, S.L.; Ren, H.L.; Thakor, N.V.; Yeow, N.V. Soft haptics using soft actuator and soft sensor. In Proceedings of the 2016 6th IEEE International Conference on Biomedical Robotics and Biomechatronics (BioRob), Singapore, 26–29 June 2016. [Google Scholar]
  32. Honda, T.; Okamoto, M. User interface design of sound tactile. In Lecture Note in Computaer Science in Computer Helping People with Special Needs; Springer: Cham, Switzerland, 2014; Volume 8548, pp. 382–385. [Google Scholar]
  33. Klatzky, R.L.; Lederman, S.J. Tactile roughness perception with a rigid ink interposed between skin and surface. Percept. Psychophys. 1999, 61, 591–607. [Google Scholar] [CrossRef] [PubMed]
  34. Ivanenko, Y.P.; Lacquaniti, F. Influence of leg muscle vibration on human walking. J. Neurophysiol. 2000, 84, 1737–1747. [Google Scholar] [CrossRef] [PubMed]
  35. Tsukada, K.; Yasumura, M. Active belt: Belt-type wearable tactile display for directional navigation. In International Conference on Ubiquitous Computing; Springer: Berlin/Heidelberg, Germany, 2004; pp. 384–399. [Google Scholar]
  36. Bujnowski, A.; Drozd, M.; Kowalik, R.; Wtorek, J. A tactile system for informing the blind on direction of a walk. In Proceedings of the 2008 Conference on Human System Interactions, Krakow, Poland, 25–27 May 2008. [Google Scholar]
  37. Bousbia-Salah, M.; Bettayeb, M.; Larbi, A. A navigation aid for blind people. J. Intell. Robot. Syst. 2011, 64, 387–400. [Google Scholar] [CrossRef]
  38. Pfeiffer, M.; Dunte, T.; Schneegass, S.; Aly, F.; Rohs, M. Cruise control for pedestrians’ controlling walking direction using electrical muscle stimulation. In Proceedings of the 33rd Annual ACM Conference on Human Factors in Computing Systems, Seoul, Korea, 18–23 April 2015; p. 2505. [Google Scholar]
  39. Shimoyama, R. Wearable hearing assist system to provide hearing-dog functionality. Robotics 2019, 8, 49. [Google Scholar] [CrossRef] [Green Version]
  40. Shimoyama, R.; Fukuda, R. Room volume estimation based on ambiguity of short-term interaural phase differences using humanoid robot head. Robotics 2016, 5, 16. [Google Scholar] [CrossRef] [Green Version]
  41. Shimoyama, R.; Ishituka, S. Motion detection of a motorcycle approaching from behind using head and torso simulator. In Proceedings of the 2019 10th IEEE International Conference on Intelligent Data Acquisition and Advanced Computing Systems: Technology and Applications (IDAACS), Metz, France, 18–21 September 2019; p. 448. [Google Scholar]
  42. Shimoyama, R.; Yamazaki, K. Acoustic source localization using phase difference spectrum images. Acoust. Sci. Technol. 2003, 24, 161–171. [Google Scholar] [CrossRef] [Green Version]
Figure 1. Schematic diagram of pressure waveforms detected by left and right microphones. Comparing phases of left and right sound pressure waveforms, left waveform is delayed by ∆φ or ∆φ + 2π due to waveform periodicity.
Signals 02 00030 g001
Figure 2. (a) Example of frequency response of interaural time difference when sound source is located at 140° behind and to the left, and (b) corresponding histogram. In this example, time difference between ears is 360 μs.
Signals 02 00030 g002
Figure 3. Relationship between interaural time difference and direction of sound source obtained experimentally.
Signals 02 00030 g003
Figure 4. Frequency characteristics of (a) short-time interaural phase difference of sound pressure and (b) standard deviation, when calculating standard deviation of the data in frequency band Δ f while changing center frequency f i . ©(2021) IEEE, Reprinted, with permission.
Signals 02 00030 g004
Figure 5. Relationship between mean value of standard deviation and distance to sound source was obtained experimentally; then, the distance to the sound source was estimated from the standard deviation value using this graph.
Signals 02 00030 g005
Figure 6. Directional characteristics of mean standard deviation. Radial axis represents mean value of standard deviation (in degrees). It can be seen that this value is relatively low when the sound source is located either directly in front (180°) or directly behind (0°) and becomes higher as the sound source locates to the side. ©(2021) IEEE, Reprinted, with permission.
Signals 02 00030 g006
Figure 7. Configuration of hearing assist system.
Signals 02 00030 g007
Figure 8. Appearance of hearing assist system.
Signals 02 00030 g008
Figure 9. (a) Appearance of a vibrator and (b) placement of vibrators attached to the back of a vest.
Signals 02 00030 g009
Figure 10. Relationship between input voltage of vibrator and vibration amplitude of plastic plate glued to speaker driver.
Signals 02 00030 g010
Figure 11. Relationship between time difference between two ears and X-shaped voltage output from FPGA module to left and right vibrators. Output voltage to the vibrator on the left side increased proportional to time difference between ears and decreased inversely on the right side.
Signals 02 00030 g011
Figure 12. Relationship between average value of standard deviation and output voltage of vibrators. If mean value of standard deviation (closer to the sound source) is smaller, the vibration intensity of the vibrators is stronger.
Signals 02 00030 g012
Figure 13. Flowchart of hearing assistance system including subject’s movement (colored).
Signals 02 00030 g013
Figure 14. Schematic diagram of experiment. We examined whether the subject, wearing an eye mask, could track a loudspeaker fixed on a linearly moving platform and crossing a point 2 m away. The subject was instructed to turn his face in the direction where the vibration intensity of both vibrators was equal.
Signals 02 00030 g014
Figure 15. Experimental results: (a) time variation of time difference between the two ears, (b) time variation of mean value of standard deviation, and (c) output voltage to left and right vibrators.
Signals 02 00030 g015
Publisher’s Note: MDPI stays neutral with regard to jurisdictional claims in published maps and institutional affiliations.

