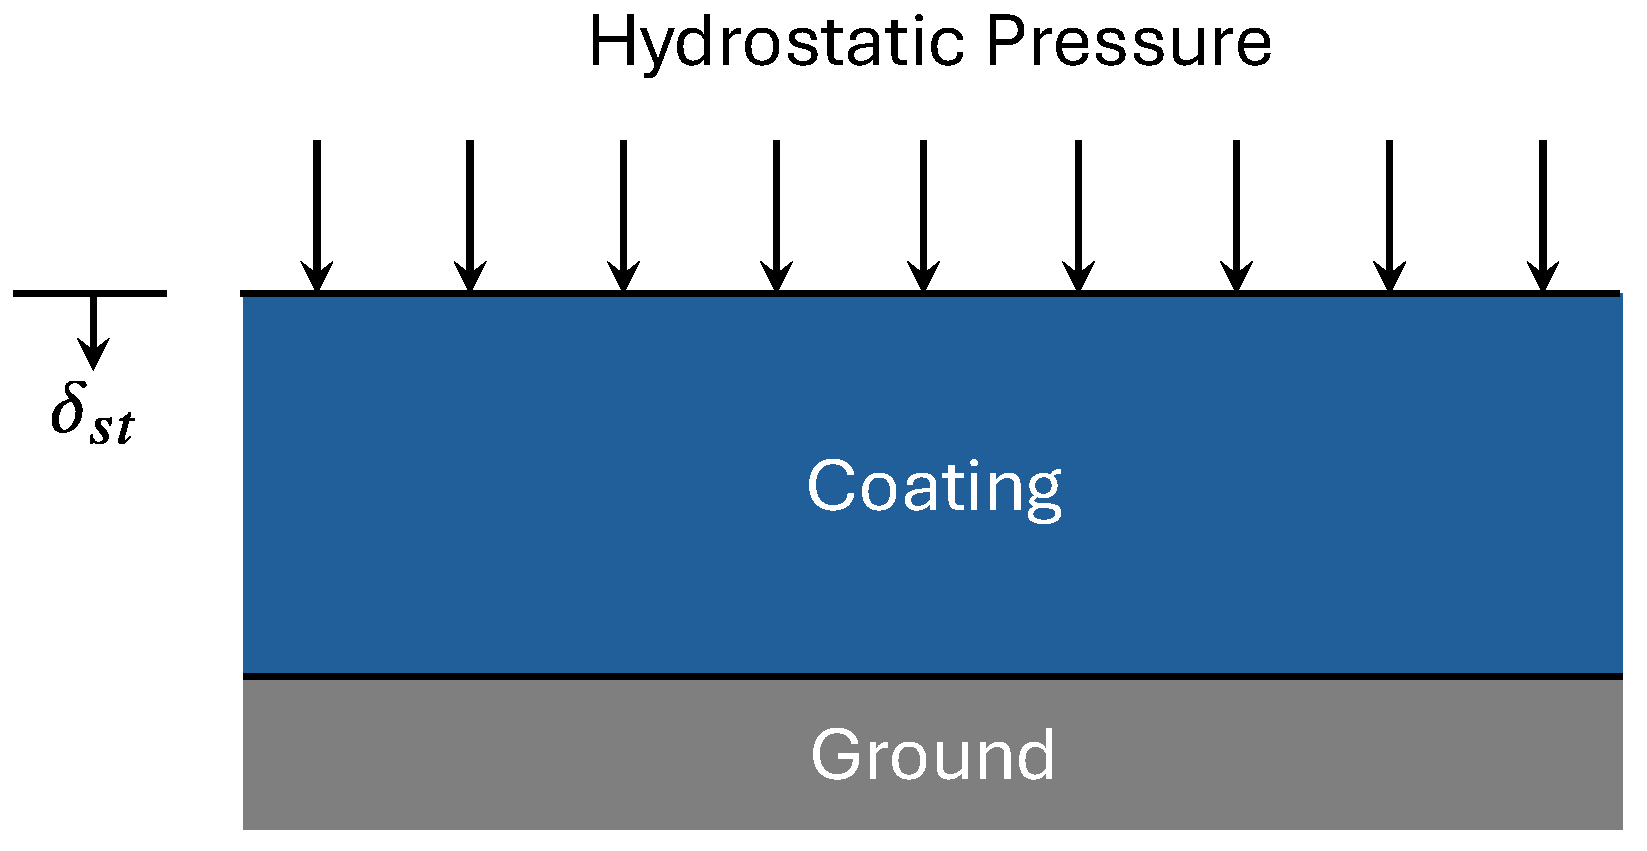
1. Introduction
The quest for effective underwater sound absorption has gained significant attention due to its implications for maritime operations, environmental protection, and marine life conservation. Coatings that absorb underwater sound are engineered to mitigate the adverse effects of marine noise pollution [
1], enhance stealth for covert operations [
2], and prevent sonar interference [
3]. Fundamentally, they function through the principles of acoustic impedance matching between the surrounding water and the coating material. Typical materials used in these coatings include polymers, composites, and advanced metamaterials. A review of research on acoustic metamaterials is given in [
4], and a review of research on underwater acoustic metamaterials is given in [
5]. A notable approach employs rubber or polyurethane as a matrix material, designed to dissipate sound energy effectively by ensuring that the acoustic impedance of the coating closely matches that of seawater [
6,
7].
Recent studies, such as those by Zhang et al. [
8], delineate the evolution of sound absorption mechanisms in these coatings, identifying key features like cavity structures, composite materials, and impedance-matching architectures that adapt over time to enhance absorption efficiency. This evolution signals an increasing sophistication in material design, which hinges on a robust understanding of acoustic wave dynamics within various media. The advent of nanotechnology has allowed for a new class of coatings that leverage carbon nanotubes (CNTs) and graphene, which have shown considerable promise in improving sound absorption stability under various environmental conditions, including high hydrostatic pressures [
9,
10]. Fu et al. [
11] focused on the numerical design and optimization of metamaterials tailored for sound absorption under hydrostatic pressure. Such innovations indicate that metamaterial-based coatings could soon play a central role in enhancing the stealth capabilities of underwater vehicles, reflecting the ongoing demand for advanced acoustic control in marine environments. Jia et al. [
7] highlight the critical role of anechoic coatings in reducing noise generated by vessels, ultimately protecting marine ecosystems. As the research landscape continues to evolve, interdisciplinary collaborations among materials science, marine biology, and acoustics will be essential in overcoming the existing barriers.
While numerous optimized designs have been proposed, they often focus on narrowband performance or specific configurations. These studies imply a broader goal: achieving perfect or near-perfect absorption across a wide frequency band. However, this overlooks two key realities. First, perfect broadband absorption is physically unattainable with thin coatings under realistic conditions. Second, many proposed designs neglect practical constraints such as hydrostatic pressure, mechanical durability, and weight.
Despite a wide array of approaches, a fundamental question remains unanswered: What is the best achievable sound absorption for an underwater coating? This paper addresses that gap. The present work answers that fundamental question under two key conditions: (1) the assumption of linearity and (2) the presence of typical underwater design constraints. Rather than proposing a new material or structure, a theoretical upper bound on acoustic absorption performance is established. To answer this question, the coating layer is modeled by mass, spring, and damping elements. An optimization is implemented around the system parameters to maximize absorption across a prescribed frequency range and under reasonable design constraints. The resulting benchmark serves as a universal performance target—a metric against which current and future designs can be objectively evaluated.
3. Assumptions and Limitations
The analytical framework outlined in the following sections makes simplifying assumptions to provide tractable yet physically meaningful descriptions of the primary absorption physics while allowing derivation of closed-form bounds and efficient global optimization. By stating the underlying assumptions explicitly, this section aims to clarify the regime over which the derived performance bounds are valid and identify the physical effects that are intentionally omitted.
3.1. Assumptions
The analytical procedures presented in this work rely on simplified descriptions of the acoustic coating using one-dimensional lumped parameter models. Eliminating complexities by grouping coating properties into a collection of rigid masses, ideal springs and dashpot elements facilitates fast and efficient solutions whose usefulness has long been established for investigating first-order effects of dynamic systems [
13]. The principal assumptions inherent in the preceding analysis include the following:
3.1.1. One-Dimensional Modeling
The present framework treats the coating as a one-dimensional system experiencing purely longitudinal acoustic excitations (i.e., only wave propagation in the thickness direction is considered).
3.1.2. Normal-Incidence, Plane-Wave, Steady-State Harmonic Excitation
Far-field (Fraunhofer) assumptions are adopted to consider only plane waves in the acoustic field. Calculation of the reflection coefficient further assumes wave impingement perpendicular to the surface of a planar coating. Transient conditions are excluded from consideration.
3.1.3. Linear Acoustic Theory
The acoustic field is governed by the linearized wave equation, and acoustic pressure is treated as small-amplitude perturbations about a hydrostatic equilibrium.
3.1.4. Long Wavelength Limit
The coating thickness is assumed small compared to the acoustic wavelength such that it may be collapsed into discrete elements that reasonably describe the dynamic system.
3.1.5. Linear, Time Invariance
The coating is represented (for a given set of design variables) by a network of masses, linear springs and linear dashpots whose properties do not change with time. The governing behavior is defined by linear ordinary differential equations. Superposition holds and the mechanical impedance is frequency-dependent but amplitude-independent. Properties of the ambient acoustic medium are considered stationary as well.
3.1.6. Memoryless and Causal
The coating system is assumed to have no memory (i.e., output at any time depends only on input at the same time) and is causal (i.e., output depends only on the present value of input).
3.1.7. Rigid, Grounded Backing
The submerged structure behind the coating is represented as an immovable support (i.e., assumed as a motionless, rigid backing).
3.1.8. Viscous Damping
Energy dissipation is modeled as a simple velocity-proportional loss term; dashpots are characterized by a constant coefficient that is frequency independent. Although a dashpot converts mechanical work into heat, the resulting temperature rise and its effect on material parameters are ignored.
3.2. Limitations
The lumped parameter method is meant to be general enough to encompass a wide range of acoustic coatings with dominant loss mechanisms that can be expressed by equivalent mechanical impedances in the normal direction; coatings incorporating viscoelastic layers, Helmholtz resonators, or resonant inclusions are some examples of systems that translate well to the mathematical descriptions that follow. However, there are many other coating technologies that cannot be treated within the confines of this framework, such as those that rely on mode conversion (i.e., that transform incident longitudinal waves into shear or flexural waves) or other multidimensional wave phenomena such as scattering and diffraction. As a consequence of the assumptions inherent in the analysis, there are a number of conditions that also cannot be treated by the modeling framework: oblique wave impingement and edge effects; material, geometric, and contact nonlinearities; hysteretic damping; shape memory effects; and environmental considerations such as hygrothermal effects, biofouling, corrosion, aging and environmental degradation.
4. Computing Acoustic Reflection
It is assumed that a time-harmonic acoustic wave is normally incident on the coating and that steady-state response is desired. Any time-dependent variable
is expressed using complex exponential time dependence,
where
is radian frequency,
is the complex amplitude, and * indicates the complex conjugate. In all that follows, a bold-faced character represents a complex variable.
The coating is modeled as a collection of
N discrete masses connected to ground and to each other by springs and dashpots. The dynamics of the coating are represented using a mechanical impedance matrix given by
where
,
, and
are the mass, damping, and stiffness matrices, respectively. These may be found from classical analysis [
12]. The impedance matrix relates the velocities
to the applied forces
as [
14] according to
Free body diagrams of the
N masses can be used to formulate the
N differential equations of motion and the system matrices are assembled from the linear system of equations.
Equation (
12) is used to determine the specific mechanical impedance at the fluid-coating interface; for the analytical procedure that follows, the index corresponding to the degree of freedom (DOF) at this interface will be 1. The corresponding first element of the force vector
is
, which physically represents an unknown external force acting at the fluid-coating interface and applied by the fluid. All other elements of
are set to zero because no external forces are acting at those nodes. Equation (
12) is used to solve for
. The first element of this vector is
. Defining a reference area
A, the normal specific impedance of the material seen by the fluid is
where
is the acoustic pressure acting on the surface of the coating.
If an acoustic plane wave with complex amplitude
is normally incident on the coating, a reflected wave is created with complex amplitude
. The reflection coefficient in this case is
Analysis shows that the reflection coefficient is [
15]
where
is given in Equation (
13). The symbol
denotes the acoustic impedance of a plane wave given by
where
c is the sound speed. The absorption coefficient is defined as
Therefore, the reflection and acoustic absorption coefficients are computed as follows:
Define the lumped parameters , , and .
Compute the mass matrix , stiffness matrix , and damping matrix .
Compute the mechanical impedance matrix
using Equation (
11).
Compute the normal specific impedance
using Equations (
12) and (
13).
Compute the reflection coefficient
using Equations (
15) and (
16).
Compute the absorption coefficient
using Equation (
17).
The analysis given above can be used to analytically determine the normal specific impedance of a material that absorbs sound perfectly, such that
. The “perfect absorption” condition requires that
This equation shows that the perfectly absorbing material is one in which the sum of inertial and stiffness effects vanishes, such as at mechanical resonance, and the dashpot matches the acoustic impedance. It is unrealistic to expect that the imaginary part of
will vanish entirely over a broad frequency range due to the finite number of resonances in the coating.
5. Analysis of One Degree of Freedom (1-DOF) Systems
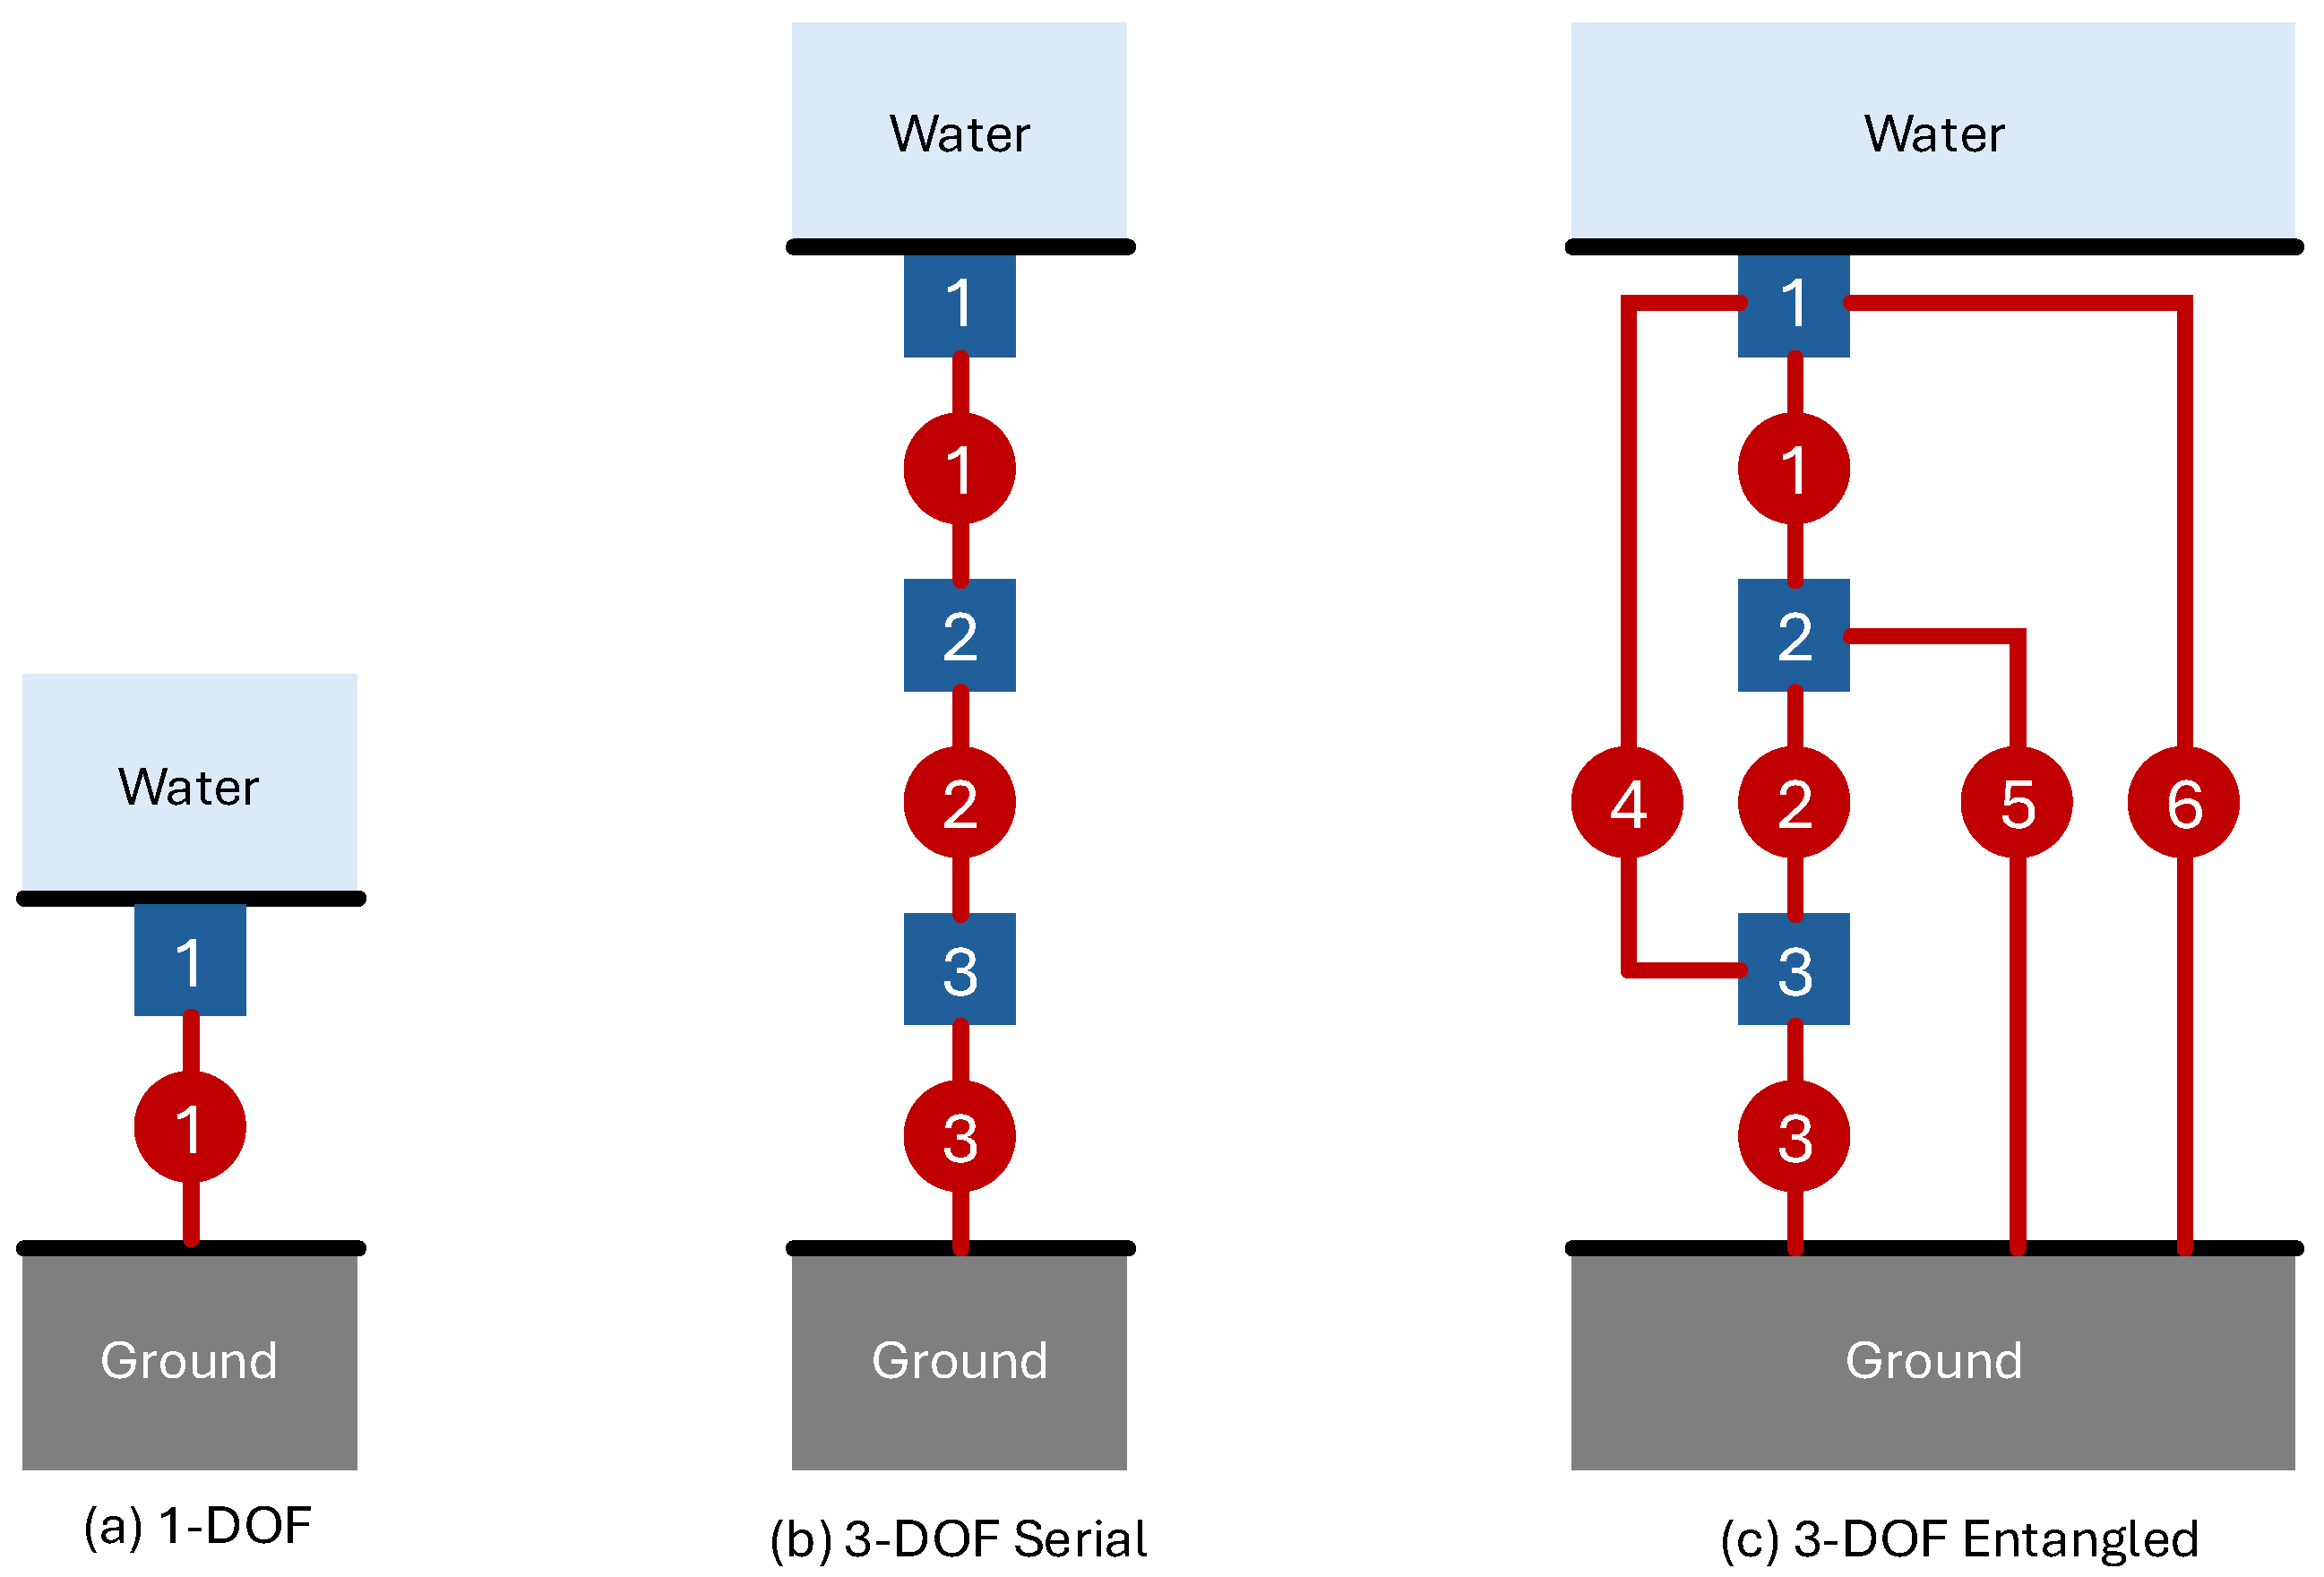
Schematic (a) in
Figure 2 shows a 1-DOF model comprised of a single mass
m connected to ground by a parallel combination of spring
k and dashpot
d. Using the analysis in the previous section, it is easily shown that normal impedance for this system is
Substituting Equation (
19) into Equation (
15) gives the reflection coefficient
Three important regimes are derived from Equation (
20) for the case where
where
is the undamped natural frequency given by
Three designs may be easily created by visual inspection of Equation (
20). The first of these is a single dashpot with no mass or spring, given by
This design gives a zero reflection coefficient across an infinite frequency range. However, the lone dashpot cannot reset itself to its nominal position.
This shortcoming motivates the second design. The dashpot value is unchanged but a spring is added so that the coating can reset itself. According to Equation (
20), a mass is needed to cancel out the stiffness term. However, this cancellation can only occur at a fixed frequency, which is the natural frequency of the spring-mass system,
. Therefore, the mass is
This design solves the reset problem but only gives perfect absorption at
. The design does not necessarily satisfy the design constraints, which motivates the third design.
The third design satisfies the design constraints while minimizing the reflection coefficient. As before, the dashpot constant is chosen as
This choice eliminates the real part of the numerator in Equation (
20). The design constraints give unique values for the spring constant and mass. The displacement constraint in Equation (
5) gives an analytic expression for the spring constant
and the mass constraint in Equation (
9) gives an analytic expression for the coating mass
This design has an undamped resonance given by Equation (
24) and therefore delivers perfect absorption at
. Substituting the spring and mass values in Equations (
30) and (
31) into the resonance equation in Equation (
24) gives
Henceforth, we shall refer to the choices in Equations (
29)–(
31) as the “1-DOF model”.
6. Analysis of Multi Degree of Freedom (MDOF) Systems
Schematics (b) and (c) in
Figure 2 show two 3-DOF models that will be analyzed here and used for examples in the following section. The terms “serial” and “entangled” are chosen to reflect the connectivities of the inertial elements. The serial example is a collection of masses, each connected to the nearest neighbor by a parallel combination of spring and dashpot. Mass 3 is additionally connected to ground in a similar manner. The entangled model comprises masses that are completely interconnected by parallel combinations of springs and dashpots, such that all DOFs are coupled by and grounded by parallel combinations of springs and dashpots. Standard analysis [
12] shows that the mass, stiffness, and damping matrices are
for the serial system and
for the entangled system.
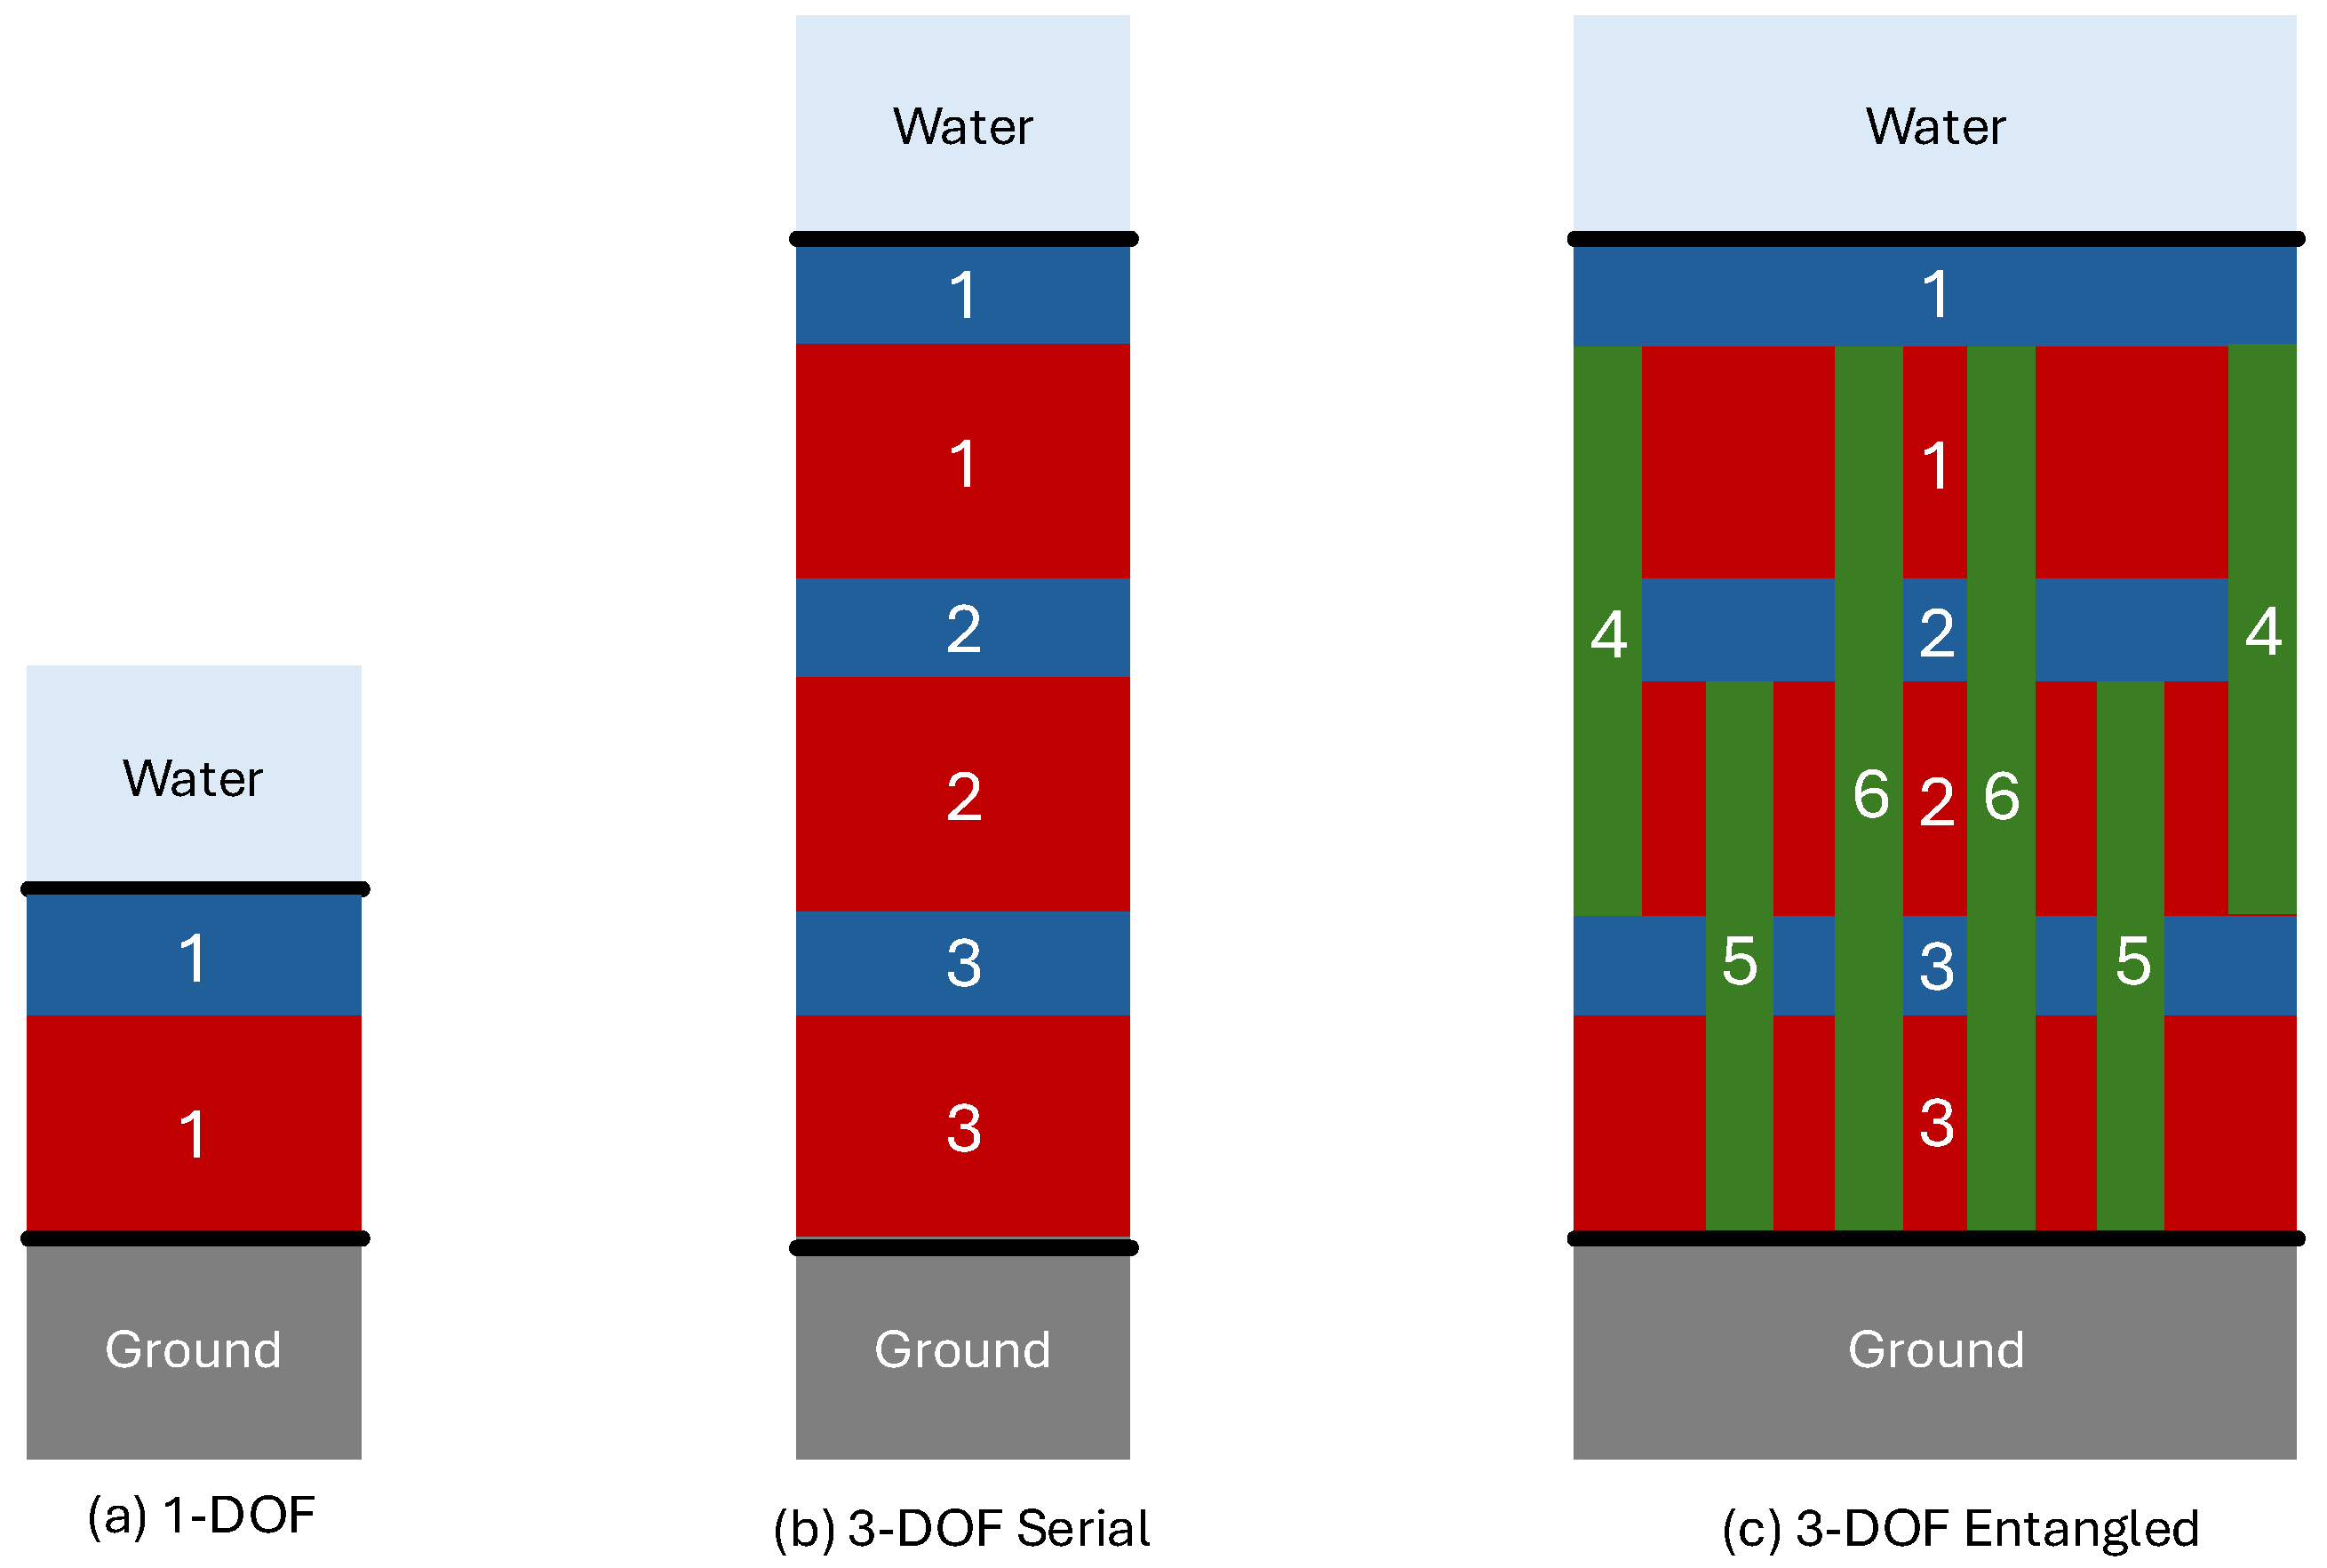
One fabrication possibility for the schematics in
Figure 2 is shown in
Figure 3. In these schematics, red and green rectangles represent soft and light viscoelastic materials that dynamically behave the same as the stiffness and damping represented by the lumped elements
k and
c, respectively, acting in parallel. The blue rectangles represent stiff and heavy materials that dynamically behave the same as the lumped mass element
m. Rotational effects are ignored. The green rectangles pass through some masses without being coupled to them, which can be achieved by creating tunnels through the uncoupled masses. For example, the green rectangle numbered 5 connects mass 2 to ground by passing through mass 5. This pass-through is achieved by creating a tunnel through mass 5 so that mass 5 is unaffected by the green rectangle numbered 5.
7. Design by Particle Swarm Optimization
Our approach uses Particle Swarm Optimization (PSO) followed by nonlinear programming. PSO is frequently utilized in various optimization scenarios due to its strengths in handling complex and high-dimensional problems, particularly in real-time applications such as power systems and robotics. One of the primary advantages of PSO is its ability to efficiently navigate non-convex solution spaces and avoid local optima, a challenge that often arises with traditional optimization methods, including nonlinear programming techniques. As highlighted by [
16], PSO leverages swarm intelligence, allowing collaboration among particles (potential solutions) to explore the solution space effectively, thus providing a solution to problems that may confound analytic methods due to slow convergence rates and dimensionality challenges [
16]. Moreover, PSO’s straightforward implementation and fewer parameters to tune can make it a more flexible and user-friendly option compared to more complicated nonlinear programming algorithms, which often require the specification of gradients and constraints that can complicate the optimization process [
17].
However, despite its benefits, the use of PSO can also present challenges such as premature convergence and sensitivity to initial conditions, which may lead to suboptimal solutions [
18]. To mitigate such limitations, integrating PSO with nonlinear programming techniques can harness the exploration capabilities of PSO while benefiting from the precise convergence characteristics of deterministic methods. This hybrid approach allows for the exploration stage to be managed effectively by PSO, while nonlinear programming can refine solutions to meet specific constraints and optimality conditions, yielding solutions that are both globally informed and locally optimized [
16]. Thus, implementing PSO alongside nonlinear programming facilitates a robust solution framework adept at addressing complex and dynamic optimization problems across various fields. Therefore, results presented here were generated in MATLAB (Version R2024A) using PSO followed by nonlinear programming.
For generality, we present an optimization strategy for our model with the following numbers of design parameters:
All design parameters are collected in a real-valued vector
of length
. The optimization problem is defined as
subject to the constraints of Equations (
5) and (
9). Maximum acoustic absorption is achieved by minimizing the magnitude of the reflection coefficient. Therefore, the cost function
is chosen as the root mean square of the reflection coefficient magnitude,
, over a discrete set of
S frequencies,
Other cost functions and optimization algorithms are possible but not explored here.
The constraints must be included in a way that is consistent with the PSO Algorithm. The displacement and mass constraints have a mathematical form that typically does not match the constraints allowed by the PSO Algorithm. Therefore, we created an approach that implicitly satisfies the constraints by embedding them directly in the calculation of the reflection coefficient. This approach may be extended to other optimization algorithms that do not explicitly allow for inclusion of displacement and mass constraint conditions.
The displacement constraint is imposed by allowing the PSO Algorithm to choose any set of stiffnesses. The set of stiffnesses chosen by the PSO Algorithm, which do not satisfy the displacement constraint, is denoted as
, where
. The static deflection for this assembly is computed using the analysis in
Section 2.1 and denoted as
. The set of stiffnesses that satisfy the displacement constraint and are used to compute the reflection coefficient is denoted as
, where
. In order to satisfy Equation (
5) for a specified displacement
, these sets are related by
where the scaling factor
is
Likewise, the mass constraint is imposed by allowing the PSO Algorithm to choose any set of masses. The set of masses chosen by the PSO Algorithm, which may violate the mass constraint, is denoted as
, where
. The set of masses that satisfy the mass constraint and are used to compute the reflection coefficient is denoted as
, where
. In order to satisfy Equation (
9) with a specified mass
, these sets are related by
where the scaling factor
is
The scalings in (
44) and (
46) are a precursor to the procedure described in
Section 4. As a final check, the conditions in Equations (
5) and (
9) are checked at the end of the optimization. There is no constraint that involves the dashpots, so the dashpots selected by the PSO Algorithm are not scaled in the calculation of the reflection coefficient.
8. Results and Discussion
For all results presented, the parameters constraining the PSO Algorithm are those listed in
Table 1. The optimization band of 1 Hz to 10,000 Hz was chosen to coincide with the dominant frequency ranges of common underwater sound sources, including commercial shipping (10 Hz to 200 Hz), seismic surveys (10 Hz to 300 Hz), and mid-frequency naval sonar (1000 Hz to 10,000 Hz) [
19,
20,
21]. Furthermore, for practical coating thicknesses, restricting the analysis to 10,000 Hz adheres to the long wavelength assumption of
Section 3.1.
The resulting performances and optimized design parameters are given in
Table 2. The first row of this table lists the Root Mean Squared (RMS) values of the reflection coefficient magnitudes. While the 3-DOF entangled model provides the lowest RMS reflection at 0.1947, the 3-DOF serial and 1-DOF models are very close at 0.1956 and 0.2034, respectively. This result is somewhat surprising given the large number of extra design parameters available in the 3-DOF entangled model. Perhaps even more surprising, the 1-DOF reflection coefficient curve is very close to both 3-DOF models. While this result is specific to the input parameters chosen, it illustrates the possibility of a relatively simple design to absorb sound almost as well as a more complicated design.
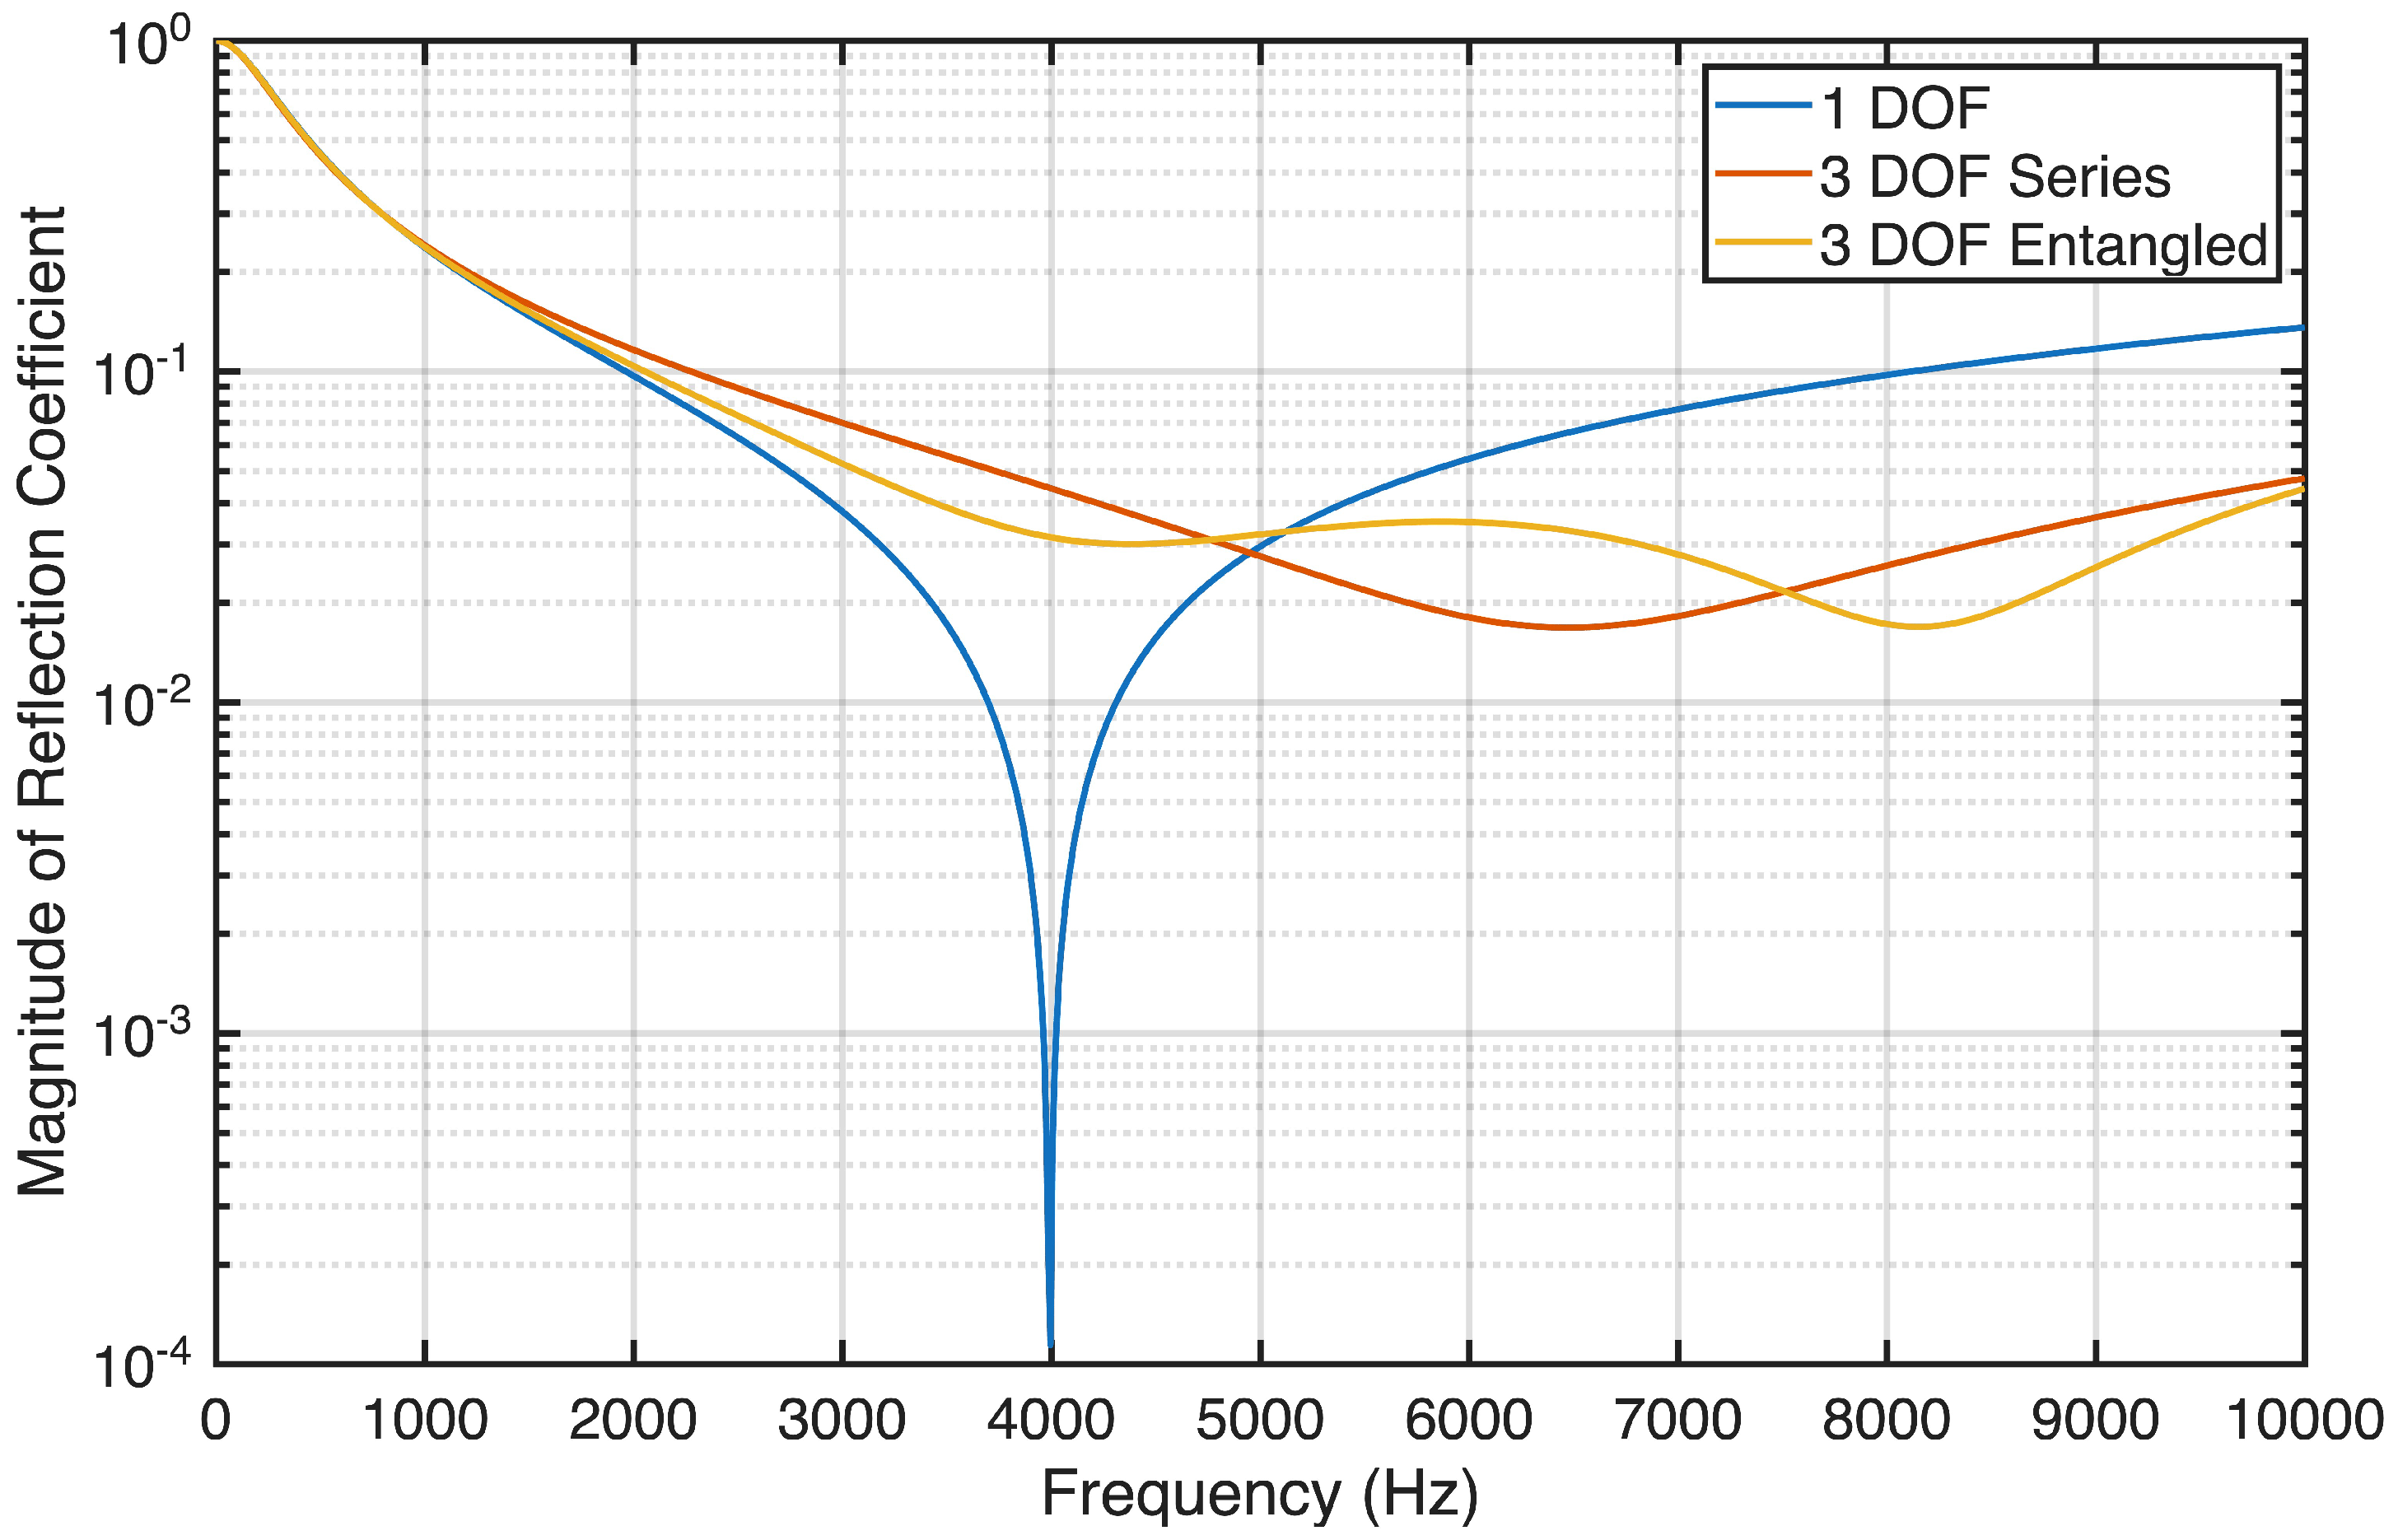
Figure 4 shows the frequency-dependent magnitudes of the reflection coefficients for the 1-DOF and 3-DOF models. Below about 1000 Hz, all models show similar behaviors. The 1-DOF model exhibits a deep minimum at its resonance frequency of 4000 Hz and therefore out-performs the 3-DOF models in the vicinity of this resonance. This minimum is predicted by Equation (
20). However, the 1-DOF model exhibits higher reflection coefficient values than the 3-DOF models above 6000 Hz. The limits in Equations (
21) and (
22) are clearly seen for the 1-DOF model; however, a larger frequency range would be necessary to see the high-frequency limit in Equation (
23).
The similar reflection coefficients of the 1-DOF and 3-DOF optimized models may be explained from a first-order physical understanding of the reflection problem. The low reflection coefficient achieved by the 1-DOF model resulted from having a structural resonance near the middle of the band (near 4000 Hz), so that mass and stiffness effects mostly canceled over the band and the structure was approximately a dashpot. By allowing the dashpot impedance to match the fluid impedance, most of the incident energy was absorbed. Adding more degrees of freedom, as in the 3-DOF models, only added structural resonances that could offer little improvement over the excellent cancellation of mass and stiffness effects already achieved by the 1-DOF model.
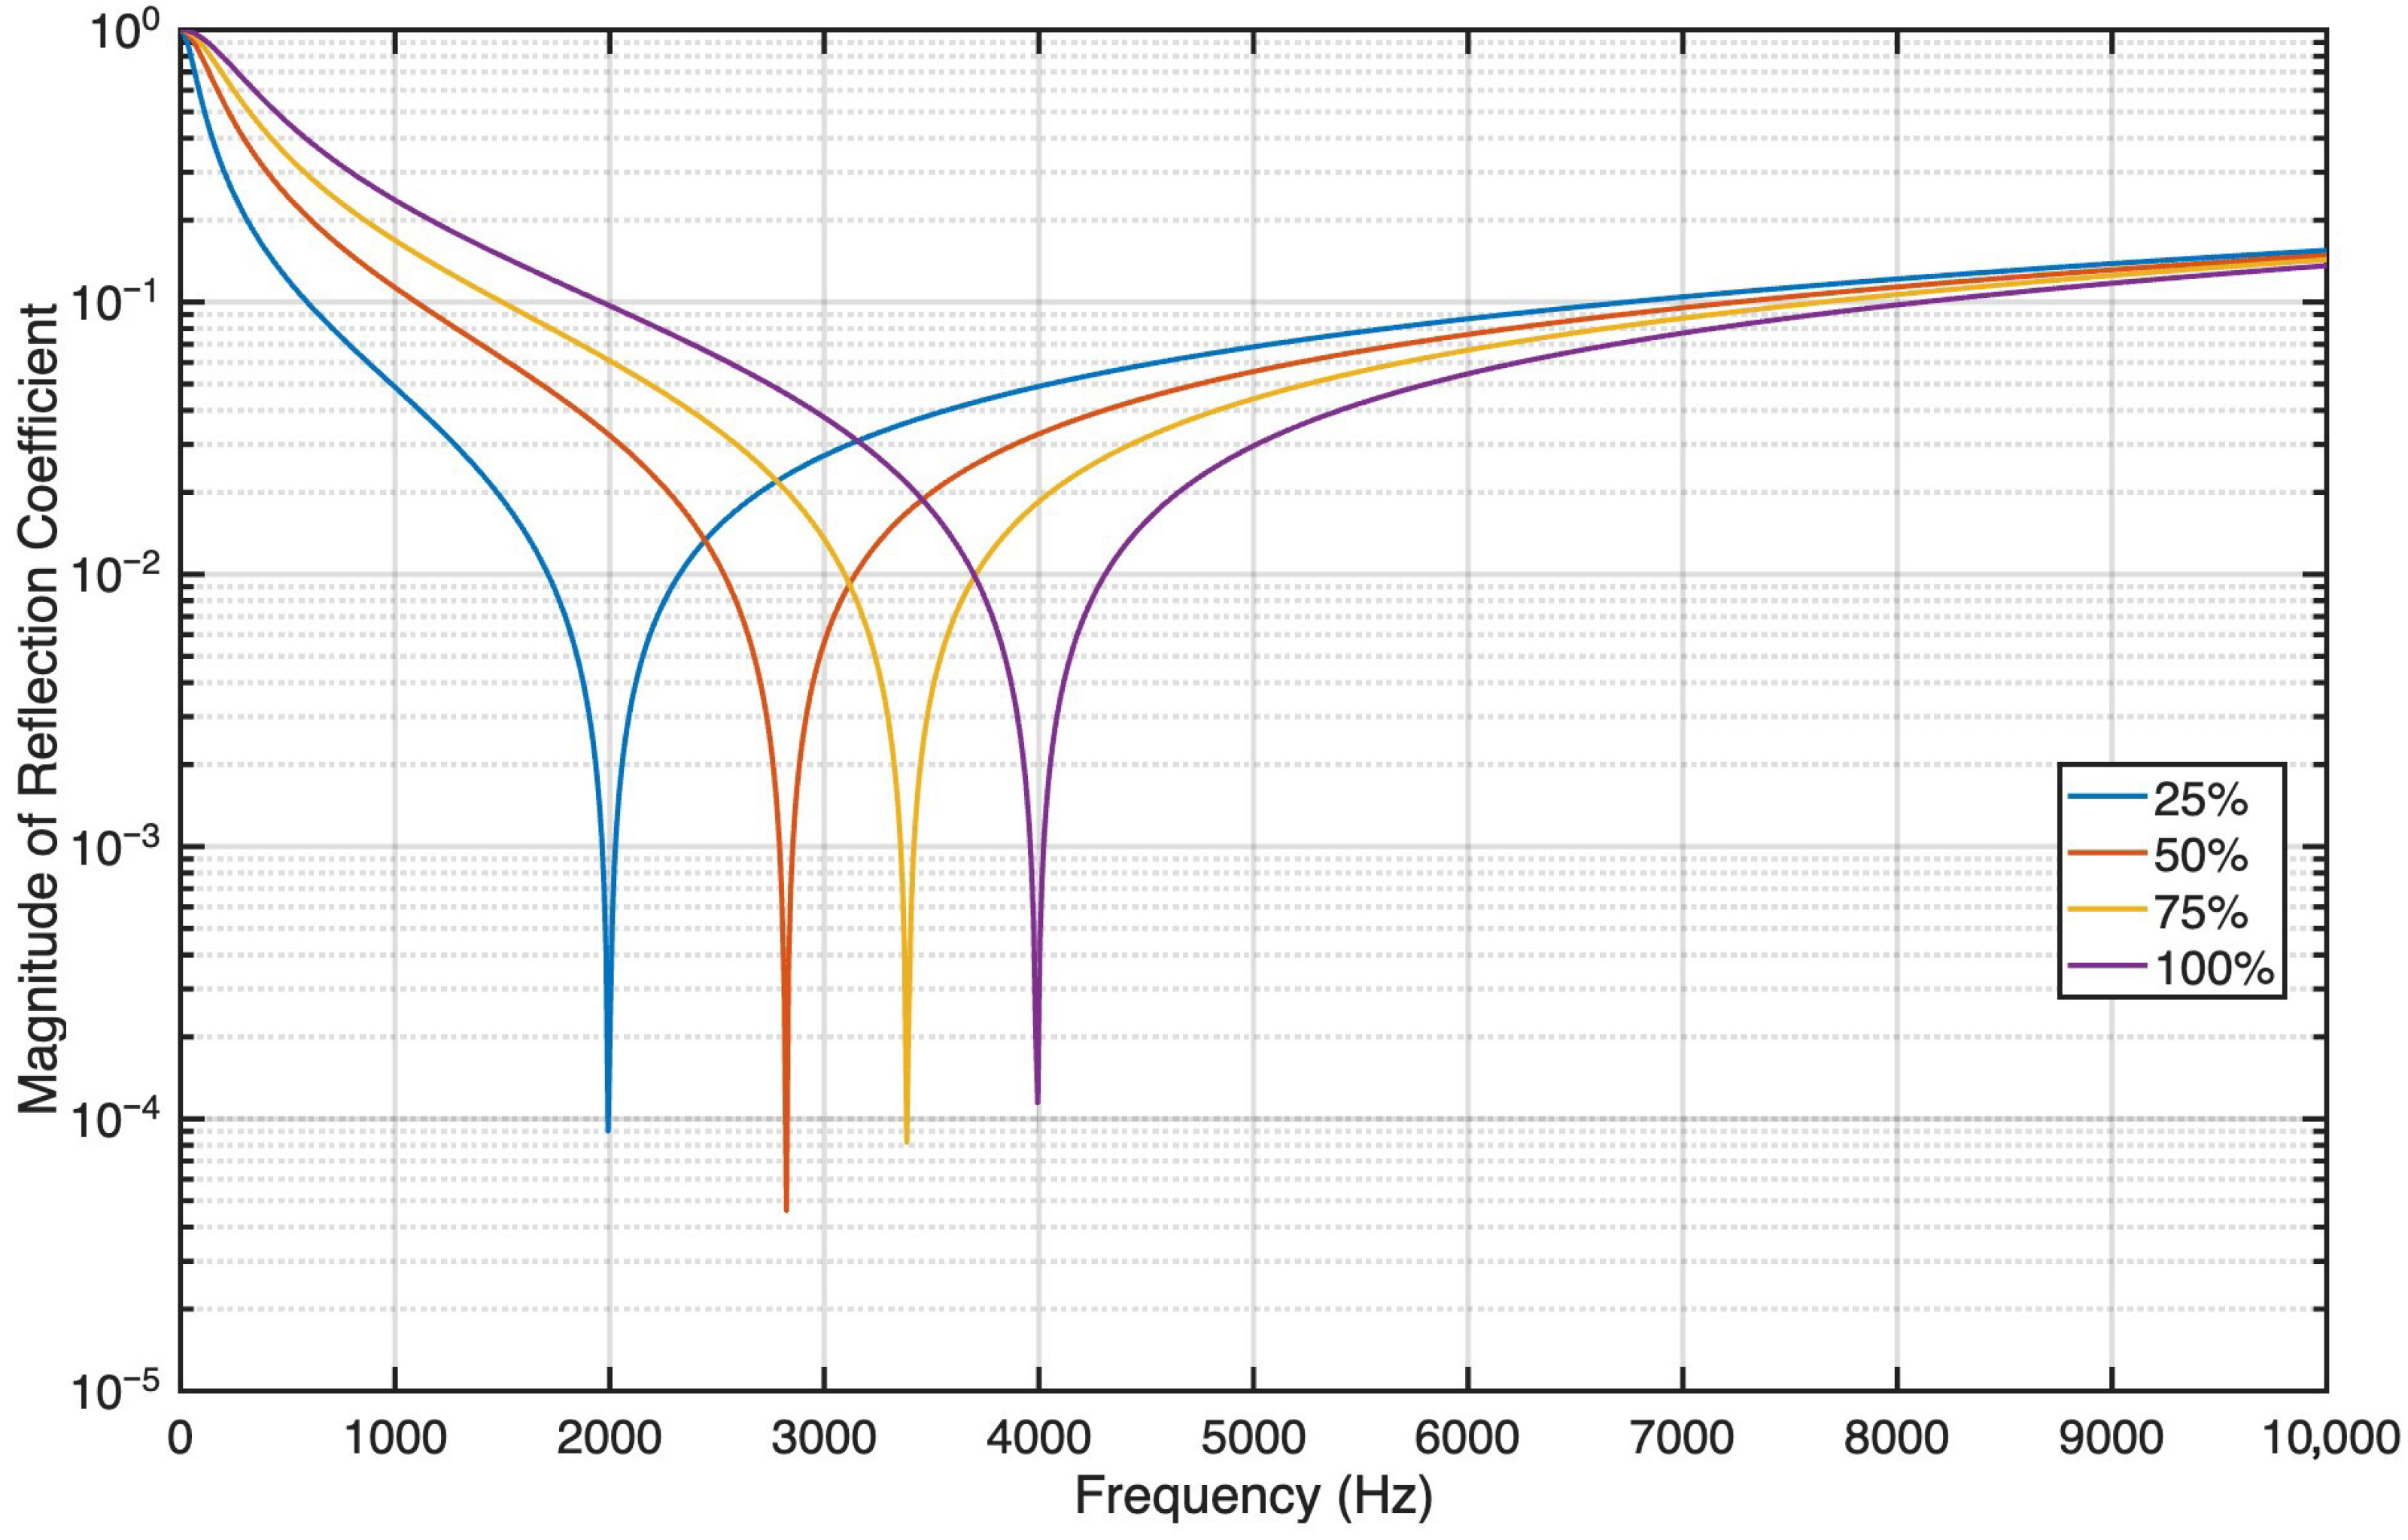
Figure 5 explores the effects of relaxing the displacement constraint for only the 1-DOF model. The motivation behind conducting this is to explore the associated decrease in reflection magnitude that would be possible if the static displacement could be controlled by means other than a linear spring. Specifically, we examine four spring constants that are lower than the one prescribed by Equation (
30) while keeping the mass constant according to Equation (
31). The value of each spring constant is expressed as a percentage of the spring constant defined in Equation (
30) that satisfies the displacement constraint. As expected, the resonance frequency is decreased as the spring constant is decreased. This results in significantly less reflection. For example, the magnitude of the reflection coefficient is below 0.2 when the spring constant is 25% and the frequency is above 500 Hz. With an RMS of 0.1314, this design offers a better performance than any other model considered here. The low-frequency limit in Equation (
21) is evident in the plots, as all of the designs approach a magnitude of 1 at low frequency.
Although other optimization methods such as Genetic Algorithm (GA) were tested; they were not adopted for the final analysis. GA yielded consistently higher values of the cost function, i.e., Equation (
43). For the 3-DOF serial case, GA produced an RMS of 0.2028, which corresponds to lower overall absorption compared with the PSO results. The discrepancy was even larger in the 3-DOF entangled case, where GA delivered much poorer performance than PSO with an RMS of 0.8771. These outcomes suggest that PSO is better suited for this class of problems in identifying globally optimal parameter sets under the imposed mass and displacement constraints.
9. Conclusions
The present work provides a framework for quantifying performance ceilings for acoustic absorption by coatings that are subject to typical underwater conditions. These performance ceilings are found by modeling the coating as a network of mass, stiffness, and damping elements. The complex 3-DOF designs presented here are only marginally better than the simple 1-DOF design; this would have profound implications if it extends in generality because it would reduce the cost, complexity, and difficulty of fabrication. For the 1-DOF design, we found that relaxing the displacement constraint, which allows for a lower stiffness, significantly increases the performance of the coating. Therefore, future work should consider approaches for satisfying the displacement constraint without solely relying on a linear spring.
