Article

Predictive Torque Control for Induction Machine Fed by Voltage Source Inverter: Theoretical and Experimental Analysis on Acoustic Noise

LATIS-Laboratory of Advanced Technology and Intelligent Systems, Ecole Nationale d’Ingénieurs de Sousse, Université de Sousse, Sousse 4023, Tunisia
*
Author to whom correspondence should be addressed.
Acoustics 2025, 7(4), 63; https://doi.org/10.3390/acoustics7040063
Submission received: 23 May 2025 / Revised: 6 August 2025 / Accepted: 27 August 2025 / Published: 11 October 2025

Abstract

Induction motors piloted by voltage source inverters constitute a major source of acoustic noise in industry. The discrete tonal bands generated by induction motor stator current spectra controlled by the fixed Pulse Width Modulation (PWM) technique have damaging effects on the electronic noise source. Nowadays, the investigation of new advanced control techniques for variable speed drives has developed a potential investigation field. Finite state model predictive control has recently become a very popular research focus for power electronic converter control. The flexibility of this control shows that the switching times are generated using all the information on the drive status. Predictive Torque Control (PTC), space vector PWM and random PWM are investigated in this paper in terms of acoustic noise emitted by an induction machine fed by a three-phase two-level inverter. A comparative study based on electrical and mechanical magnitudes, as well as harmonic analysis of the stator current, is presented and discussed. An experimental test bench is also developed to examine the effect of the proposed PTC and PWM techniques on the acoustic noise of an induction motor fed by a three-phase two-level voltage source converter.

1. Introduction

The asynchronous motor is the most used motor in the industry. It is known for its robustness, its almost zero maintenance and its design simplicity. Thanks to the development of power electronics, during the recent years, the asynchronous cage machine has occupied an increasing place in variable speed applications, such as pumping, railway traction, and naval propulsion. Induction motors are usually considered in the variable speed electric drive sector when the electric motor is fed by a three-phase voltage inverter. However, the supply of this motor by an inverter has been the origin of some problems like acoustic noise. The increasing noise pollution caused by acoustic disturbances has become a serious problem [1,2,3]. Therefore, considerable effort has been focused on determining the sources of acoustic noise. The total noise level in an electrical machine occurs from four main sources: magnetic, mechanical, aerodynamic and electronic. These sources give way to the creation of excitation forces that feed on the inner surface of the stator core. These forces excite the core and frame of the stator in the equivalent frequency range and generate mechanical vibrations to produce acoustic noise. Consequently, the sound wave is audible to the human ear. In this context, the acoustic noise of electronic origin represents a crucial criterion to be taken into consideration during the operation of the asynchronous three-phase inverter machine association. Indeed, electronic noise in electrical machines is usually due to harmonics at the inverter output [4,5,6]. These harmonics create excitation forces that have a detrimental effect on the machine stator. High levels of vibration, in addition to noise, can be generated, which makes the motor more difficult to drive. Moreover, these harmonics depend on the inverter control technique. Thus, the adequate control technique that allows for spreading the acoustic noise spectrum over a wide frequency range should be found.
For several years, the investigation for greater performance of induction machines fed by inverters has been the topic of numerous research studies. The effect of acoustic noise generated by the static converter Induction Machine (IM) association has always constituted a prominent research topic [4,5,6,7,8,9,10,11]. This phenomenon has been studied since the introduction of electronic converters. A large part of noise is of electronic origin. Few books on the subject have been published [1,12,13]. The work of [1], published in 2006, constitutes today a basic element for the study of noise emitted by asynchronous machines. A lot of studies have appeared in the literature suggesting an acoustic model of the asynchronous machine, without generally taking into account the type of Pulse Width Modulation (PWM) control used. Recent work has shown that each control strategy generates a different acoustic noise spectrum [2,3,4,5,6,7,8,9,10,11,14,15,16,17,18,19,20,21]. The work recapitulated in reference [14] presented a comparative study between sinus PWM and Space Vector PWM (SVPWM) techniques in terms of acoustic noise. Nevertheless, the subject has remained a great topic, as shown by recently published studies [5,6,7,8,9,10,11,16,18,19,20]. In the same vein, the authors in [14] reported an experimental study on the effect of inverter switching sequence on acoustic noise. The studied modulation techniques were continuous SVPWM and advanced bus-clamping PWM for different switching sequences. The authors in [16] proposed an experimental procedure to define the acoustic and vibratory behavior of an IM fed by a three-phase inverter and controlled by the SVPWM modulation method. They concluded that this technique would produce harmonic components in the narrow bands around integer multiples of the switching frequency, which led to the acoustic components of tone-frequency noise that irritated the human ear. On the other hand, the authors in [8] put forward an experimental study of the carrier frequency influence of sine-triangle PWM on the forces applied to the bearings and on the noise emitted by the stator. The authors in [11] suggested a hybrid periodic carrier frequency modulation technique based on the SVPWM technique.
In addition, the authors in [10] presented a study of the impact of three modulation techniques—random PWM (RPWM), SVPWM and selective harmonic elimination PWM—on the acoustic noise generated by a three-phase voltage inverter feeding an IM. The effect of PWM control was elaborated by harmonic spectra as well as acoustic noise spectra. The obtained results demonstrated that the noise was dispersed and reduced with the RPWM technique. Furthermore, the authors in [17] discussed the investigation of random SVPWM on acoustic noise of IM. Moreover, three types of random SVPWM methods were proposed: Random Zero Vector (RZV), Random Switching Frequency (RSF) and Random Pulse Position (RPP). The experimental results demonstrated that the noise spectrum was diminished and distributed with the proposed RSF_SVPWM technique compared to the RZV_SVPWM and RPP_SVPWM strategies and the fixed SVPWM. Nowadays, the search for new, advanced and flexible control techniques for variable speed drives has become a major industry interest. A multitude of control techniques have been developed and discussed in the literature. Two approaches are widely presented as high-performance solutions: flow-oriented control and direct torque control. These two strategies have been considered for more than 30 years. However, the development of powerful microprocessors and the enormous computing power available nowadays at high speed and low cost make it possible to implement emerging control techniques. The finite state model predictive control has recently come to be a very popular area of research in power electronics and electric drives [20,22,23,24,25,26,27,28,29,30]. This advanced control allows the creation of the switching sequence using all possible information about the state of the drive. Numerous predictive algorithms can be distinguished for different models and choices of cost functions. With proper choices of the cost function, it is possible to directly influence the spectrum of the currents. Therefore, this paper proposes a study on the effect of PTC, SVPWM and RPWM in terms of acoustic noise emitted by an IM powered by a three-phase two-level inverter. The effect of the suggested techniques is additionally based on the harmonic content and acoustic noise levels. A simulation study has been made by evaluating their control performance on electrical and mechanical quantities, as well as the harmonic spectra of the machine’s stator current. An experimental test bench is realized to examine the effect of the suggested PTC and PWM techniques on the noise emitted by the machine, and some results are presented and discussed.

2. Acoustic Noise in Three-Phase Inverter IM Association

Electric motors constitute a major source of acoustic noise in industry. The increasing noise pollution caused by acoustic interference in electric motors, in general, has become a serious problem. Continuous exposure to noise causes illness and psycho-acoustic problems for human beings. Consequently, considerable efforts have been made to determine the sources of acoustic noise. These can be divided into four main sources: magnetic, mechanical, aerodynamic and electronic, as illustrated in Figure 1. Magnetic noise is generally caused by the deformation of parts sensitive to magnetic fields. One of the main sources of mechanical noise is the stator, which is the main source of noise in the machine. There are also other causes of mechanical noise, which are essentially rotor imbalance and eccentricity. One of the main aerodynamic sources of acoustic noise is the cooling of machines by air, liquid (oil) or water. Thus, electronic noise is caused by switching harmonics when feeding electrical machines. This study focuses on the investigation of electronic noise and consequently on the switching harmonics sources.
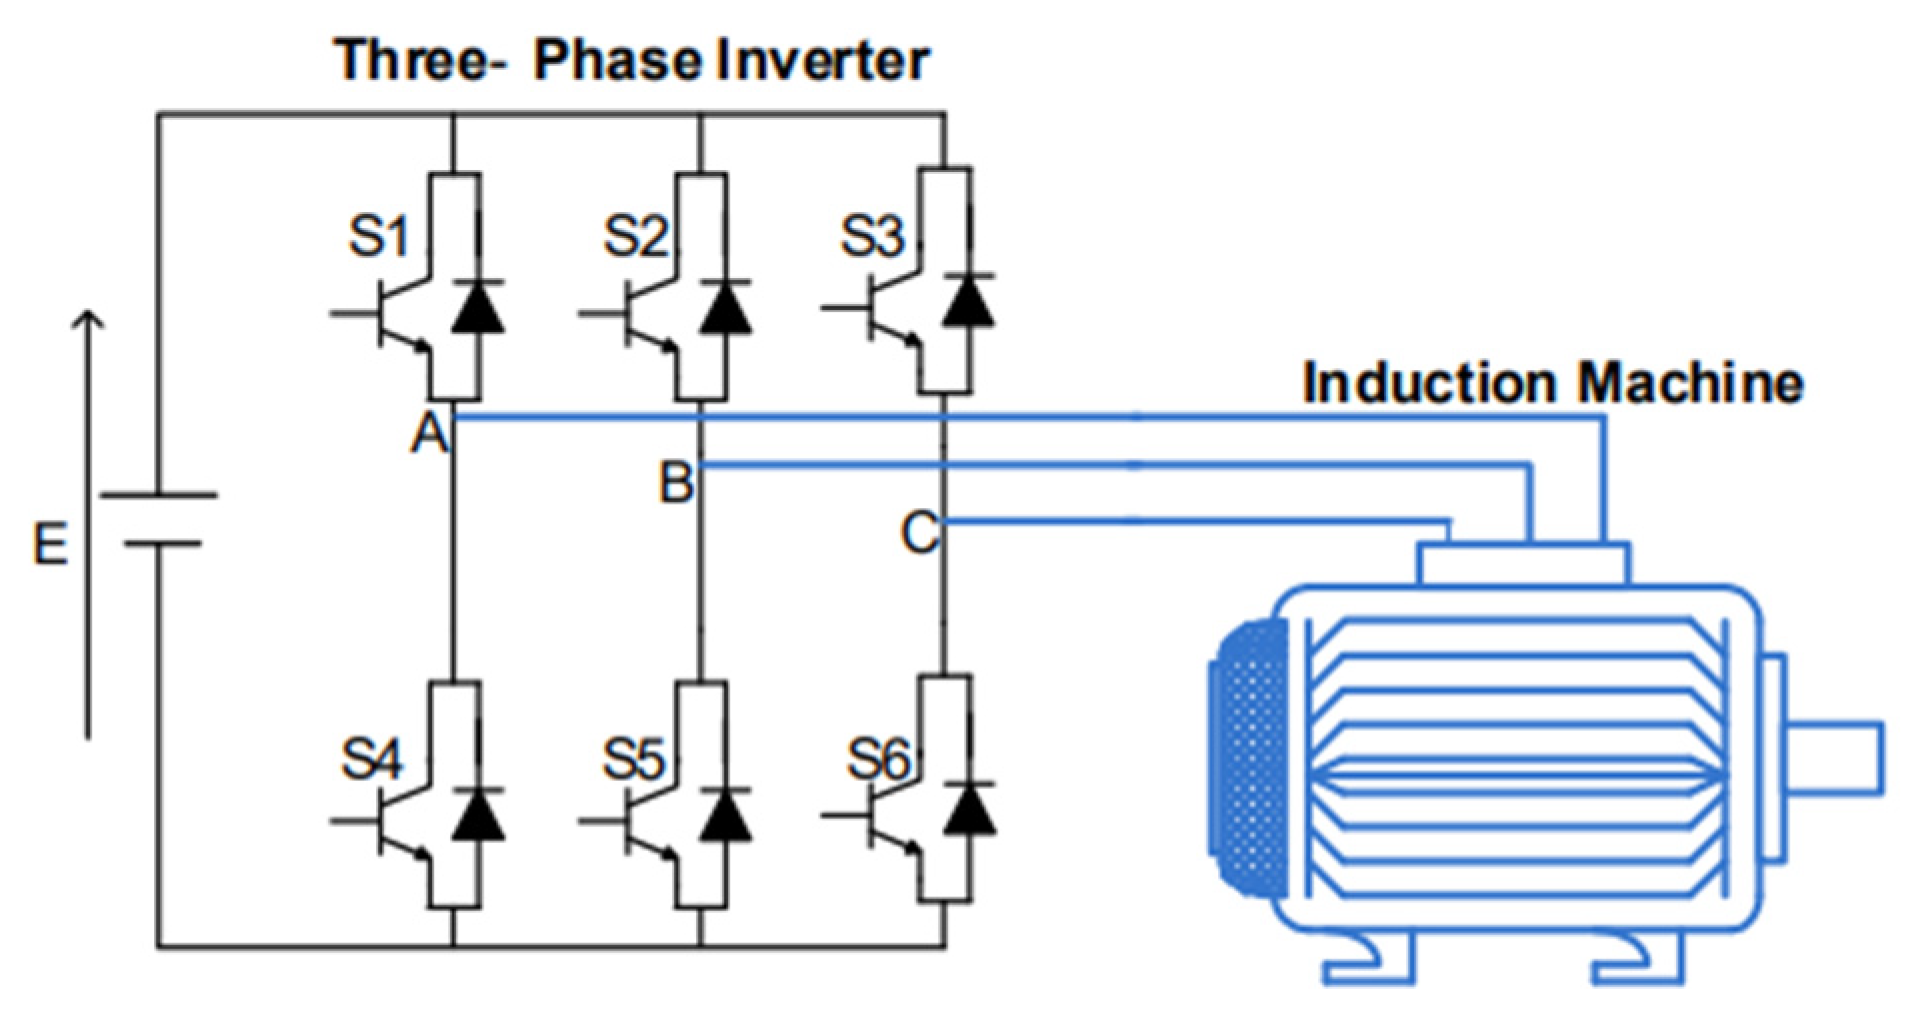
An IM fed by a two-level three-phase voltage inverter, as illustrated by Figure 2, produces unpleasant acoustic noise due to harmonics of the inverter output voltage. These harmonics are narrow-band components around the integer multiple of the switching frequency. Furthermore, the harmonics absorbed by the stator windings produce additional stator flux density components; hence, the generation of other magnetic force components [1,2,3,4,5]. The frequency of voltage harmonics is given by Formula (1) as follows:
F n = n 1 F c + n 2 F
where F c is the switching frequency, F is the fundamental frequency, and n1 and n2 are integers.
The electronic noise creation chain is shown in Figure 3. The electrical machine is divided into two parts: a part including the winding, which is the source of magnetic field production, and the mechanical structure, which can vibrate under the effect of radial forces. Environmental air pressure varies periodically under the effect of vibrations, so it leads to the creation of noise. The intensity of the noise is associated with the harmonic spectra of the output voltage, which depends on the control technique. Thus, the adequate control technique that provides spread noise spectra over a wide band should be found.

3. Proposed Controls

3.1. PWM Techniques

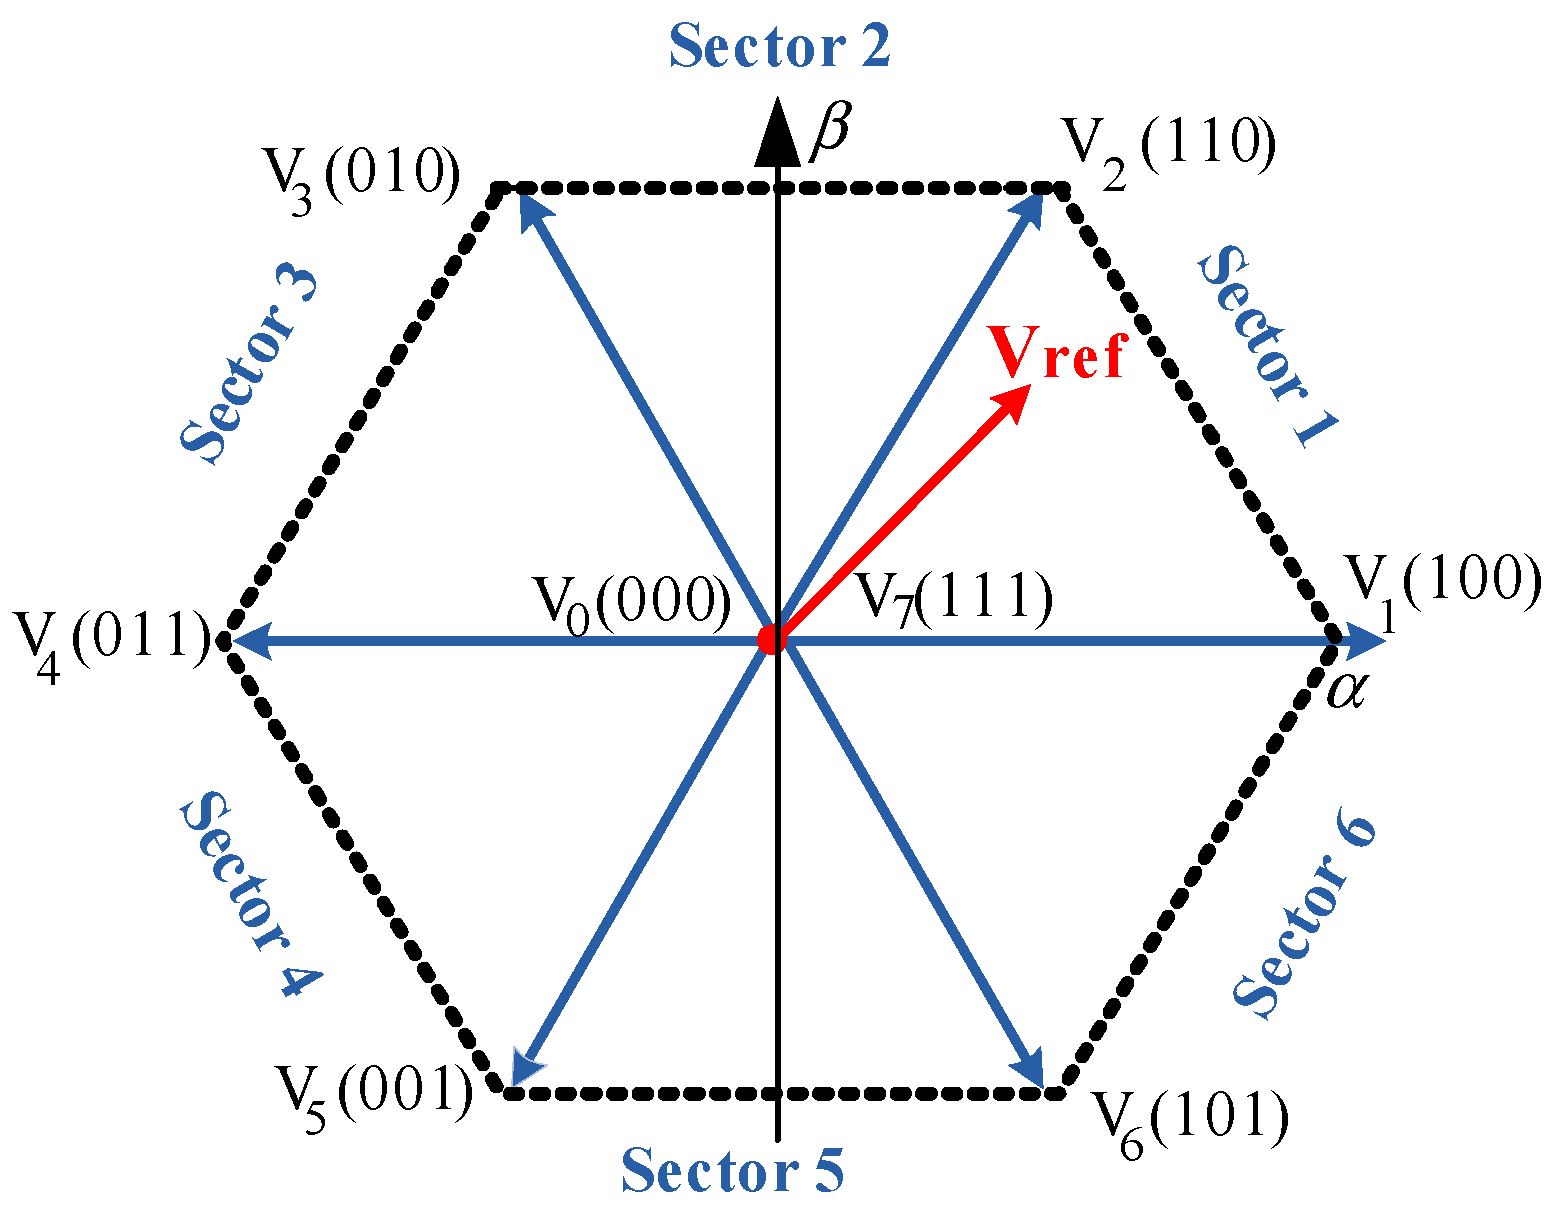
SVPWM is a digital method founded on the transformation of reference voltages by one single vector [1,19,28]. Eight vectors (Vi = 0, …, 7) have two zero vectors. The non-zero vectors in (α, β) are presented in the regular hexagon, where the origin is aligned to the two zero vectors, as illustrated by Figure 4.
The general expressions for the reference voltages of amplitude V m are given by the system of Equation (2),
V A r e f = V m sin 2 π F t V B r e f = V m sin 2 π F t 2 π 3 V C r e f = V m sin 2 π F t 4 π 3 ,
where Vm is the reference voltage amplitude.
The SVPWM strategy is applied by turning vector Vref. Thus, for SVPWM control, the command signals are generated by the sector number determination, the duty cycle calculation and the switching sequence generation. Figure 5 depicts the switching state distribution in sector 1.
The general expressions for the duty cycles for three adjacent vectors (V0, V1 and V2) to a reference vector for a two-level inverter are given by
d 1 = 3 V r e f E sin s π 3 θ d 2 = 3 V r e f E sin θ s 1 π 3 , d 0 = 1 d 1 + d 2
where θ is the instantaneous angle, and s is the sector.
The harmonic content at the inverter output is generally chosen as a performance criterion that should be minimized in most applications. To avoid harmonic problems, the inverter’s power switch control strategy must be designed using an appropriate PWM algorithm. Many PWM methods have been developed and proposed [16,19,20,21,22,23,24,25,26,27,28,29,30,31,32]. In this study, we present two PWM techniques, RPWM and SVPWM. Various strategies of the RPWM technique have been established for three-phase two-level inverters in the literature [7,9,10,11,12,13,16,17]. The three main strategies are PWM with a random carrier frequency, PWM with a random pulse position, and PWM with a random pulse width. In the present work, an RSF is put forward and implemented into two- and three-level inverters. Usually, the instantaneous carrier period fi is defined inversely proportional to the switching period Tn as follows:
f i = 1 T n T n = n ( t n ) ,
where Tn defines the time period random, n = 1, 2, …, N, and n(tn) is a random function.
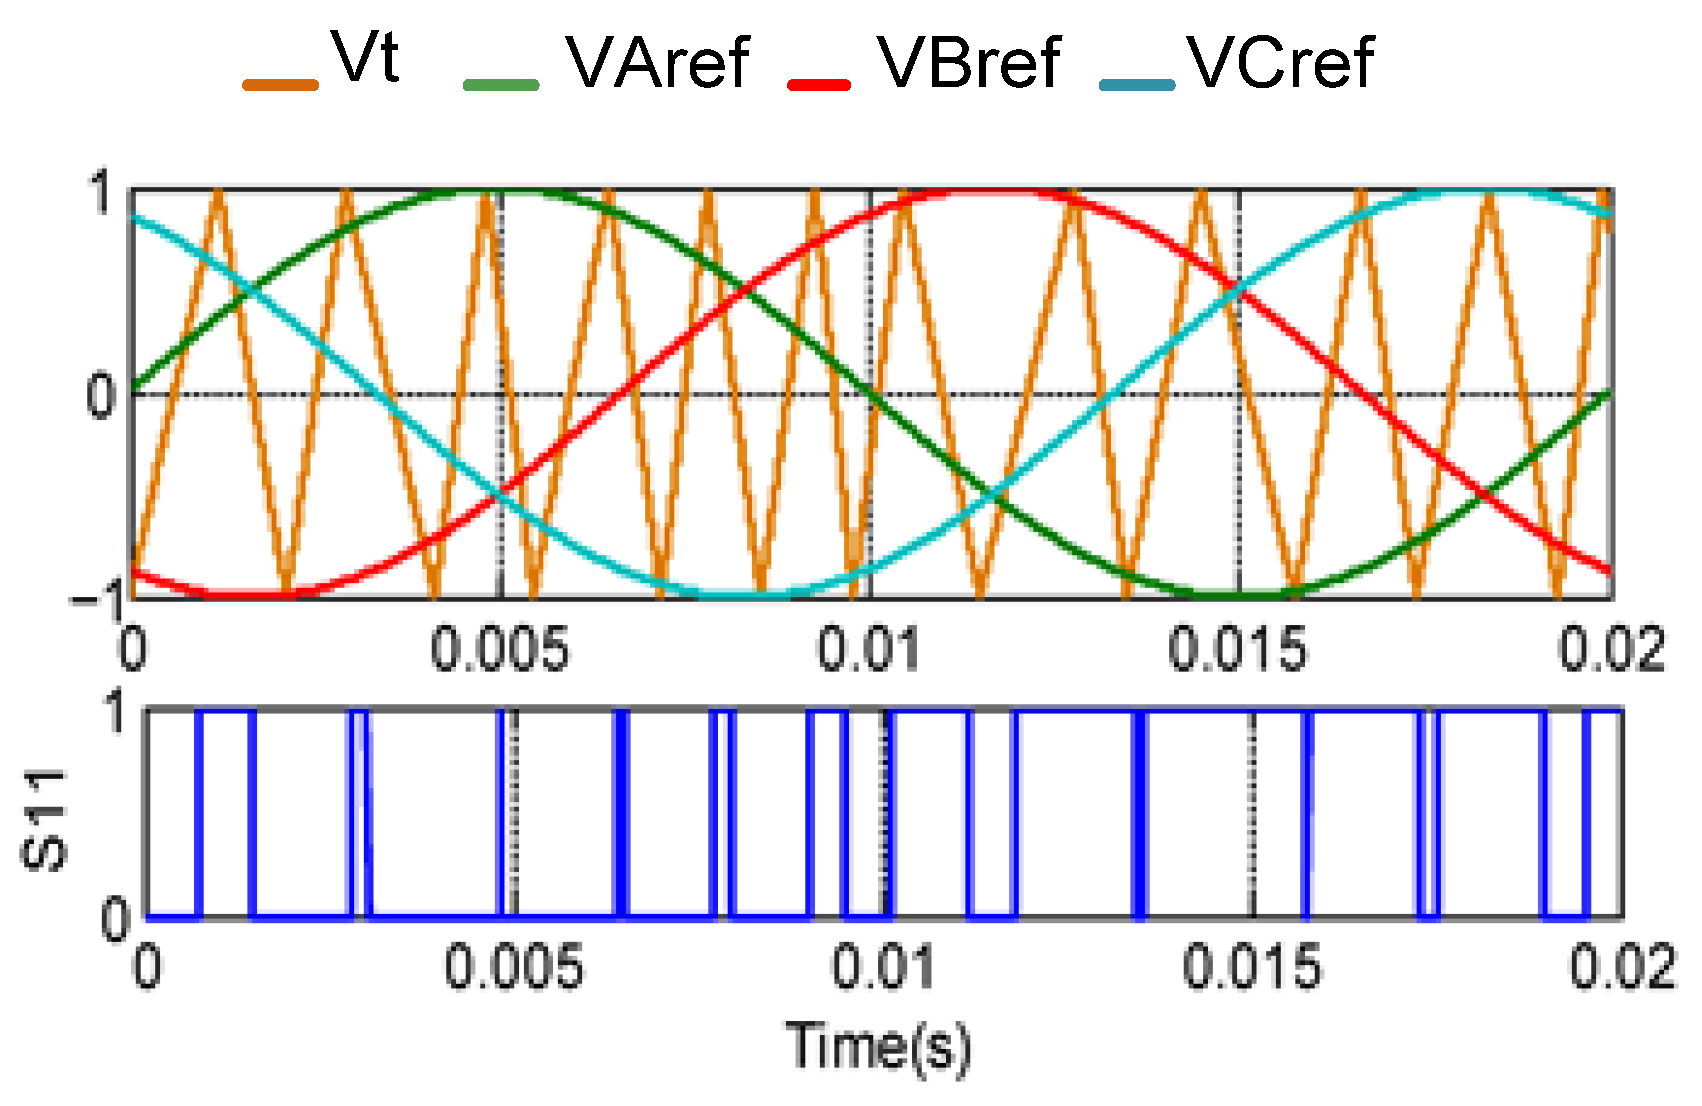
A random-frequency triangular carrier waveform is shown in Figure 6.
Figure 7 depicts the control signal for switch S11 based on the random frequency algorithm. The control signals for the RPWM strategy are generated by checking the random frequency carrier Vt with the sinusoidal reference.

3.2. Predictive Torque Control of Induction Motor Drive

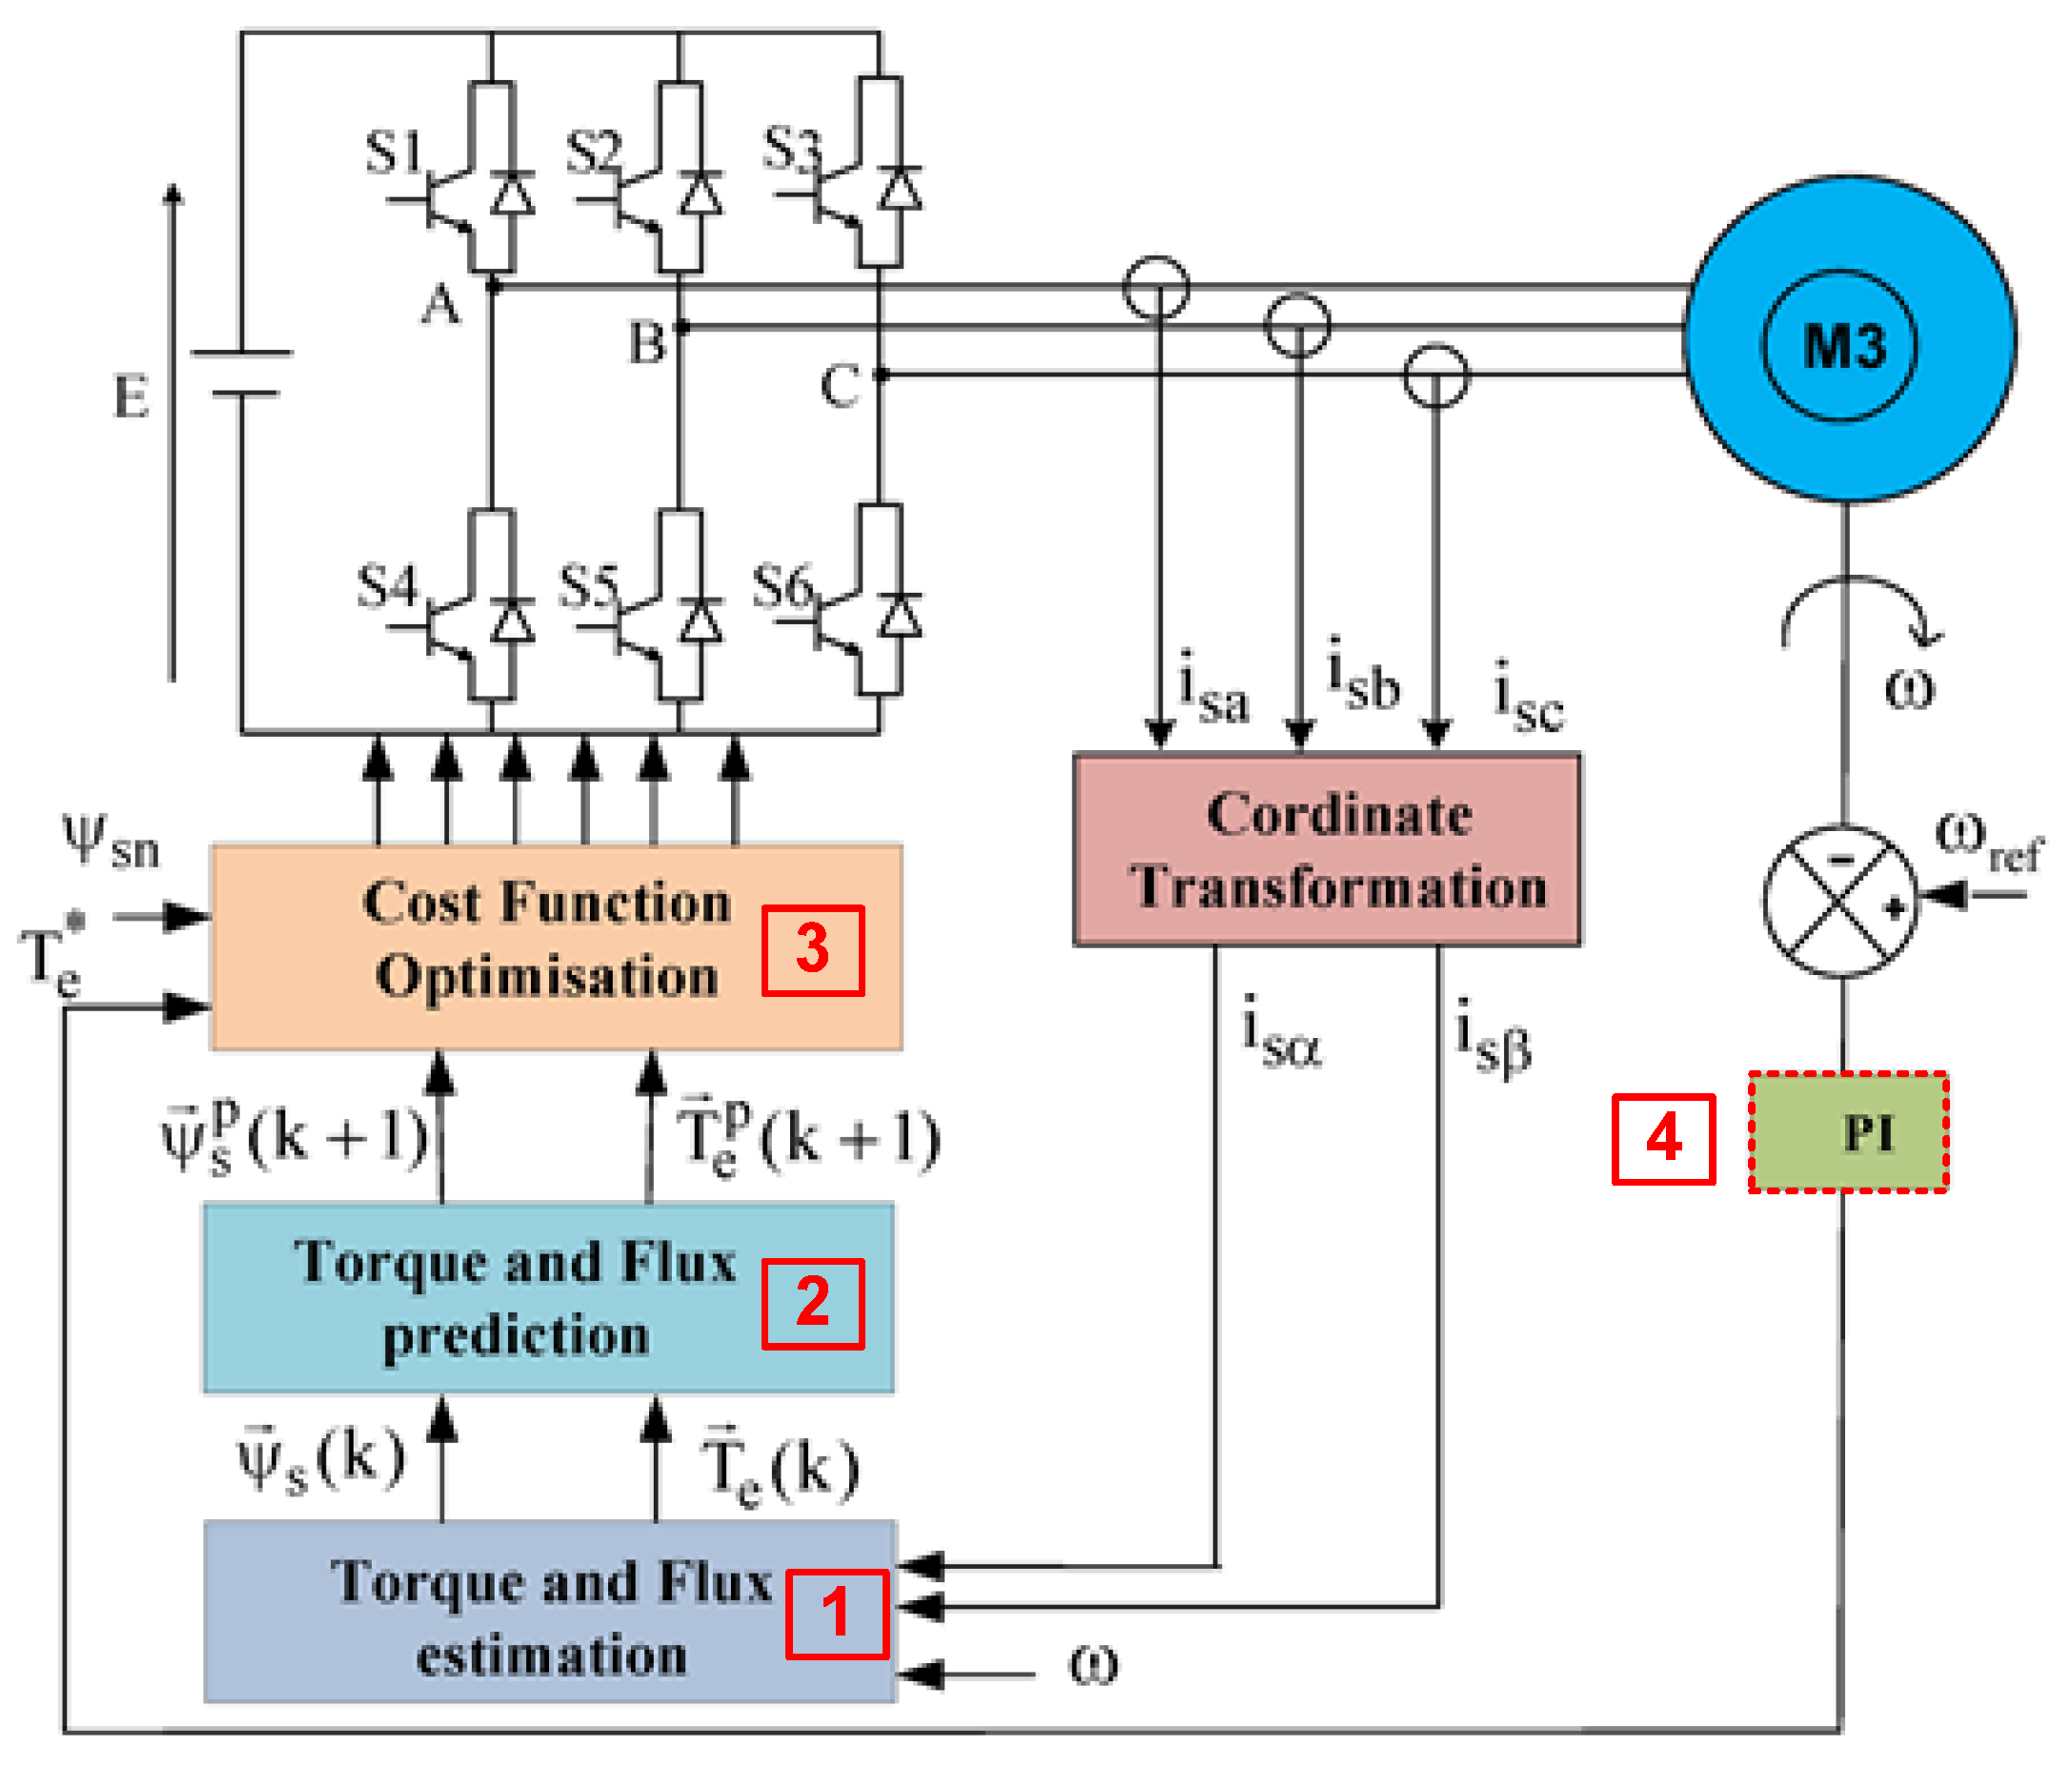
The Predictive Torque Control (PTC) block diagram for an IM drive by a three-phase inverter is given in Figure 8. This approach is carried out in three stages: estimation (1), prediction (2) and optimization (3). The reference torque T e * is generated externally by a PI speed controller (4) [28].
Rotor and stator flux estimations are obtained based on current stator and speed measurements. They can be expressed by the following expressions:
d ψ r d t = R r L m L r i s R r L r j ω ψ r ,
ψ s = L m L r ψ r + σ L s i s ,
where
  • L r : rotor inductance;
  • L s : stator inductance;
  • L m : mutual inductance;
  • R s : stator resistance;
  • R r : rotor resistance;
  • ψ r : rotor flux vector;
  • i s : stator current vector;
  • ω : rotor speed;
  • ψ s : stator flux vector;
  • σ : total dispersion factor.
Using the Euler forward approximation, the discrete forms of Equations (5) and (6) can be obtained as follows:
ψ r ( k ) = ψ r ( k 1 ) + T s R r L m L r i s ( k ) R r L r j ω ( k ) ψ r ( k 1 ) ,
ψ s ( k ) = L m L r ψ r ( k ) + σ L s i s ( k ) ,
where Ts is the sampling time, and k and k + 1 are the current and next sampling time.
The electromagnetic torque estimation is calculated using current and flux as follows:
T e ( k ) = 3 2 Im ( ψ ¯ s ( k ) × i s ( k ) ) .
The machine stator voltage model generally applies stator flux prediction ψ s p ( k + 1 ) , and can be expressed as follows:
ψ s p ( k + 1 ) = ψ s ( k ) + T s V s ( k ) T s R s i s ( k ) ,
where V s is the stator voltage vector.
The electromagnetic torque prediction is deduced from the flux and stator current. Thus, the predictions of stator current i s p ( k + 1 ) and torque T e ( k + 1 ) can be expressed as follows:
i s p ( k + 1 ) = 1 + T s τ σ i s ( k ) + T s τ σ + T s × 1 R σ k r τ r k r j ω ( k ) ψ r ( k ) + V s ( k ) ,
T e ( k + 1 ) = 3 2 Im ( ψ ¯ s ( k + 1 ) × i s ( k + 1 ) ) ,
where
  • τ σ : transient stator time constant τ σ = L σ / R σ ;
  • L σ : leakage inductance L σ = σ L s ;
  • R σ : equivalent resistance referred to stator R σ = R s + k r 2 R r ;
  • k r : real rotor time constant K r = L m / L r .
The predicted variables are estimated by a predefined cost function. For PTC, the cost function g T includes the absolute torque error values and the flux error through the use of a weighting factor λ p .
g T = i = 1 k T e * T e p ( k + 1 ) T n + λ p ψ s * ψ s p ( k + 1 ) ψ s n ,
where
  • T n : rated torque;
  • ψ s n : rated stator flux amplitude;
  • T e * : reference rated torque;
  • ψ s * : reference rated flux;
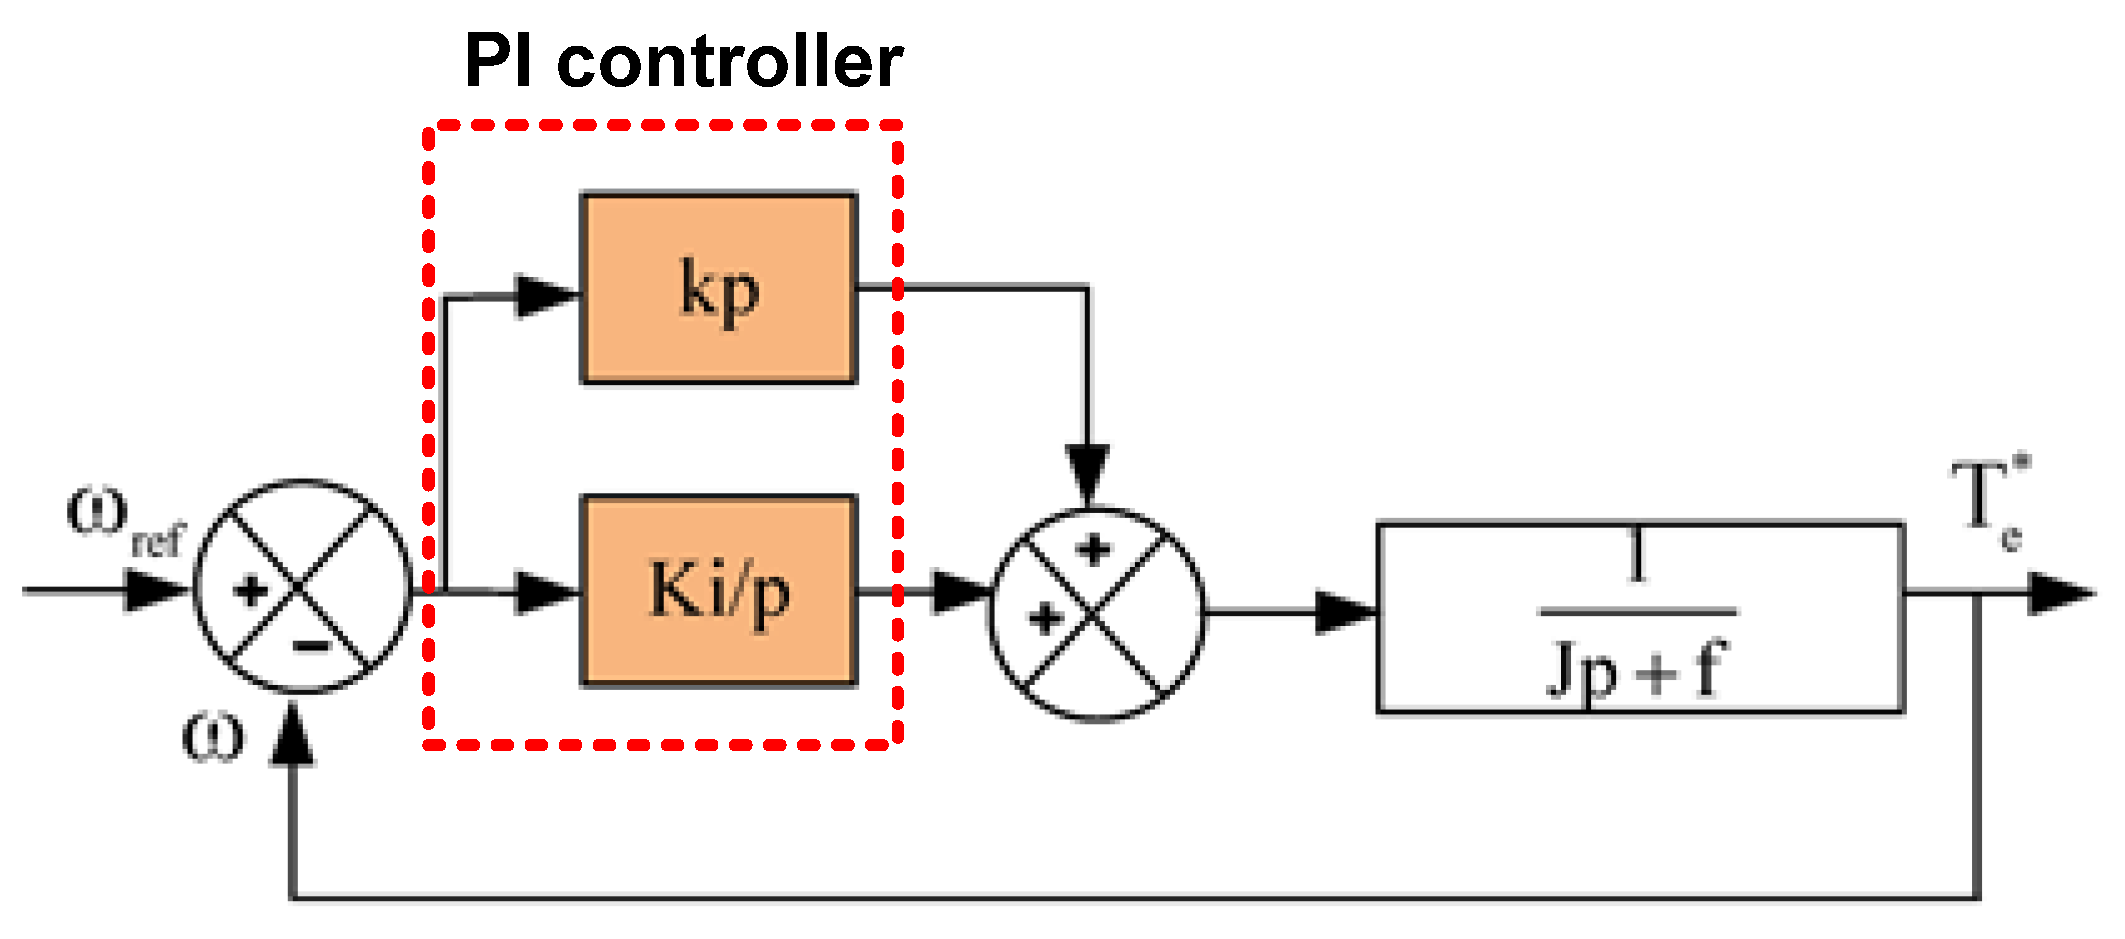
The weighting factor depends on the system parameters, and it has an influence on its performance because it determines the relative importance of torque and stator flux [29,30]. This characteristic is one of the main advantages of the torque predictive technique. The block diagram of the PI speed control loop is given in Figure 9, and it also contains a proportional action and an integral action:
The PI controller transfer function is expressed as follows:
C ( p ) = k p + k i p .
The transfer function of the system in second order with the damping coefficient ξ and the proper pulsation ω n is as follows:
H ( p ) = 1 p 2 + 2 ξ ω n p + ω n 2 .
The values of the controller parameters are identified by
k p J = 2 ξ ω n k i J = ω n 2 .
Finally, the expressions for the controller parameters are given by
k p = 2 J ξ ω n k i = J ω n 2 ,
where ω n = 3 t r e s p o n s e ξ and 0 < ξ < 1 .
Therefore, for ξ = 0.7 , t = 15 ms, we have found kp = 1.5 and ki = 3.26.

4. Simulation Results

A MATLAB/Simulink R2016a numerical model of an IM driven by a two-level inverter controlled by PTC and the PWM algorithms has been developed. Simulation is performed under similar parameters: DC voltage E = 560 V, and fundamental frequency F = 50 Hz. The machine parameters are mentioned in Table 1.
As shown previously in Equation (13), the weighting factor λp is the only parameter to adjust for predictive control. It is therefore necessary to study the effect of this parameter on system performance. However, no formal method exists for obtaining the optimum value. The weighting factor scanning is obtained by means of off-line simulation. Therefore, to evaluate the effect of λp as a function of the stator current’s Total Harmonic Distortion (THD), off-line simulation is performed. Figure 10 shows the stator current THD evolution as a function of the weighting factor. Referring to these results, we can see that when the same importance is attributed to torque and flux control (case λp = 1), the THD value is higher. However, if the flux control is greater than the torque control (case λp = 10), the stator current THD level is reduced.
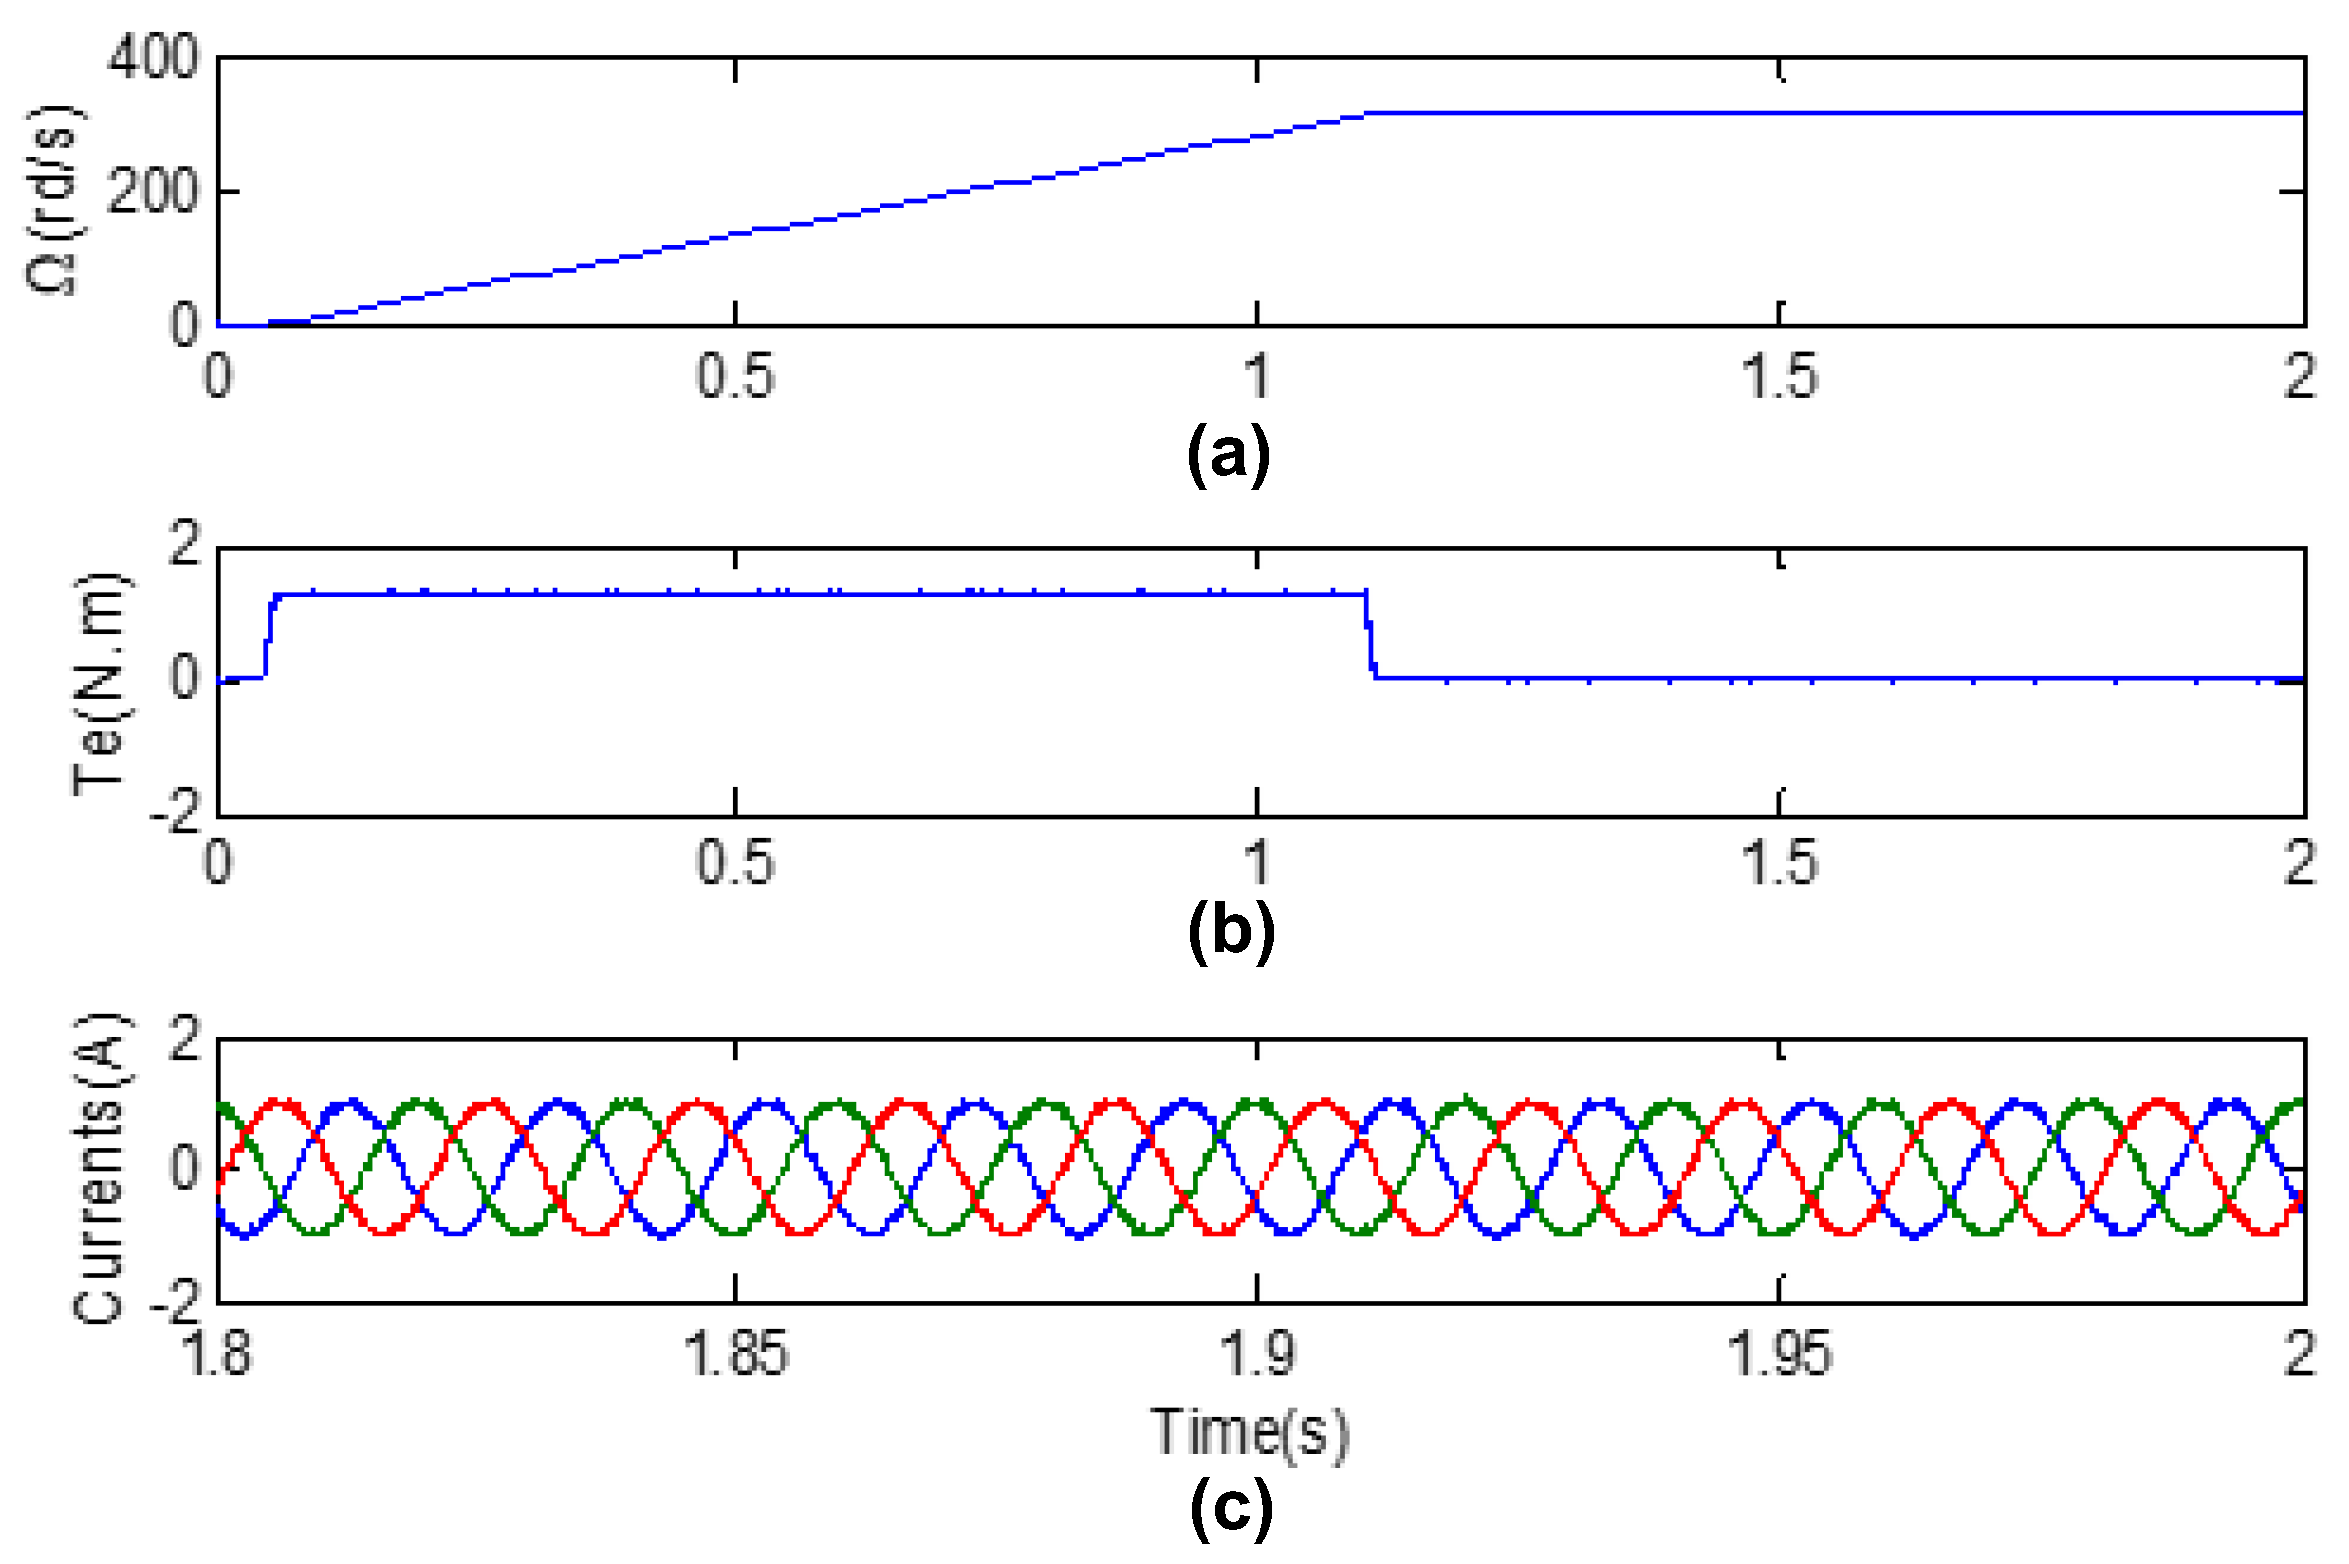
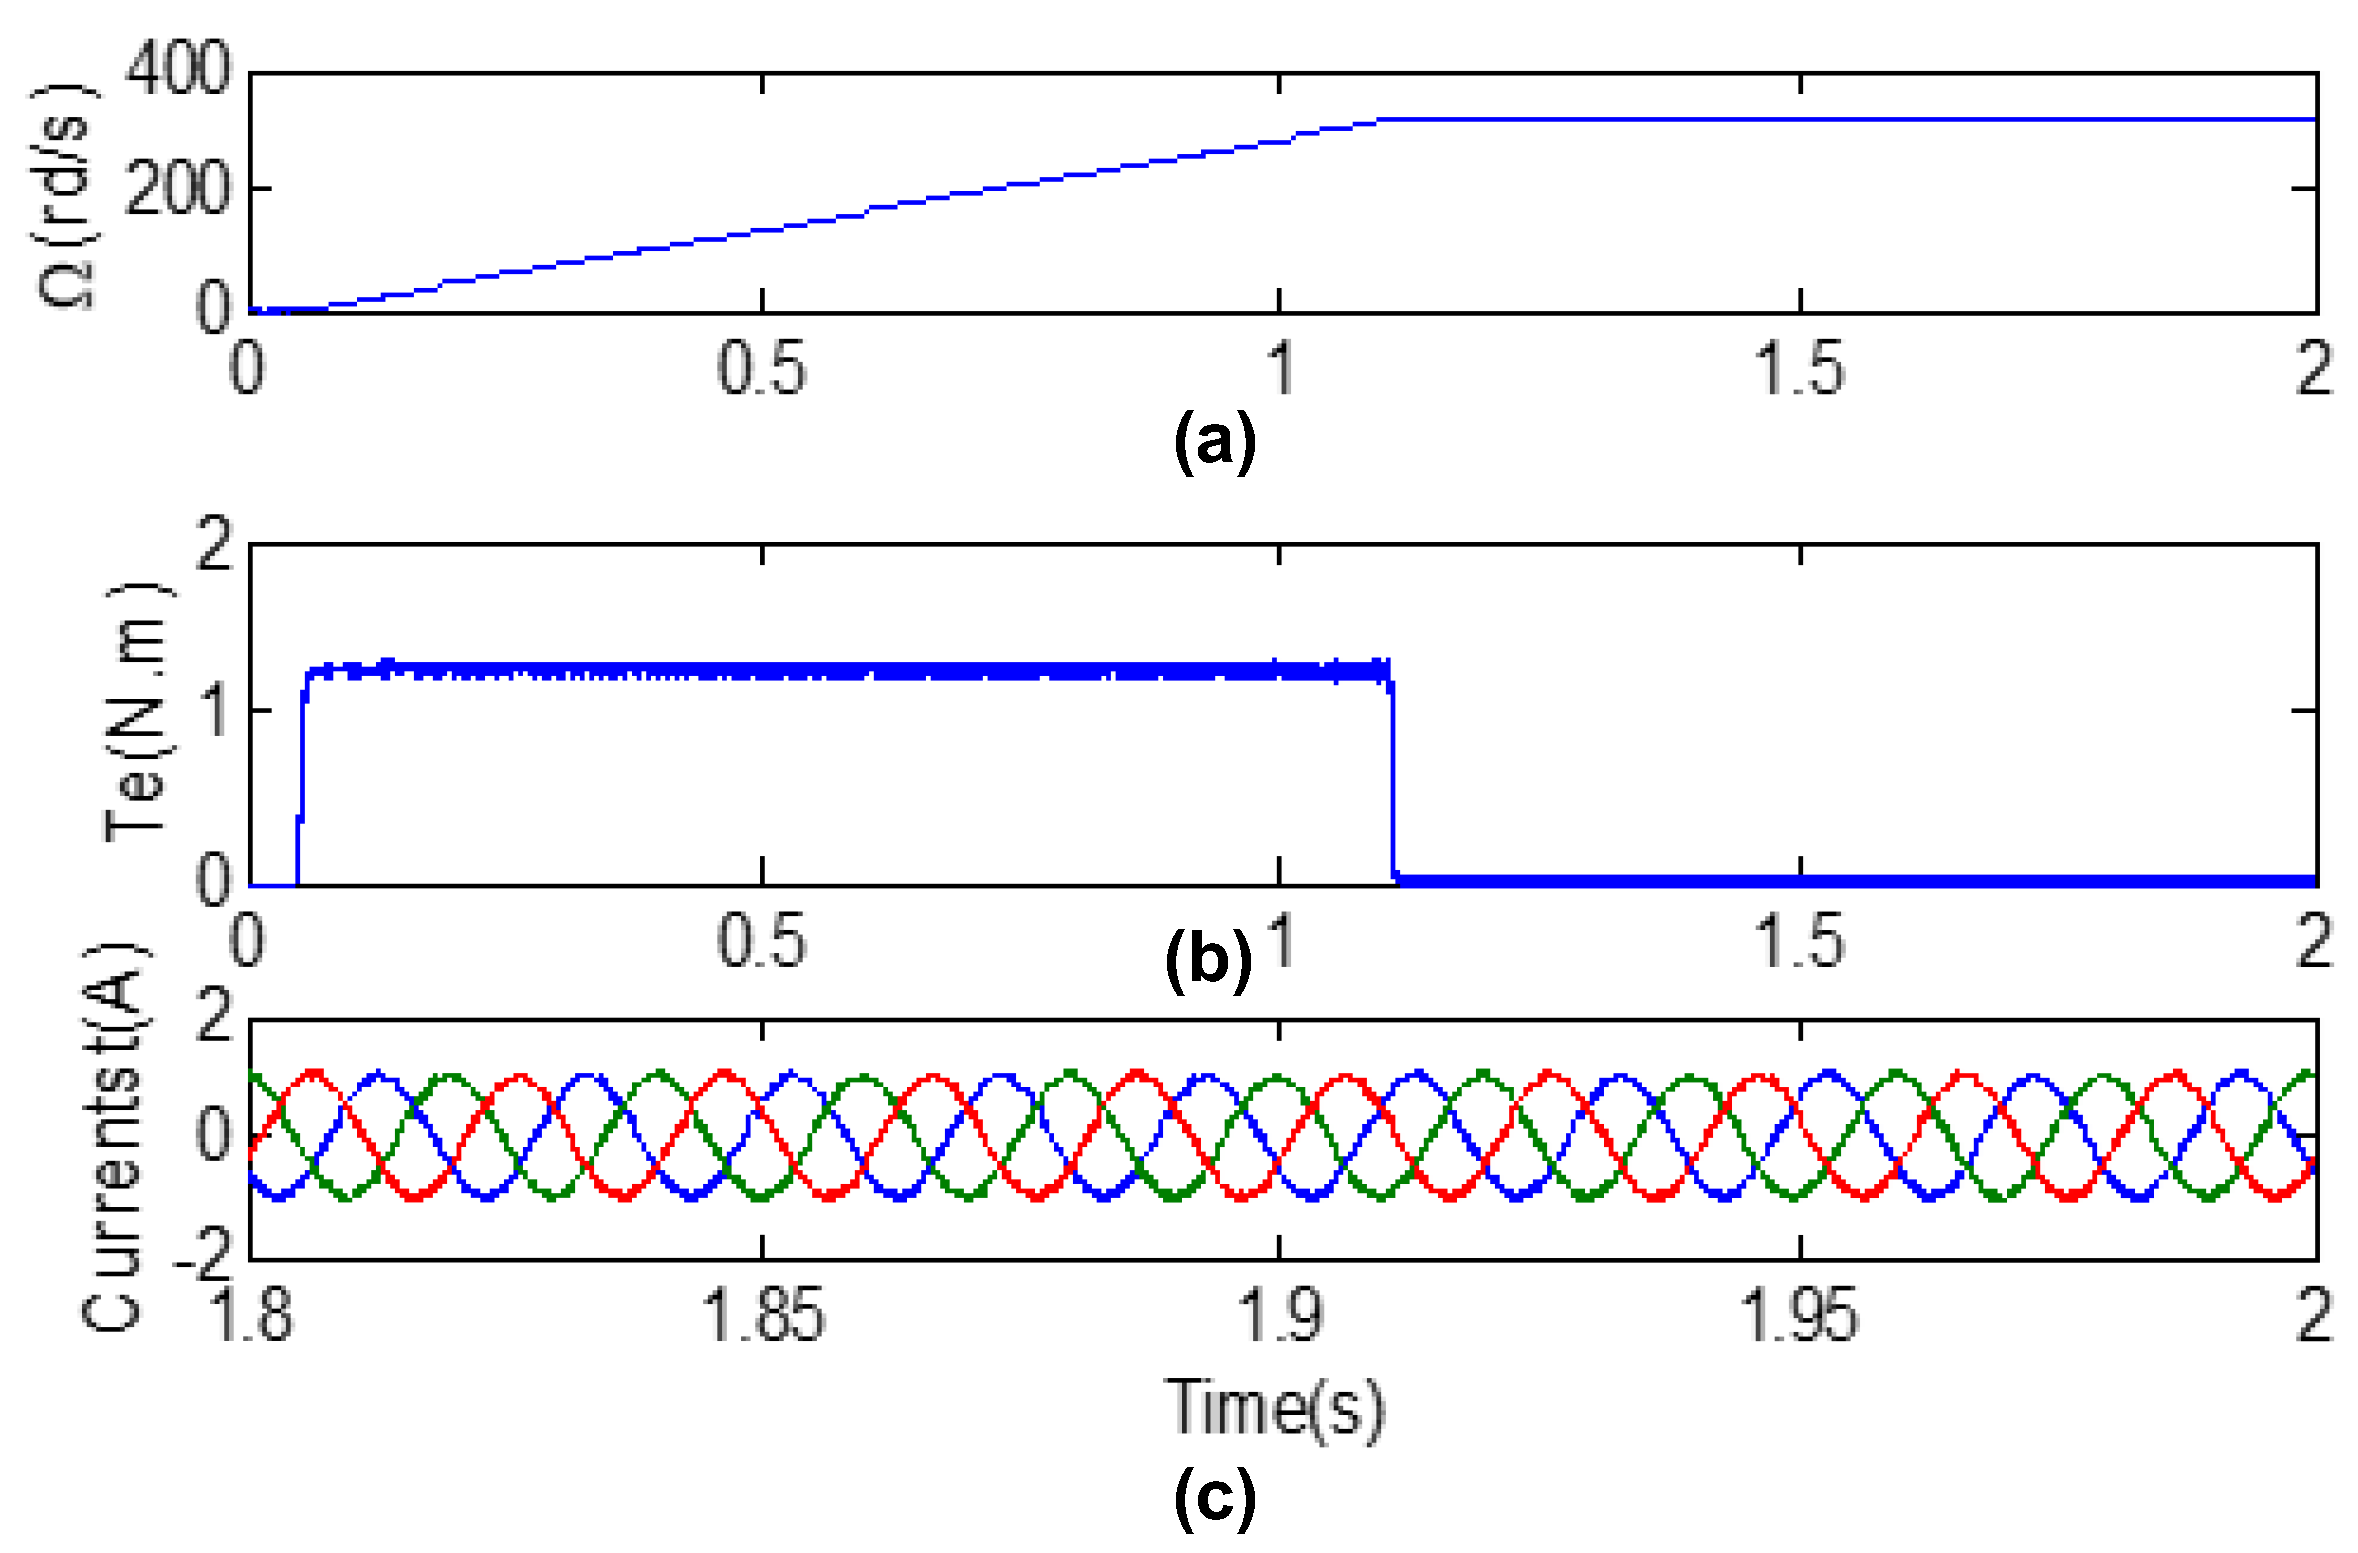
Thereafter, to compare the effect of weighting factors on system performance, values of λp are considered: 1.1 and 10. Figure 11, Figure 12 and Figure 13 depict the behaviors of speed, electromagnetic torque and stator current, respectively, associated with PTC for weighting factors (λp = 1.1, λp = 5, and λp = 10). It can be noted that they have practically a similar response at speed since they use the same speed regulator. Thus, referring to the obtained results, for a higher weighting factor, λp = 10, the stator current and electromagnetic torque waveforms have higher performance than those obtained for λp = 1.1.
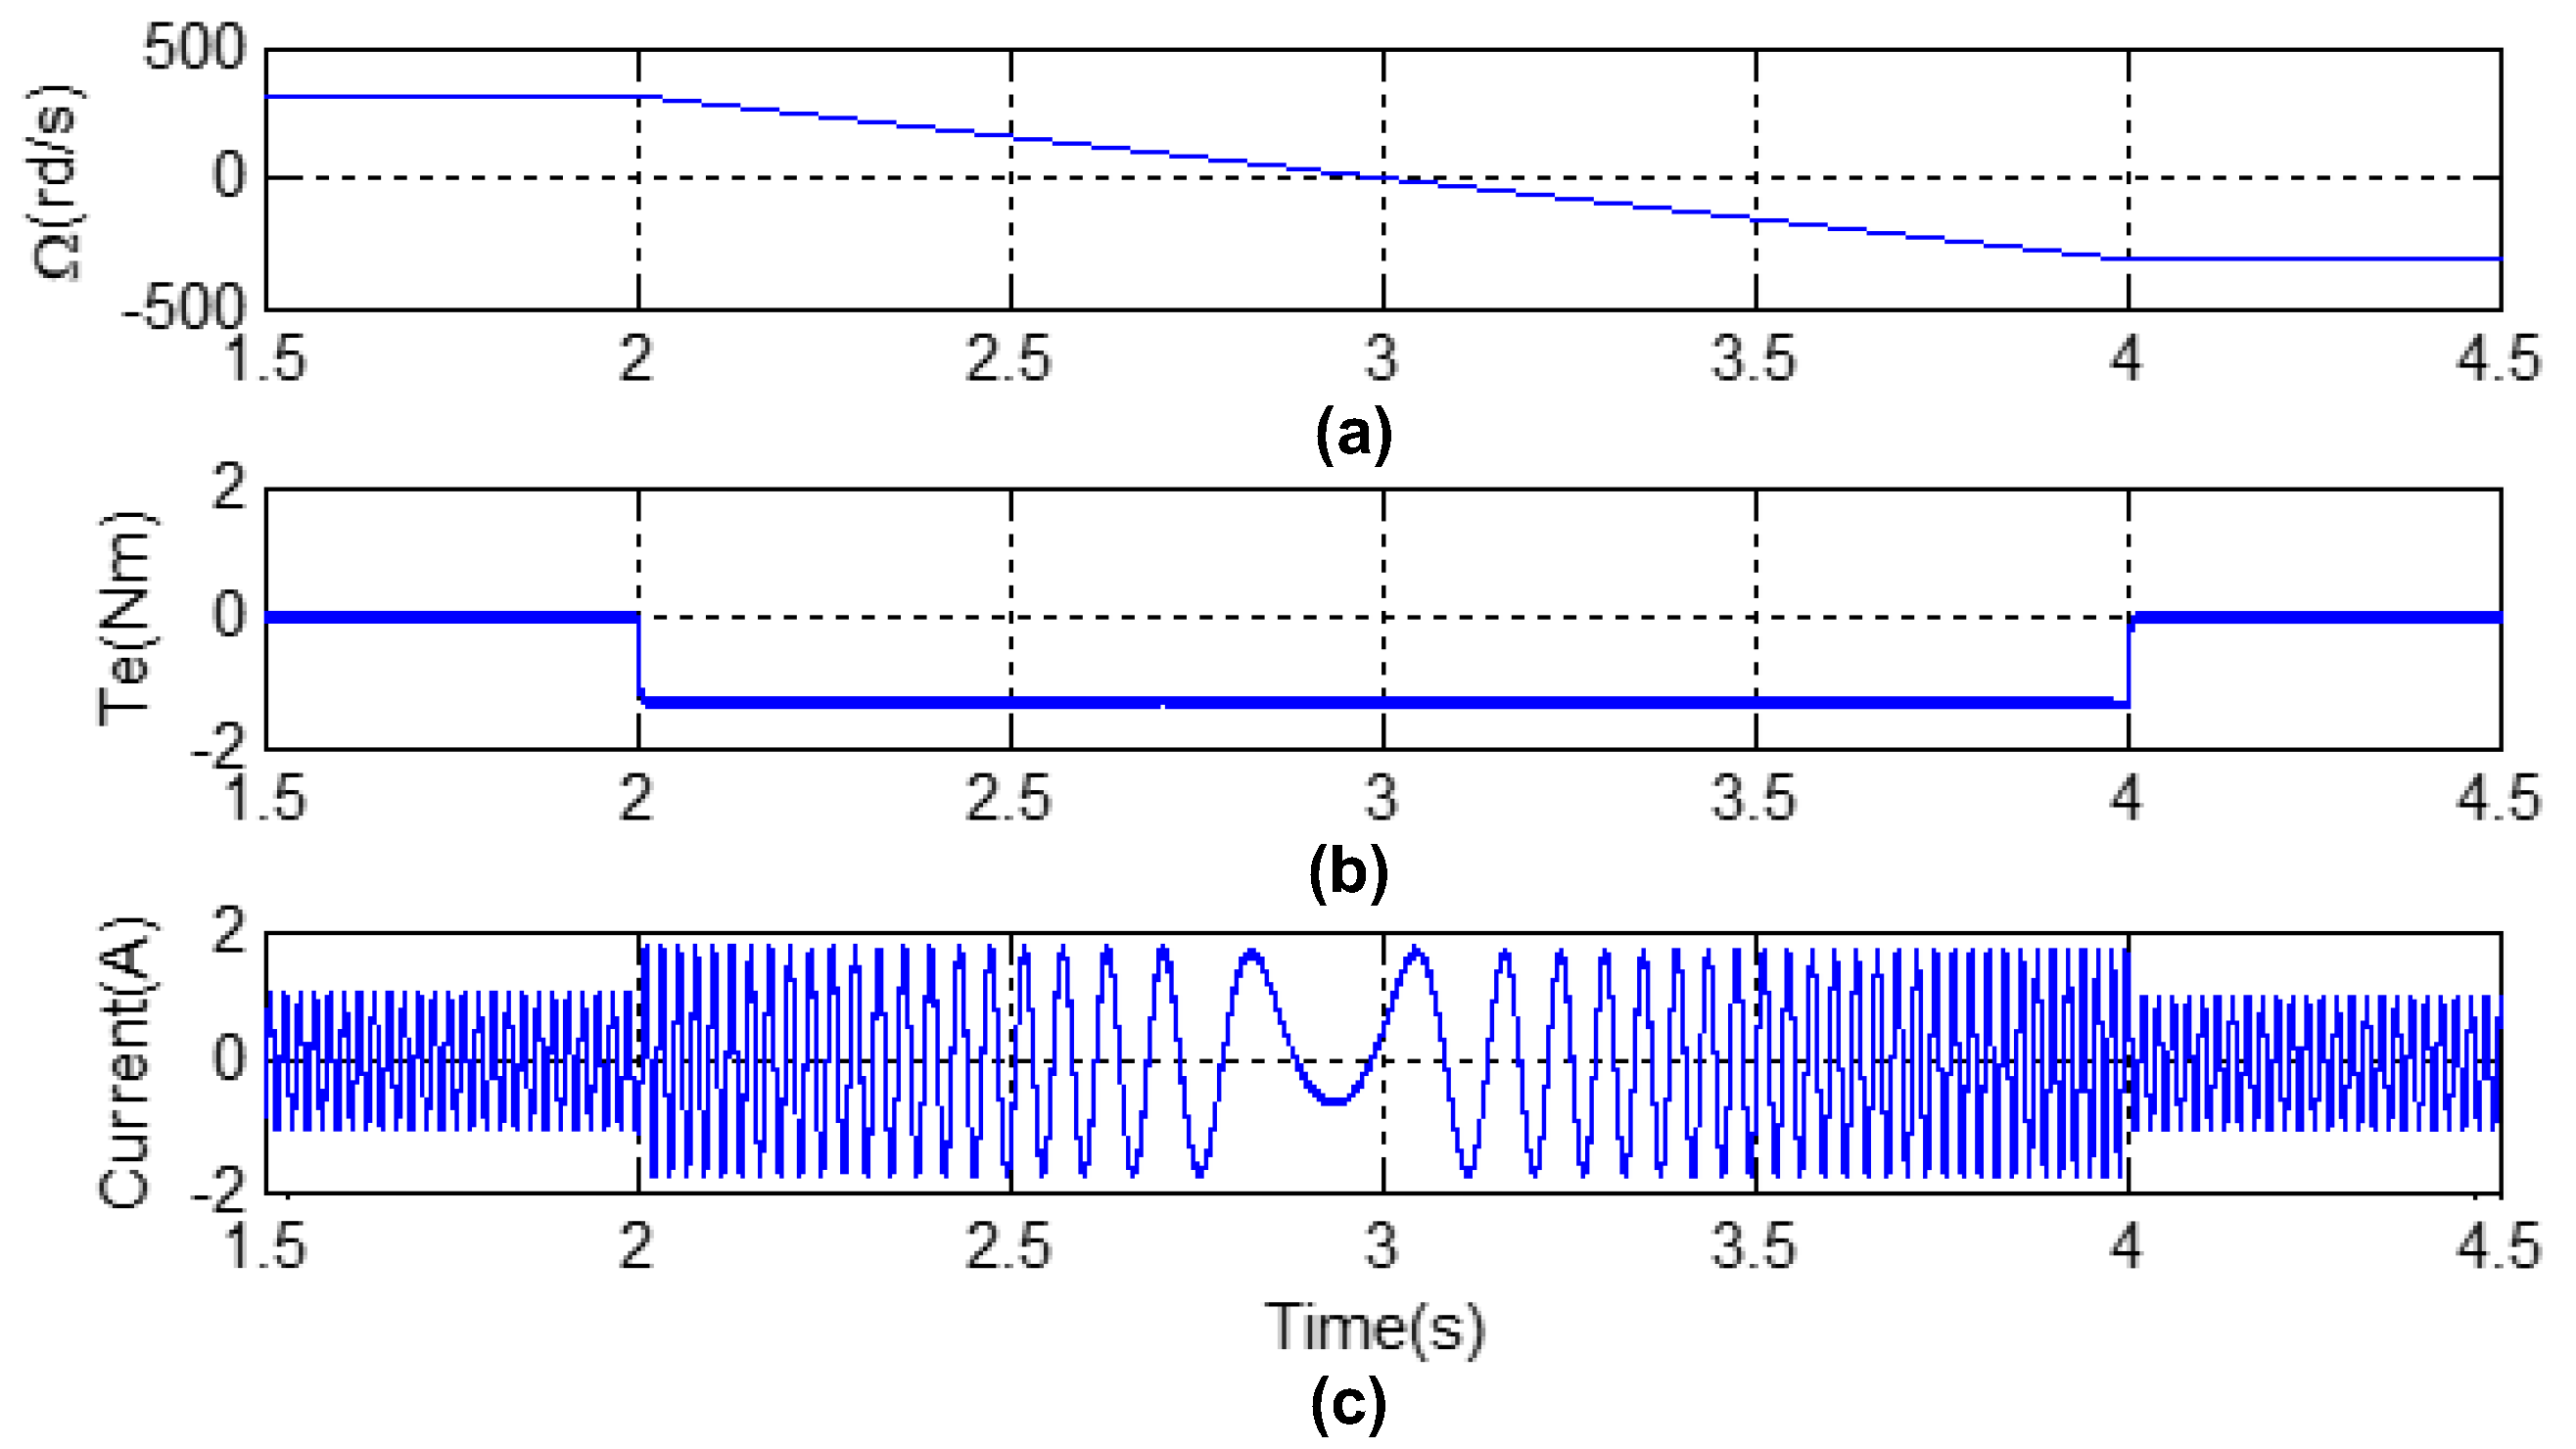
The simulation results obtained from machine response with speed reversal are shown in Figure 14 and Figure 15, respectively, for a weighting factor λp = 1.1 and λp = 10. The waveforms of speed, electromagnetic torque and stator current are also observed. It is clear that the system can be operated over the entire speed range with good behavior for an optimum weighting factor of λp = 10.
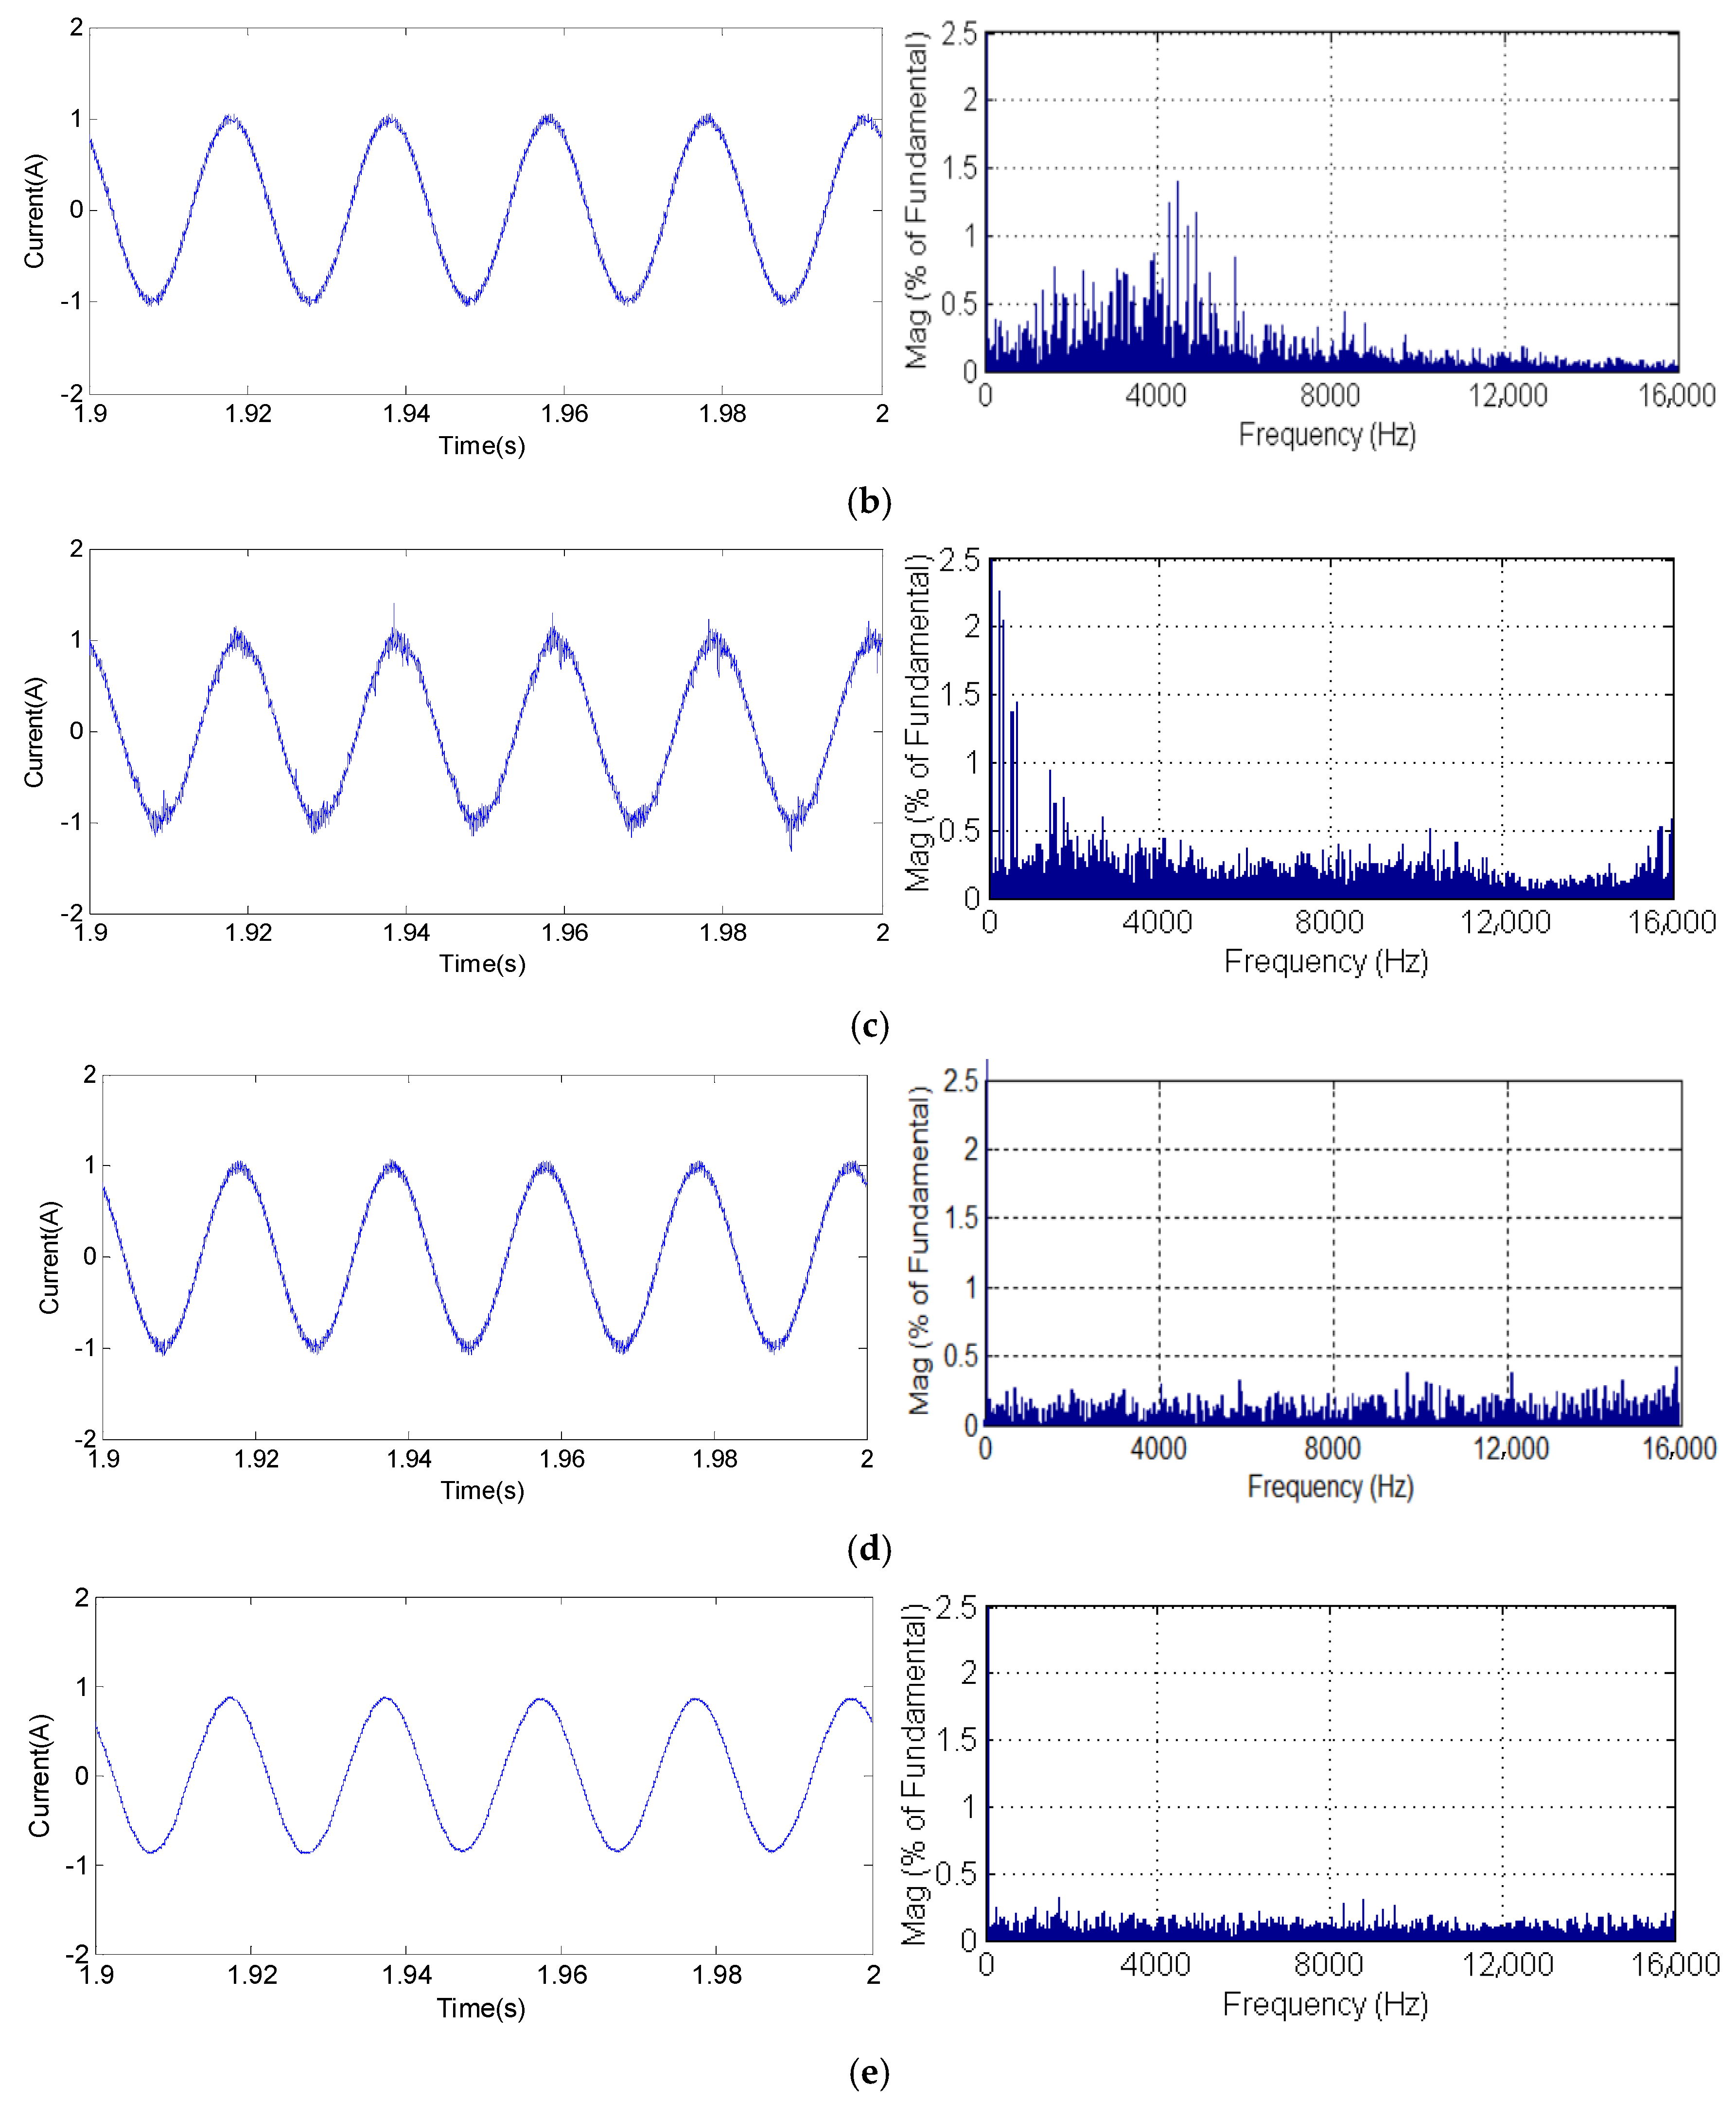
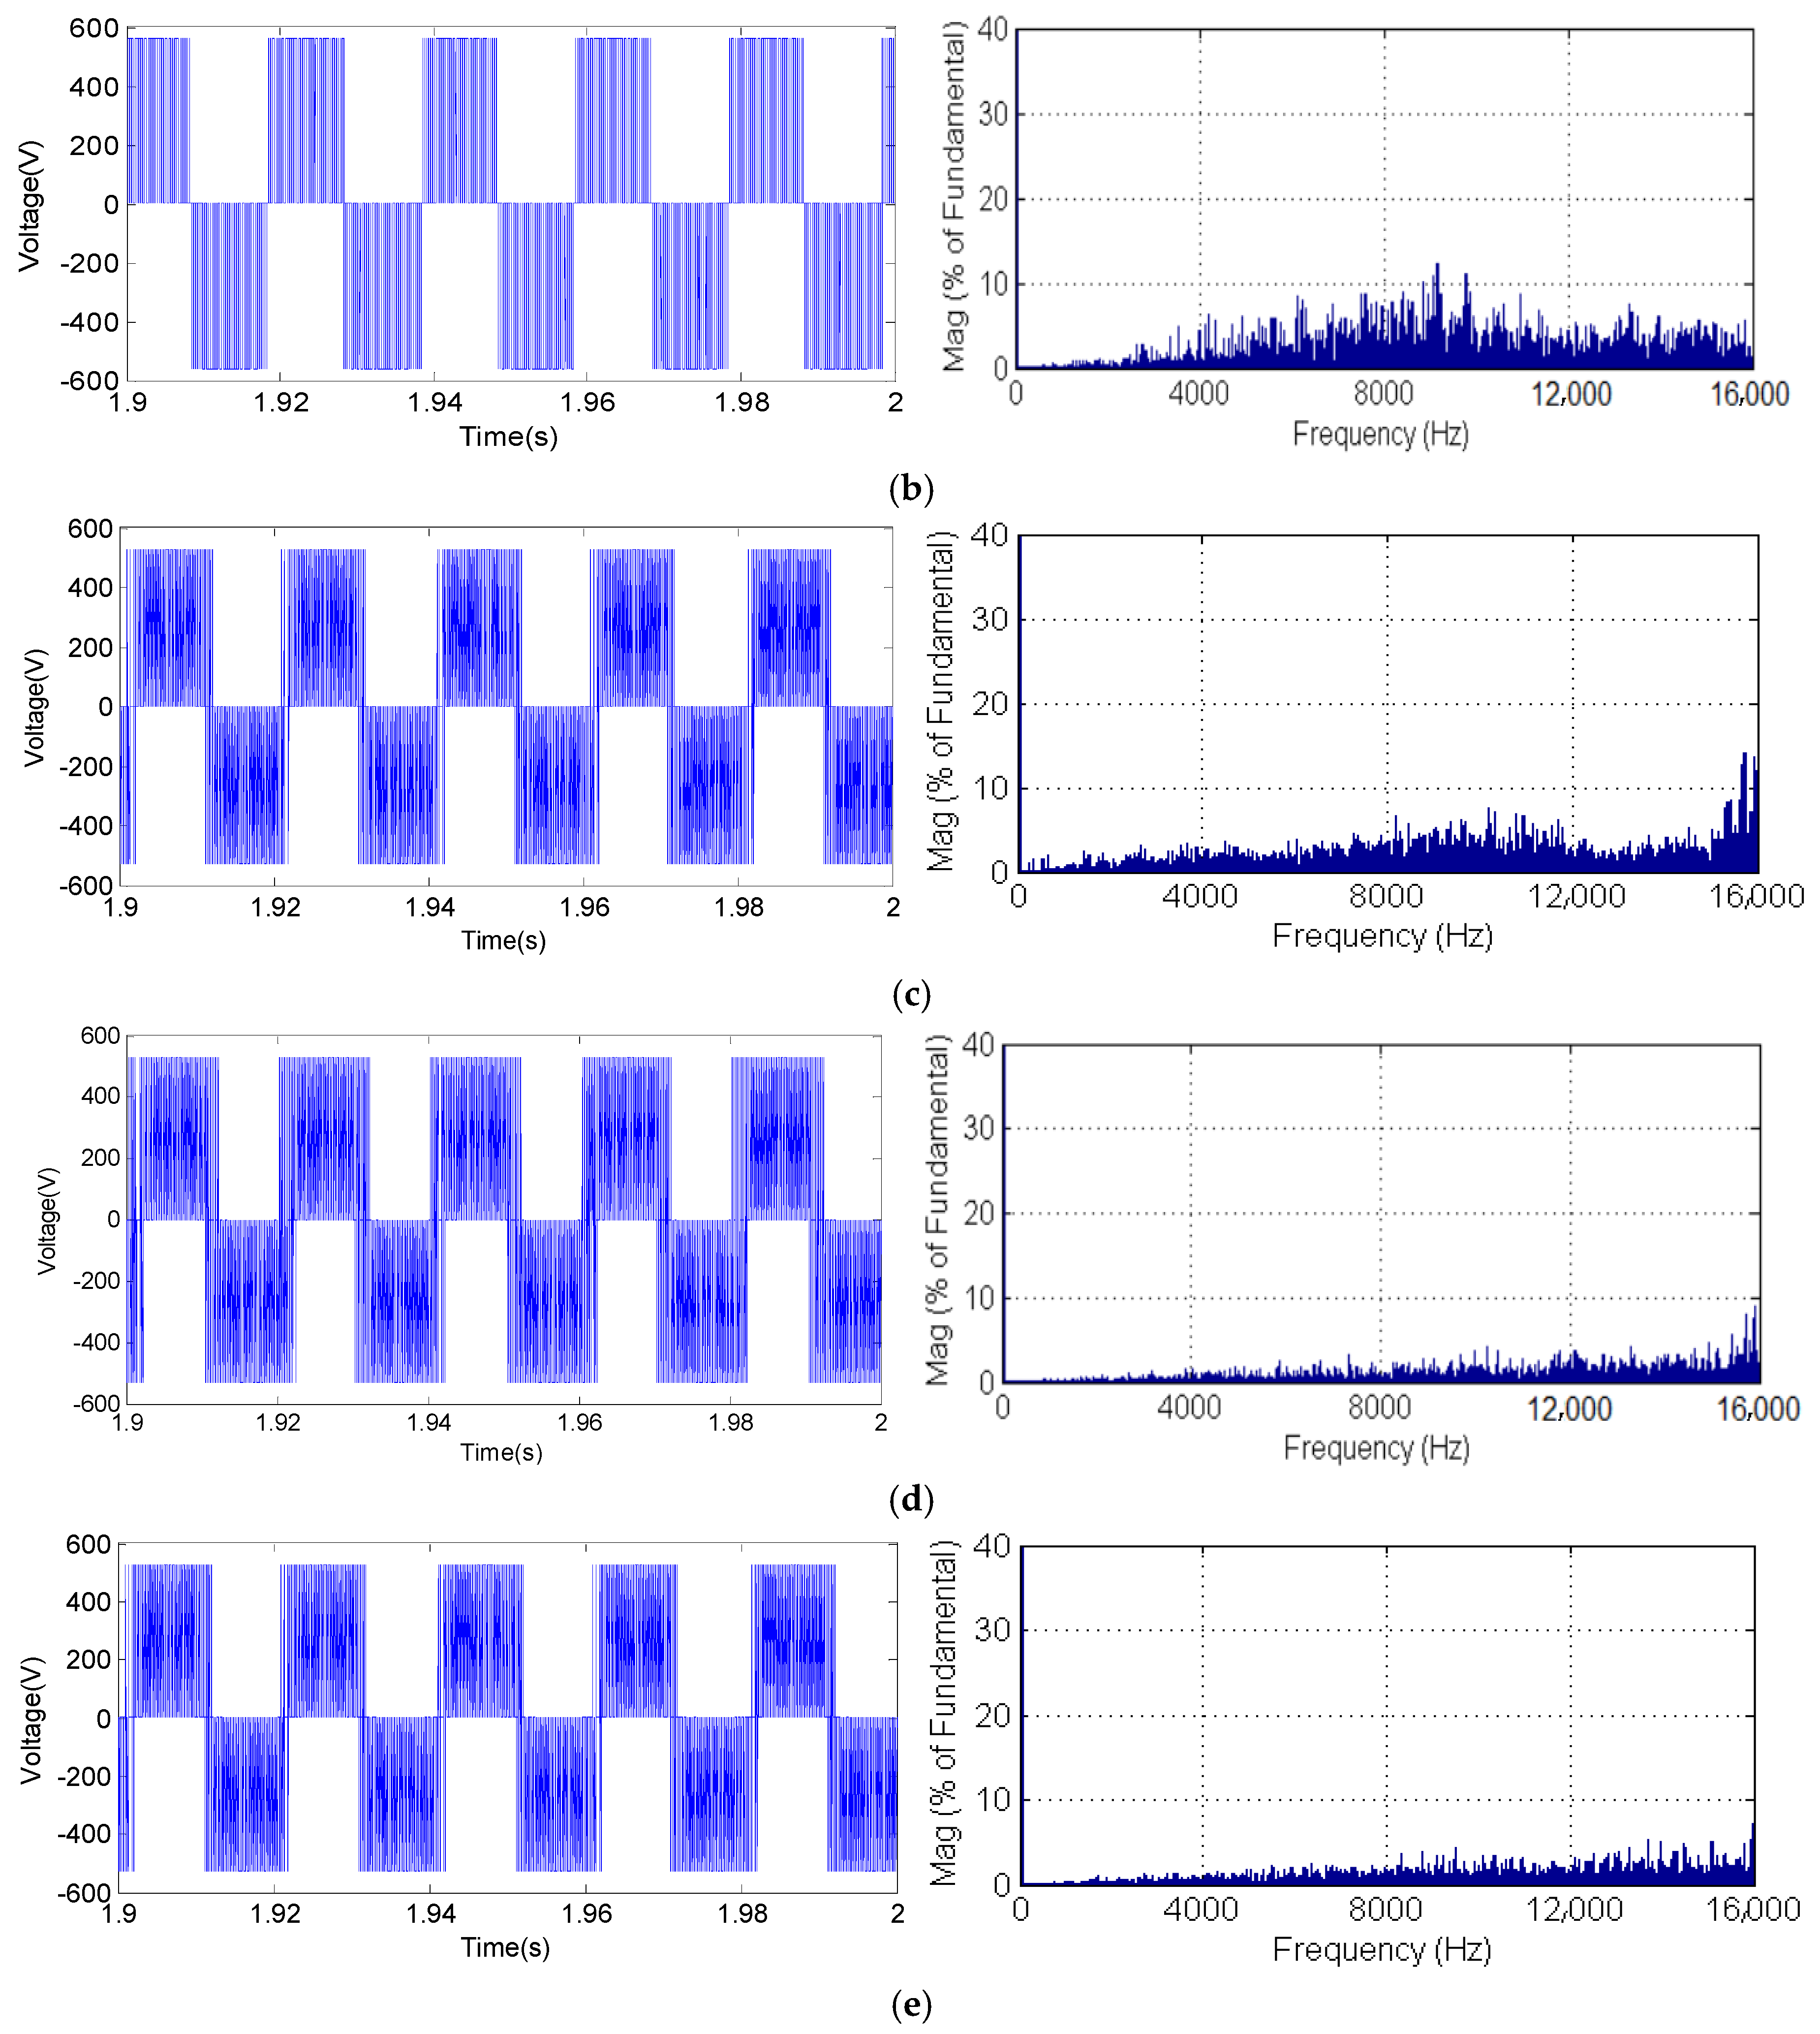
Subsequently, the performance of SVPWM, RPWM and PTC algorithms is evaluated as a function of the current and voltage harmonic content, which represents the source of acoustic noise increase. Figure 16 and Figure 17 depict the current and voltage waveforms and their harmonic spectra, respectively, associated with SVPWM, RPWM and PTC for weighting factors λp = 1.1, λp = 5 and λp = 10. The corresponding obtained THD values are (4.52%, 3.31%, 5.11%, 3.12% and 1.94%) and (70.12%, 50.10%, 50.99%, 32.84% and 32.30%), respectively, for current and voltage. Based on the obtained results, it can be clearly observed that for SVPWM, there is high harmonic near the switching frequency and its multiples. In addition, with RPWM control, it is noted that there is a significant reduction at the harmonic level compared to SVPWM. The harmonic current spectrum is entirely dispersed over the whole frequency band, and the range near the switching frequency and its multiples vanishes. Yet, for PTC, as illustrated in the results given in Figure 16 and Figure 17, under the same control parameters, current qualities are comparable. Moreover, we can clearly observe that the band around the switching frequency and its multiples disappears, and the spectrum is totally spread better over the entire frequency band. In addition, for λp = 10, the THD is reduced, and the spectra disperse well over wide frequency ranges, which confirms their effectiveness in terms of acoustic noise reduction compared to the other controls.
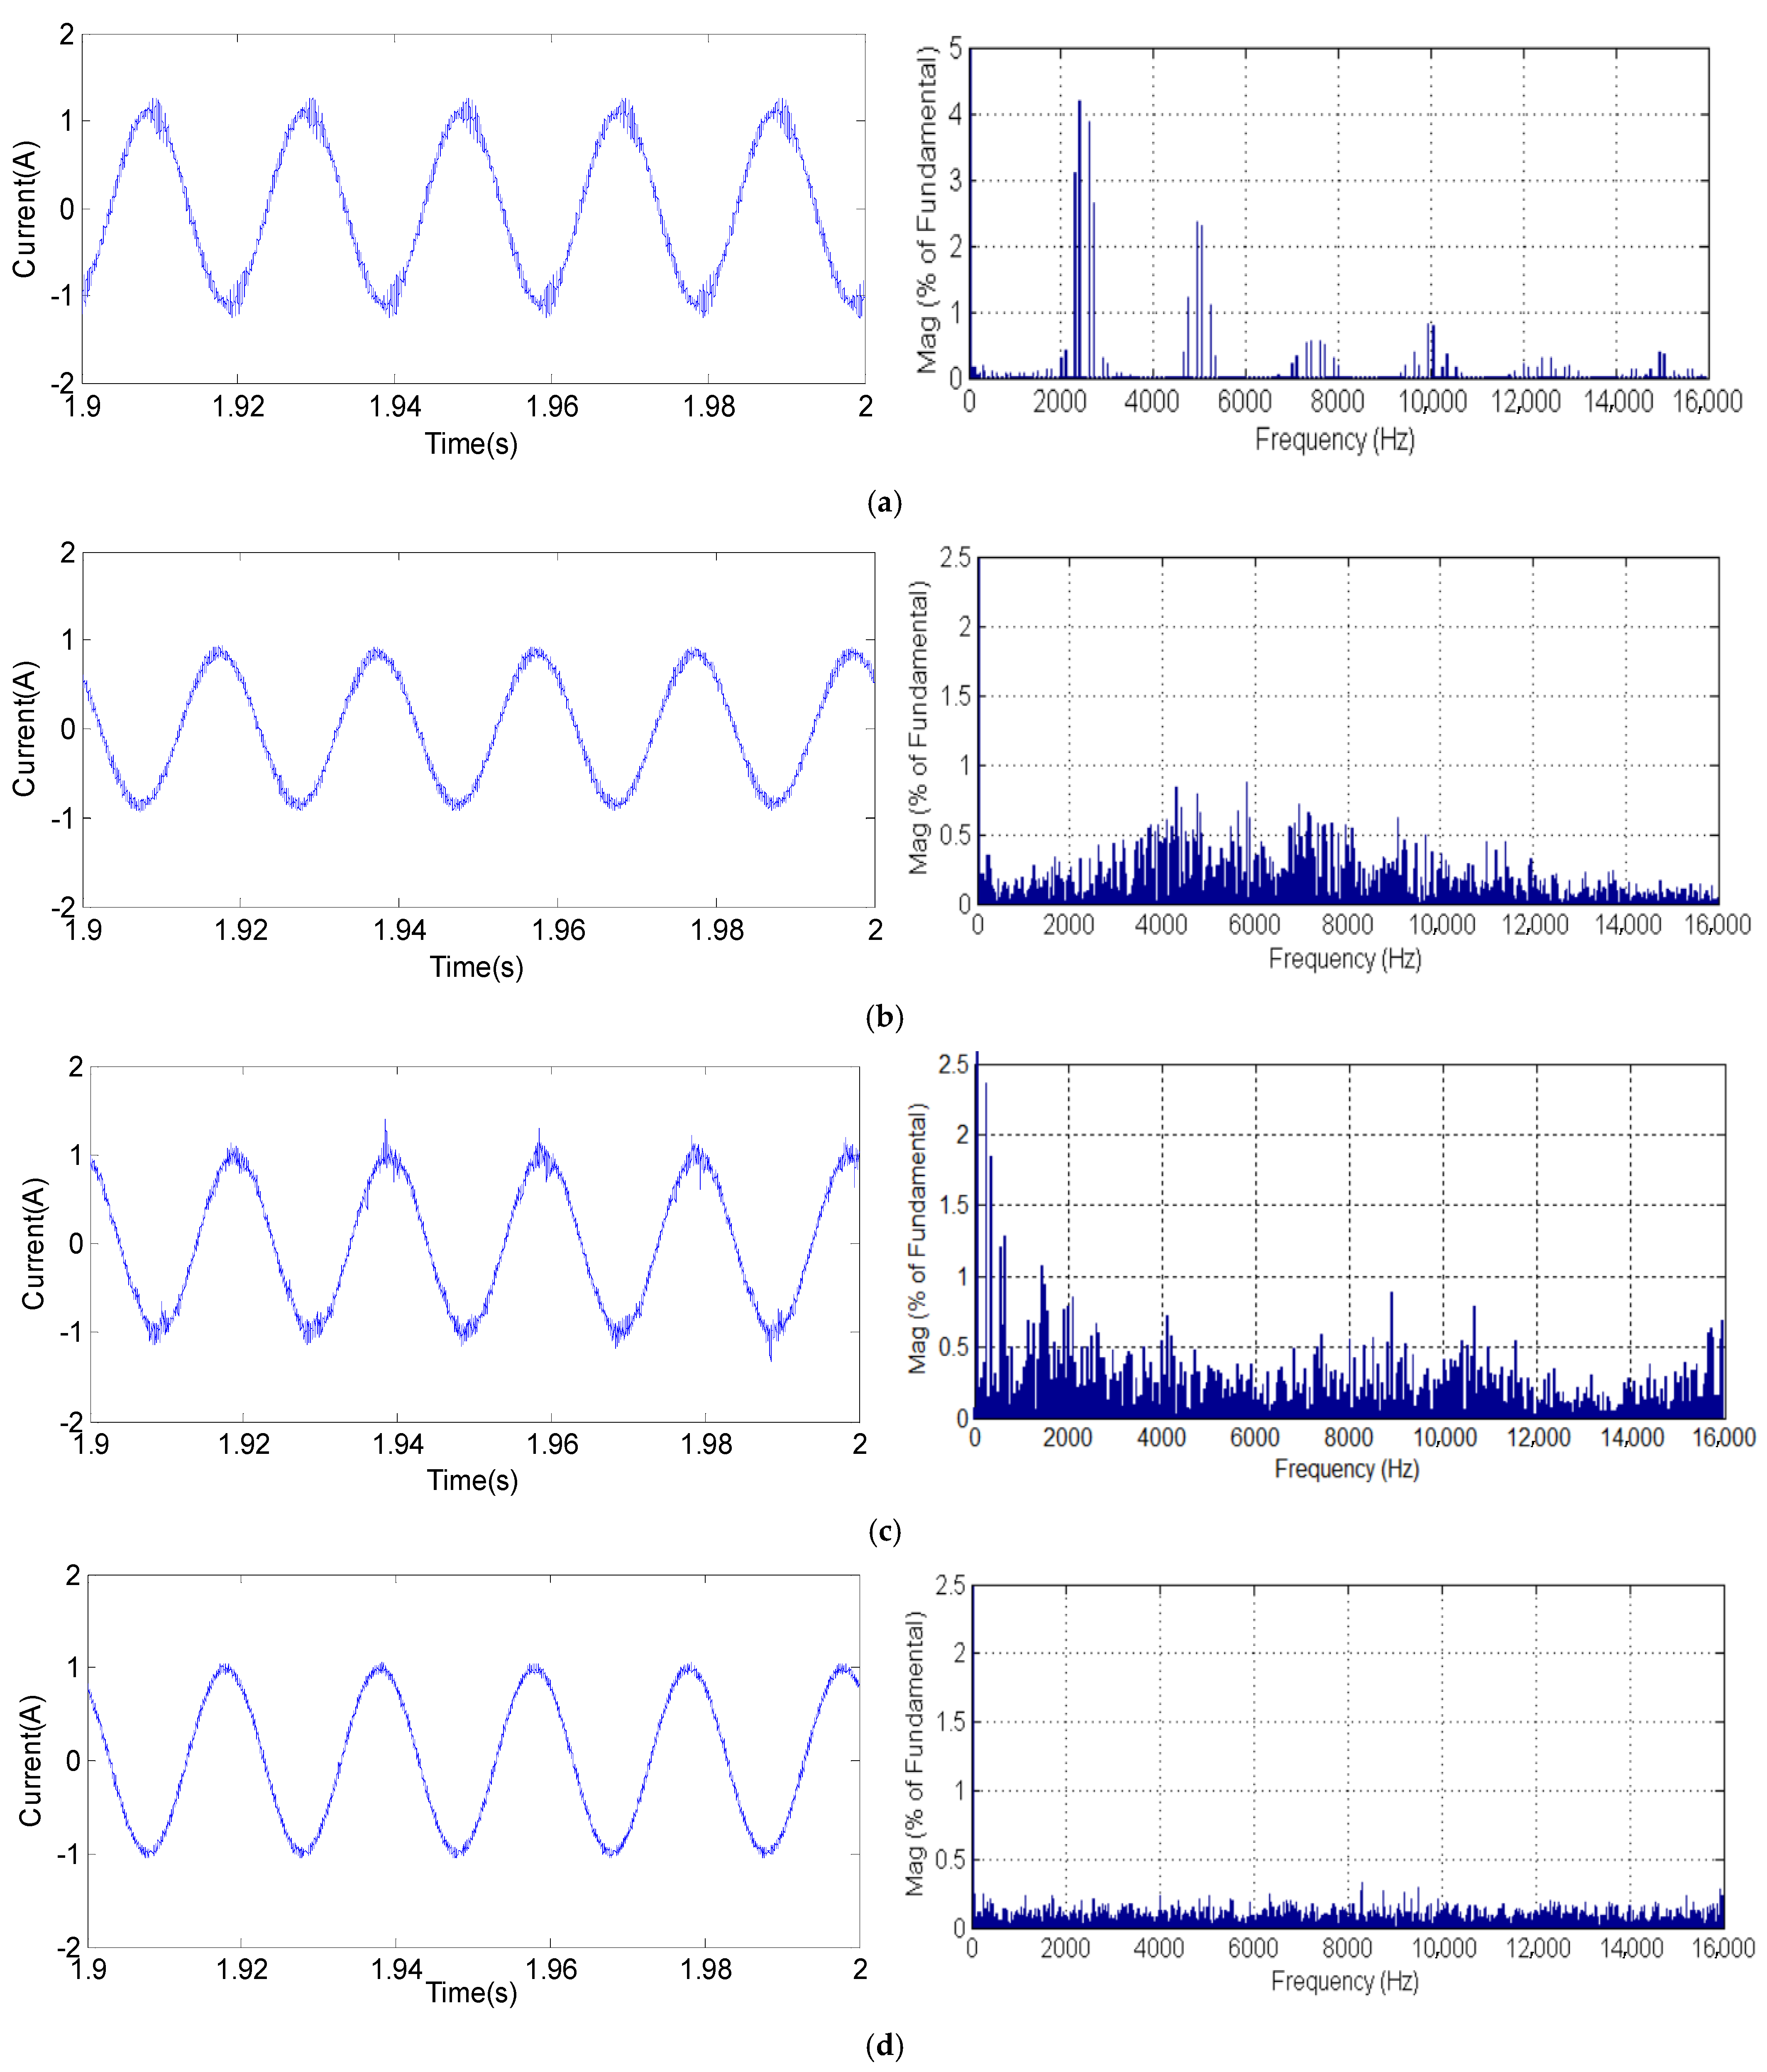
The current stator and harmonic spectra waveforms pertaining to SVPWM, RPWM and PTC for weighting factors λp = 1.1, λp = 5 and λp = 10, respectively, at switching frequency Fc = 2.5 KHz, are illustrated in Figure 18. Thus, the corresponding calculated THD values are, respectively, 8.22%, 4.30%, 7.79% and 2.28%.

5. Experimental Results

5.1. Setup Description

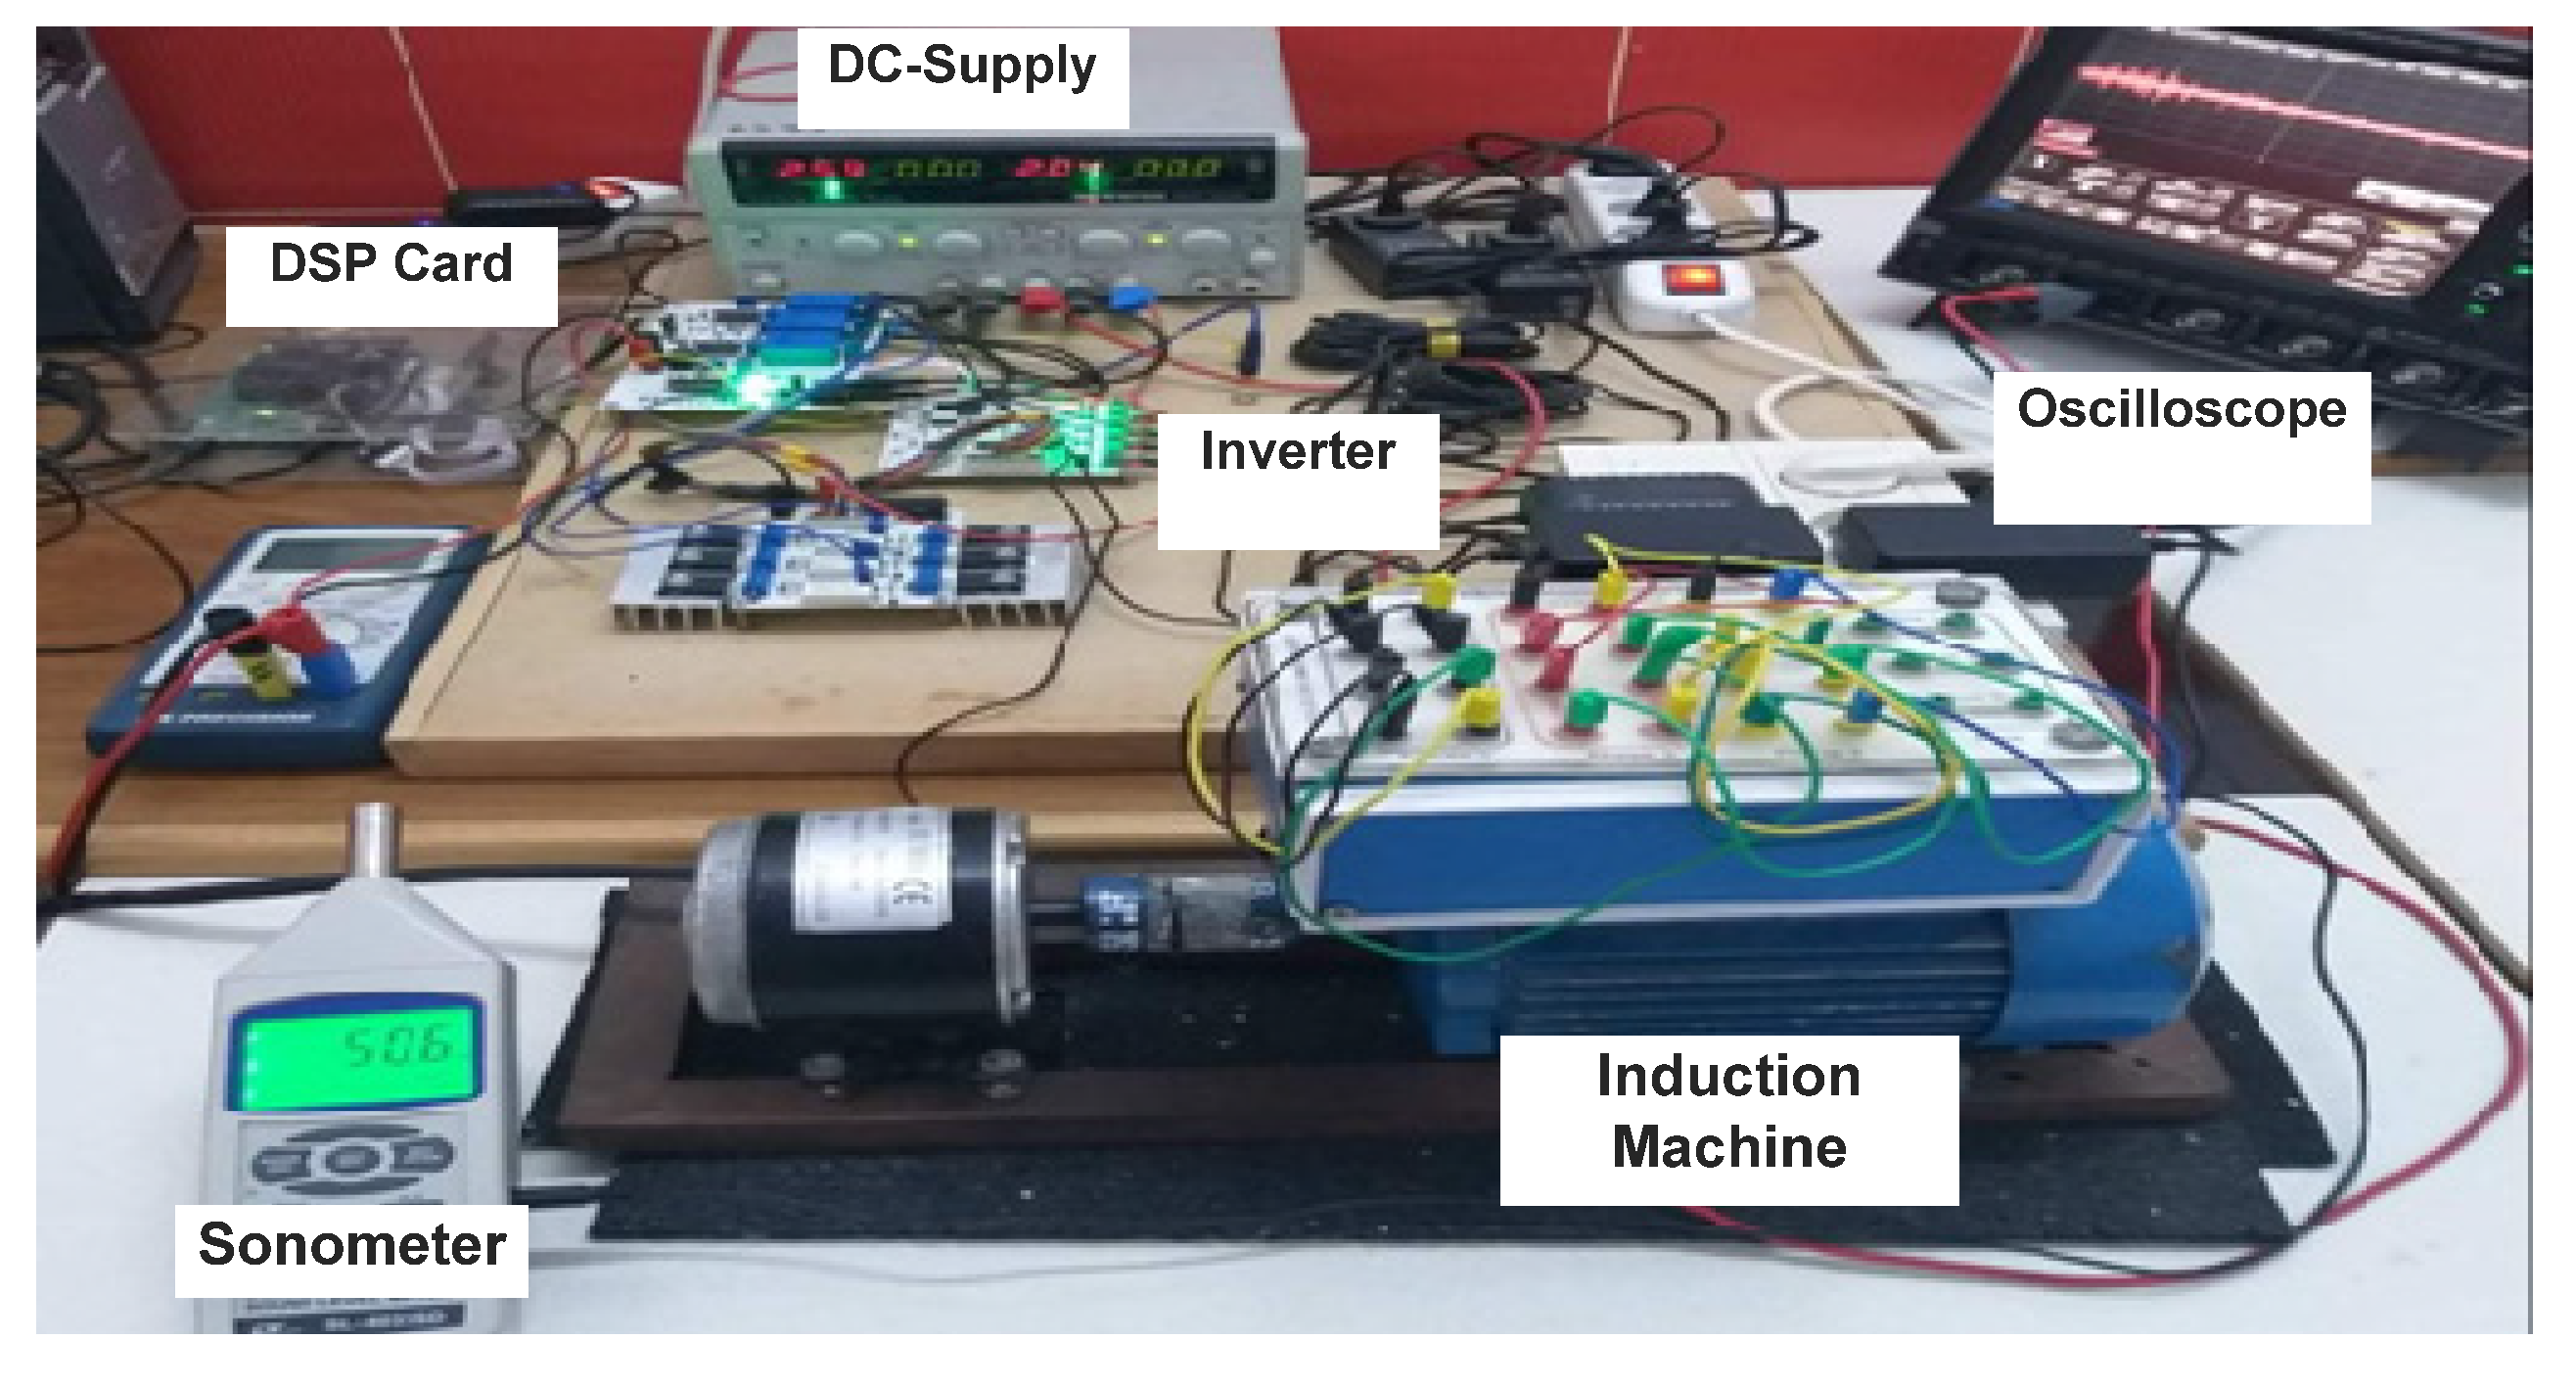
Hardware implementation of predictive control requires an acquisition board allowing us to measure and adapt machine currents and speed. The measured signals are then forwarded to the A/D converter of the F28335 DSP board. This control has been programmed using the Matlab/Simulink environment. The Simulink development tool then automatically generates the C code for the CCS tool, as well as the “.out” file. A sound level meter is used to measure the instantaneous sound pressure [31]. The spectral noise analysis is performed using MATLAB’s FFT function. The machine used in this study is classified as a small machine. Therefore, all measurement points must be located at a 250 mm distance or more from the main machine surface. Measurements should be carried out when the machine reaches a steady state of the operating mode [32,33,34]. The block diagram, shown in Figure 19, describes the predictive control experimental setup for acoustic noise measurements. A photo of the experimental setup is presented in Figure 20. Acoustic noise measurements are performed in accordance with the standards used in electrical machine acoustics. The sound level meter Lutron-SL-4033SD used in this study is equipped with two frequency-weighting curves (A and C) to measure the instantaneous sound in dB. In addition, for frequency weighting “A”, the frequency response is similar to that of the human ear. This curve is commonly used for environmental protection programs. It is widely used in practical electrical machine acoustics. In this work, the measurement of acoustic noise is carried out using the weighting curve dB(A) in accordance with the standard IEC 61672-1/2002 [32].
In the experimental implementation of predictive control, there exists a temporization problem, because the algorithm cannot be executed at the first period t(k). The stator current is first measured at the sampling instant (k). Next, the estimations, predictions and optimization of the cost function are calculated. Thus, the selected voltage vector is not available before time t(k + 2). Accordingly, the calculation time of the algorithm must introduce the delay time that needs to be compensated. This is achieved through two prediction steps (k + 2) [28,29,30,31]. The compensation method is described in Figure 21.
The optimal voltage vector is obtained by minimizing the following cost function:
g T = T e * T e p ( k + 2 ) T n + λ p ψ s * ψ s p ( k + 2 ) ψ s n .
The ability of the human ear can be modeled with appropriate weighting functions or weighting curves. International standards require weighting curves. The A-weighting curve is generally adopted in the acoustics of electrical machines and is equally applied in this study. Figure 22 shows the dB(A) weighting curve for the standard IEC 61672-1/2002.

5.2. Obtained Experimental Results

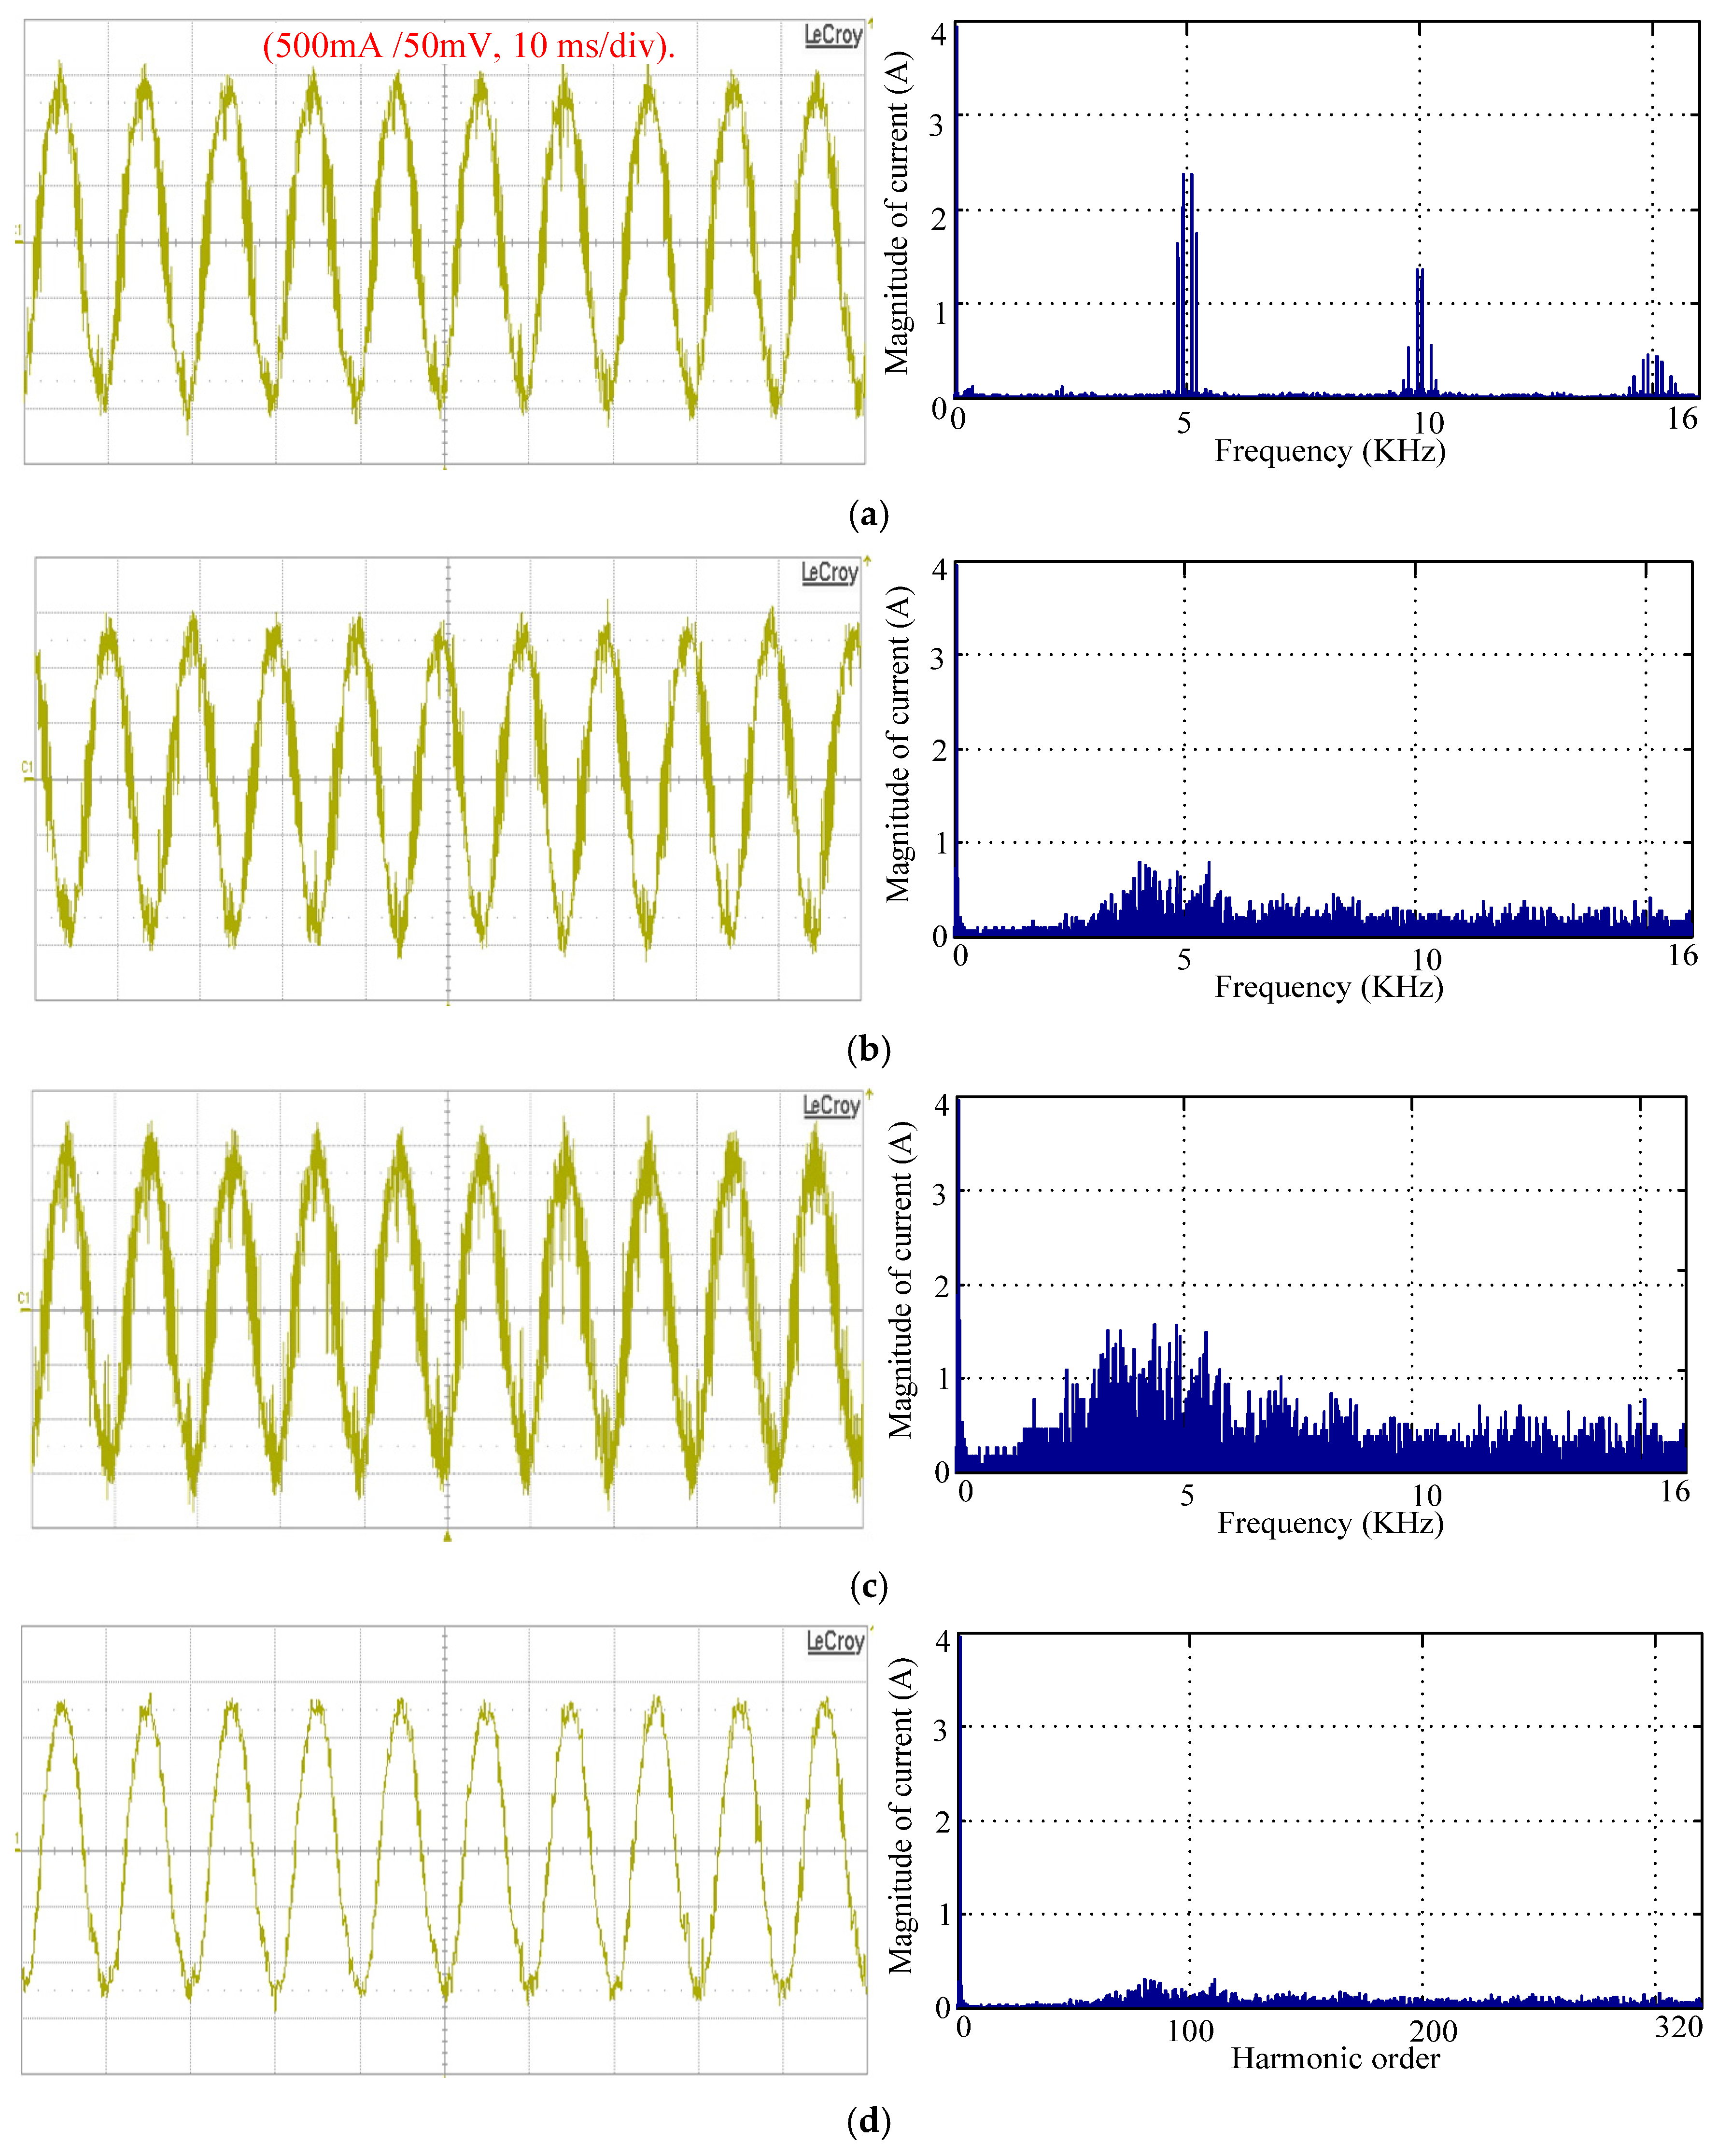
Figure 23 presents the experimental results of the measured stator current and the harmonic spectrum created by the IM supply by a two-level VSI and controlled by SVPWM, RPWM and PTC for the weighting factors (λp = 1.1 and λp = 10) techniques pertaining to where im = 1 and Fc = 5 KHz. As can be seen from the results of the harmonic spectrum, with SVPWM control, the elevated-harmonic components are focused near the switching frequency and its multiples. Additionally, the most amplitudes of current harmonics are situated near the first sideband of the switching frequency. Nevertheless, it can be remarked that the magnitude of current harmonics is minimized considerably using RPWM versus SVPWM. Moreover, the motor current spectrum is perfectly dispersed, and the harmonics near the integer multiples of the switching frequency are eliminated. However, by referring to the stator current waveform, it is clear that for a weighting factor equal to λp = 1.1, PTC provides the stator current with very high ripples, whereas these harmonics are reduced for λp = 10. The range near the switching frequency and its multiples disappears, and the spectrum is totally spread better over the entire frequency band. The same observations are noted with the results obtained by simulation, thus proving the correct functioning of PTC in real time. As a consequence, it is evident that PTC offers improved performance in terms of acoustic noise, as will be demonstrated in the next section.
Subsequently, we examine the impact of the weighting factor on the noise emitted by the machine. The weighted frequency spectra of acoustic noise corresponding to SVPWM, RPWM and PTC for λp = 1.1 and λp = 10, respectively, where im = 1 and Fc = 5 KHz, are performed and demonstrated in Figure 24. Referring to the experimental results, we can note that the high acoustic noise radiated from the IM is produced by SVPWM. The elevated levels are considerable near the integer multiples of the switching frequency, as presented in Figure 24a. For SVPWM, the noise amplitude is −29.7 dBA, −40.8 dBA and −58.2 dBA, respectively, at 5 KHz, 10 KHz and 15 KHz frequencies. The principal noise of these techniques is essentially due to the interaction of the switching frequency and the higher time harmonics. However, with RPWM control, the dominant noise levels produced from the IM near the integer multiples of the switching frequency go away, and the spectrum is dispersed, as shown in Figure 24b. It is visibly observed that RPWM yields a lower noise level than SVPWM. The noise magnitude is −57.18 dBA, −59.79 dBA and −57.18 dBA, respectively, at 5 KHz, 10 KHz and 15 KHz. In addition, based on the obtained results for PTC, λp = 1.1, as shown in Figure 24c, the noise spectra produce very high magnitude components in respect to λp = 10. The noise level is −40.03 dBA, −42.18 dBA and −39.79 dBA, respectively, at 5 KHz, 10 KHz and 15 KHz. However, it is clearly observed that for λp = 10, the noise spectrum is well spread along the frequency range, and the noise level is of order −30 dBA. The noise magnitude is −80.1 dBA, −75.2 dBA and −78.2 dBA, respectively, at 5 KHz, 10 KHz and 15 KHz. Consequently, these experimental tests show that the weighting factor adjustment for PTC influences the harmonic content of the stator current and the noise spectra emitted by the machine. These results also validate the effectiveness of PTC in mitigating the acoustic noise generated by the IM compared to the PWM techniques.
Figure 25 presents the time frequency spectra corresponding to SVPWM, RPWM and PTC for λp = 1.1 and λp = 10, respectively. These results also show that PTC for an optimum weighting factor of λp = 10 gives better performance in terms of the current spectrogram.
A summary table (Table 2) compares SVPWM, RPWM and PTC for an optimum weighting factor of λp = 10 in terms of current THD (%), acoustic noise level (dBA) emitted by an IM and type of switching frequency. Therefore, it is noted that PTC has lower THD and acoustic noise levels than the SVPWM and RPWM techniques.

6. Conclusions

Although the three-phase inverter–IM combination is crucial for industrial applications, it has damaging effects that degrade system performance. In this paper, we have shown that the acoustic noise of an IM is positively influenced by predictive control by comparing it to the PWM techniques. PTC with a weighting factor has been proposed to study the performance of the inverter IM association in terms of acoustic noise. The harmonic analysis of the stator voltage and current, which represents the source of acoustic noise increase, has been investigated corresponding to SVPWM, RPWM and PTC. The obtained simulation results have shown that PTC is more efficient than random modulation. In addition, the simulation results of the harmonic content have validated that for the SVPWM technique, the harmonic components have been created around the switching frequency and its multiples. However, the harmonic spectrum of RPWM has been entirely scattered over the whole frequency range, and the band near the switching frequency and its multiples has been eliminated. Nevertheless, for a lower weighting factor, PTC provides the stator current with very high ripples, whereas these harmonics are reduced for a high weighting factor. The experimental implementation of predictive control is still carried out in order to investigate the influence of weighting factors on the noise emitted by the machine. It has been proven by experimental results that the adjustment of the weighting factor influences the harmonic content of the stator current and the noise spectra emitted by the machine. Our proposed PTC offers high performance as regards the harmonic current and decreases the acoustic noise of inverter-fed motor drives compared to PWM techniques.

Author Contributions

Conceptualization, B.H.; methodology, B.H. and A.K.; validation, B.H. and A.K.; formal analysis, B.H.; investigation, B.H.; resources, B.H.; data curation, B.H.; writing—original draft preparation, B.H.; writing—review and editing, B.H. and A.K.; supervision, A.K.; funding acquisition, A.K. All authors have read and agreed to the published version of the manuscript.

Funding

This research received no external funding.

Institutional Review Board Statement

Not applicable.

Informed Consent Statement

Not applicable.

Data Availability Statement

The original contributions presented in this study are included in the article. Further inquiries can be directed to the corresponding author.

Conflicts of Interest

The authors declare no conflicts of interest.

Abbreviations

The following abbreviations are used in this manuscript:
LrRotor inductance
LsStator inductance
LmMutual inductance
RsStator resistance
RrRotor resistance
KrReal rotor time constant
Kr=Lm/Lr
R σ Equivalent resistance referred to stator R σ = R s + k r 2 R r
σ Total dispersion factor
L σ Leakage   inductance L σ = σ L s
τ σ Transient stator time constant τ σ = L σ / R σ
TrRotor time constant Tr=Lr/Rr
ω Rotor speed
i s Stator current vector
i r Rotor current vector
i s p ( k + 1 ) Predicted stator current at time (k + 1)
kSampling time
V s Stator voltage vector
ψ s Stator flux vector
ψ r Rotor flux vector
ψ s n Rated stator flux amplitude
ψ s p ( k + 1 ) Predicted stator flux at time (k + 1)
TeElectromagnetic torque
T e * Reference electromagnetic torque
TnRated torque
T e p ( k + 1 ) Predicted electromagnetic torque at time (k + 1)
λ p Weighting factor
p(t)Instantaneous sound pressure
p 0 Reference sound pressure

References

  1. Gieras, J.F.; Wang, C.; Lai, J.C. Noise of Polyphase Electric Motors; CRC Press: Boca Raton, FL, USA, 2018. [Google Scholar]
  2. Vijayraghavan, P.; Krishnan, R. Noise in electric machines: A review. IEEE Trans. Ind. Appl. 1999, 35, 1007–1013. [Google Scholar] [CrossRef]
  3. Patxi, G.; Garikoitz, B.; Angel, M. Noise in Electric Motors: A Comprehensive Review. Energies 2023, 16, 5311. [Google Scholar] [CrossRef]
  4. Zhang, W.; Xiao, L.; Xu, Y.; Zou, J. PWM harmonics reduction for dual-branch three-phase PMSMs using interleaving topology. Energy Rep. 2023, 9, 190–194. [Google Scholar] [CrossRef]
  5. Kumar, A.B.; Narayanan, G. Variable-switching frequency PWM technique for induction motor drive to spread acoustic noise spectrum with reduced current ripple. IEEE Trans. Ind. Appl. 2016, 52, 3927–3938. [Google Scholar] [CrossRef]
  6. Huang, Y.; Xu, Y.; Li, Y.; Guijie, Y.; Jibin, Z. PWM frequency voltage noise cancelation in three-phase VSI using the novel SVPWM strategy. IEEE Trans. Power Electron. 2017, 33, 8596–8606. [Google Scholar] [CrossRef]
  7. Luznar, J.; Slavič, J.; Baltežar, M. Experimental research on structure-borne noise at pulse-width-modulation excitation. J. Appl. Acoust. 2018, 137, 33–39. [Google Scholar] [CrossRef]
  8. Fang, Y.; Zhang, T. Sound quality of the acoustic noise radiated by PWM-fed electric powertrain. IEEE Trans. Ind. Electron. 2018, 65, 4534–4541. [Google Scholar] [CrossRef]
  9. Perumandla, S.; Upadhyay, P.; Jayalaxmi, A.; Jaya, P.N. Modulated frequency triangular carrier based space vector PWM technique for spreading induction motor acoustic noise spectrum. In Proceedings of the International Conference on Emerging Trends in Engineering, Cham, Switzerland, 4–6 September 2020. [Google Scholar]
  10. Bouyahi, H.; Smida, K.B.; Khedher, A. Experimental study of PWM strategy effect on acoustic noise generated by inverter-fed induction machine. Int. Trans. Electr. Energy Syst. 2020, 30, e12249. [Google Scholar] [CrossRef]
  11. Huang, Y.; Xu, Y.; Zhang, W.; Zou, J. Hybrid periodic carrier frequency modulation technique based on modified SVPWM to reduce the PWM noise. IET Power Electron. 2019, 12, 515–520. [Google Scholar] [CrossRef]
  12. Sio-Iong, A. Advances in Electrical Engineering and Computational Science; Gelmen, L., Ed.; Springer Science and Business Media: Berlin/Heidelberg, Germany, 2009; Volume 39. [Google Scholar]
  13. Chan, T.; Shi, K. Applied Intelligent Control of Induction Motor Drives; John Wiley and Sons: Hoboken, NJ, USA, 2011. [Google Scholar]
  14. Tsoumas, P.; Tischmacher, H. Influence of the inverter’s modulation technique on the audible noise of electric motors. IEEE Trans. Ind. Appl. 2014, 50, 269–278. [Google Scholar] [CrossRef]
  15. Fang, Y.; Zhang, T. Sound quality investigation and improvement of an electric powertrain for electric vehicles. IEEE Trans. Ind. Electron. 2018, 65, 1149–1157. [Google Scholar] [CrossRef]
  16. Binojkumar, C.; Saritha, B.; Narayanan, G. Acoustic noise characterization of space-vector modulated induction motor drives—An experiment al approach. IEEE Trans. Ind. Electron. 2015, 62, 3362–3371. [Google Scholar]
  17. Bouyahi, H.; Khedher, A. Acoustic Noise of Induction Motor Drive with Voltage-Source Inverter by Random Space Vector PWM: Simulation and Experimentation Analysis. Appl. Sci. 2025, 15, 4646. [Google Scholar] [CrossRef]
  18. Huang, Y.; Xu, Y.; Wentao, Z.; Zou, J. Hybrid RPWM technique based on modified SVPWM to reduce the PWM acoustic noise. IEEE Trans. Power Electron. 2018, 34, 5667–5674. [Google Scholar] [CrossRef]
  19. Huang, Y.; Xu, Y.; Zhang, W.; Zou, J. PWM frequency noise cancellation in two-segment three-phase motor using parallel interleaved inverters. IEEE Trans. Power Electron. 2018, 34, 2515–2525. [Google Scholar] [CrossRef]
  20. Kroneisl, M.; Šmídl, V.; Peroutka, Z.; Janda, M. Predictive control of IM drive acoustic noise. IEEE Trans. Ind. Electron. 2020, 67, 5666–5676. [Google Scholar] [CrossRef]
  21. Boudouda, A.; Boudjerda, N.; Aibeche, A. dSPACE-based dual randomized pulse width modulation for acoustic noise mitigation in induction motor. J. Braz. Soc. Mech. Sci. Eng. 2022, 44, 493. [Google Scholar] [CrossRef]
  22. Rodriguez, J.; Pontt, J.; Silva, C.A.; Correa, P.; Lezana, P.; Cortes, P.; Ammann, U. Predictive current control of a voltage source inverter. IEEE Trans. Ind. Electron. 2007, 54, 495–503. [Google Scholar] [CrossRef]
  23. Correa, P.; Pacas, M.; Rodriguez, J. Predictive torque control for inverter-fed induction machines. IEEE Trans. Ind. Electron. 2007, 54, 1073–1079. [Google Scholar] [CrossRef]
  24. Vazquez, S.; Rodriguez, J.; Rivera, M.; Franquelo, L.G. Model predictive control for power converters and drives: Advances and trends. IEEE Trans. Ind. Electron. 2016, 64, 935–947. [Google Scholar] [CrossRef]
  25. Song, W.; Le, S.; Wu, X.; Ruan, Y. An improved model predictive direct torque control for induction machine drives. J. Power Electron. 2017, 17, 674–685. [Google Scholar] [CrossRef]
  26. Comarella, B.V.; Carletti, D.; Yahyaoui, I.; Encarnação, L.F. Theoretical and Experimental Comparative Analysis of Finite Control Set Model Predictive Control Strategies. Electronics 2023, 12, 1482. [Google Scholar] [CrossRef]
  27. Habibullah, M.; Lu, D.-C.; Xiao, D.; Rahman, M.F. A simplified finite-state predictive direct torque control for induction motor drive. IEEE Trans. Ind. Electron. 2016, 63, 3964–3975. [Google Scholar] [CrossRef]
  28. Azab, M. A finite control set model predictive control scheme for single-phase grid-connected inverters. Renew. Sustain. Energy Rev. 2021, 135, 110131. [Google Scholar] [CrossRef]
  29. Rojas-Monrroy, C.A. Multiobjective Finite Control Set Model Predictive Torque and Stator Flux Control of an Induction Machine. Ph.D. Thesis, Federico Santa María Technical University, Valparaíso, Chile, 2013. [Google Scholar]
  30. Wu, W.; Qiu, L.; Rodriguez, J.; Liu, X.; Ma, J.; Fang, Y. Data-driven finite control-set model predictive control for modular multilevel converter. IEEE J. Emerg. Sel. Top. Power Electron. 2022, 11, 523–531. [Google Scholar] [CrossRef]
  31. Han, Y.; Gong, C.; Yan, L.; Wen, H.; Wang, Y.; Shen, K. Multiobjective finite control set model predictive control using novel delay compensation technique for PMSM. IEEE Trans. Ind. Electron. 2020, 35, 11193–11204. [Google Scholar] [CrossRef]
  32. SL-4033SD; Sound Level Meter Model: ISO-9001, CE, and IEC1010. ISO: Geneva, Switzerland; European Commission: Brussels, Belgium; IEC: Worcester, MA, USA, 2013.
  33. IEEE 85-1973; IEEE Test Procedure for Airborne Sound Measurements on Rotating Electric Machinery. IEEE Power Engineering Society: Piscataway, NJ, USA, 1980.
  34. Lisner, R.-P.; Timar, P.-L. A new approach to electric motor acoustic noise standards and test procedures. IEEE Trans. Energy Convers. 1999, 14, 692–697. [Google Scholar] [CrossRef]
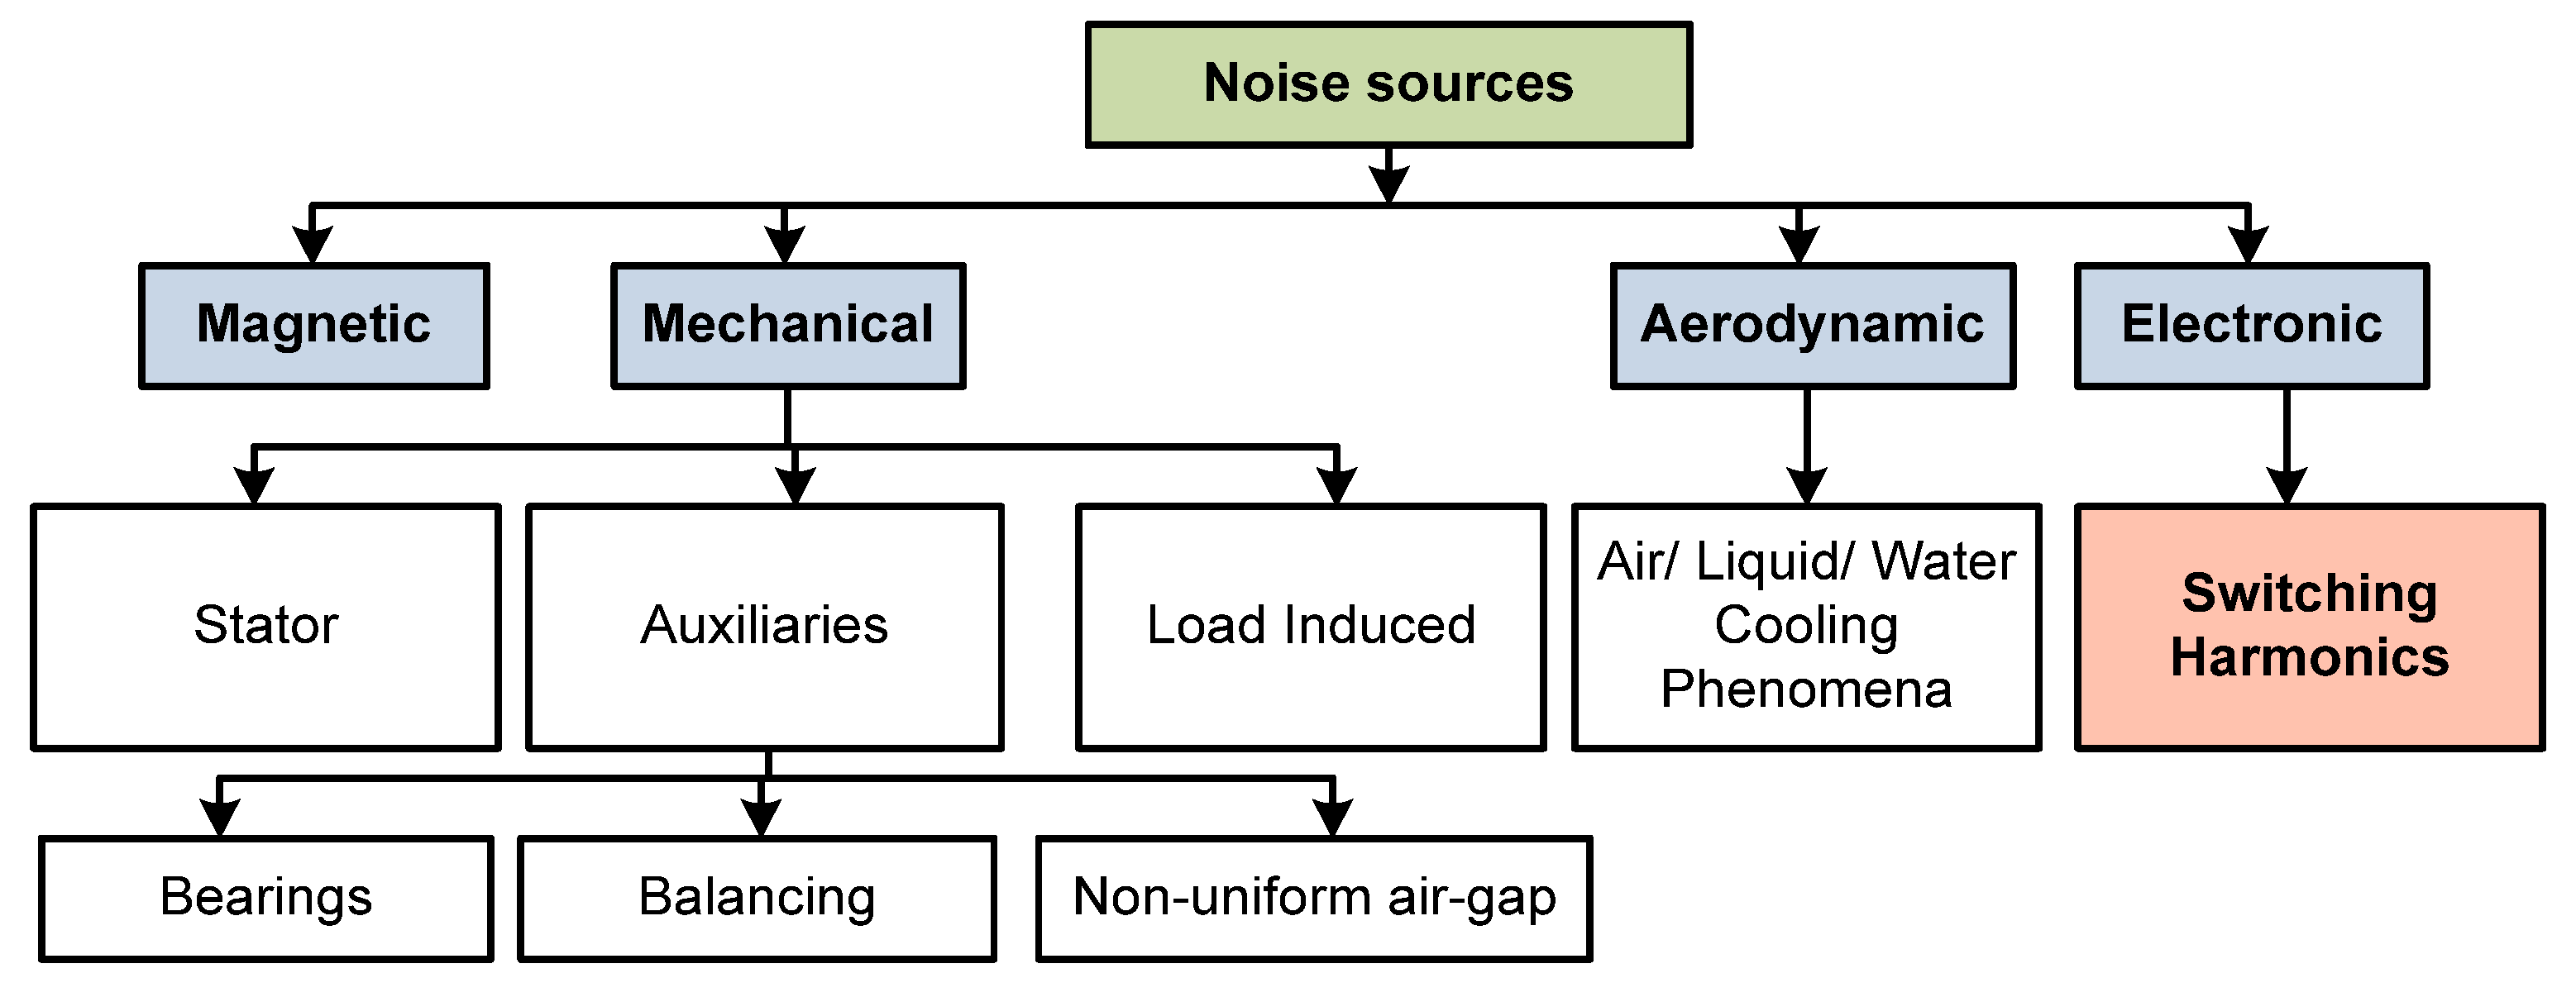
Figure 1. Sources of noise in electric machines.
Acoustics 07 00063 g001
Figure 2. IM fed by a three-phase inverter.
Acoustics 07 00063 g002
Figure 3. Electronic noise creating process.
Acoustics 07 00063 g003
Figure 4. Space vector diagram.
Acoustics 07 00063 g004
Figure 5. Switching state for SVPWM at sector 1.
Acoustics 07 00063 g005
Figure 6. Random-frequency carrier wave.
Acoustics 07 00063 g006
Figure 7. Waveforms for Switch S11 using RPWM.
Acoustics 07 00063 g007
Figure 8. PTC torque predictive control diagram.
Acoustics 07 00063 g008
Figure 9. PI speed controller.
Acoustics 07 00063 g009
Figure 10. Stator current THD as a function of weighting factor.
Acoustics 07 00063 g010
Figure 11. Simulation results obtained from machine controlled by PTC for λp = 1.1: (a) speed, (b) electromagnetic torque and (c) stator currents (ia, ib, ic).
Acoustics 07 00063 g011
Figure 12. Simulation results obtained from machine controlled by PTC for λp = 5: (a) speed, (b) electromagnetic torque and (c) stator currents (ia, ib, ic).
Acoustics 07 00063 g012
Figure 13. Simulation results obtained from machine controlled by PTC for λp = 10: (a) speed, (b) electromagnetic torque and (c) stator currents (ia, ib, ic).
Acoustics 07 00063 g013
Figure 14. Simulation results obtained from machine with speed reversal for λp = 1.1: (a) speed, (b) electromagnetic torque and (c) stator current.
Acoustics 07 00063 g014
Figure 15. Simulation results obtained from machine with speed reversal for λp = 10: (a) speed, (b) electromagnetic torque and (c) stator current.
Acoustics 07 00063 g015
Figure 16. Stator current waveforms and harmonic spectrum using (a) SVPWM, (b) RPWM, (c) PTC for λp = 1.1, (d) PTC for λp = 5 and (e) PTC for λp = 10 at Fc = 5 Khz.
Acoustics 07 00063 g016aAcoustics 07 00063 g016b
Figure 17. Stator voltage waveforms and harmonic spectrum using (a) SVPWM, (b) RPWM, (c) PTC for λp = 1.1 (d) PTC for λp = 5 and (e) PTC for λp = 10 at Fc = 5 Khz.
Acoustics 07 00063 g017aAcoustics 07 00063 g017b
Figure 18. Stator voltage waveforms and harmonic spectrum using (a) SVPWM, (b) RPWM, (c) PTC for λp = 1.1 and (d) PTC for λp = 10 at Fc = 2.5 Khz.
Acoustics 07 00063 g018
Figure 19. Synoptic diagram of the predictive control experimental bench for acoustic noise measurement.
Acoustics 07 00063 g019
Figure 20. Photo of experimental bench.
Acoustics 07 00063 g020
Figure 21. Delay time compensation description [28].
Acoustics 07 00063 g021
Figure 22. A-weighting curve for the standard IEC 61672-1/2002.
Acoustics 07 00063 g022
Figure 23. Experimental stator current waveforms and harmonic spectrum using (a) SVPWM, (b) RPWM, (c) PTC for λp = 1.1 and (d) for λp = 10.
Acoustics 07 00063 g023
Figure 24. Acoustic noise spectra emitted by machine using: (a) SVPWM, (b) RPWM, (c) PTC for λp = 1.1 and (d) for λp = 10.
Acoustics 07 00063 g024
Figure 25. Measured current spectrogram using (a) SVPWM, (b) RPWM, (c) PTC for λp = 1.1 and (d) for λp = 10.
Acoustics 07 00063 g025
Table 1. IM parameters.
ParameterValue
Rated power0.5 Kw
Motor speed3000 r/min
Stator resistance24 Ω
Stator inductance0.66 H
Rotor resistance10.88 Ω
Rotor inductance0.66 H
Mutual inductance0.63 H
Friction coefficient0.00159
Inertia moment0.004 Kg.m2
Pair pole number1
Table 2. Comparison of SVPWM, RPWM and PTC techniques.
SVPWMRPWMPTC
THD current (%)4.523.311.94
Acoustic noise (dBA)−29.7−57.18−80.01
FrequencyFixedRandomFixed
Disclaimer/Publisher’s Note: The statements, opinions and data contained in all publications are solely those of the individual author(s) and contributor(s) and not of MDPI and/or the editor(s). MDPI and/or the editor(s) disclaim responsibility for any injury to people or property resulting from any ideas, methods, instructions or products referred to in the content.