1. Introduction
Enhancing the efficiency and safety of air transportation continues to be a key objective for aircraft manufacturers. In parallel, passenger comfort has emerged as an increasingly crucial aspect within today’s highly competitive aviation market. The cabin environment, in particular, significantly influences passengers’ perceived comfort levels, directly shaping their overall flight experience and future airline preferences. Penning [
1] highlights that a positive comfort experience aboard an aircraft markedly increases the likelihood of passengers selecting the same aircraft or airline again. Moreover, enhanced passenger comfort contributes to calmer onboard behavior, thereby reducing stress and workload for crew members, which, in turn, improves overall flight safety.
A key aspect of ensuring passenger comfort in aircraft cabins is controlling noise, vibration, and harshness (NVH). NVH issues can lead to passenger fatigue, discomfort, and dissatisfaction, negatively impacting passenger satisfaction and brand reputation. As detailed by Dhaoui [
2], the interaction between elastic structures and surrounding fluids, such as air, produces complex vibroacoustic phenomena characterized by mutual coupling between structural vibrations and acoustic pressures. These interactions can generate resonance, mode shifting, and energy dissipation, influenced by structural geometry, material properties, boundary conditions, and excitation frequencies. Consequently, achieving optimal vibroacoustic performance has become essential, requiring sophisticated coupled structural–acoustic analyses [
3].
Aircraft noise, a prominent component of vibroacoustic performance, originates primarily from engines, propellers, airframes, and structure-borne noise. Different engine types, including piston, turboprop, turbojet, and turbofan, produce distinctive acoustic signatures. While piston engines generate noise dependent on rotational speed and cylinder count, turbojets emit strong broadband jet exhaust noise, and turbofans present prominent harmonic tones at blade pass frequencies. Airframe noise, predominantly broadband, significantly escalates with increasing aircraft speed, whereas structure-borne noise arises from vibrations transmitted through structural components [
4]. Proper identification and mitigation of these noise sources through detailed mapping of transmission paths can significantly enhance cabin acoustic quality.
Due to the inherent complexity of vibroacoustic phenomena, closed-form analytical solutions are often impractical, leading researchers to employ numerical techniques such as the Finite Element Method (FEM) [
5], Boundary Element Method (BEM) [
6], and Isogeometric Analysis (IGA) [
7]. In addressing computational challenges at mid-to-high frequencies, these deterministic methods are frequently combined with statistical or hybrid approaches [
8,
9]. Mesh quality and numerical resolution remain critical factors, with mesh element sizes determined by acoustic wavelengths and structural vibration characteristics. Meshless formulations such as the Element-Free Galerkin Method (EFGM) and Smooth Particle Hydrodynamics (SPH) alleviate some meshing constraints and accommodate large deformations, yet their underlying quadrature and numerical conditioning remain challenging [
10]. Complementary probabilistic tools, e.g., structural fuzzy modeling and Karhunen-Loève expansions, further refine mid-frequency predictions [
11]. Prior vibroacoustic investigations have largely relied on idealized fuselage shapes. Grewal et al. [
12], for instance, adopted a stiffened-shell structural model to analyze the structural and acoustic response at the blade pass frequency (BPF), but simplified the fuselage to a mere cylindrical shell, curtailing geometric fidelity. Carducci et al. [
13] similarly validated a finite element methodology for predicting and attenuating low-frequency, propeller-induced cabin noise, yet again assumed a cylindrical fuselage representation. These geometric simplifications can lead to appreciable inaccuracies when applied to real-world aircraft, whose intricate internal layouts and boundary conditions deviate significantly from an ideal cylinder.
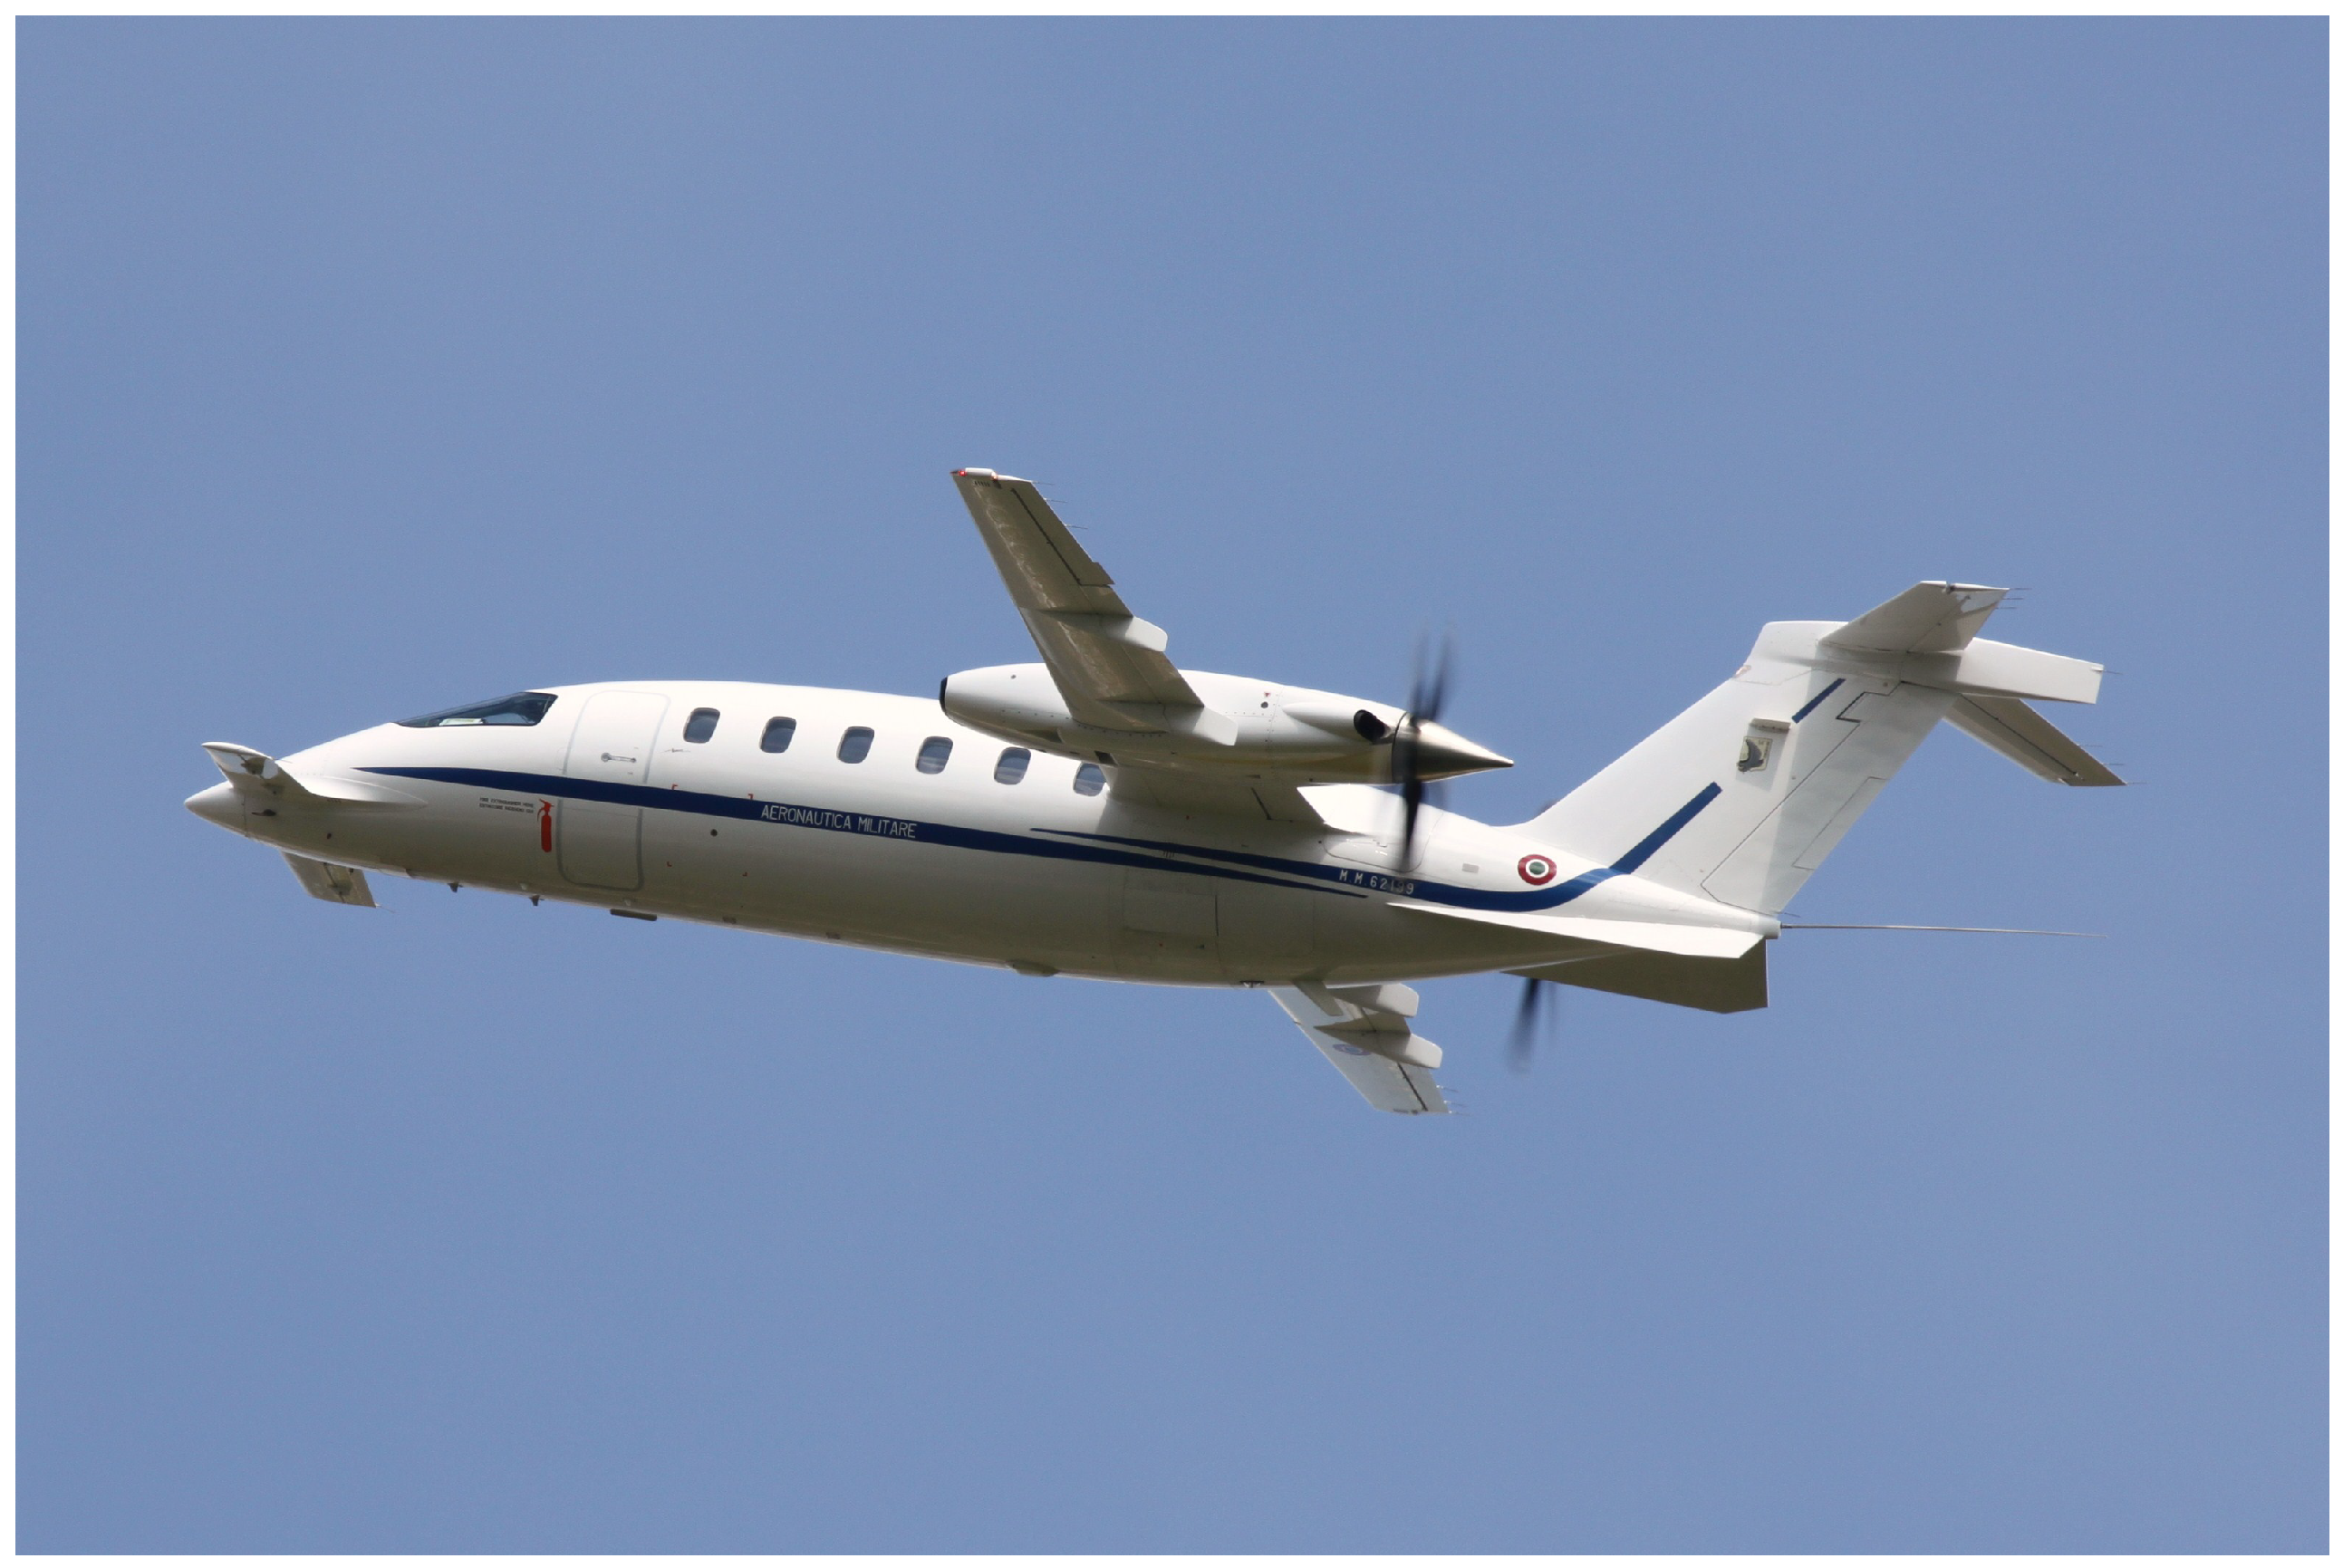
To move beyond these simplifications, this study introduces a high-fidelity finite element model of an entire aircraft passenger cabin, specifically focusing on the Piaggio P.180 (
Figure 1), an iconic turboprop executive aircraft [
14,
15]. This is the first study to develop a comprehensive structural–acoustic finite element model specifically for the Piaggio P.180. Owing to an unprecedented level of fidelity, the model enables analyses that significantly exceed the capabilities of current state-of-the-art models. In particular, it allows for the evaluation of localized structural and acoustic effects, in addition to global cabin noise characteristics. This capability is of particular importance for investigating higher-order structural modes and assessing design modifications with local impact.
The proposed model integrates a hybrid meshing approach, combining two-dimensional shell elements and one-dimensional stiffeners, thereby accurately capturing the structural intricacies necessary for realistic vibroacoustic analysis. Beginning with a baseline white-body fuselage, the model has been systematically enhanced by adding detailed internal structural components, ensuring realistic representation for low- and mid-frequency vibroacoustic analyses. Particular attention is given to accurately modeling structural connections, boundary conditions, and internal acoustic cavities to ensure comprehensive and reliable predictions of cabin noise and vibration.
The remainder of this paper is structured as follows.
Section 2 details the finite element formulations for both the structural and acoustic domains, along with the boundary conditions and load cases employed in the subsequent analyses.
Section 3 presents the modal and forced response results; specifically, resonance phenomena are examined, structural modes are verified against experimental modal data, and acoustic predictions are benchmarked against simplified analytical solutions. Using the validated model, this section also assesses the airframe noise reduction performance of the P.180 passenger cabin up to 300 Hz.
Section 4 concludes the study and outlines future research directions, including prospective model refinements and extended experimental validation.
2. Structural–Acoustic Finite Element Model of the Piaggio P.180
The numerical model reproduces the entire passenger cabin, approximately 5 m in length and 2 m in maximum diameter. The high-fidelity 3D CAD geometry provided by Piaggio Aerospace was imported into Siemens Femap [
16] and converted into a finite element description. Structural components, made primarily of aluminum alloy, are captured with one- and two-dimensional elements, while the enclosed air volume is represented by three-dimensional fluid elements.
2.1. Hybrid Shell-Beam Structural Domain
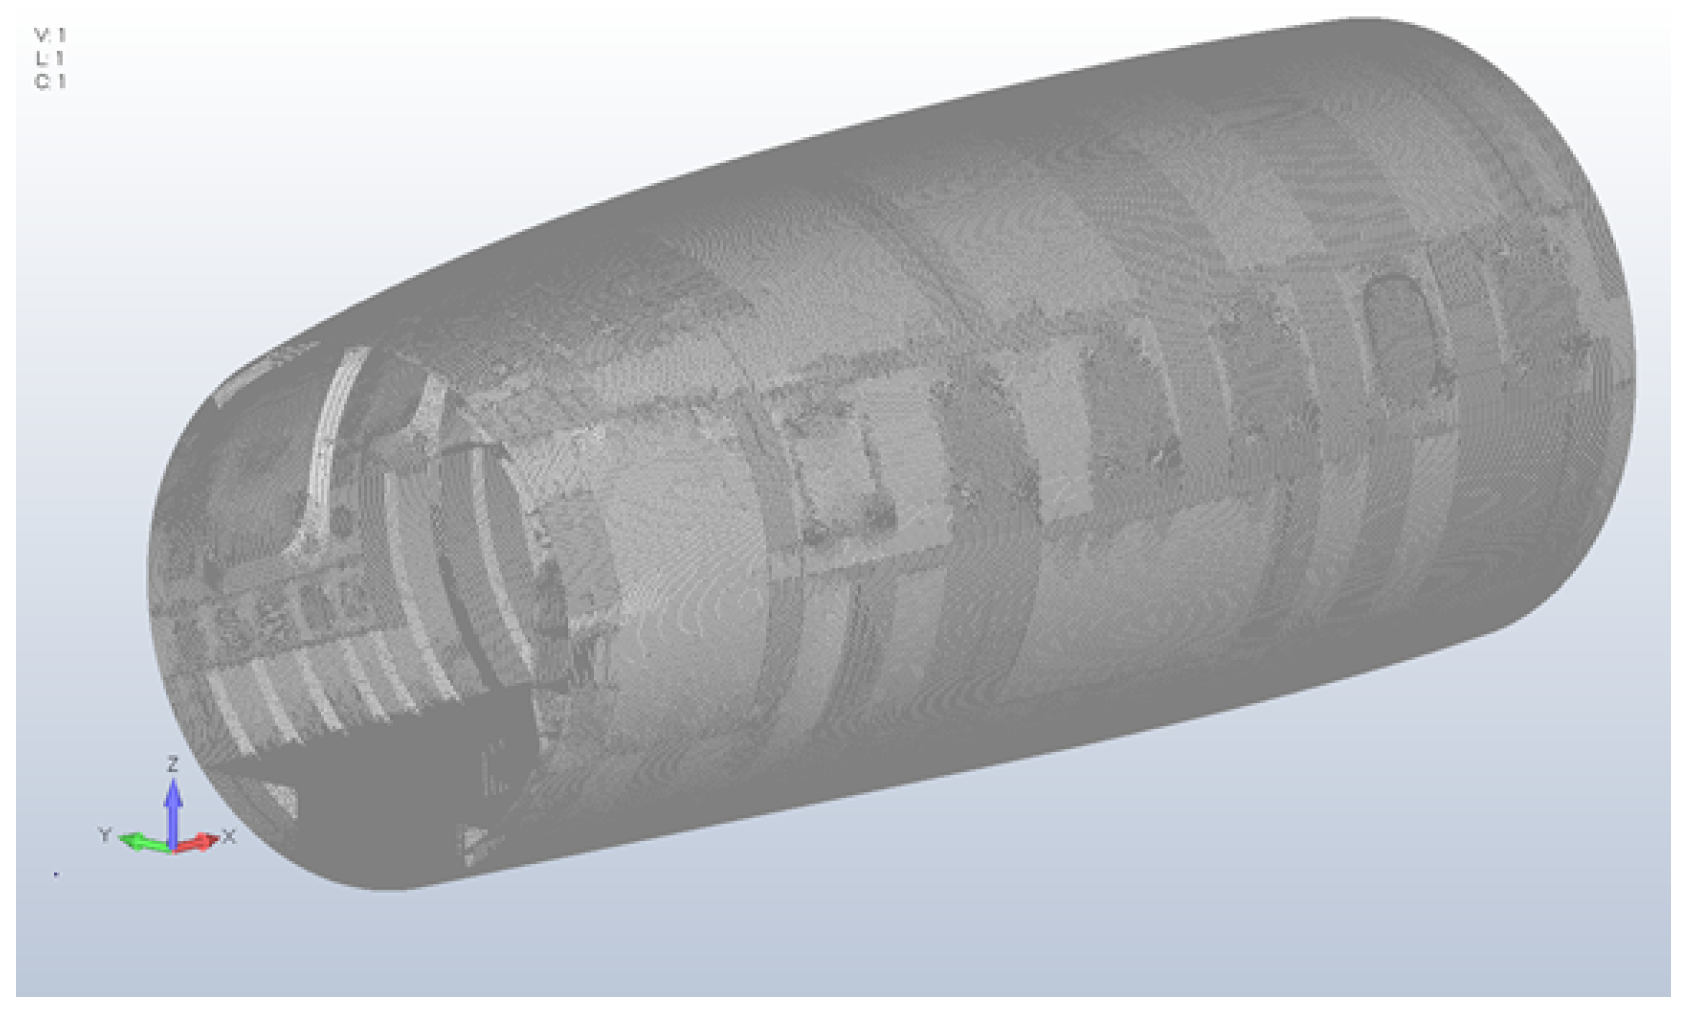
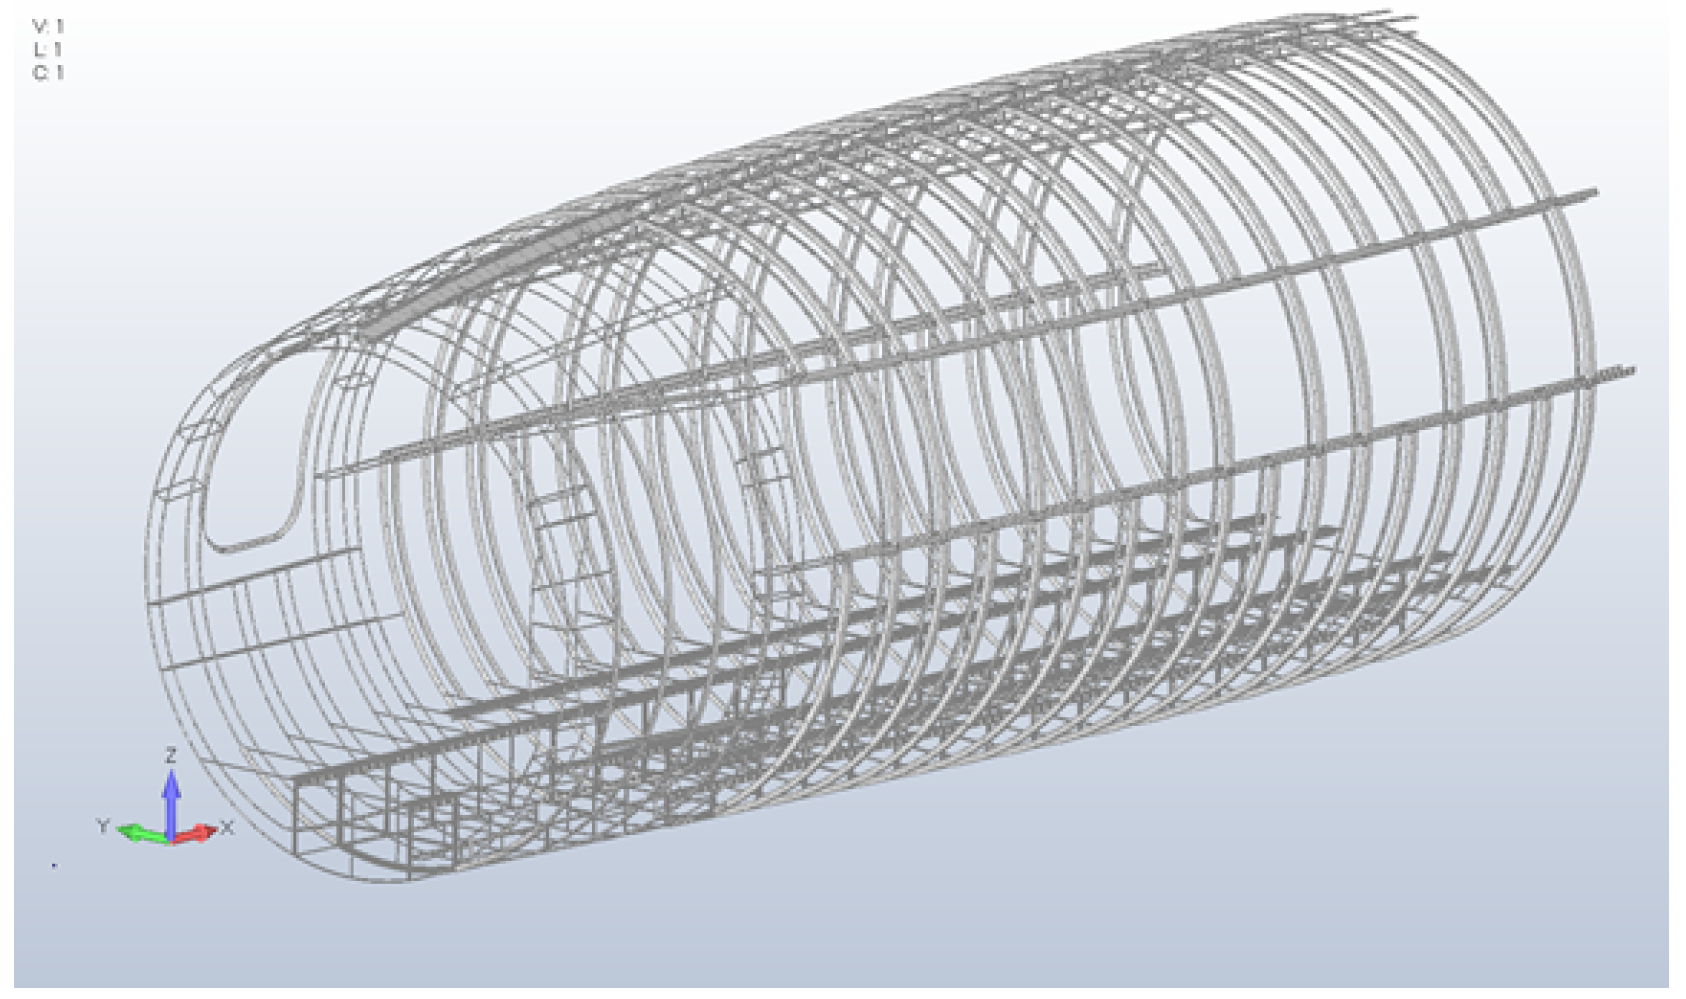
The structural domain encompasses six principal sub-assemblies: external skin, bulkheads, circumferential frames, longitudinal stringers, cabin floor, and cabin windows. To mitigate the high computational cost of a full three-dimensional solid representation, every thin-walled fuselage component was subjected to a systematic mid-surfacing procedure, thereby transforming the original volume into an equivalent two-dimensional shell description. Localized one-dimensional elements were then superimposed on the shell mesh to reproduce the reinforcement details. Specifically, for components featuring complex cross-sections, most notably the stringers and frames, the mid-surface shell was enriched with beam elements that convey the full sectional stiffness and inertia. All surfaces were meshed with CQUAD4 and CTRIA3 shell elements (
Figure 2). Local stiffeners were represented by CROD, CBAR, and CBEAM elements, each assigned section properties, offsets, and reference planes matching the real geometry (
Figure 3).
Figure 4 offers a schematic view of the hybrid 2D/1D discretization adopted for the frames and bulkheads. Grey shell elements represent the plate components, while red line elements denote the stiffeners, faithfully reproducing the real structure’s configuration, with an L-shaped section on one flange and a rectangular beam section on the opposite side.
The structural mesh was refined to provide sufficient spatial resolution for accurately predicting interior acoustic responses up to the third harmonic of the blade pass frequency (BPF) of the P.180 five-blade propeller. At the nominal operating speed of 2000 rpm, the fundamental BPF is 166.7 Hz, which places the upper limit of the analysis band at roughly 500 Hz. Adhering to the common guideline that structural modes should be resolved to 1.5–2.0 times the highest excitation frequency, the mesh density was therefore selected to remain accurate up to 800 Hz. Mesh sizing was informed by closed-form estimates of plate natural frequencies and their corresponding bending wavelengths. The characteristic element edge length was chosen so that at least six elements covered a single bending wavelength (analytical derivation provided in
Appendix A). For components with geometric complexity that made analytical treatment unfeasible, numerical mesh-convergence studies were carried out. In both the analytical and numerical phases, each component was analyzed in isolation, with boundary conditions reflecting realistic constraints, typically simply supported edges. The resulting global element dimensions were 7 mm in the longitudinal direction and 10 mm circumferentially. To resolve local bending effects, the cabin floor was discretised more finely, specifically 6 mm along the stiffeners and 3 mm transversely. The final mesh thus comprised roughly two million elements, with element quality preserved at a Jacobian ratio exceeding 0.8 throughout.
2.2. Cabin Acoustic Cavity Discretization
The cabin air volume, including the narrow gap between the fuselage skin and the window panes, was discretized with three-dimensional fluid elements. CTETRA elements with MAT10 bulk properties were assigned the material constants of air, assuming a sound speed and a density . Element size in the acoustic domain is governed by the wavelength, . For the upper analysis limit of and the requirement of at least 10 linear elements per wavelength, the maximum admissible edge length is roughly , well above the characteristic structural mesh size. Directly mirroring the structural discretization throughout the cavity would overspecify the acoustic field and lead to an impractically large model. The domain was therefore partitioned into three sub-volumes:
a thin, structured region conforming exactly to the structural mesh along the fuselage skin, local reinforcements, and cabin floor, so that structural and acoustic nodes coincide and fluid–structure coupling remains exact;
a graded mesh in which the element size expands progressively away from the walls;
a uniform, structured block meshed with the pitch required for the highest frequency of interest.
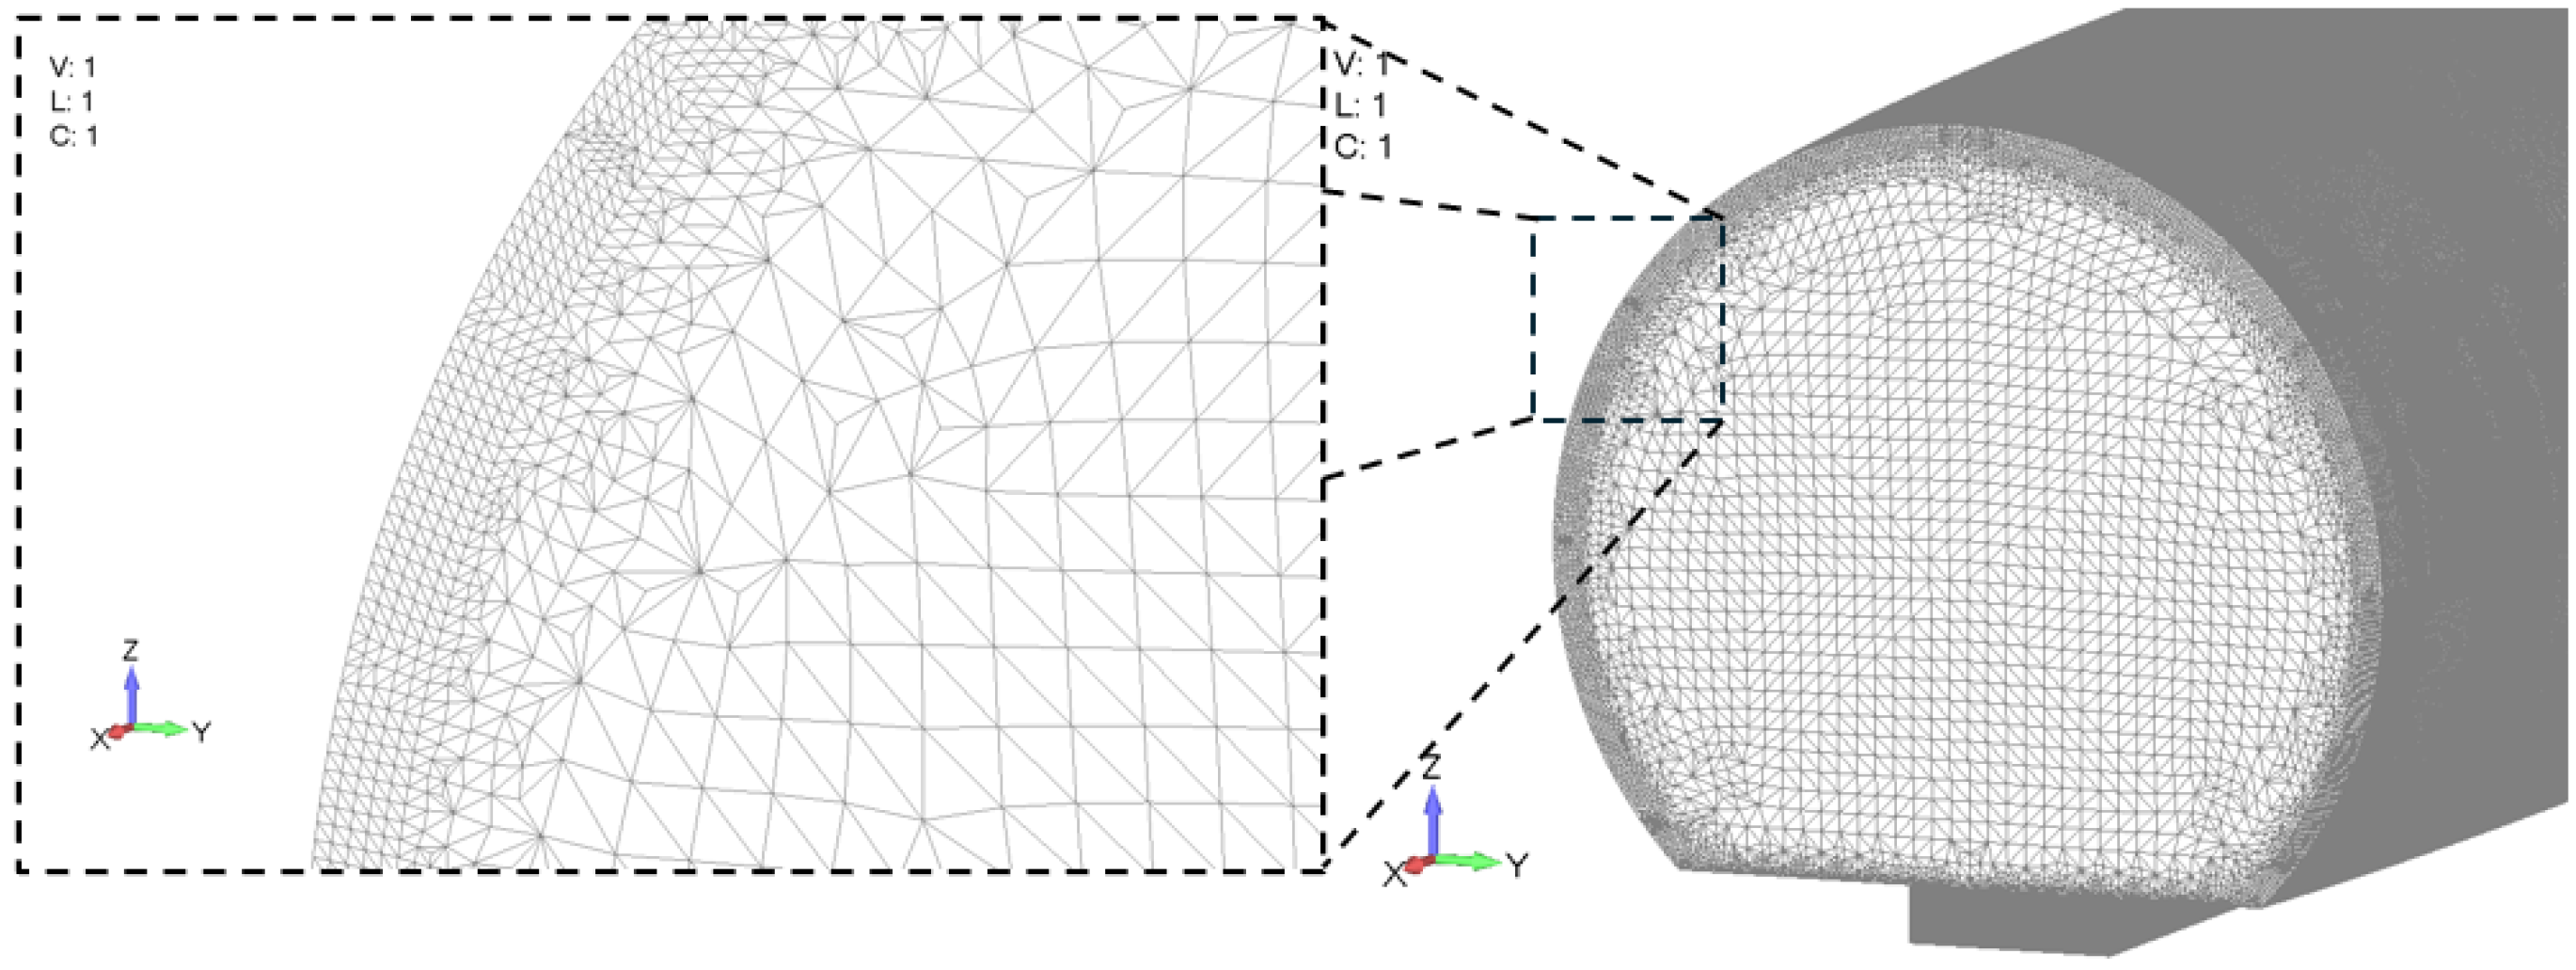
This strategy (
Figure 5) yields an acoustic mesh of roughly 15 millions elements, ensuring faithful representation of the vibrational contribution of all structural components, including stringers and frames, while keeping the overall computational cost within practical limits.
In addition to the main cabin volume, the acoustic model explicitly includes the 12 small cavities surrounding the cabin windows (
Figure 6a). The local structural layout is depicted in
Figure 6b. Two longitudinal stringers (red), two frames (green), and a window stiffener (blue) bound the cavity laterally. When the fuselage skin (grey) is included, these components form a closed fluid enclosure, as shown in
Figure 6c. Since each cavity is geometrically small, the structural mesh was retained without modification for the acoustic discretization, using the same CTETRA element formulation and air properties as in the main cabin. Node sharing along every fluid–structure interface ensures a continuous and exact coupling of the fluid with the surrounding structure.
2.3. Boundary Conditions and Loads
Different boundary conditions were prescribed depending on the objective of each analysis. For the experimental correlation study, the numerical model was configured to replicate as closely as possible the setup reported by [
17]. In the laboratory, nominal free–free conditions were achieved by suspending the fuselage on bungee cords and springs. Accordingly, the FE model was solved with ideal free–free boundary conditions. The plywood panels that sealed the fuselage ends during the tests were not included in the simulation because their material properties were not precisely documented. Moreover, owing to their inherently low stiffness and the limited number of attachment points, their contribution to the global structural rigidity was considered negligible. Instead, the acoustic domain was terminated by hard-wall (rigid) boundaries at the fore and aft sections of the cabin.
For the frequency response simulation aimed at predicting vibroacoustic behavior, a more realistic set of constraints was applied. The fore- and aft-most fuselage frames were modeled as fully clamped to emulate their attachment to the cabin crew area and the tail structures, thereby suppressing the rigid body motions permitted in the free-free validation model and reproducing the true load path during flight. The forward and aft bulkheads were also reinstated and rigidly clamped to terminate the cabin volume. Because these bulkheads are now fixed, the acoustic cavity is naturally bounded by hard walls at its extremities. This intrinsic rigidity preserves the standing-wave pattern modeled for the experiments.
A spatially uniform, in-phase white noise pressure field of amplitude was applied normally to the fuselage skin. This excitation supplies equal energy at every frequency within the analysis band while remaining sufficiently small to preserve linear structural–acoustic behavior.
3. Results
The findings reported below derive from the high-fidelity structural and acoustic finite element model introduced earlier. Before any forced response work, both domains were benchmarked through modal analyses; specifically, structural natural frequencies and mode shapes were correlated with full-scale experimental data, while cavity resonances were cross-checked against analytical solutions for a rigid-walled cylinder. Having met these validation targets, we subjected the coupled model to a harmonic excitation sweep to characterize the vibroacoustic response of the P.180 passenger cabin. The results not only quantify the cabin’s noise reduction performance but also verify the correct implementation of fluid–structure coupling, confirming the structural and acoustic sub-models function coherently as an integrated system.
3.1. Correlation with Experimental Modal Analysis
To validate the structural finite element model, a comparative analysis was carried out against experimental results presented in [
17], obtained through modal testing of a full-scale fuselage test article of the P.180 aircraft. The test campaign, conducted jointly by the Department of Aerospace Engineering at the University of Naples Federico II and Piaggio Aerospace, provides a valuable reference for assessing the accuracy of the numerical structural model. While the tested article includes both the crew and passenger cabins, the FE model developed in this study reproduces only the passenger cabin. This simplification is not expected to significantly affect the mode shapes in the instrumented region; indeed, the door frame, which marks the forward limit of the numerical model, is substantially stiffer than the surrounding fuselage structure and thus acts as a quasi-rigid boundary. The main differences are therefore related to global mass and length, which may cause shifts in natural frequencies but leave the mode shapes in the instrumented region essentially unaltered. The adopted boundary conditions were discussed in the previous section. As explained, the assumptions on boundary conditions ensure consistency between the test configuration and the numerical model, although slight discrepancies in global inertia and support compliance remain. A classical eigensolution (MSC Nastran, SOL 103) was subsequently performed for the undamped system.
Figure 7 compares the first three mode shapes computed with the FE model with those obtained experimentally in [
17]. In each sub-figure, the shaded surface on the left represents the truncated numerical passenger cabin mesh, whereas the wire-frame on the right shows the measured deformation of the full-scale fuselage.
The first mode, occurring numerically at 25.5 Hz and experimentally at 32.7 Hz, is dominated by a global ovalization. Specifically, opposite quadrants move radially inward and outward about a nodal line that almost exactly coincides in the two representations. The door frame, treated as a quasi-rigid boundary, effectively isolates this shape from the absent crew cabin structure, explaining the excellent spatial match despite the lower numerical frequency resulting from the lighter and shorter model. At 31.9 Hz in the analysis and 36.5 Hz in the test, the second mode introduces an additional circumferential wave. Although the frequency difference is still about 13%, the numerical field reproduces both the phase relationships and the positions of the nodal circles observed experimentally, confirming that variations in global inertia have little influence within the truncated domain. The third mode exhibits a three-lobed deformation. Here, the FE prediction, 74.6 Hz, slightly overestimates the measured 66.2 Hz, a trend consistent with the stiffer boundary conditions imposed in the model. Nevertheless, the lobes and their nodal lines are rendered with high fidelity, indicating that the structural stiffness distribution is captured correctly.
Across these three modes, the displacement fields correlate closely, whereas the frequency discrepancies remain within ±22%. Given the boundary condition assumptions and the exclusion of the crew cabin section, this level of agreement provides confidence in the structural model for subsequent analyses.
3.2. Cabin Cavity Modal Analysis
The acoustic FE model was verified by comparing its numerically predicted eigenfrequencies with closed-form solutions for an idealized cylindrical cavity. Treating the fuselage interior as an inviscid fluid domain bounded by perfectly rigid walls, the pressure field inside the cavity is governed by the homogeneous Helmholtz equation with Neumann boundary conditions. Under these assumption, the longitudinal standing-wave natural frequencies are given by the following:
where
c is the speed of sound,
L is the cavity length, and
n denotes the longitudinal modes index. Eigenvalue extraction was performed on the acoustic mesh with rigid-wall boundary conditions identical to those assumed in the analytical derivation. The resulting set of longitudinal eigenfrequencies, listed alongside the theoretical values in
Table 1, deviate by no more than 3%. This level of agreement attests to the adequacy of the spatial discretization, the accuracy of the fluid property assignment, and the consistent implementation of boundary conditions across the coupled structural–acoustic domains. Perfect coincidence is not expected, since the actual cabin departs from a perfect cylinder and includes local geometric complexities. Nevertheless, the small discrepancies observed fall well within the tolerance required for subsequent vibroacoustic predictions and, importantly, verify that all acoustic sub-domains are properly connected and free of spurious numerical leakage.
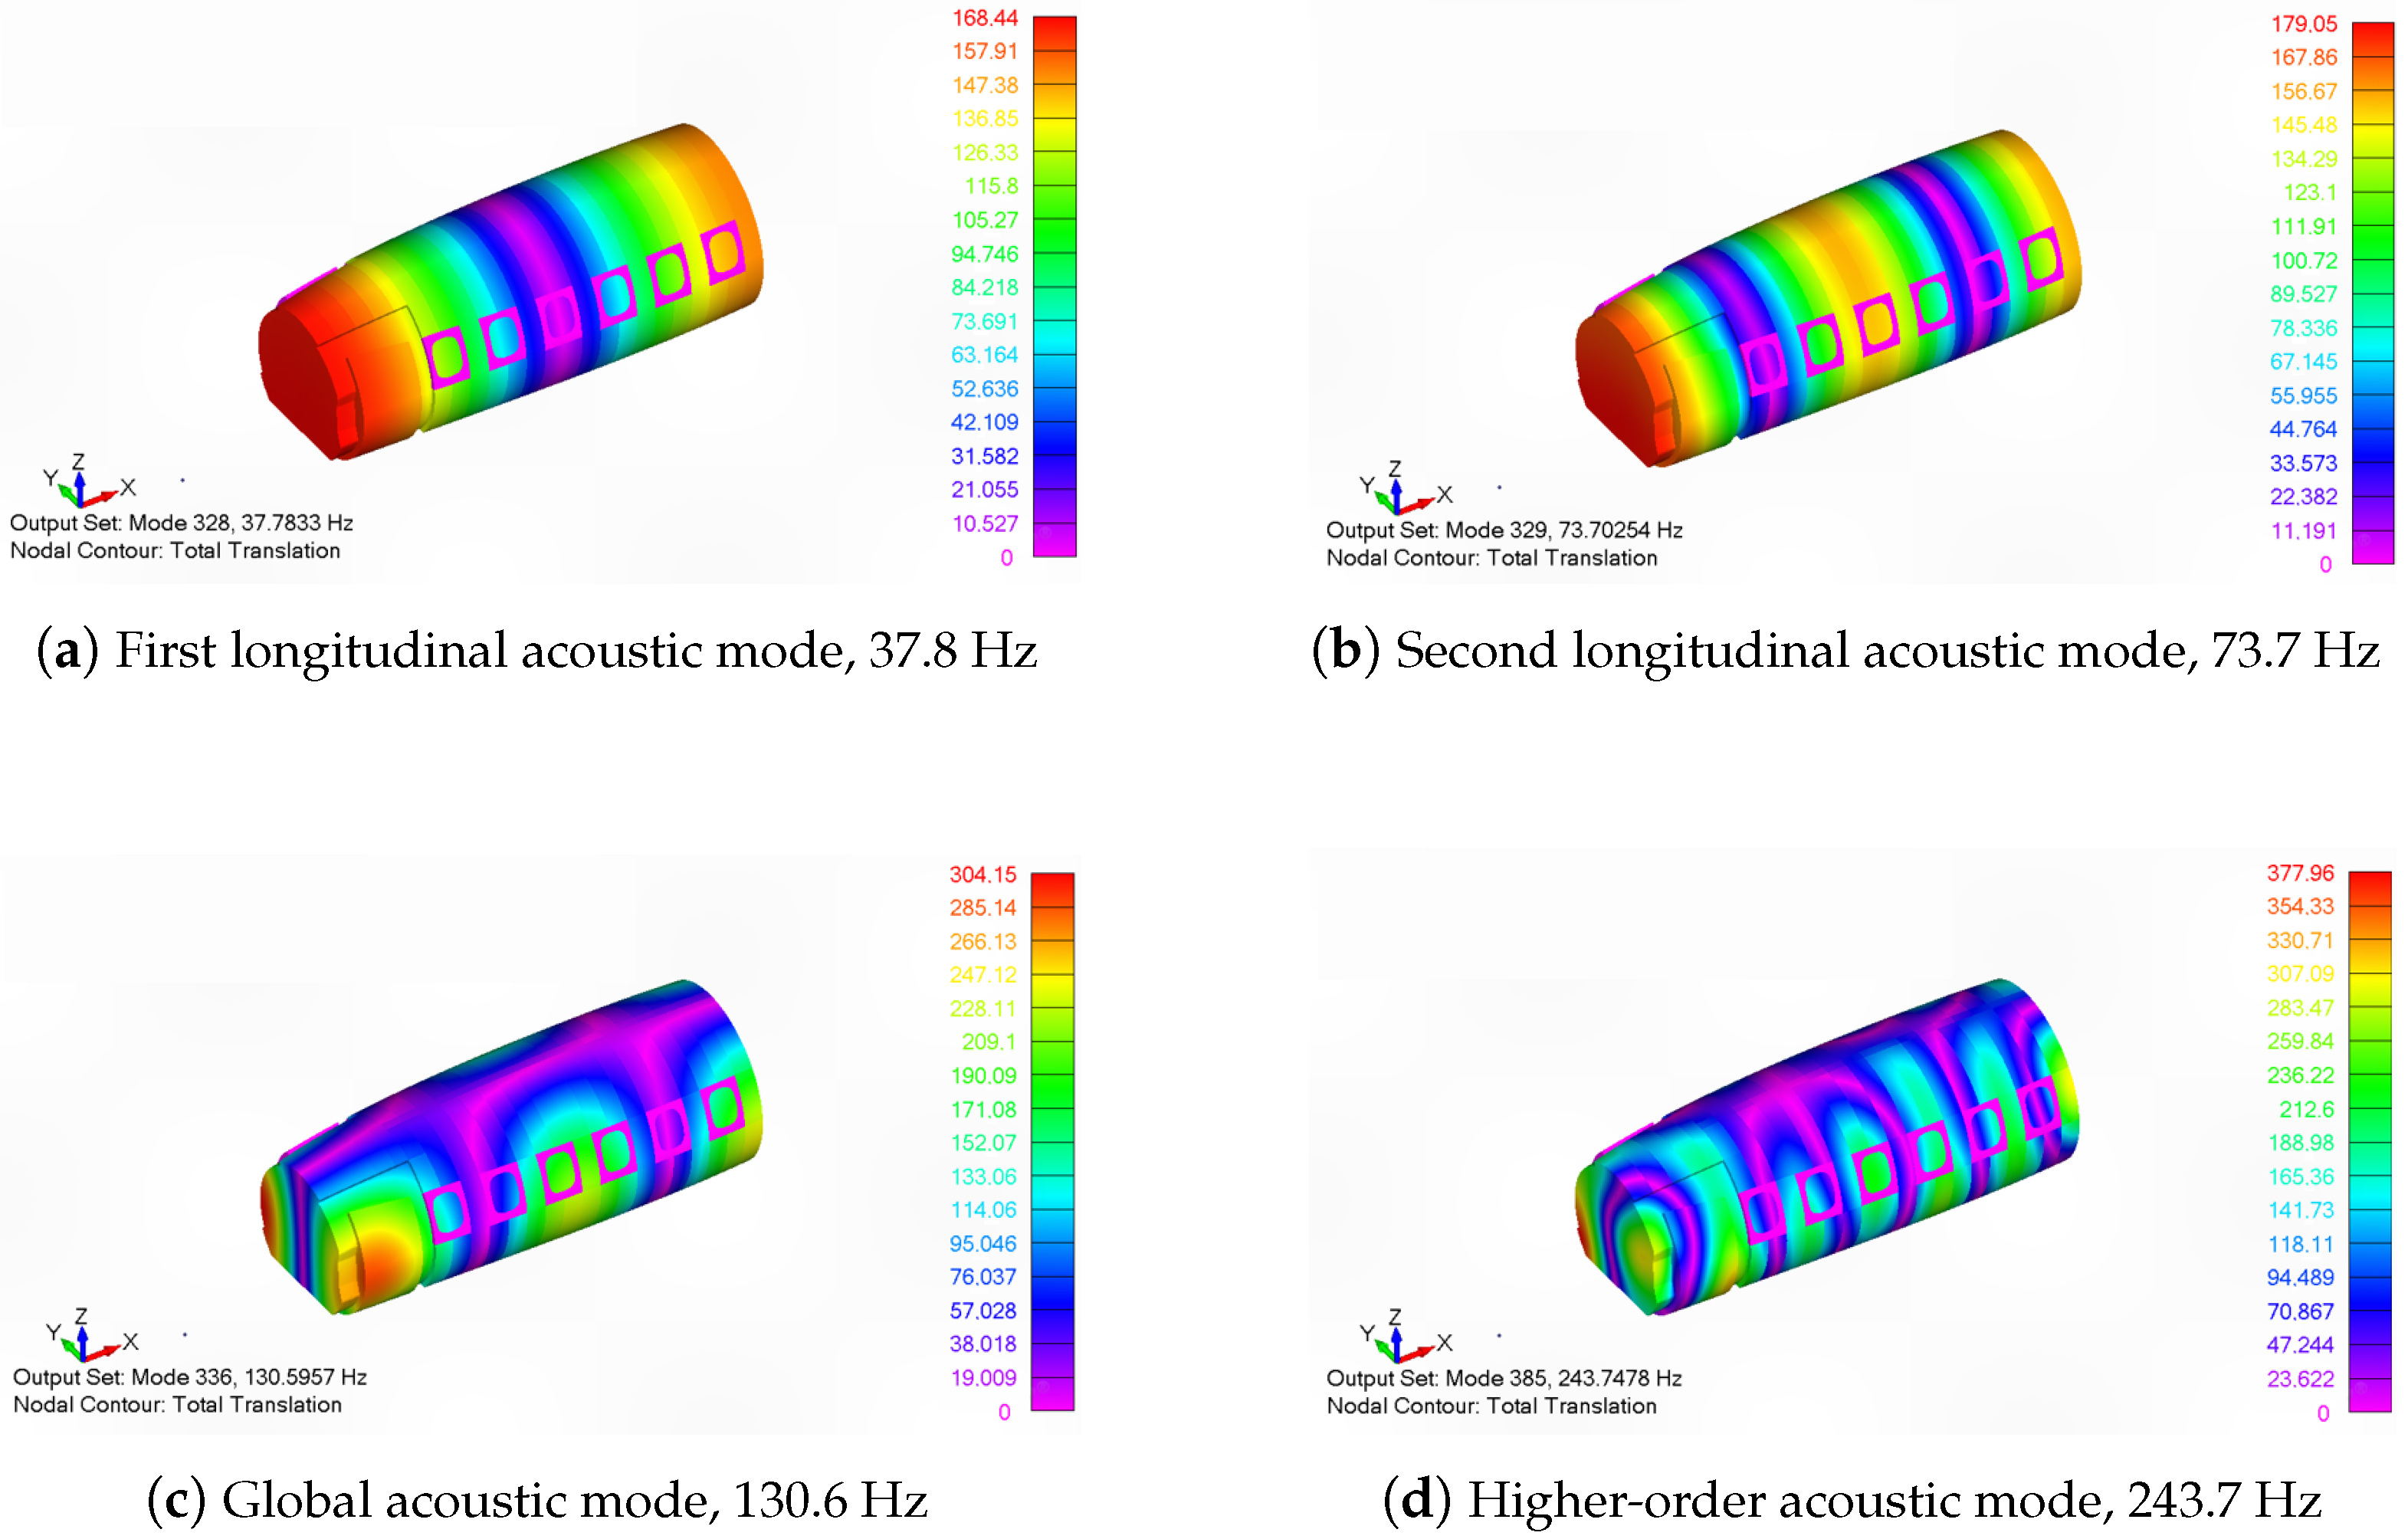
Figure 8 presents representative acoustic pressure eigenfunctions extracted from the cabin model.
Figure 8a,b correspond to the first and second longitudinal standing-wave modes, obtained numerically at 37.8 Hz and 73.7 Hz, respectively. As predicted by the analytical solution, the pressure field alternates between successive antinodes spaced at half-wavelength intervals along the fuselage axis while remaining nearly uniform over each cross-section.
Figure 8c,d show higher-order cavity modes at 130.6 Hz and 243.7 Hz. These shapes exhibit pronounced circumferential variation driven by the fuselage’s non-cylindrical cross-section and local geometric discontinuities. Moreover, the domain is clearly partitioned at the fuselage frames and stringers, which act as partial acoustic reflectors. The smooth capture of pressure extrema around these details confirms that the local element size is sufficiently fine to resolve the shorter wavelengths, validating the spatial-resolution strategy adopted for the acoustic mesh. Combined with the close frequency agreement reported in
Table 1, the fidelity of these mode shapes provides compelling evidence that the discretization, material definitions, and boundary conditions are consistently implemented across all acoustic sub-domains.
3.3. Coupled Frequency Response Study
A comprehensive frequency response analysis (SOL 111) was performed in MSC Nastran to examine the coupled vibroacoustic behavior of the Piaggio P.180 passenger cabin model. The excitation band spanned 25 Hz–301 Hz with a uniform 3 Hz increment, a resolution fine enough to resolve closely spaced resonances and structural–acoustic modal interactions that typically occur below 300 Hz. Structural damping was introduced by prescribing a constant 2% damping ratio through a PARAM, G setting, a standard approximation for lightly damped aluminum airframes. The excitation and boundary conditions follow the rationale outlined earlier: a spatially uniform in-phase pressure of acts normally with every fuselage skin element, while the fore- and aft-most fuselage frames are fully clamped. A modal superposition approach was adopted. All structural and acoustic eigenvectors up to , approximately twice the highest forcing frequency, were retained, ensuring that residual flexibility effects remained negligible. Within this bandwidth, the solution space comprised 1691 structural modes and 282 acoustic cavity modes, all included in the forced response synthesis. Calculations were performed on a dedicated node of a CIRA supercomputer equipped with a 36 core Intel Xeon processor and of RAM, using MSC Nastran in standard executable mode with two shared memory threads. The complete frequency response analysis required just under 17 h of wall clock time.
To aid interpretation of the frequency response analysis results, an eigenvalue analysis (SOL 103) with identical boundary conditions was first performed, providing a reference set of coupled natural frequencies and mode shapes.
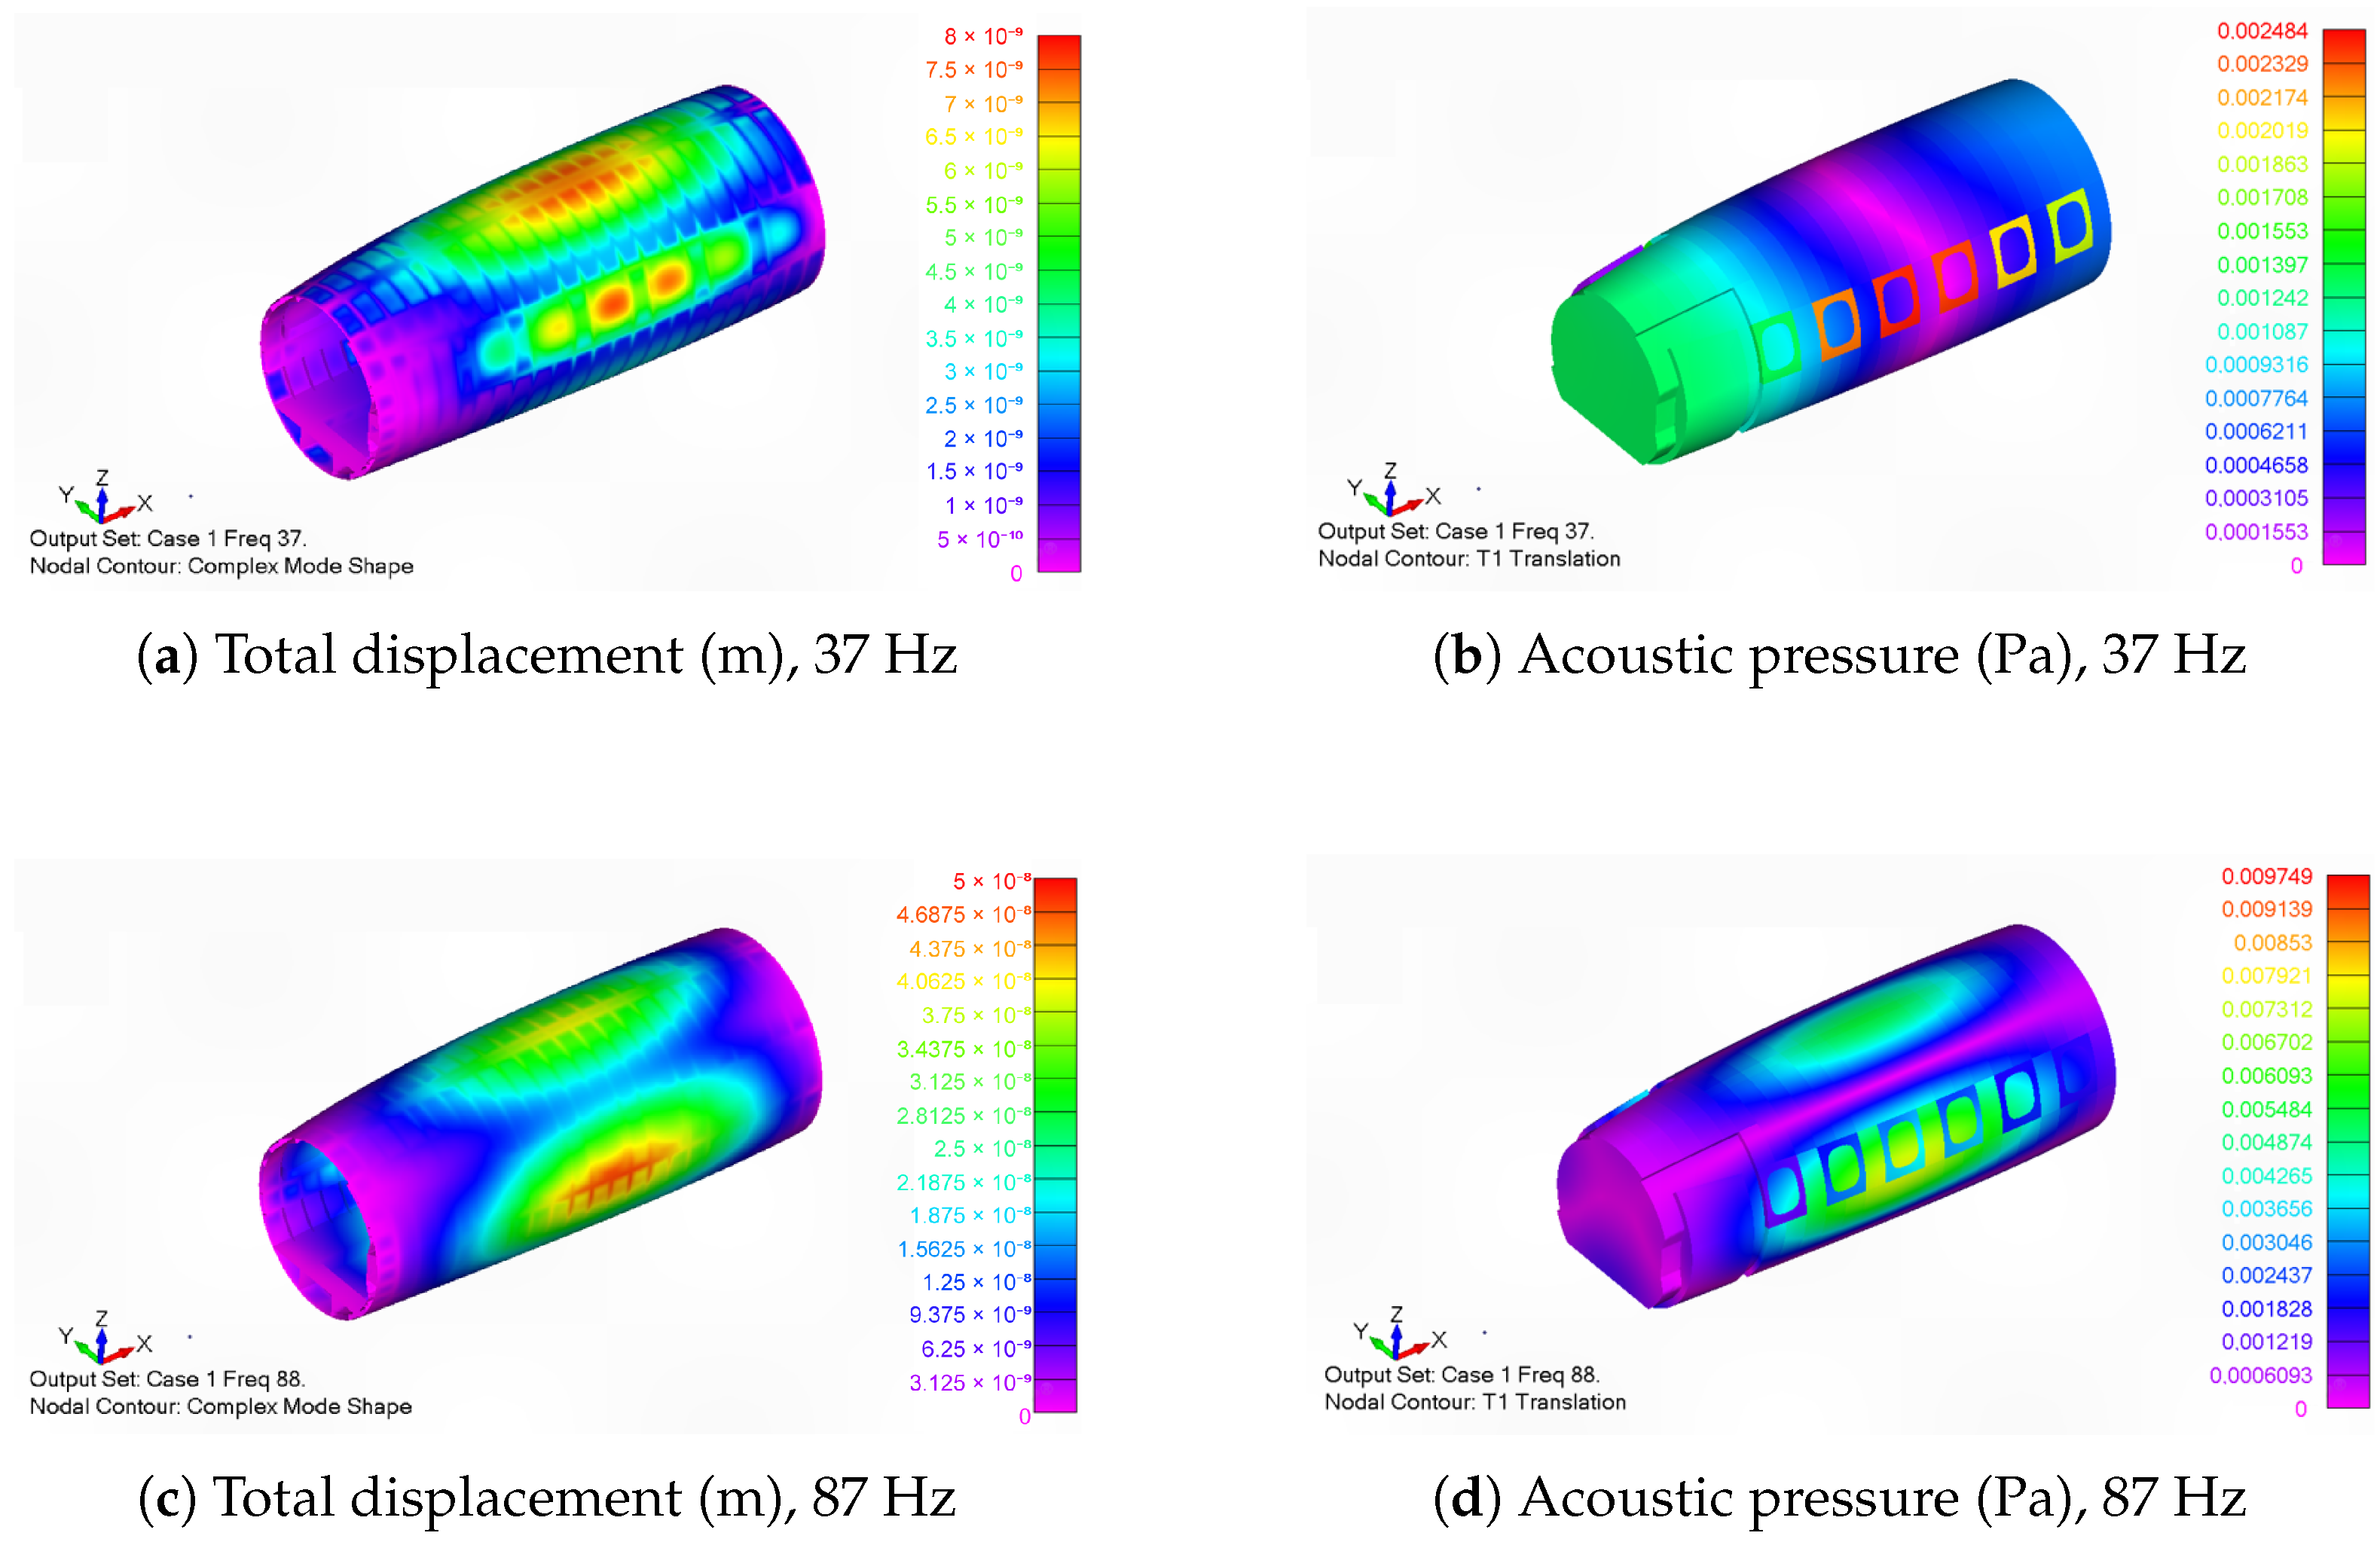
Figure 9 juxtaposes structural displacements and cabin pressures at two representative excitation frequencies. The upper pair corresponds approximately to the first longitudinal cavity resonance of
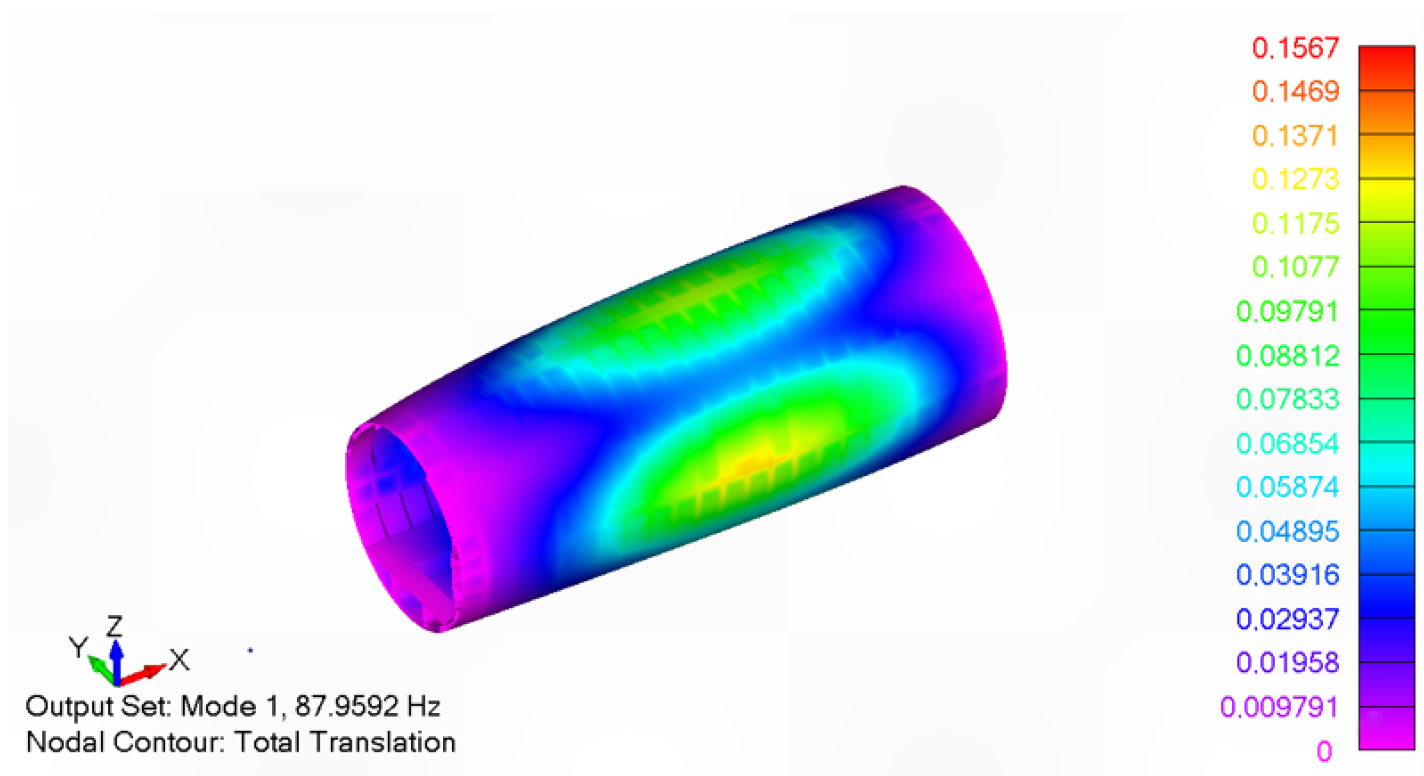
Figure 8a, exhibiting the expected half-wave standing pressure pattern with a mid-cabin nodal plane and antinodes at the bulkheads. The accompanying structural deformation is modest. The lower pair coincides with the first structural bending mode. The fuselage exhibits the global deformation already seen in the uncoupled analysis (
Figure 10), and the induced acoustic field mirrors this shape, with pressure extrema collocated with displacement antinodes.
The concluding phase of the investigation quantified the airframe’s capability to attenuate airborne sound in the 25–301 Hz range through a two-stage procedure that resolves both local and spatially averaged indicators of cabin comfort. Each passenger location was treated as a discrete sampling node, while the cabin was excited by the same spatially uniform pressure field of constant amplitude
= 0.1 Pa. For every frequency
f, the vibroacoustic FE model provided the interior pressure magnitude
at node
i. External and internal pressures were converted to sound pressure level (SPL) via
and the single seat noise reduction (NR) spectrum followed as
thereby expressing, in decibels, the attenuation provided by the airframe at that position and frequency. In this study, the 0.1 Pa amplitude value was selected as a realistic yet arbitrary reference, since the purpose of the analysis was to evaluate relative noise attenuation rather than absolute sound pressure levels. Since local hot-spots can inflate pointwise variability, all nodes situated on a longitudinal plane at nominal ear height were pooled to form a spatial statistic. The corresponding root mean square pressure field averaged over this plane,
, was computed according to Equation (
4), where
i represents the set of nodes on the cutting plane, and
N is the total number of nodes on that plane at which the acoustic response was evaluated:
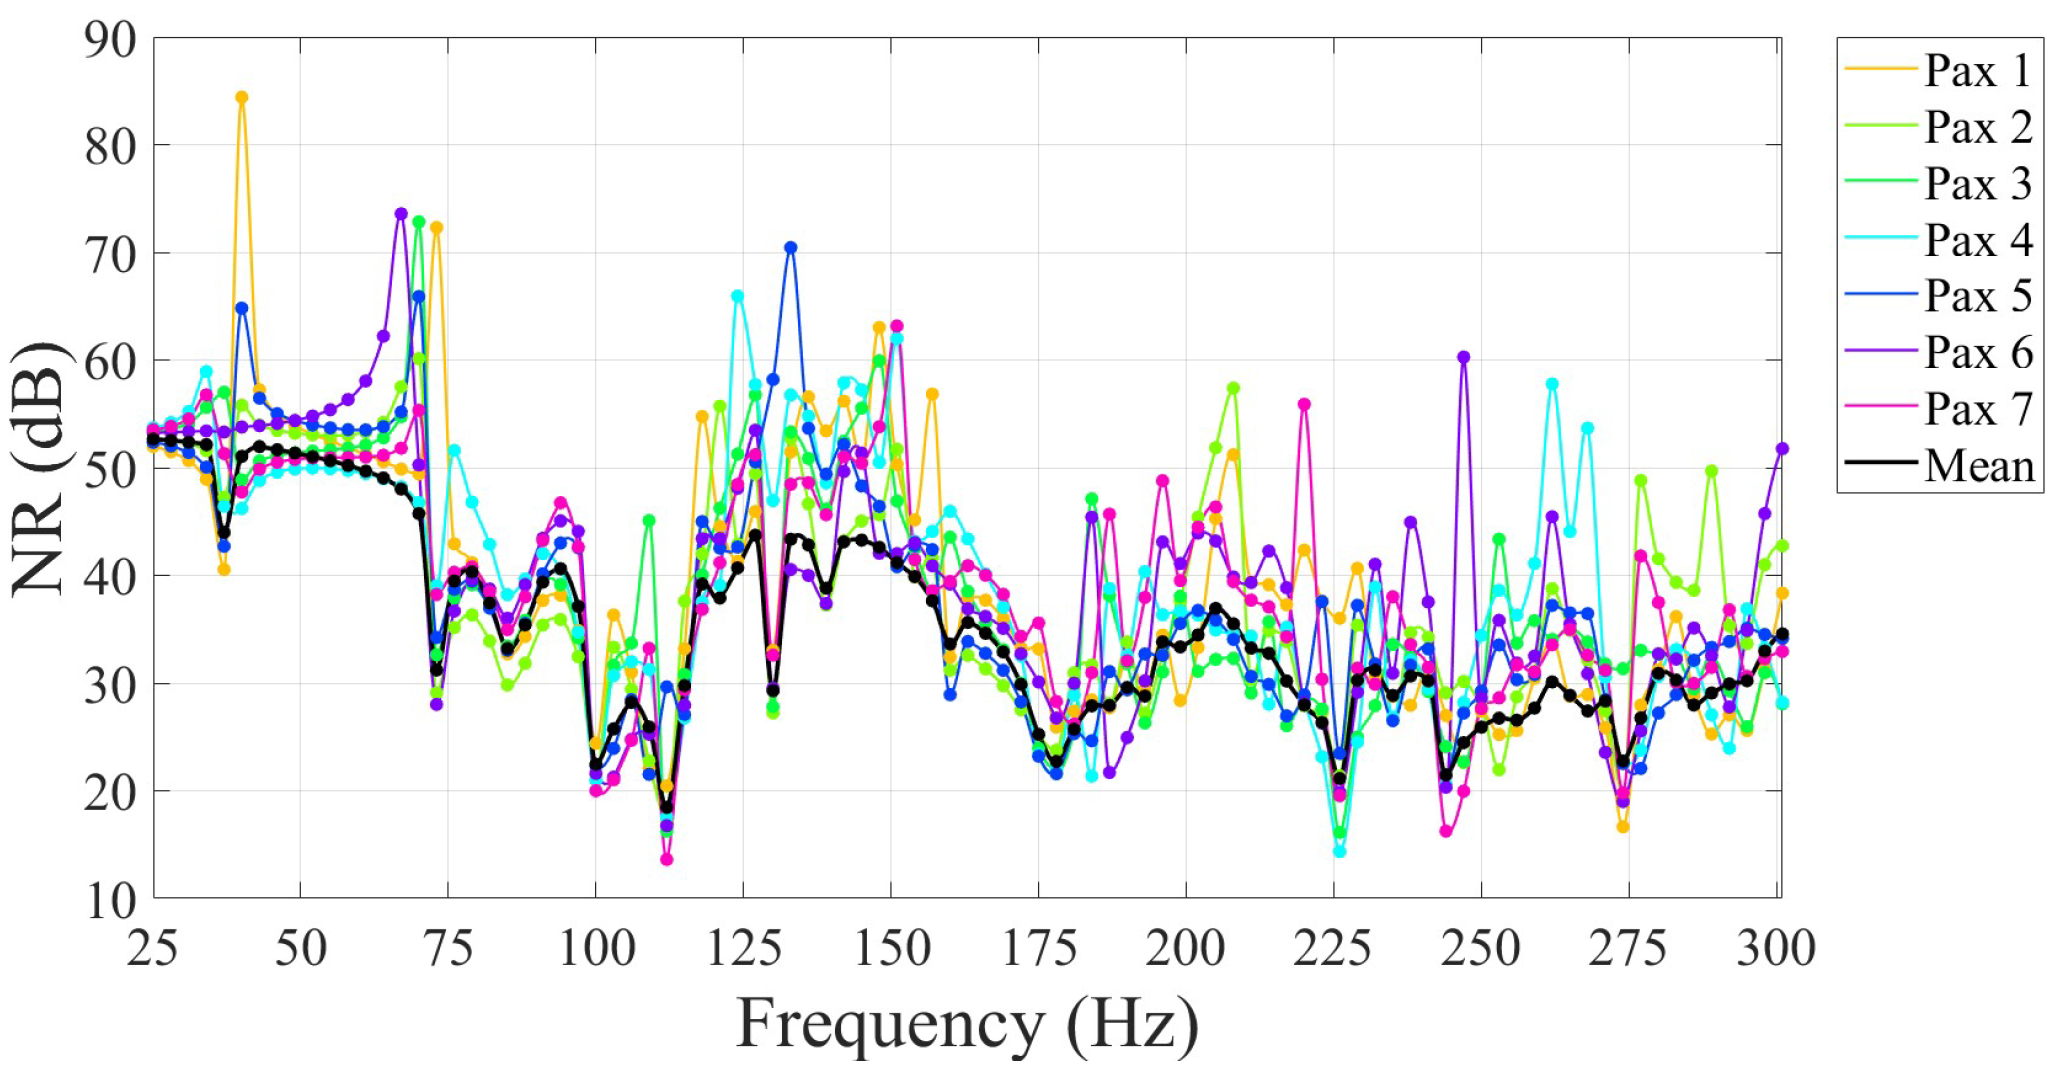
Figure 11 presents the noise reduction spectra measured at the seven passenger locations indicated in
Figure 12, together with the value averaged across the cutting plane at ear level. The ordinate shows NR in decibels, namely the difference between exterior and interior sound pressure levels, while the abscissa spans 25 Hz to 300 Hz. A Makima interpolation was applied to the discrete data to improve visual resolution without introducing spurious narrow-band artifacts.
In the sub-resonant regime, extending up to approximately 87 Hz, the airframe operates within the stiffness controlled region. Consequently, the mean NR decreases monotonically from about 52 dB at 25 Hz to roughly 36 dB near the first structural bending mode. Overlaid on this response are narrow peaks and troughs attributable to low-order acoustic eigenmodes of the cabin. Notable minima occur at 37 Hz and 73 Hz, corresponding to the first and second longitudinal cavity modes, respectively. At 37 Hz, the modal pressure field contains a single nodal plane passing through the cabin. Seat 3 lies close to this plane and therefore experiences greater attenuation, whereas the remaining seats show reduced NR because of their proximity to antinodal regions, as illustrated in
Figure 13a. At 73 Hz, two nodal planes intersect the cabin and Passenger 1, who is seated directly on one of them, enjoys higher NR, whereas passengers near antinodal regions experience a pronounced reduction (
Figure 13b). Once the excitation frequency surpasses the fuselage’s first bending natural frequency, the system enters a coupled structural–acoustic regime in which both the flexible shell and the enclosed air control transmission. At 87 Hz, when the first structural bending mode is excited, all seating positions experience a broad drop in NR because the airframe vibrates as a whole. From 90 Hz to 180 Hz, the spectrum shows alternating sharp peaks and dips whose depths depend strongly on seat location. The deepest minimum, at 130 Hz, arises from an acoustic field containing one longitudinal and two transverse nodal planes (
Figure 13c). Passenger 5, located on a nodal line, registers the highest NR, whereas the symmetric seat pairs 2–3 and 6–7 converge on identical NR values several decibels below the mean, confirming their placement on shared antinodal lobes. Above about 180 Hz, higher-order cavity modes dominate. The longitudinally averaged NR stabilizes between 20 dB and 40 dB, yet sharply defined notches persist. For example, at 244 Hz, the predicted noise reduction is associated with a complex acoustic mode containing multiple transverse nodes and one longitudinal node that subdivides the cabin into lobed compartments (
Figure 13d). Because the nodal network is then dense, spatial variation in NR is substantially reduced. Across the entire 25–300 Hz band, the mean NR never falls below 20 dB, confirming that the airframe offers good insulation. Nevertheless, individual passengers can experience deviations of several decibels at discrete resonant frequencies. These variations, governed by the interplay of structural shell modes and cavity acoustic modes, highlight the need to consider spatial effects when evaluating cabin noise annoyance or designing local treatments such as trim panels or tuned absorbers.
4. Conclusions
A high-fidelity yet computationally efficient structural–acoustic finite element model of the Piaggio P.180 passenger cabin has been developed to predict interior noise within the low- to mid-frequency range. The structural domain was discretized with shell and beam elements, while the cabin air was represented by a three-dimensional acoustic fluid mesh, for a total of roughly 17 million elements. Analytical estimates of bending and acoustic wavelengths, combined with numerical convergence studies, were used to define the mesh resolution. A minimum of six structural elements per bending wavelength and ten acoustic elements per wavelength were adopted, enabling accurate resolution of modal phenomena up to 800 Hz. Verification against experimental modal data shows that the first three structural natural frequencies differ by no more than 22%, and the associated mode shapes correlate closely with measurements even though the crew cabin section was omitted and simplifications in boundary conditions were made. On the acoustic side, longitudinal cavity eigenfrequencies depart from analytical values by less than 3%, confirming both the adequacy of the spatial discretization and the correctness of fluid sub-domains coupling.
Harmonic analyses from 25 to 301 Hz reveal two distinct transmission regimes. Below the first structural bending frequency (about 87 Hz), the fuselage behaves as a stiffness-controlled shell. The mean noise reduction level falls gradually from roughly 52 dB to 36 dB as frequency increases, with narrow NR minima appearing at the first and second longitudinal acoustic resonances. Above 87 Hz, the response is governed by strong structural–acoustic interaction. Global shell modes and higher-order cavity modes alternate in dominance, producing sharp seat-to-seat NR variations. Nevertheless, at no point in the analyzed band does the averaged NR drop below 20 dB. Local NR deficits align systematically with antinodal regions of the interior pressure field, clearly identifying where selective damping treatments or tuned acoustic liners would be most beneficial.
Future work will validate the model against data from an upcoming acoustic test campaign that will measure noise reduction levels at multiple positions inside the P.180 passenger cabin. In parallel, aerodynamic simulations are being conducted to build a database of unsteady surface pressure distributions. The propeller-induced noise field will then be predicted with a Ffowcs Williams–Hawkings solver, and the resulting excitations will be applied to the fuselage skin. This integrated procedure will provide a realistic assessment of the airframe’s noise attenuation performance under operational conditions. The methodology and results presented here thus establish a solid foundation for structural design optimizations aimed at further enhancing cabin acoustic comfort.
