1. Introduction
Museums are public spaces that, although not designed as specialized performance venues like concert halls or recording studios, still require controlled acoustic environments. Classic galleries evoke images of hushed halls, where silence allows the artworks to command attention. Contemporary museums, however, increasingly incorporate experimentation, immersive, and multisensory elements, such as audio guides, interactive installations, and dynamic pathways, which place additional demands on acoustic control.
Contemporary museum architecture often embraces a “white-box” aesthetic—large, open-plan galleries finished in highly reflective materials such as glass, polished concrete, marble, and masonry. However, these elements, designed for a striking visual impact, rarely account for acoustic side effects. These effects include long reverberation times, poor speech intelligibility, diminished speech privacy, and increased background noise [
1,
2,
3,
4,
5,
6], all of which compromise the visitor experience. Moreover, the increasing use of multimedia technologies may further exacerbate all these problems [
7].
Compounding these challenges, the acoustic requirements of museums are complex and often conflicting. For instance, museums must ensure high speech intelligibility for guided tours and multimedia presentations while also providing quiet zones that afford privacy and support individual reflection. Because intelligibility and privacy are inversely related, the selection and placement of finishing materials are critical for balancing these competing demands.
1.1. Previous Research and Literature Gap
Acoustic assessments in museums are most often conducted post-occupancy, frequently in the first years of operation, and few of these consultant-led studies have been published to guide future projects [
8]. Early research highlighted the importance of acoustic design in gallery environments and outlined the core challenges unique to museums [
9,
10]. Subsequent investigations have largely focused on in-situ measurements of reverberation time (RT), Speech Transmission Index (STI), and clarity (C
50) across individual case studies, with a few works suggesting design recommendations to improve the acoustic environment [
11,
12,
13,
14,
15]. These suggestions often involve introducing new materials or making minor post-construction modifications. However, these efforts generally fail to address design strategies that could prevent acoustic issues from arising in the first place.
One notable approach to bridging this gap is the use of immersive environments to evaluate soundscape preferences in museums [
16]. This research found that soundscapes recorded in exhibition spaces were frequently perceived as unfocused, distracting, and less engaging, with sound masking systems proving to be an effective strategy for mitigating these issues [
1]. Multi-criterion approaches, such as the Index of Acoustic Quality in Museums (IAQM) [
17] and the Global Acoustic Quality Parameter (PQAM) [
18], also integrate objective and subjective data to characterize museums acoustically [
17], but have limited outcomes and do not offer actionable design solutions that can be effectively implemented during the planning and construction phases. Similarly, subjective assessments were conducted in a historical museum [
19] and large-scale institutions such as the Tate Modern, highlighting correlations between acoustic comfort and room acoustic indicators in sequential spaces [
20]; however, the findings were not translated into generalized guidelines.
Furthermore, formal standards tailored to museum acoustics are virtually nonexistent. Standards like ISO 22955:2021 define acoustic quality criteria for open-plan offices [
21]; however, no equivalent normative framework addresses the demands of modern exhibition spaces. This absence underscores the need for systematic research that translates room acoustic metrics into practical, design-integrated solutions that can be implemented during the initial planning and construction phases.
1.2. Acoustic Parameters
The reverberation time, typically estimated as T
20 by fitting the decay curve from −5 to −25 dB [
22], is the most widely regulated acoustic descriptor. ISO 3382-2 defines validation procedures for T
20 measurements; however, this metric ignores early reflections, which are critical components of perceived room acoustics. However, it is well known that two rooms with identical T
20 can sound different if their early reflection patterns diverge [
23]. Therefore, relying on reverberation time alone can yield poor correlations with subjective experiences. To capture the full aural character of a space, complementary parameters that include early reflections are essential and have been investigated in several studies [
24,
25,
26,
27,
28]. For instance, studies in educational and office environments have demonstrated the importance of Speech Clarity (C
50) and Speech Transmission Index (STI) for listener comfort and distraction distance [
29,
30,
31,
32,
33,
34]:
Speech clarity (C
50): defined as the energy ratio of early (≤50 ms) to late arriving sound, expressed in decibels, and introduced in ISO 3382-1 [
35].
Speech Transmission Index (STI): quantifies modulation loss due to reverberation and background noise, providing a direct measure of intelligibility formalized in IEC 60268-16 [
36].
Furthermore, museums share several acoustic requirements with open-plan offices to some extent, both of which require that speech intelligibility decrease with distance while maintaining adequate clarity in the near field. In addition, sources are typically non-directional due to free visitor movement, a characteristic addressed in the open-plan office standard [
37]. Without museum-specific regulations, this study adopts the ISO 3382-3’s open-plan office metrics, which previous work has investigated for its applicability in museums [
38]. The single-number quantities prescribed in ISO 3382-3 analyzed in this research are as follows:
Spatial Decay Rate of Speech (D2,S): A-weighted speech attenuation (dB) when the listener’s distance from the source is doubled. A higher D2,S indicates stronger attenuation.
Speech Level at 4m (Lp,A,S,4m): A-weighted speech level at 4 m from the source. Lower values indicate better attenuation.
Distraction Distance (rD): distance at which the STI falls below 0.50—beyond this point, listeners perceive limited intelligibility, indicating increased speech privacy.
In general, optimal conditions feature high D
2,S and L
p,A,B, low L
p,A,S,4m, and correspondingly small r
D [
32,
37]. While r
D accounts for all room acoustic factors affecting speech intelligibility between the source and the listener [
32], analyzing r
D alone can be misleading, as it can be artificially improved by increasing background noise, potentially degrading overall comfort. Therefore, this research considers all three parameters for a comprehensive assessment.
1.3. Finishing Materials in Museums
Contemporary museum interiors frequently employ fully reflective finishes, such as concrete, masonry, or marble, to achieve a “white-box” aesthetic [
2]. Acoustic treatments, when applied, are often limited to wall panels in multimedia galleries or event atria. Accounting for the acoustic implications of design decisions from the schematic design stage enables a holistic balance of performance and aesthetics: scattering elements can redirect energy toward absorbent surfaces, diffusers can mitigate flutter echoes without excessive sound level loss, and absorbers can be distributed to fine-tune reverberation times and speech clarity.
Studies in classrooms and performance venues have demonstrated how the choice and placement of diffusers and absorbers critically influence acoustic parameters [
28,
39,
40]. The spatial distribution of absorptive materials can also significantly alter the clarity and privacy metrics [
41]. However, comparable investigations in museum environments are limited in their scope. For example, Barbo (2023) [
5] evaluated increased absorption in gallery rooms; however, the interventions were tailored for the four rooms studied, which restricted the generalizability of the recommendations.
1.4. Aim, Research Questions, and Hypotheses
This study systematically evaluated the acoustic performance of commonly used finishing materials applied to ceilings, floors, and walls in eight museum galleries. Nine absorption scenarios were tested in each room (low, medium, and high on each surface), and the acoustic metrics defined above (T20, C50, STI, D2,S, Lp,A,S,4m, rD) were measured for all scenarios in each room.
Specifically, the investigation pursues three aims: quantifying the material-and-surface effects on room acoustics to transform assumptions into data—driven insights that support design decisions; examining the trade-off between speech intelligibility and privacy to identify material and placement strategies that optimize both competing demands; and translating the results into actionable guidelines expressed in architectural terms to ensure that designers can apply the recommendations directly within their workflows.
To frame these aims, four research questions guided the work: (1) How do varying levels of absorption (low, medium, and high) on ceilings, floors, and walls affect key acoustic parameters? (2) Does the effect of increasing absorption on one surface (e.g., ceiling) differ from that of an equivalent increase on another surface (e.g., floor or wall)? (3) Which surface treatment yields the greatest improvements in speech intelligibility (STI, C50), and speech privacy (D2,S, Lp,A,S,4m, rD)? (4) Given the complexity of measuring or calculating the STI, can a regression model be used to predict the STI with sufficient accuracy?
Accordingly, four hypotheses were tested. First (H1), it was hypothesized that increasing absorption from low to high would produce significant reductions in T20 and Lp,A,S,4m alongside corresponding increases in STI, C50, rD, and D2,S, regardless of the surface type. Second (H2), ceiling treatments were expected to produce the largest gains in intelligibility metrics (STI, C50), whereas wall treatments would most effectively enhance privacy measures (D2,S, rD) (H3). Finally (H4), a regression model based on T20, total absorption, and room volume would predict the STI, facilitating calculations during the initial stages of design.
3. Results
3.1. Effect of Location and Magnitude on Each Acoustic Parameter
Table 2 shows that the main effect of absorption magnitude was highly significant for all six metrics, with F-values ranging from F (2,14) = 74.8 for distraction distance (r
D) to F (2,14) = 797 for speech clarity (C
50) (all
p < 0.001). The main effect of location also reached significance for most metrics, indicating that treating ceilings, floors, or walls produces different acoustic outcomes, except for D
2S (F (2,14) = 3.1,
p = 0.077), suggesting that, on average, this privacy metric is less sensitive to the location of absorption.
Critically, all six parameters exhibited significant Location × Magnitude interactions (all
p < 0.03), confirming that the efficacy of increasing absorption depends on the surface being treated. For example, a given increase in the absorption level on the ceiling does not produce the same T
20 reduction or STI gain as an equivalent increase on the floor or wall. Detailed post-hoc comparisons and simple effects analyses to identify the most effective surfaces for each metric are presented in
Section 3.3.
3.2. Condition ANOVA: Specific Scenario Comparisons
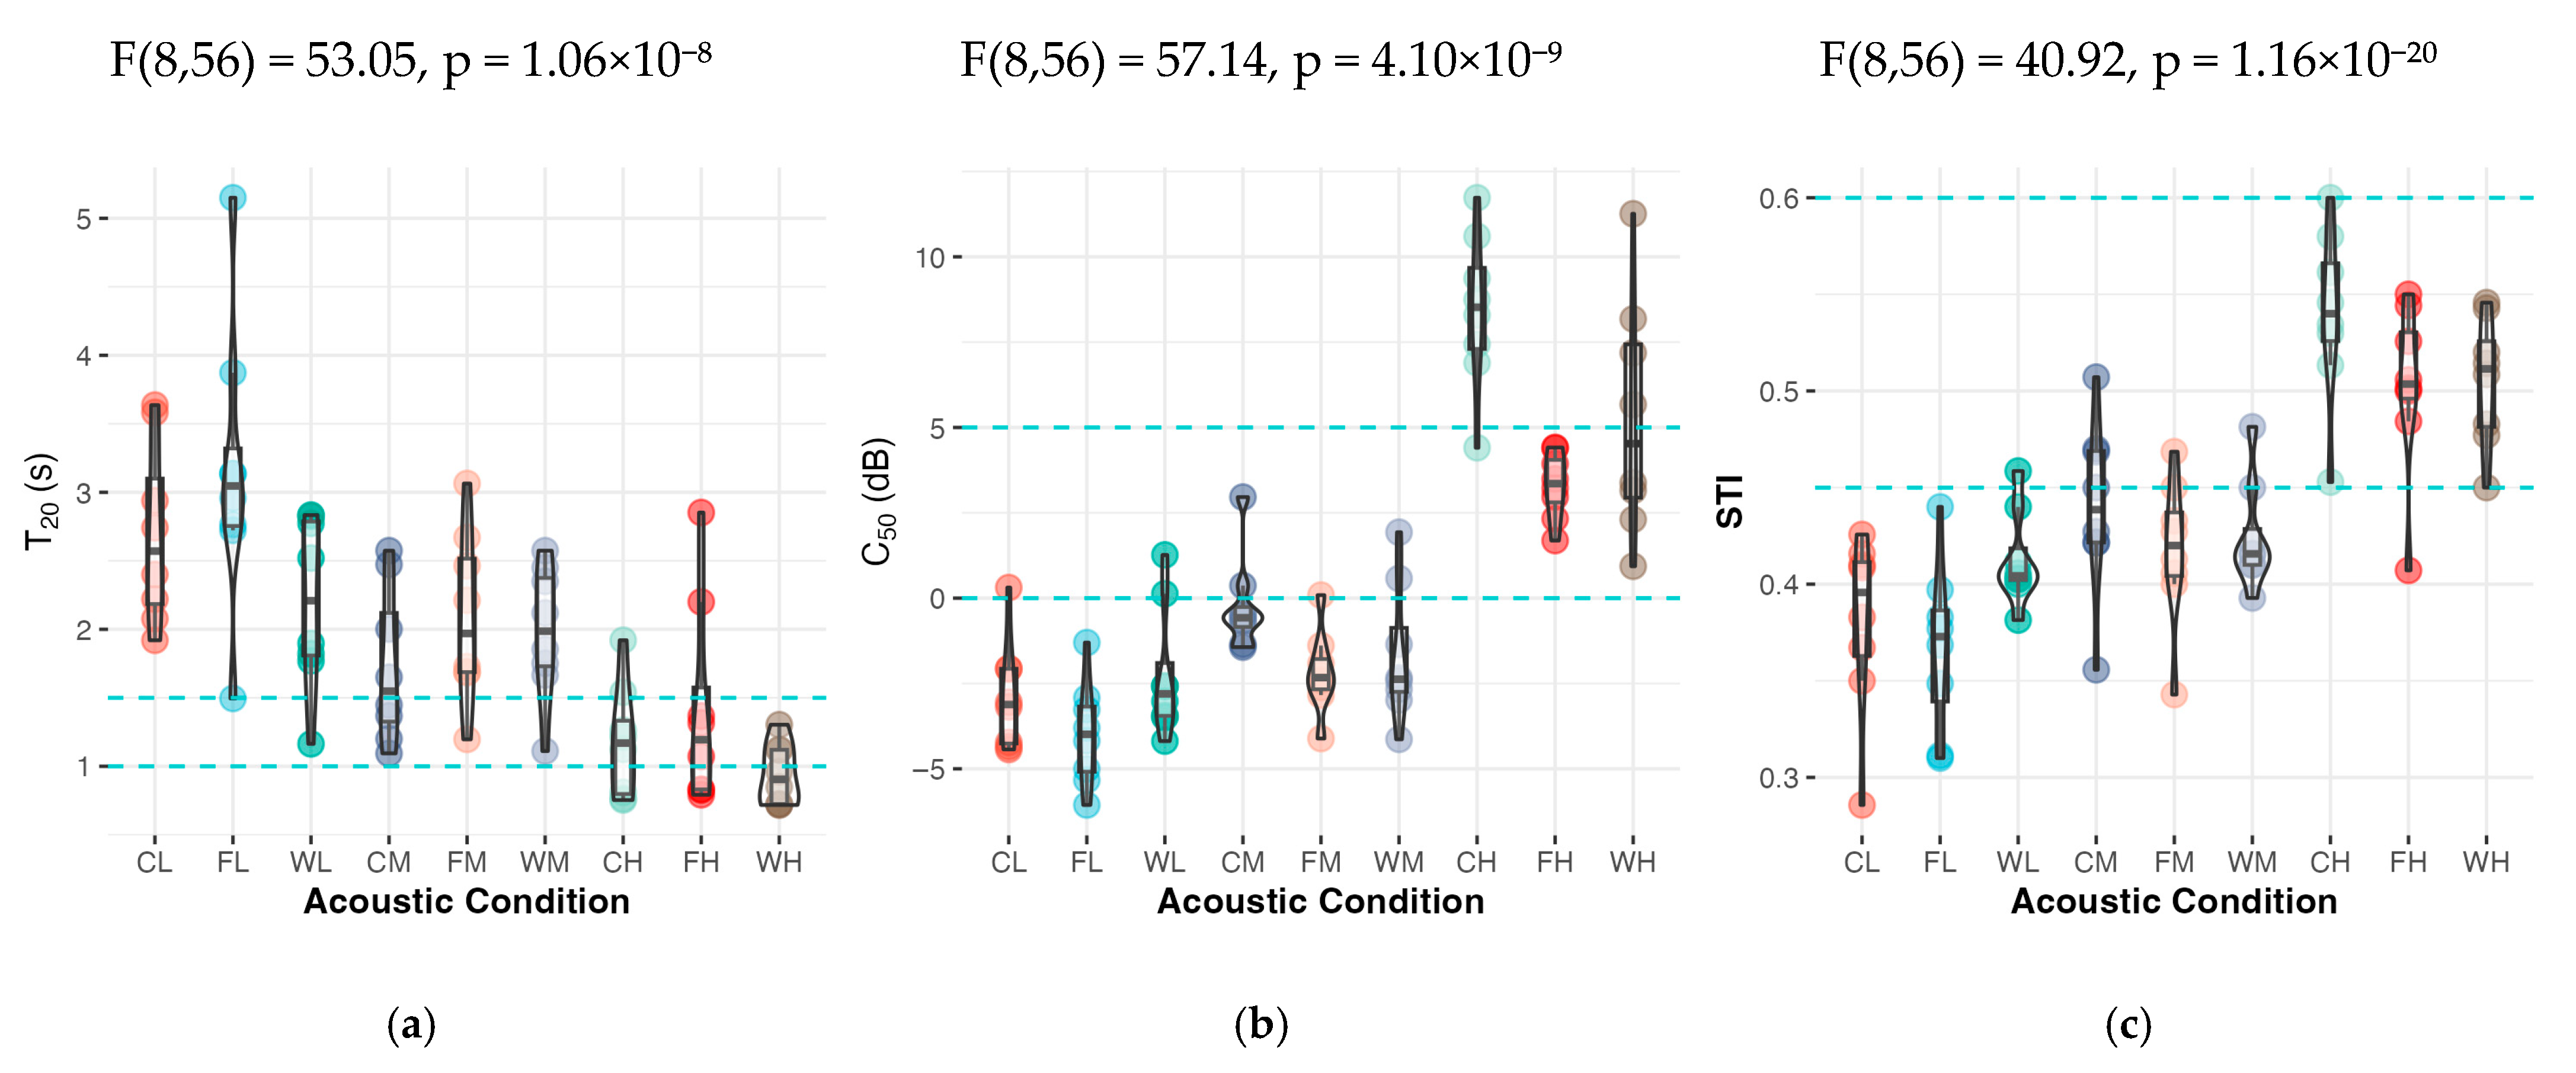
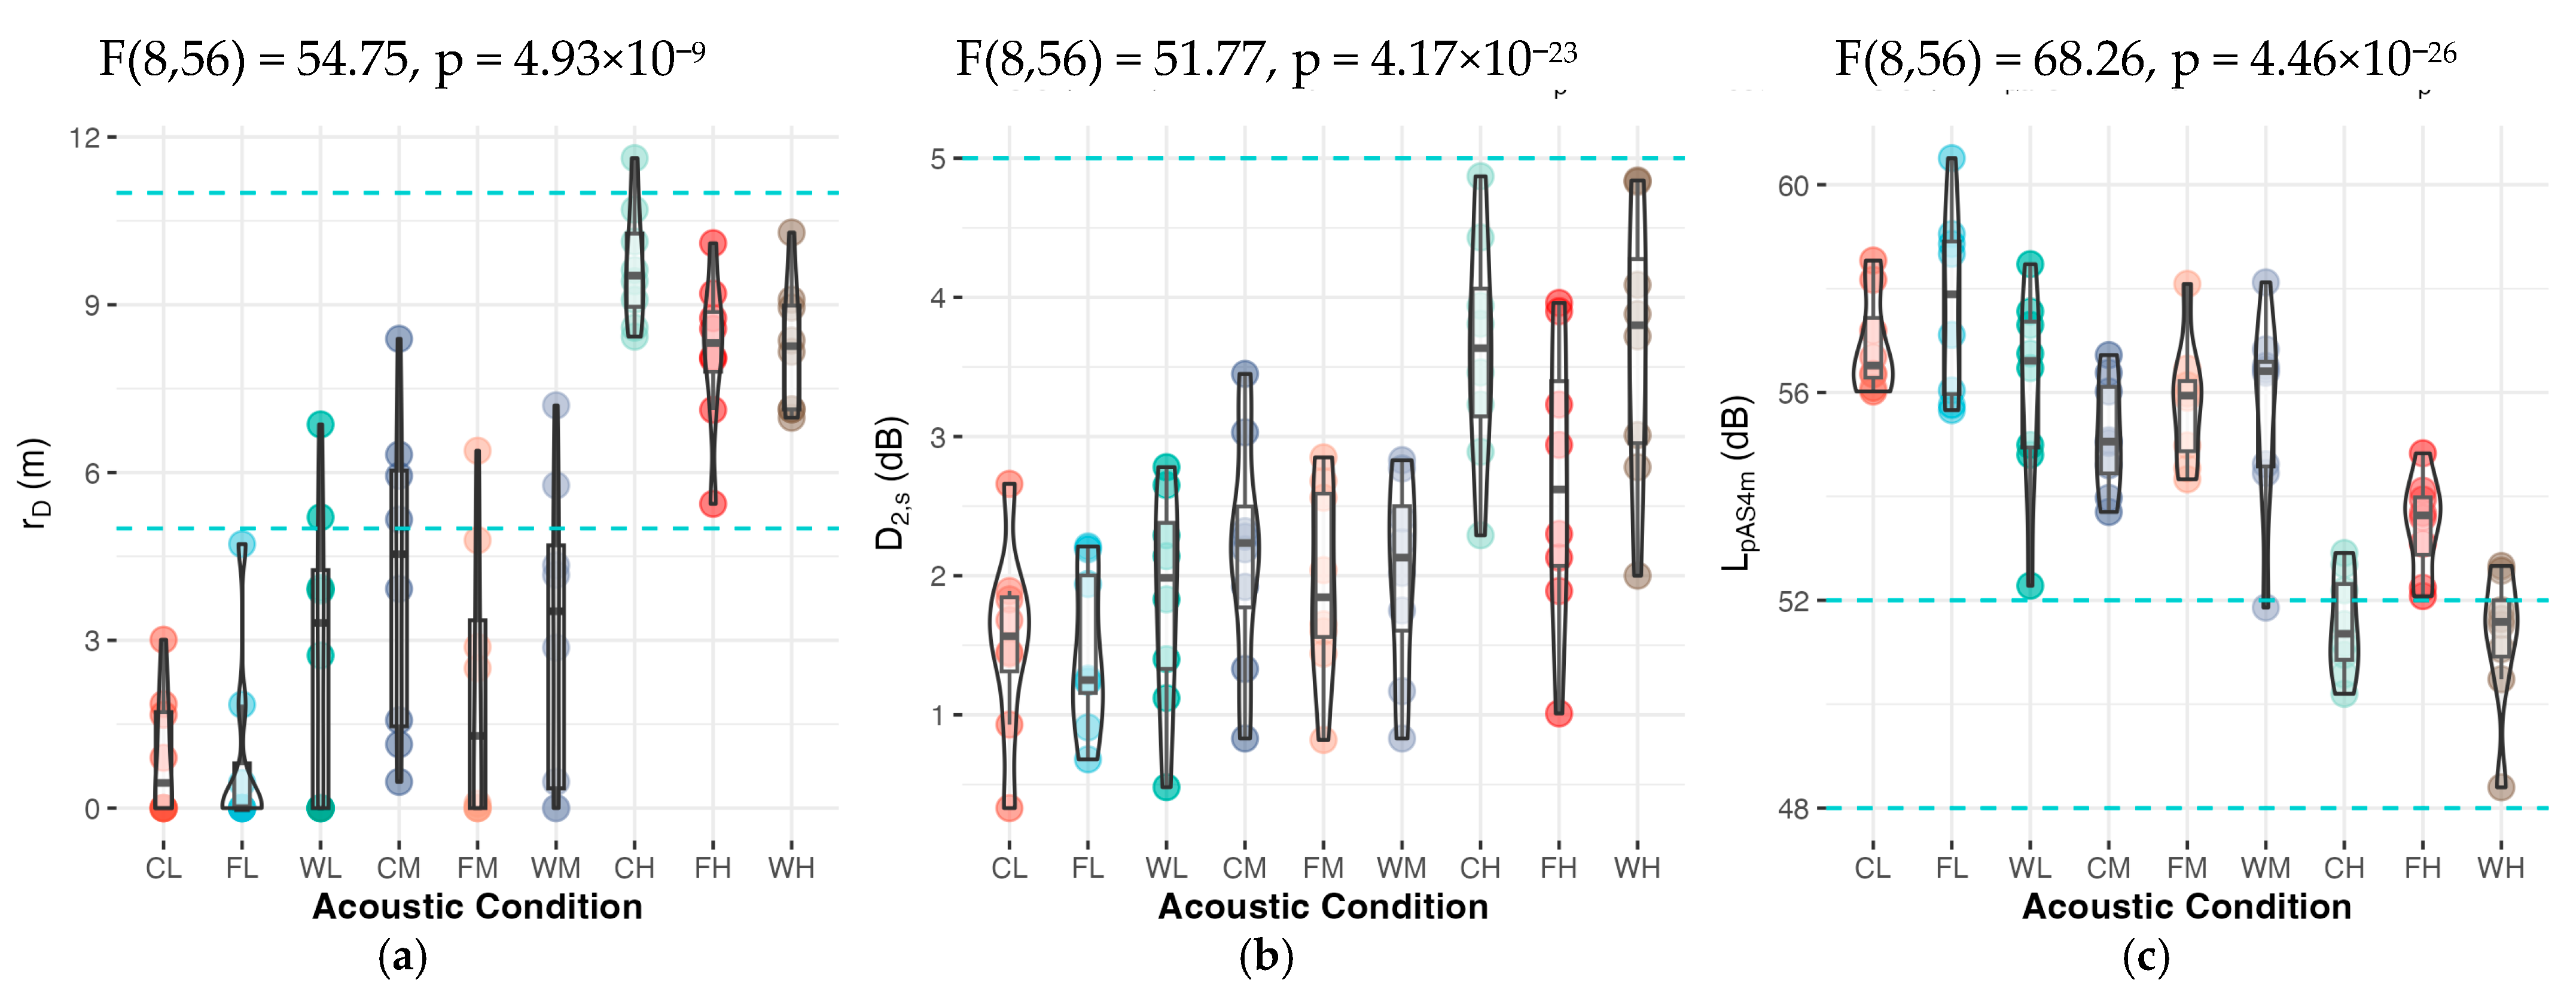
Figure 2 and
Figure 3 show the results of the ANOVAs performed across the nine combined absorption conditions for each acoustic metric. Design targets for each metric—indicated by the dashed cyan lines–were defined based on ISO 3383-3 [
37] and previous research [
17,
18] as follows: reverberation time (T
20) between 1.0 s and 1.5 s; speech clarity (C
50) between 0 dB and 5 dB; Speech Transmission Index (STI) between 0.45 and 0.60; distraction distance (r
D) below 5 m for high privacy (or above 11 m for low privacy); spatial decay rate (D
2,S) between 2 dB and 5 dB; and A-weighted speech level at 4 m (L
p,A,S,4m) between 48 dBA and 52 dBA.
All ANOVA tests were highly significant, indicating that at least one condition differed from the others for each metric. Confirming H1, with increasing absorption: T20 [500, 1k, 2k] declines (F (8,56) = 53.05, p = 1.06 × 10⁻⁸), C50 [500, 1k, 2k] improves (F (8,56) = 57.14, p = 4.10 × 10⁻⁹), and STI increases (F (8,56) = 40.92, p = 1.16 × 10⁻²⁰). Regarding the privacy metrics, with a higher absorption: rD increases (F (8,56) = 54.75, p = 4.93 × 10⁻⁹), D2,S improves (F (8,56) = 51.77, p = 4.17 × 10⁻²³), and Lp,A,S,4m decreases (F (8,56) = 68.26, p = 4.46 × 10⁻²⁶).
Under low-absorption conditions, all median T20 values exceeded the recommended maximum of 1.5 s, with concrete floors (FL) producing the highest variability (1.5–5.2 s) and masonry walls (WL) yielding the lowest median value (2.21 s). Introducing medium absorption on the ceiling (CM) effectively brought T20 close to the 1.5 s threshold (median = 1.55 s), whereas equivalent mid-level treatments on the floor (FM) and walls (WM) remained above the target. In the high-absorption scenarios (CH, FH, WH), every condition fell within the 1.0–1.5 s range, and the WH case even dipped below 1.0 s with minimal variability, suggesting that high-absorption walls are suited for galleries demanding tight reverberation control.
A similar progression was observed for the clarity and intelligibility. Low-absorption C50 values clustered at or below 0 dB, indicating less distinction between direct and reverberant sounds, and the STI remained under the 0.45 threshold. Medium absorption boosted both C50 and STI, but only the wood ceiling treatment approached lower thresholds (C50 ≈ 0 dB, STI ≈ 0.45). Most conditions with high absorption fall between the optimum STI values suggested, with just one outlier outside the floor. The microperforated ceiling (CH) provided the highest STI values, followed by the walls and floor. The CH also reached the highest C50 levels, followed by acoustic plaster walls (WH), but with higher variability. The Carpet Floor (FH) is exactly between the proposed C50 thresholds. These findings reinforce H2: ceiling absorbers deliver the greatest STI and C50 improvements (ΔSTI ≈ +0.16 for CH vs. CL), followed by walls (ΔSTI ≈ +0.10), and then floors (ΔSTI ≈ +0.13).
The privacy metrics exhibited a more complex relationship (
Figure 3). Low absorption yielded median r
D values below 5 m, which is indicative of inherently high speech privacy, while medium and high absorption increased r
D into the 5–11 m “transition” zone, reflecting clearer direct sound and reduced masking. However, high absorption also produced steep spatial decay rates (D
2,S between 3 dB and 5 dB) and lowered speech levels at 4 m (L
p,A,S,4m around 50 dBA), particularly under WH, which delivered the strongest overall attenuation profile. Although r
D alone can suggest reduced privacy at high absorption, the combination of high D
2,S, and low L
p,A,S,4m confirms that high-absorption walls most effectively prevent speech intrusion at moderate distances.
3.3. Pairwise Comparisons and Simple-Effects Contrasts
Holm—adjusted pairwise comparisons (
Table 3) narrowed the ANOVA results to clarify which pairs of locations and magnitudes of absorption differed across the metrics. Comparisons between the ceiling and floor treatments were significant for all parameters (T
20:
p = 0.044; STI:
p = 0.0054; C
50:
p = 0.00021; r
D:
p = 0.0069; D
2,S:
p = 0.0025; L
p,A,S,4m:
p = 8.4 × 10
−5), whereas no significant differences were observed between the ceiling and wall treatments (all
p > 0.05). Floor–wall contrasts likewise reached significance for each metric (T
20:
p = 0.0096; STI:
p = 0.0447; C
50:
p = 0.0339; r
D:
p = 0.041; D
2,S:
p = 0.0045; L
p,A,S,4m:
p = 0.0001), indicating that adding absorption to the floor differed acoustically from both ceilings and walls, while ceilings and walls behaved similarly when treated.
Magnitude contrasts confirmed that all absorption increments had significant effects, demonstrating that each increase in the absorption level resulted in a statistically significant performance gain. All steps (low-to-high, medium-to-high, and low-to-medium) yielded highly significant changes across all metrics (all p < 0.001), thereby corroborating the overall magnitude effect.
Simple effects contrasts (
Table 4) quantified the magnitude of each absorption increment on each surface. For ceilings, increasing absorption from low (bare concrete) to medium (wood panel) reduced T
20 by 0.96 s, increased STI by 0.05, improved C
50 by 2.67 dB, and extended r
D by 3.18 m. A further step to high absorption (microperforated panel) yielded an additional 8.65 dB of clarity and 5.59 m of distraction distance gain. The full low-to-high transition produced the largest improvements across most metrics (ΔSTI = +0.15; ΔC
50 = +11.32 dB; Δr
D = +8.77 m; ΔD
2,S = +2.09 dB; ΔL
p,A,S,4m = −5.40 dB), except for ΔT
20, which was given by the floor. This confirms that ceiling absorbers are most effective for speech intelligibility (supporting H2) and overall attenuation.
Floor treatments accounted for the steepest initial T20 drop: ΔT20 = −1.06 s when moving from concrete to wood, with a further −0.68 s reduction from wood to carpet (total ΔT20 = −1.75 s). These findings underscore the pivotal role of floor treatment in rapid reverberation control. The low-to-medium change also lowered Lp,A,S,4m by 1.91 dB, while the medium-to-high step produced a 6.08 m increase in rD.
Wall treatments, the low-to-medium shift from masonry to gypsum-wool backing yielded only marginal, non-significant changes (e.g., ΔT20 = −0.21 s; ΔC50 = +0.57 dB; ΔrD = +0.28 m), indicating the limited benefit of that incremental treatment. In contrast, the medium-to-high upgrade to acoustic plaster generated substantial privacy gains (ΔD2,S = +1.64 dB; ΔLp,A,S,4m = −4.38 dB) and appreciable clarity improvements (ΔC50 = +6.93 dB; ΔrD = +5.16 m). This finding substantiates the hypothesis that wall treatments are critical for optimizing speech privacy (H3).
Together, these contrasts demonstrate that while increased absorption enhances acoustic performance, the scale and nature of the effect depend on both the surface treated and the absorption level, providing the surface-specific guidance required for informed museum designs.
3.4. STI Prediction
Hypothesis 4 posited that a regression on T
20, total absorption, and volume would predict the STI within ±0.03 units. To test this hypothesis, a linear mixed–effects model was fitted with STI as the outcome and T
20, total absorption (in Sabins), and room volume as fixed effects, plus a random intercept for each room. The resulting equation is as follows:
and
denote the total absorption and volume for the condition
in the room
. All three predictors were highly significant (
p < 0.001), confirming their contribution to intelligibility. The model explained 76.2% of the variance in STI based on fixed effects alone (marginal R
2 = 0.762) and 84.9% when room-to-room variability was included (conditional R
2 = 0.849).
Figure 4 presents the predicted STI surface over a practical range of absorption (0–400 Sabins) and volumes (300–1500 m
3), illustrating how the STI increases with increased absorption and decreases with larger volumes.
By substituting an estimated T20, proposed material Sabins, and gallery volume into this equation—or by reading directly from the contour plot—the STI can be forecast within ±0.03 units accuracy, confirming H4. This approach obviates the need for time-consuming STI measurements or calculations during preliminary design, enabling faster evidence-based iterations that bridge acoustic theory and real-world architectural practice.
To evaluate the robustness of the STI prediction model, we conducted multicollinearity diagnostics and leave-one-out cross-validation. All predictors showed low multicollinearity (VIF < 2.5), which supported stable coefficient estimates. The cross-validation yielded root mean square errors (RMSE) between 0.015 and 0.037 across the eight rooms, indicating good model generalizability across various spatial configurations.
Furthermore, to assess the relative importance of the predictors, a simplified model was tested, excluding the reverberation time (T20) and relying only on the total absorption area and room volume. This reduced the marginal R2 from 0.69 to 0.54 and increased the prediction errors, with some differences exceeding 0.1 STI units. While T20 can be approximated from volume and absorption using formulas such as Sabine’s, this assumes a uniform material distribution and ideal diffusion. However, in real-world data, absorption is often unevenly distributed, and room geometry, material variation, and surface diffusion introduce complexities that are not captured by volume and Sabins alone. Incorporating the measured T20 in the model improves the accuracy by capturing the emergent acoustic effects that stem from the interaction of these factors.
4. Discussion
The present study has shown that targeted absorption on ceilings, floors, and walls yields predictable surface-specific improvements in key acoustic metrics, thereby confirming the working hypotheses and extending descriptive case studies into actionable design guidance. As hypothesized (H1), each incremental increase in absorption resulted in significant reductions in reverberation time (T20) and speech level (Lp,A,S,4m), alongwith corresponding gains in speech intelligibility (STI), clarity (C50), distraction distance (rD), and spatial decay rate (D2,S).
Floor treatments emerged as the most effective “first move” for rapid reverberation control. Transitioning from concrete to wood delivered an initial ΔT20 of −1.06 s, and a further −0.68 s when moving to carpet, for a total reduction of −1.75 s. Although these relative gains are the largest observed, concrete floors began with the highest baseline T20; meeting absolute design goals may still require supplementary ceiling or wall absorption. Nevertheless, the pronounced impact of floor finishes affirms their priority when rapid rejection of rapid reverberation is required.
Consistent with Hypothesis 2, the ceiling absorbers improved the Speech Transmission Index (STI) and clarity (C
50) at each absorption increment. Although ceiling absorption can attenuate beneficial early reflections, potentially reducing intelligibility [
43], it also reduces late reflections, thereby enhancing overall clarity and controlling sound levels. The high-absorption ceiling configuration achieved dual benefits: raised STI to the optimal 0.60–0.65 range and increased spatial decay rates (D
2,S) by 2.09 dB per doubling of distance. This combination is particularly valuable for museum environments where (1) near-field clarity is increased for guided tours and multimedia content, (2) cognitive fatigue is reduced by minimizing reverberant buildup, (3) the propagation of ambient noise from adjacent galleries is limited, and (4) far-field privacy is maintained for quiet contemplation.
High-absorption walls demonstrated the strongest effects on privacy metrics, as posited in Hypothesis 3. Although medium-level gypsum–wool treatments yielded only marginal improvements, replacing them with high-absorption plaster increased D
2,S, and reduced distant speech levels (L
p,A,S,4m) to within ideal ranges, even driving T
20 below 1 s. These results extend previous research [
44], which suggested wall absorbers as a key privacy tool, by quantifying their effectiveness relative to ceiling and floor solutions.
These surface-specific patterns were consistently observed across eight diverse gallery spaces, despite variations in volume, layout, and baseline finishes. This suggests that the proposed “first-move” recommendations—floor finishes for rapid reverberation control, ceiling treatments for intelligibility, and high-absorption walls for privacy—can be broadly applied to museum environments. Furthermore, although increased absorption raised the distraction distance (r
D), suggesting reduced privacy, analyzing this metric alone can be misleading because the steeper decay (high D
2,S) and lower levels at moderate distances (L
p,A,S,4m) ensure better overall privacy. These results reinforce previous research that speech privacy is best judged using all metrics together [
32].
Moreover, while the acoustic metrics (rD, D2,S, and Lp,A,S,4m) applied in this study were originally developed for open-plan offices, their adaptation to museum environments is supported by three key factors. First, the controlled measurement protocol isolates the influence of architectural variables on speech intelligibility and privacy gradients, providing data comparable across spatial configurations. Second, the quasi-stationary behavior observed in museum settings—where visitors frequently pause for extended periods to view exhibits or participate in guided tours—creates acoustic conditions analogous to the metrics’ original use case. Third, the ISO 3382-3 assumption of omnidirectional sources accommodates the unpredictable movement patterns that are characteristic of both office and museum environments. Although these metrics do not account for all dynamic aspects of visitor behavior, they establish a robust baseline for evaluating how material choices and spatial geometries fundamentally affect speech privacy in open-plan galleries.
From an applied perspective, these findings have important practical implications for museum design. By quantifying the acoustic impact of ceiling, floor, and wall finishes across diverse galleries, this work converts expert intuition into empirically grounded guidance. Acoustic consultants can make educated guesses about the impact of different finishing materials, like choosing a fully reflective ceiling versus a wooden ceiling. However, quantifying these effects across multiple rooms allows for more assertive decisions. By translating technical metrics into data-driven recommendations, designers can achieve acoustic targets more efficiently, even without a dedicated acoustician on their project team.
Informing architects is particularly relevant given that museums are public spaces that are not designed as specialized performance venues like concert halls, but still require controlled acoustics, and acousticians frequently do not participate in the design process. As prior research indicates, few museums undergo dedicated acoustic optimization, and when such assessments occur, they often take place years after their opening [
8]. Early integration of these surface-specific guidelines, when modifications such as altering floor materials are still feasible, minimizes the need for costly retrofits and provides compelling evidence to persuade project teams to prioritize acoustic quality during museum planning.
6. Limitations and Future Research
However, some limitations should be considered. First, only nine discrete absorption scenarios were tested; real-world implementations may involve combinations of treatments beyond the single surface permutations studied here. Second, the tested scenarios focused on informing decisions for new construction, and more design solutions should be tested for retrofit interventions. For example, ceilings are usually the easiest way to treat an existing museum room; therefore, more ceiling design solutions should be tested. Furthermore, extensions of this work could explore hybrid treatment strategies by combining absorbers, diffusers, and scattering elements to develop comprehensive acoustic solutions tailored to the evolving needs of contemporary museum environments.
Moreover, the relationship between objective metrics and subjective visitor experience remains to be validated through perceptual assessment. Future research should integrate immersive listening tests and visitor surveys to correlate psychophysiological assessments with architectural features. These perceptual assessments can also consider the visitor’s movement. Although the current methodology uses fixed measurement positions and spatial averaging to provide generalizable acoustic assessments, this approach does not capture the dynamic acoustic experience of moving visitors. Future research should consider visitor movement to evaluate how dynamic visitor trajectories influence museum acoustics.
Finally, this study focused on the acoustic effects of architectural surfaces (ceiling, floor, and walls) in an empty room scenario, representing a baseline for early-stage design decisions. While furnishings, exhibit cases, and occupants typically introduce additional absorption and scattering—potentially improving acoustic conditions—their variability and late-stage placement often lie outside the scope of architectural acoustics planning. By isolating the impact of structural design choices, we highlight actionable strategies for acousticians and architects, who frequently have limited influence over curatorial and artistic arrangements. Future work could extend this framework to quantify the combined effects of architectural surfaces and exhibit-specific elements in occupied settings.


