1. Introduction
The selection of wood for the soundboard is crucial for guitar making. This initial step in the guitar-making process can often already have a decisive influence on the quality of the perceived sound of the final instrument [
1]. For this reason, understanding the relationship between the physical characteristics of the wood being selected and the acoustic characteristics of the guitar to be made and how they will be perceived is important. One relevant physical characteristic is internal material damping [
2]. The influence of internal material damping in the evaluation and grading of wood for stringed instruments has long been discussed [
2,
3,
4,
5,
6,
7]. However, little is known about the importance of internal material damping in comparison to other characteristics such as density and Young’s modulus (cf. [
8]). The present study, therefore, addresses soundboard damping and its relationship to both physical and perceptual aspects of the sound of a guitar. Specifically, the following two hypotheses were investigated using physical and perceptual evaluation:
To realize the physical evaluation, free field measurements were carried out. To realize the perceptual evaluation, two general opportunities existed: conducting a playing test or a listening test. Playing tests offer a high level of individuality, for example, regarding the piece being played, the playing duration or the option for the player to interact with the instrument or with the sound evolving into the room. Listening tests are limited in these regards. However, listening tests are often easier to realize and the experimental conditions are often easier to control in comparison to playing tests. Furthermore, listening tests allow an assessment without playing and thus allow one to focus solely on sonic characteristics. Playing tests are attributed a higher ecological validity [
9,
10] than listening tests. If solely sonic characteristics are the focus, however, listening tests can yield similar results to playing tests [
11]. If the sonic differences to be judged are subtle, listening tests can provide the unique opportunity to easily implement paired comparisons, which are recommended for the assessment of such differences [
12]. In order to ensure the highest possible ecological validity on the one hand and the best prerequisites for the assessment of subtle sonic differences on the other, it was decided to carry out both a playing test and a listening test for the perceptual evaluation in the present study.
2. Instruments
Three steel-string guitars were used in the present study. They were all the same model (Trevor Gore Guitars small bodied steel string) and were built by the same luthier. Considerable effort was made to keep the guitars as similar as possible. They were built concurrently, meaning that a specific manufacturing step was completed on all guitars before the subsequent step was started on any of them. That way, any minor differences could be copied on all the guitars. The guitars had Lutz spruce soundboards, Koa sides, Australian black wood backs and Macassar ebony fingerboards with Jescar EVO gold frets. They had nominally identical low-order resonances and monopole mobilities (cf. [
13]), and were made using wood for the soundboard that was matched for long and cross grain Young’s modulus and density. The only intended difference in the wood for the soundboard was the measured damping, with one having average damping, one having higher damping and one having lower damping. The specific damping values were defined based on measurements of a wood sample prior to guitar making. They correspond to the mean and ±1 standard deviation of the mean of the measured damping values. The damping range considered in the present study thus covered approximately 68% of the damping values that would occur in practical guitar making. The techniques for determining the physical characteristics of the wood for the soundboard were the same as in a previous study [
8]. The damping was determined using the BING system [
14]. This system determines physical parameters of standardized rectangular wood test pieces using vibration analysis. The fundamental frequency
and the temporal damping
were measured. The measured parameters were converted to the Q-factor within the system, which corresponds to a common representation of damping. The conversation was performed using the following relation derived by Brancheriau et al. [
15]:
A low Q-factor corresponds to high damping.
Table 1 shows the damping of the wood for the soundboard of the guitars along with the assigned labels that will be used throughout this paper.
The initial setup of the guitars was controlled to tight tolerances. The action of the 12th fret was within 0.1 mm across all guitars and all strings. The string height of the soundboard at the bridge was matched to ±0.15 mm. All guitars were stringed with Martin & Co MA540FX Flexible Core, 12-54, Light strings.
3. Measurement
The guitars were compared regarding their acoustical properties using different measurement approaches. The goal of this comparison was to better understand the physical influence of soundboard damping on the final instruments that might lead to audible differences between the guitars. Measured transfer functions were used to attempt to identify some systematic differences between the guitars. Additionally, temporal aspects were analyzed using plucked single notes.
The sound radiation of all guitars was measured in the anechoic chamber at Dresden University of Technology [
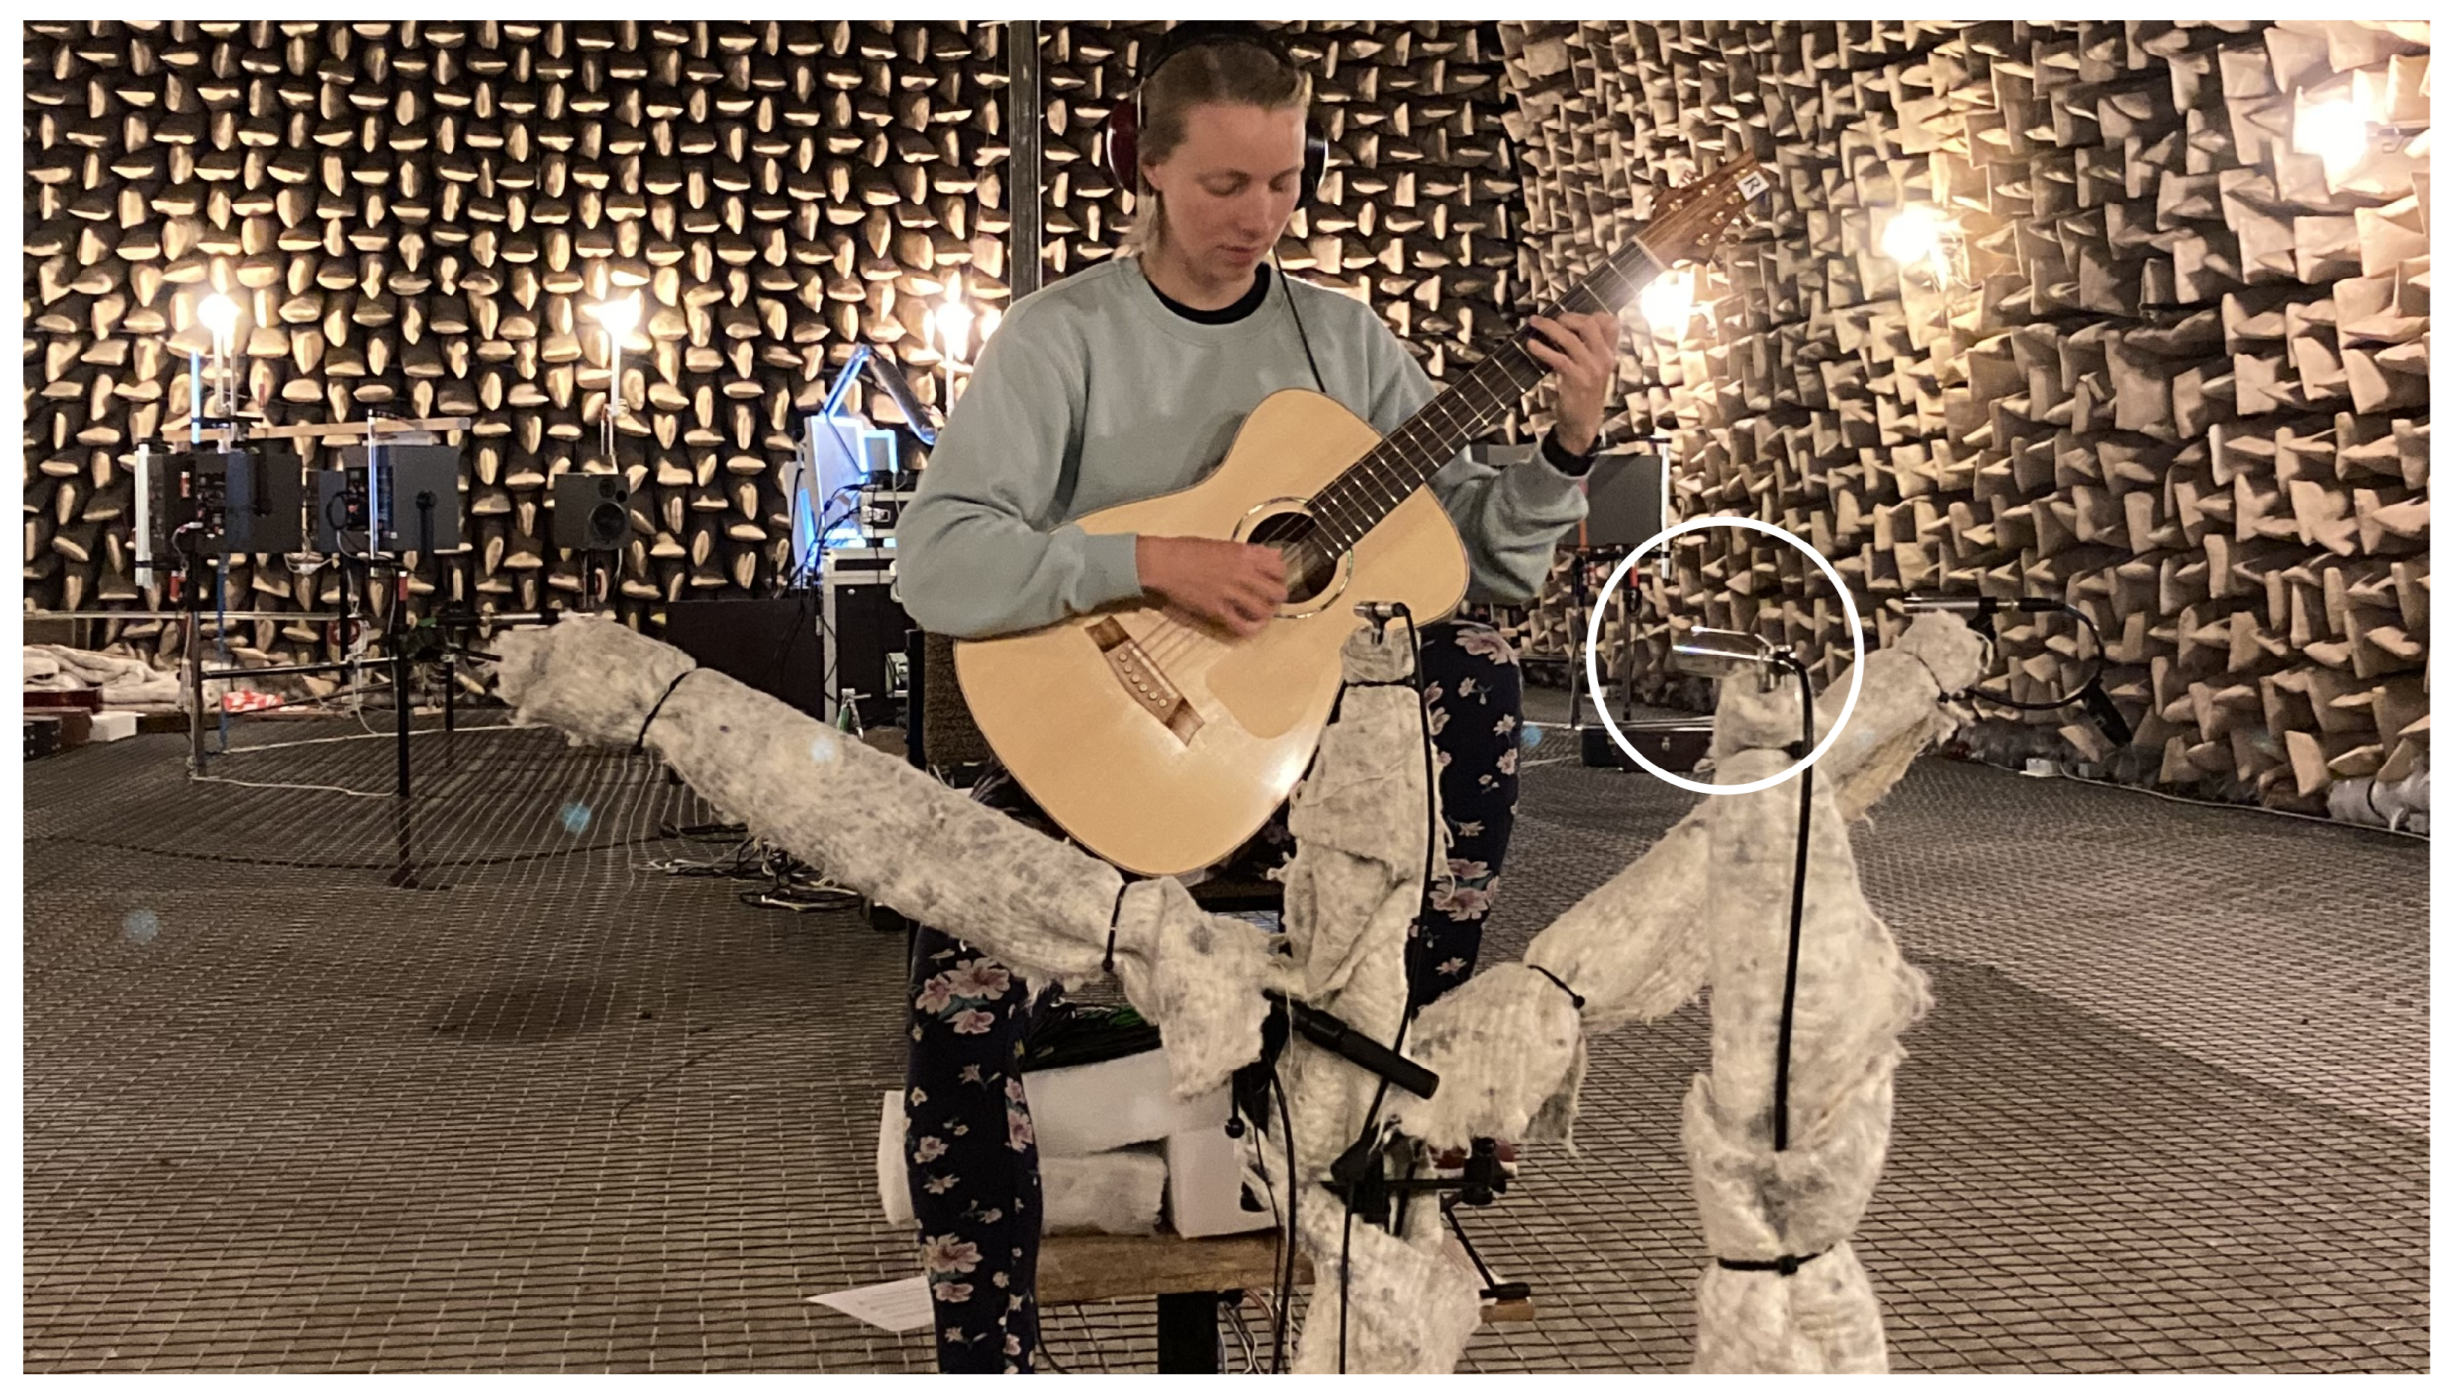
16] using transfer functions between the force excitation of the bridge and sound pressure at a frontal microphone position. The configuration is shown in
Figure 1a, with the G.R.A.S. 40HF microphone placed approximately 1.6 m in front of the guitar (marked with a white circle). A professional data acquisition system (HEAD acoustics labCOMPACT24, ArtemiS SUITE) was used for recording. A Bruel & Kjaer 8202 impulse hammer with a rubber tip and a Dytran 1051 force sensor was used to excite the guitar, as shown in
Figure 1b. The photo shows excitation at the middle of the bridge. Two additional measurements were taken, with the hammer hitting the bridge where the low or the high E string is attached respectively. The average over all three impact positions will be plotted for the transfer functions. For all transfer function measurements, the strings were damped using the hand.
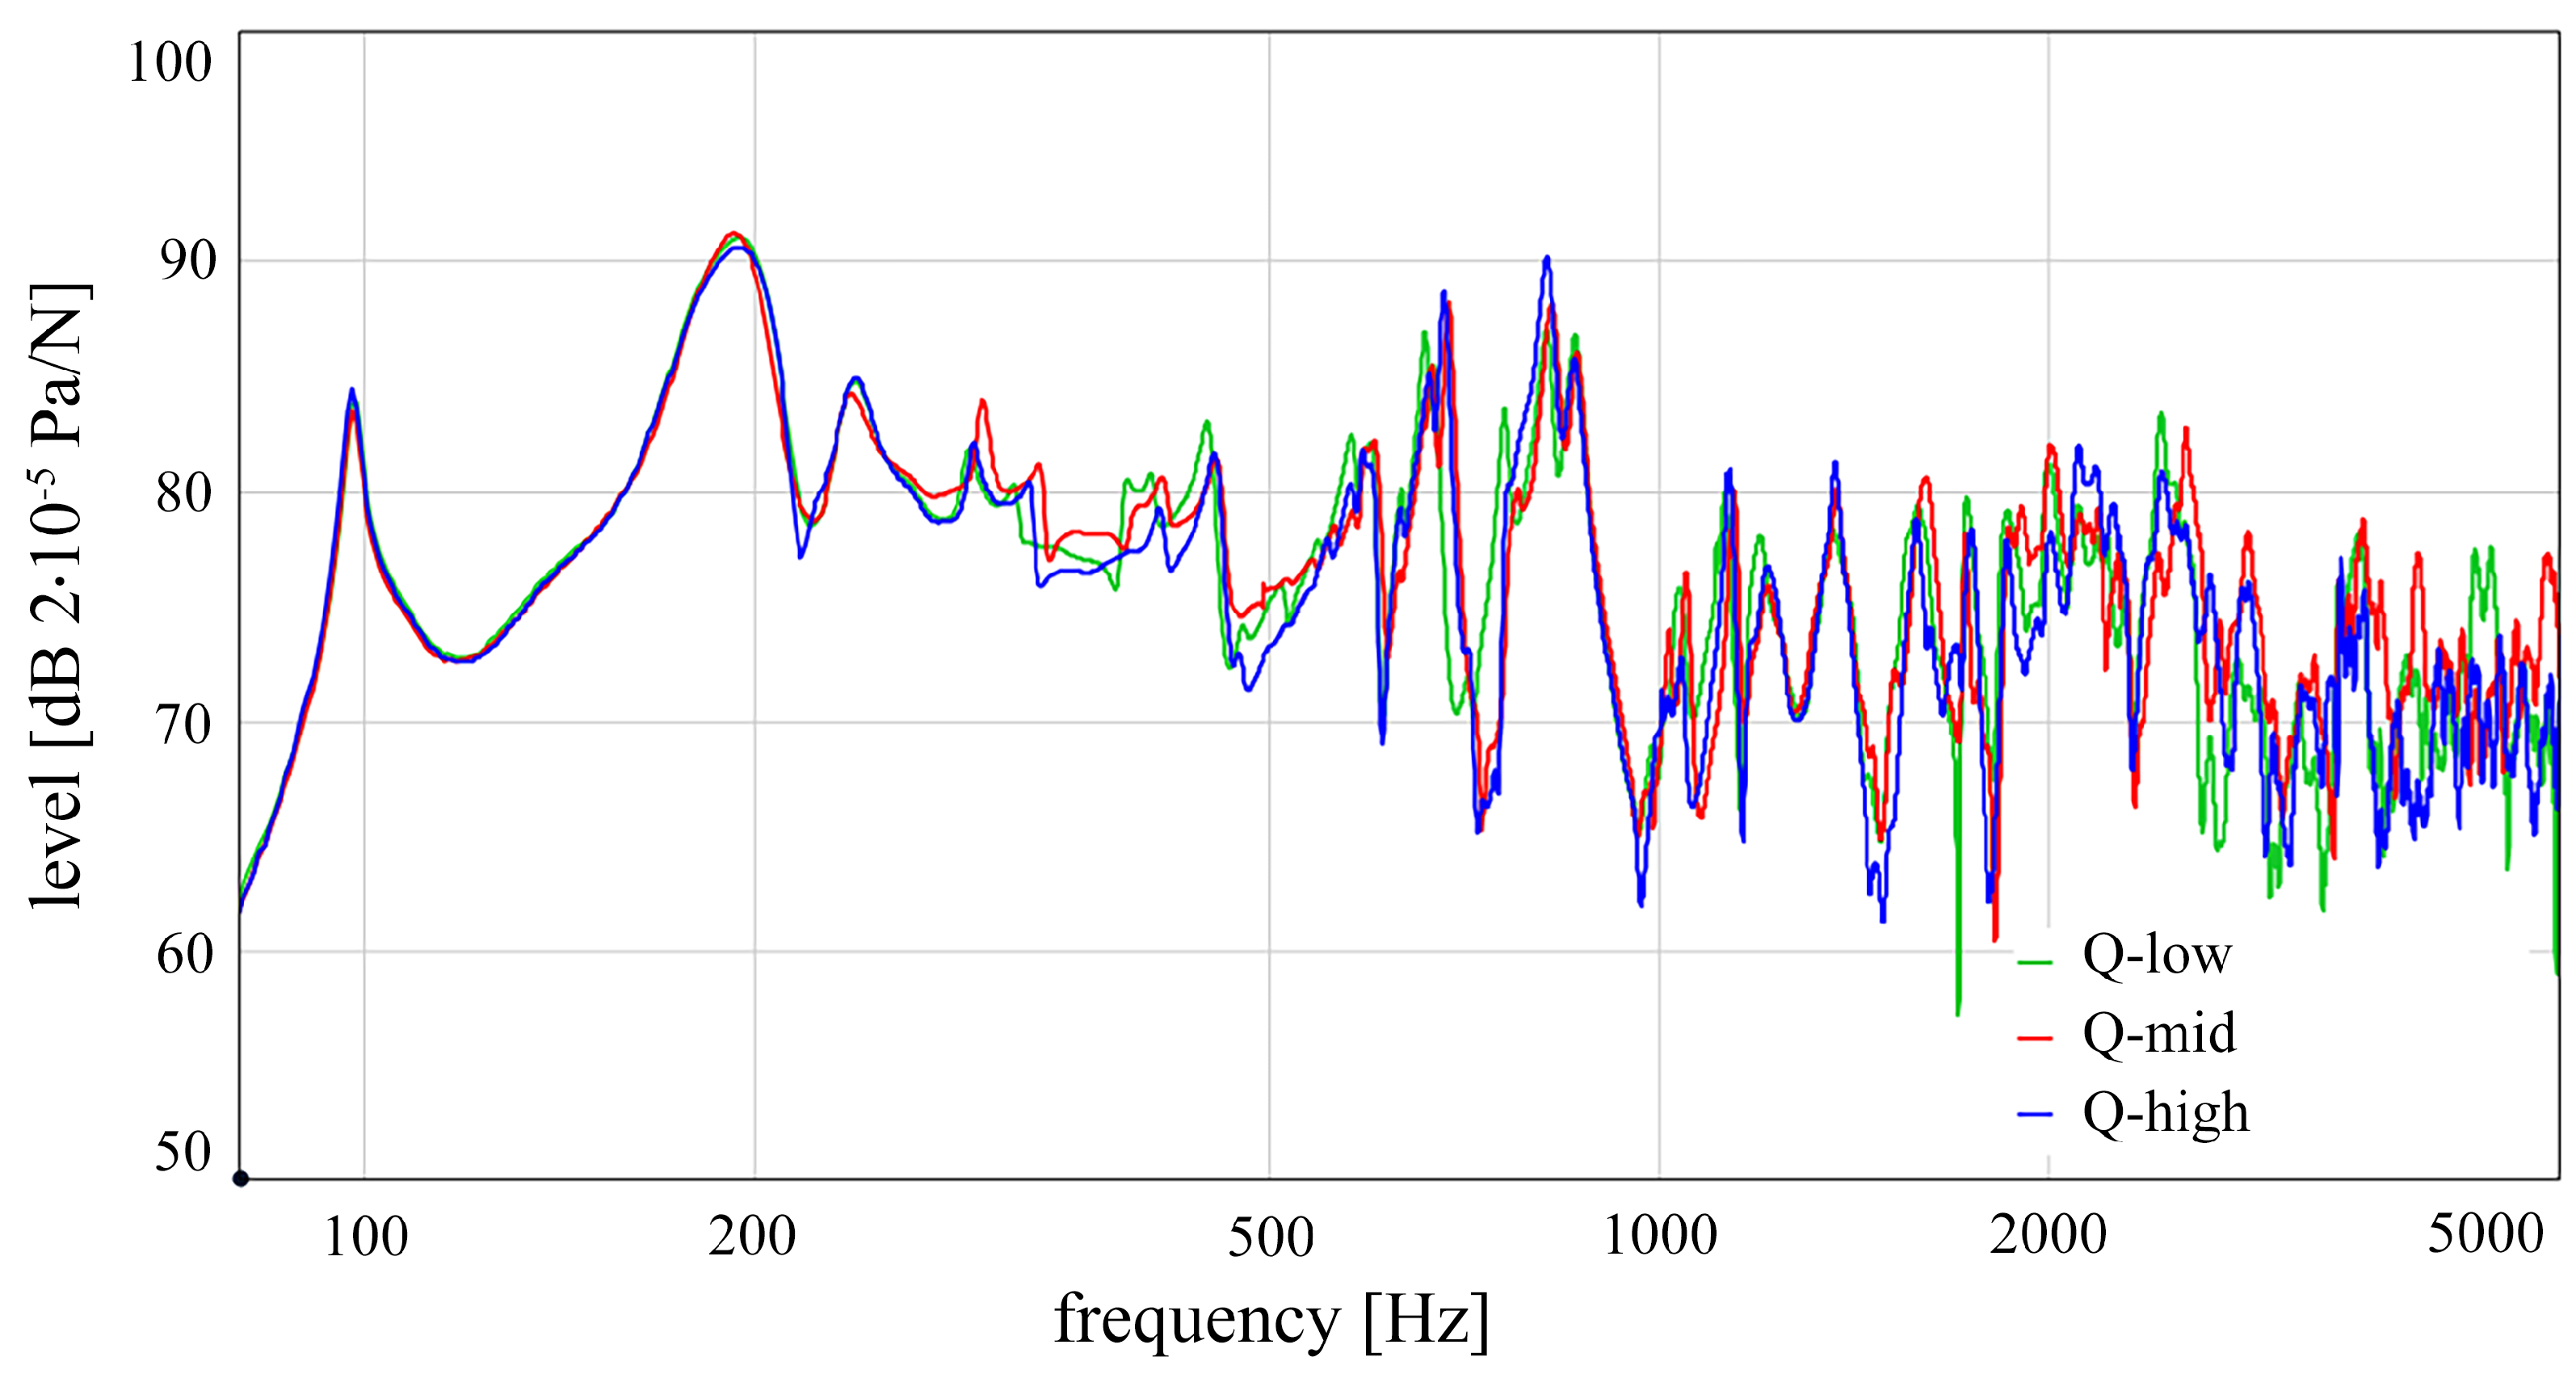
Figure 2 shows the resulting transfer functions. The resonances align well for the three guitars, which was expected because of the selected woods with matched density and bending stiffness. It also demonstrates the guitar maker’s ability to precisely build reproducible instruments with tight tolerances. The influence of damping could be recognizable due to resonance peaks of different widths. However, the curves do not show any systematic variation in the peak width. The amplitude of the transfer functions is also similar. Although slight differences can be seen at higher frequencies, there is no systematic variation depending on the soundboard damping. Using the transfer functions, it was not possible to identify differences in the final instrument due to soundboard damping. However, the influence of soundboard damping might be better recognized in the temporal behavior of the instrument. Therefore, the interaction between the strings and the body was evaluated using plucked tones.
The tone recordings were performed in the anechoic chamber using the same configuration as for the transfer function measurements. A helper tool was made using spring steel (diameter 0.7 mm) wrapped in an insulating hose. The length of the spring steel was set to 57 mm, which produced a vertical force of about 1 N with the tip horizontal when the handle was held at an angle of 45°. The helper tool was held in this position by hand in front of the middle of the sound hole and pulled horizontally away from the guitar until the tip of the spring steel slid over the string, as shown in
Figure 1c. This plucking process produces a more uniform excitation than manual plucking with the finger, but also represents an abstraction compared to the actual playing conditions. However, the experiment was mainly used to investigate the temporal decay behavior, so an exactly uniform plucking force was not required. Plucked tones were recorded for all strings stopped at all frets up to the ninth fret. The A-weighted sound pressure level of each plucked tone can be calculated as a function of time using a time constant of 125 ms.
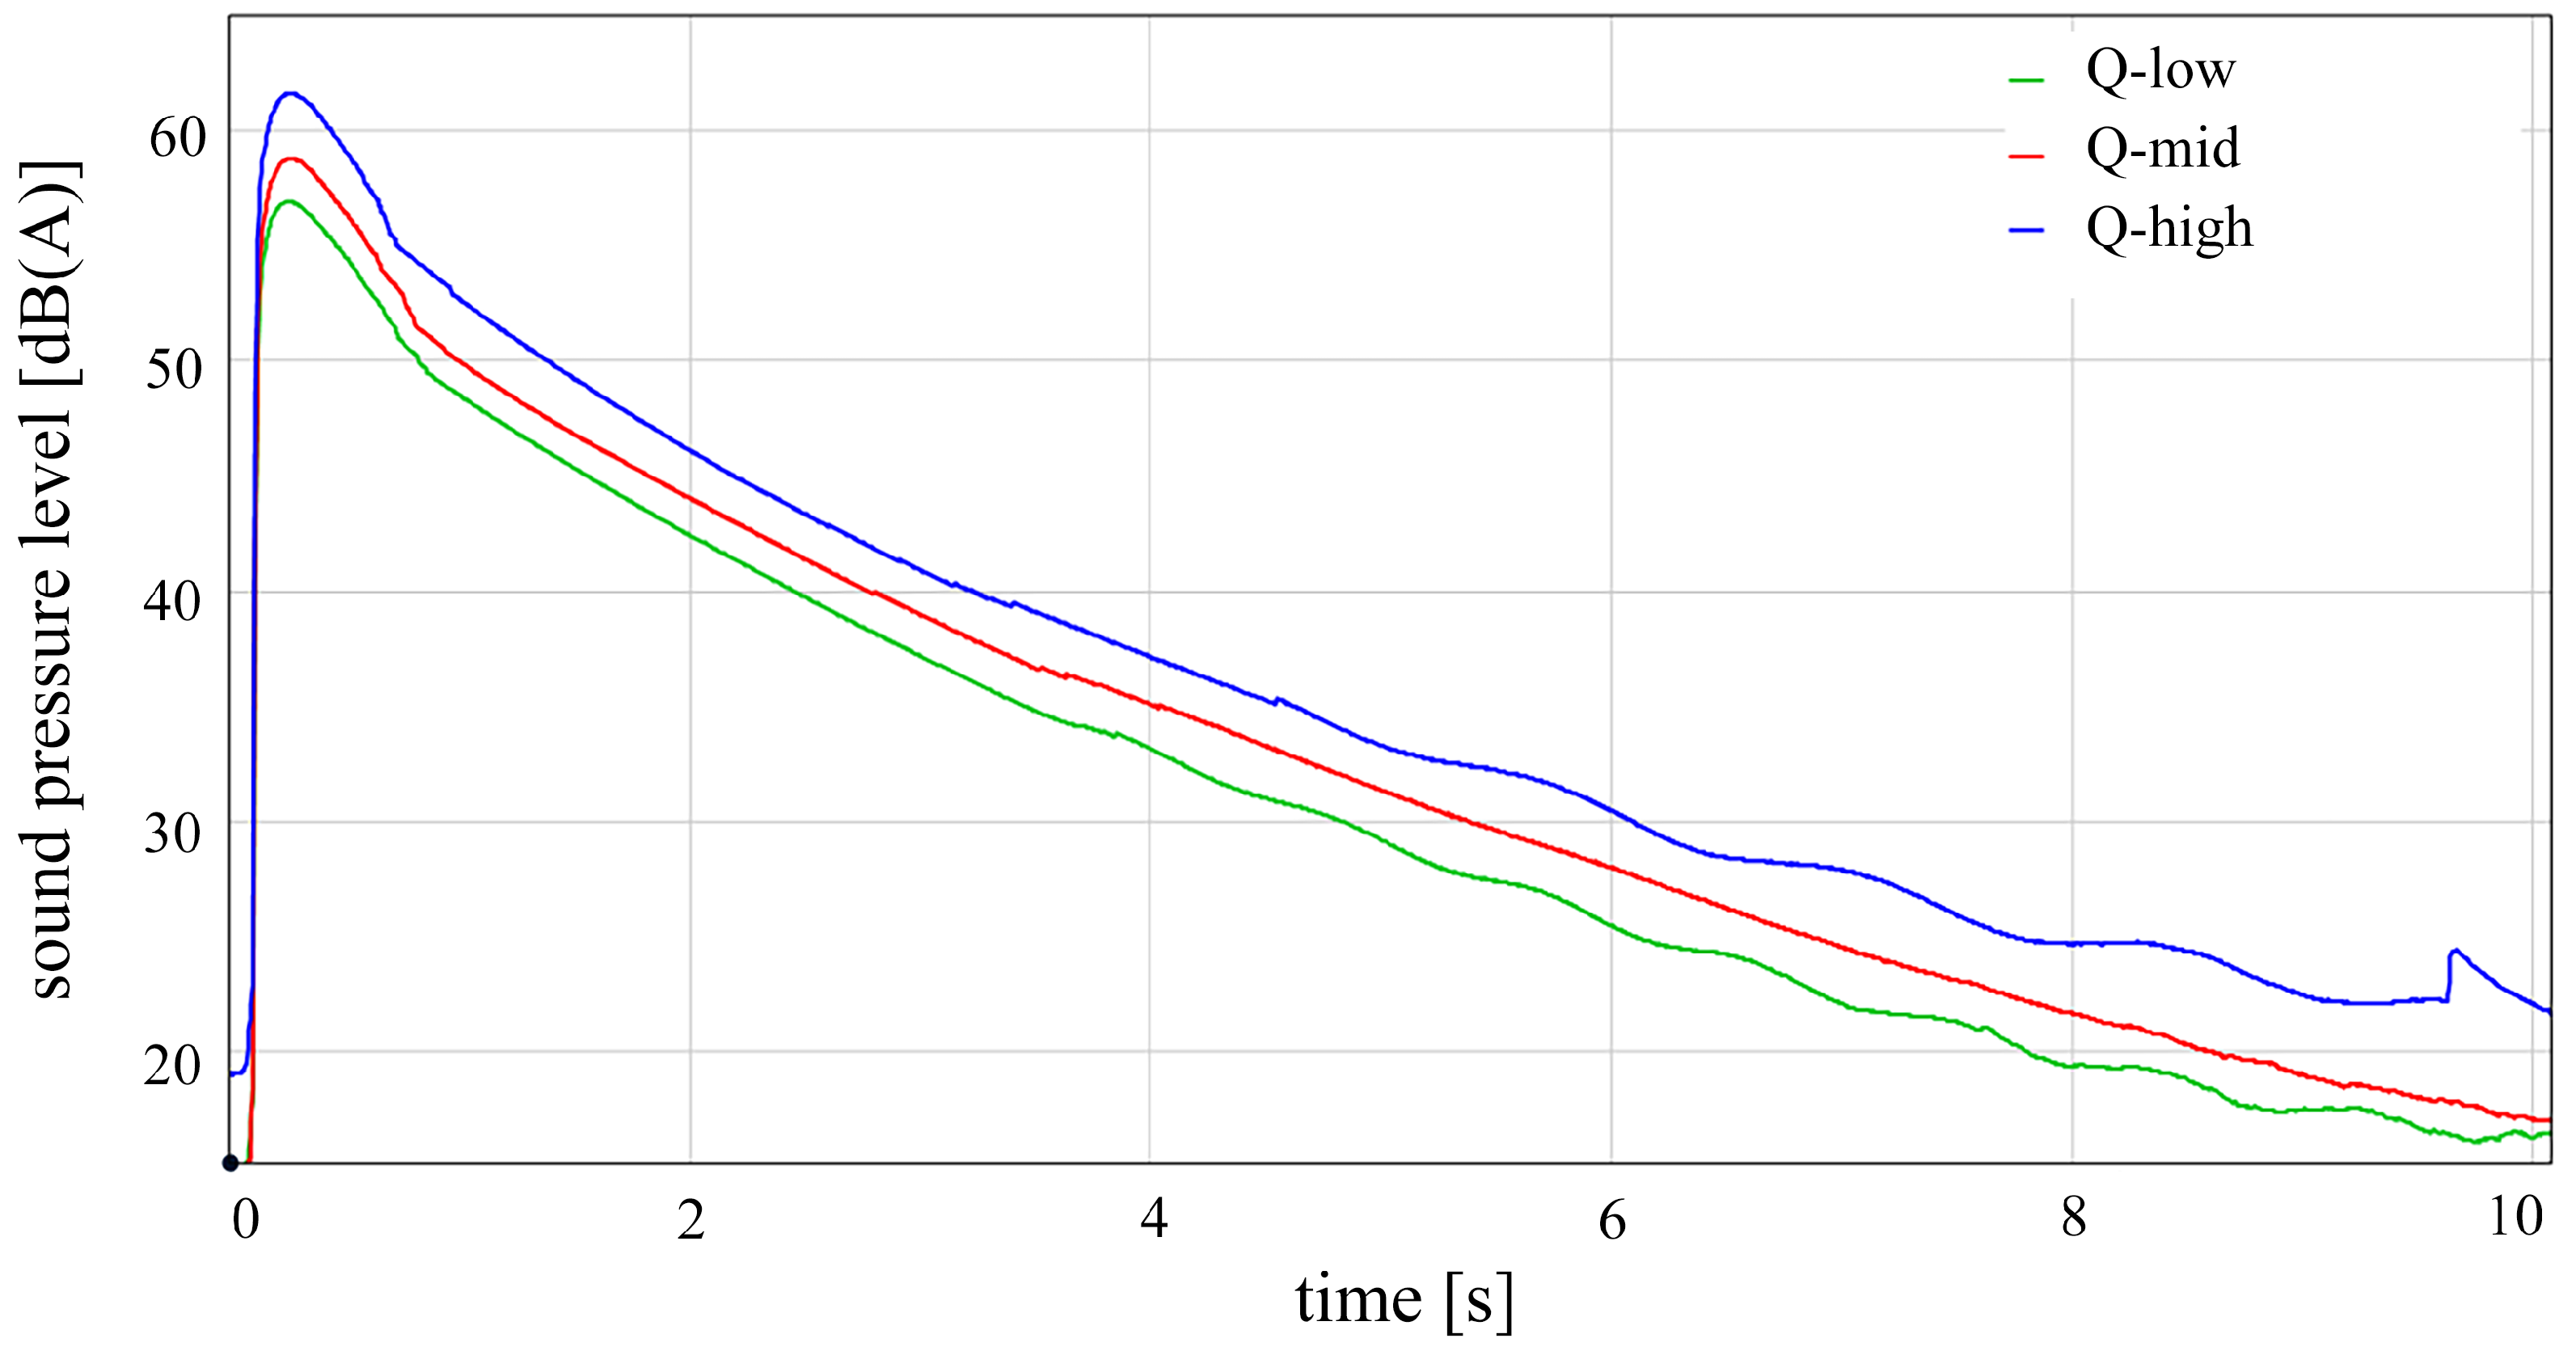
Figure 3 shows an example using the low E string. For each guitar, the sound pressure level is plotted versus time, averaged over the open string and the first nine frets to obtain a representation of the average decay for each instrument. It is noticeable that there is a difference in the strength of the initial transient, with the guitar with the lowest soundboard damping (Q-high) having the highest amplitude and the guitar with the strongest soundboard damping (Q-low) having the lowest amplitude. The decay of the guitars, however, does not greatly differ. The difference in amplitude corresponds to the expectation that low damping wood produces a high transient response. Since the temporal transient response is similar for all guitars, however, the difference in amplitude should then also be visible in the transfer functions (cf.
Figure 2), as the transfer function represents the temporally summed energy. However, the transfer function measurements show no systematic variation in amplitude between the guitars. The difference in the amplitude of the decaying tones is, therefore, probably due to the variation in manual plucking with the helper tool as described above. The temporal progression of the curves only diverges by a very small amount, which cannot be interpreted systematically. The analysis of frequency-dependent rate of decay with the aid of spectrograms also revealed no systematic differences and is, therefore, not described in detail here. This means that no strong differences due to the different soundboard damping were measurable here either. It is, therefore, reasonable to assume that the damping in the final instrument is dominated by parameters other than soundboard damping.
4. Listening Test
4.1. Stimuli
The guitars were played by a professional, academically trained guitarist in the anechoic chamber to generate the stimuli for the listening test. It was the same guitarist as in a previous study [
8] and the same strumming sequence was played.
Figure 4 shows the corresponding sheet music. Further details on the selection of the sequence can be found in a previous study [
8]. The sequence was recorded with a free field equalized ultra-low-noise measurement microphone (G.R.A.S. 40HF) using a professional data acquisition system (HEAD acoustics labCOMPACT24, ArtemiS SUITE). The microphone was placed in front of the center of the sound hole at an approximately 1.6 m distance. The sequence was recorded twice for each guitar.
Figure 5 shows the recording setup.
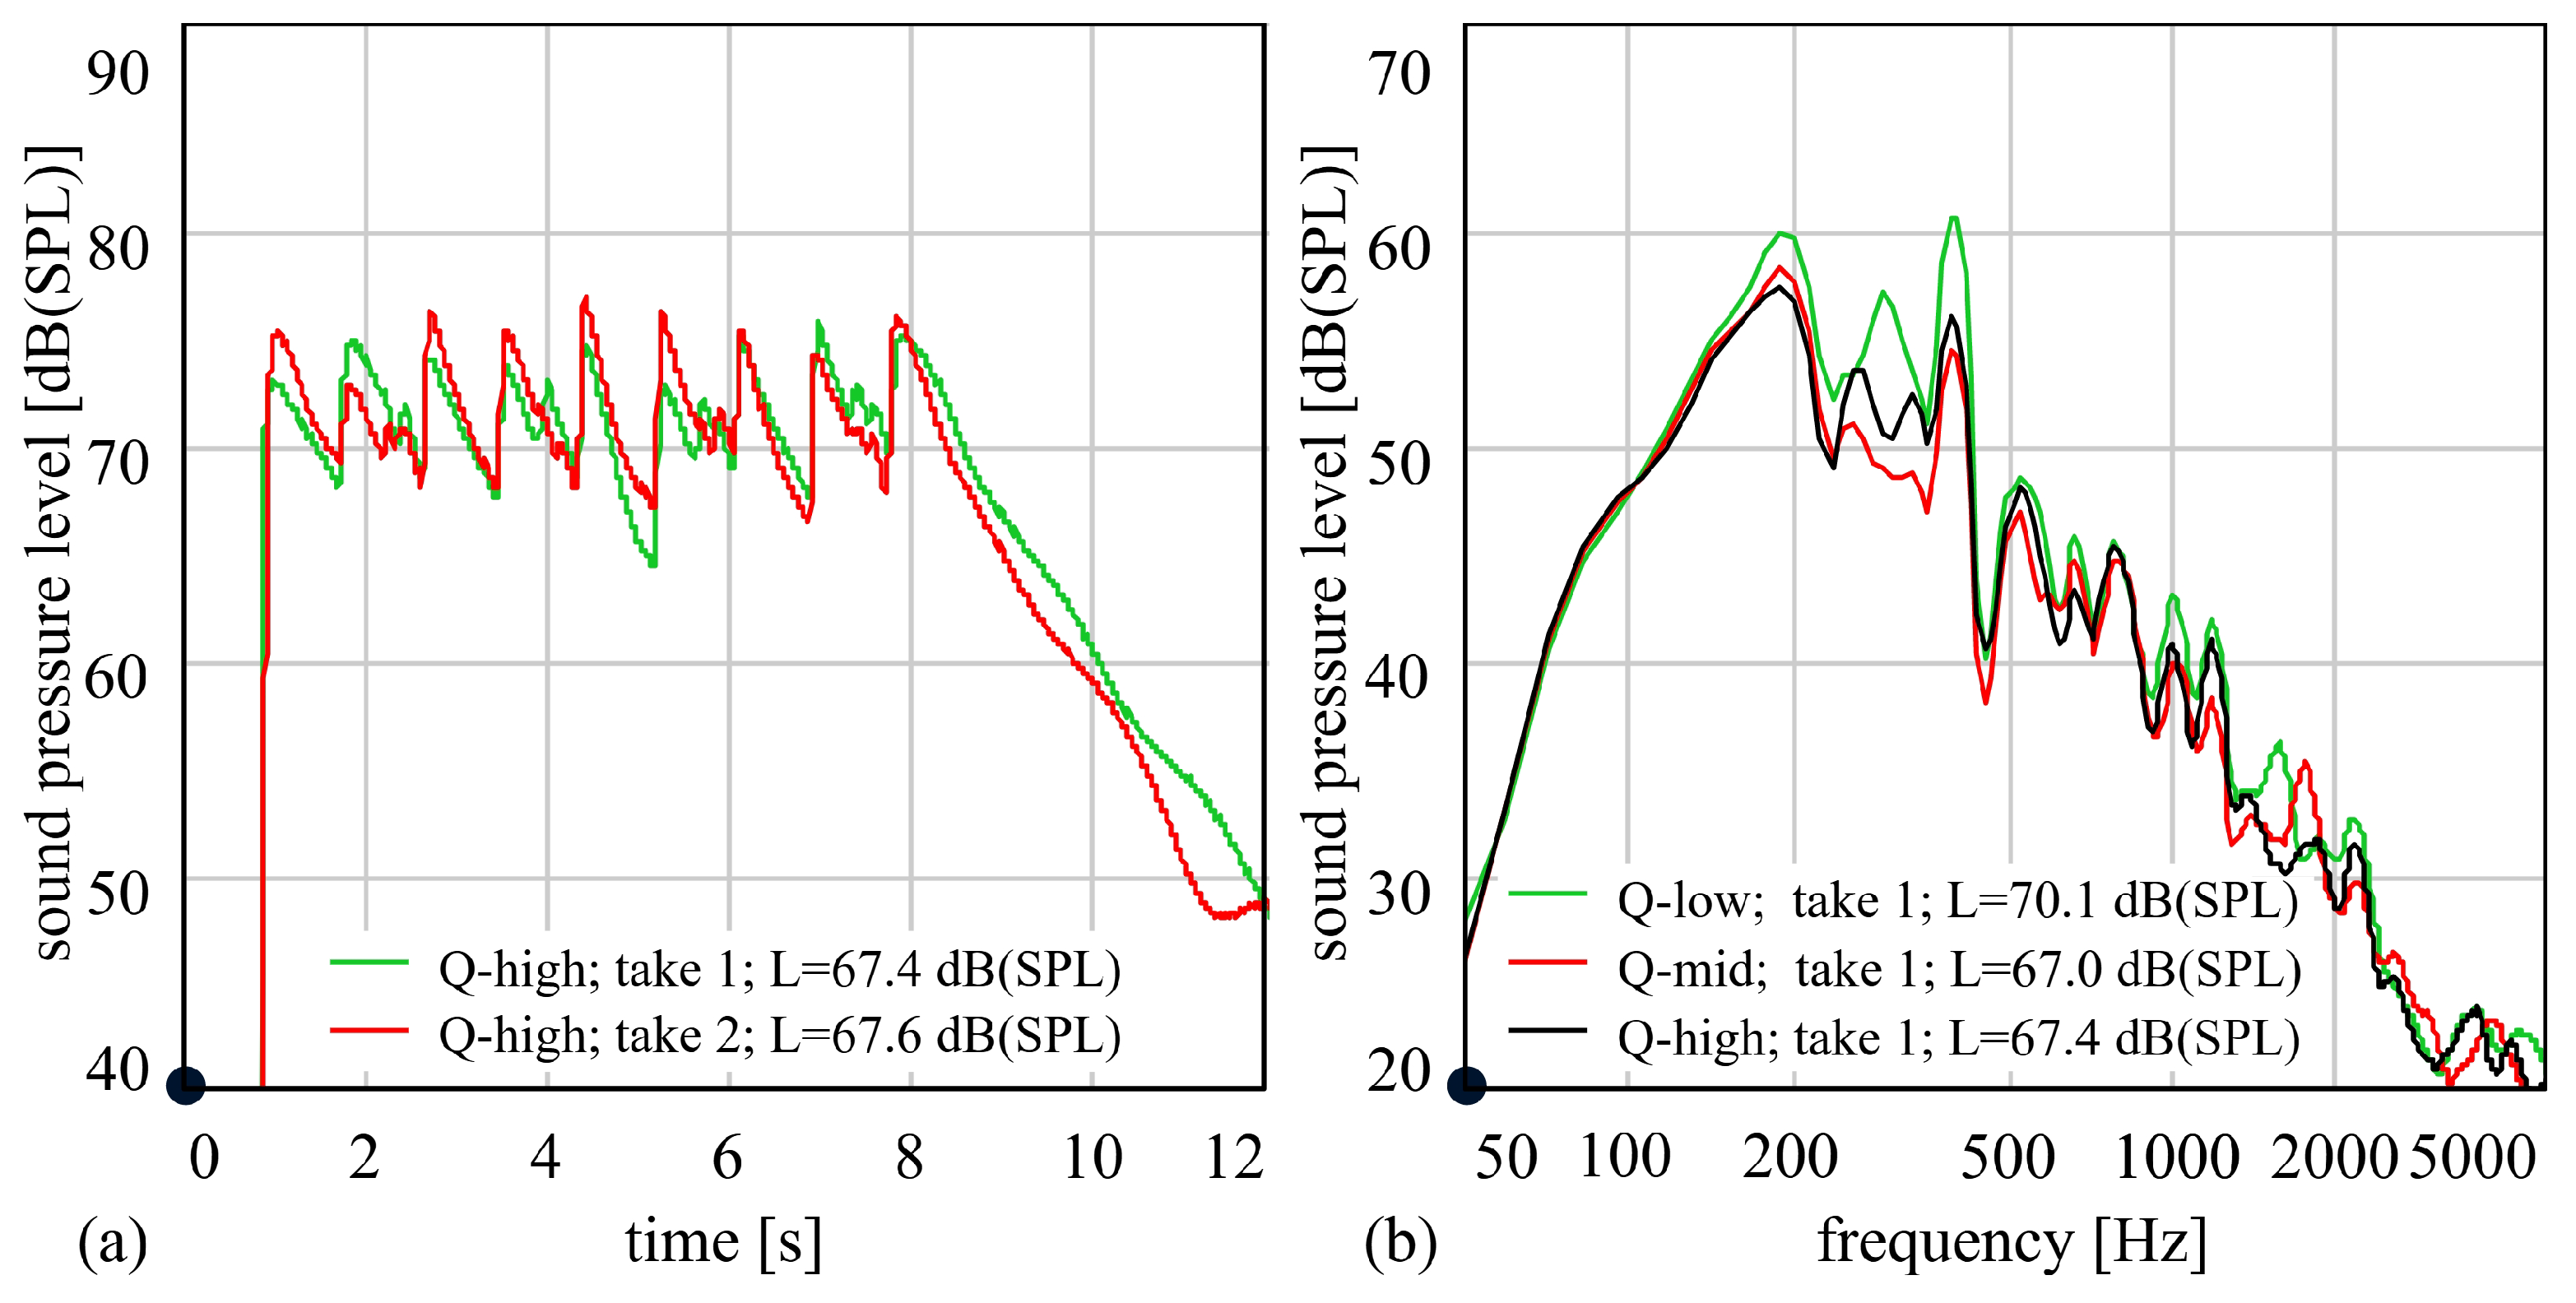
Figure 6a shows the progression of sound pressure level over time during the two recorded sequences exemplary for guitar Q-high. There is good agreement between the two recordings of the strumming sequence and there are only slight level deviations in individual strikes. The deviation in the overall level was only 0.2 dB for guitar Q-high. The overall level deviation between the two recordings for guitars Q-low and Q-mid was 0.1 dB and 0.7 dB.
Figure 6b shows the average FFT spectrum of one recorded sequence for each guitar.
4.2. Setup
The listening test setup was designed similar to a previous study [
8] and should emulate a scenario in which the participant is listening to a sequence being played on a real instrument. For this purpose, the recorded sequence was reproduced in a studio room via a single loudspeaker (Genelec 8250A). The loudspeaker was positioned horizontally with its tweeter oriented to the right from the participant’s perspective and its center adjusted to about 0.75 m height, approximating a sitting player. The participant was positioned in front of the loudspeaker in about 1.6 m distance. The reproduction level was adjusted so that the sound pressure level in the participant’s position was identical with the level of the sequence played in the anechoic chamber. The reproduction of the recorded sequence and the acquisition of the participant’s rating were realized with a PC. The loudspeaker was controlled via a sound card (RME Fireface UFX+). The loudspeaker, sound card and PC were covered with acoustically transparent fabric. Underneath the loudspeaker was a computer display that showed a graphical user interface.
Figure 7 shows the listening test setup.
4.3. Method
In the first part of the listening test, preference was evaluated. A paired comparison method adapted from [
12] was used for this purpose. This method was designed similar to a previous study [
8] and realized with an adapted version of the webMUSHRA framework [
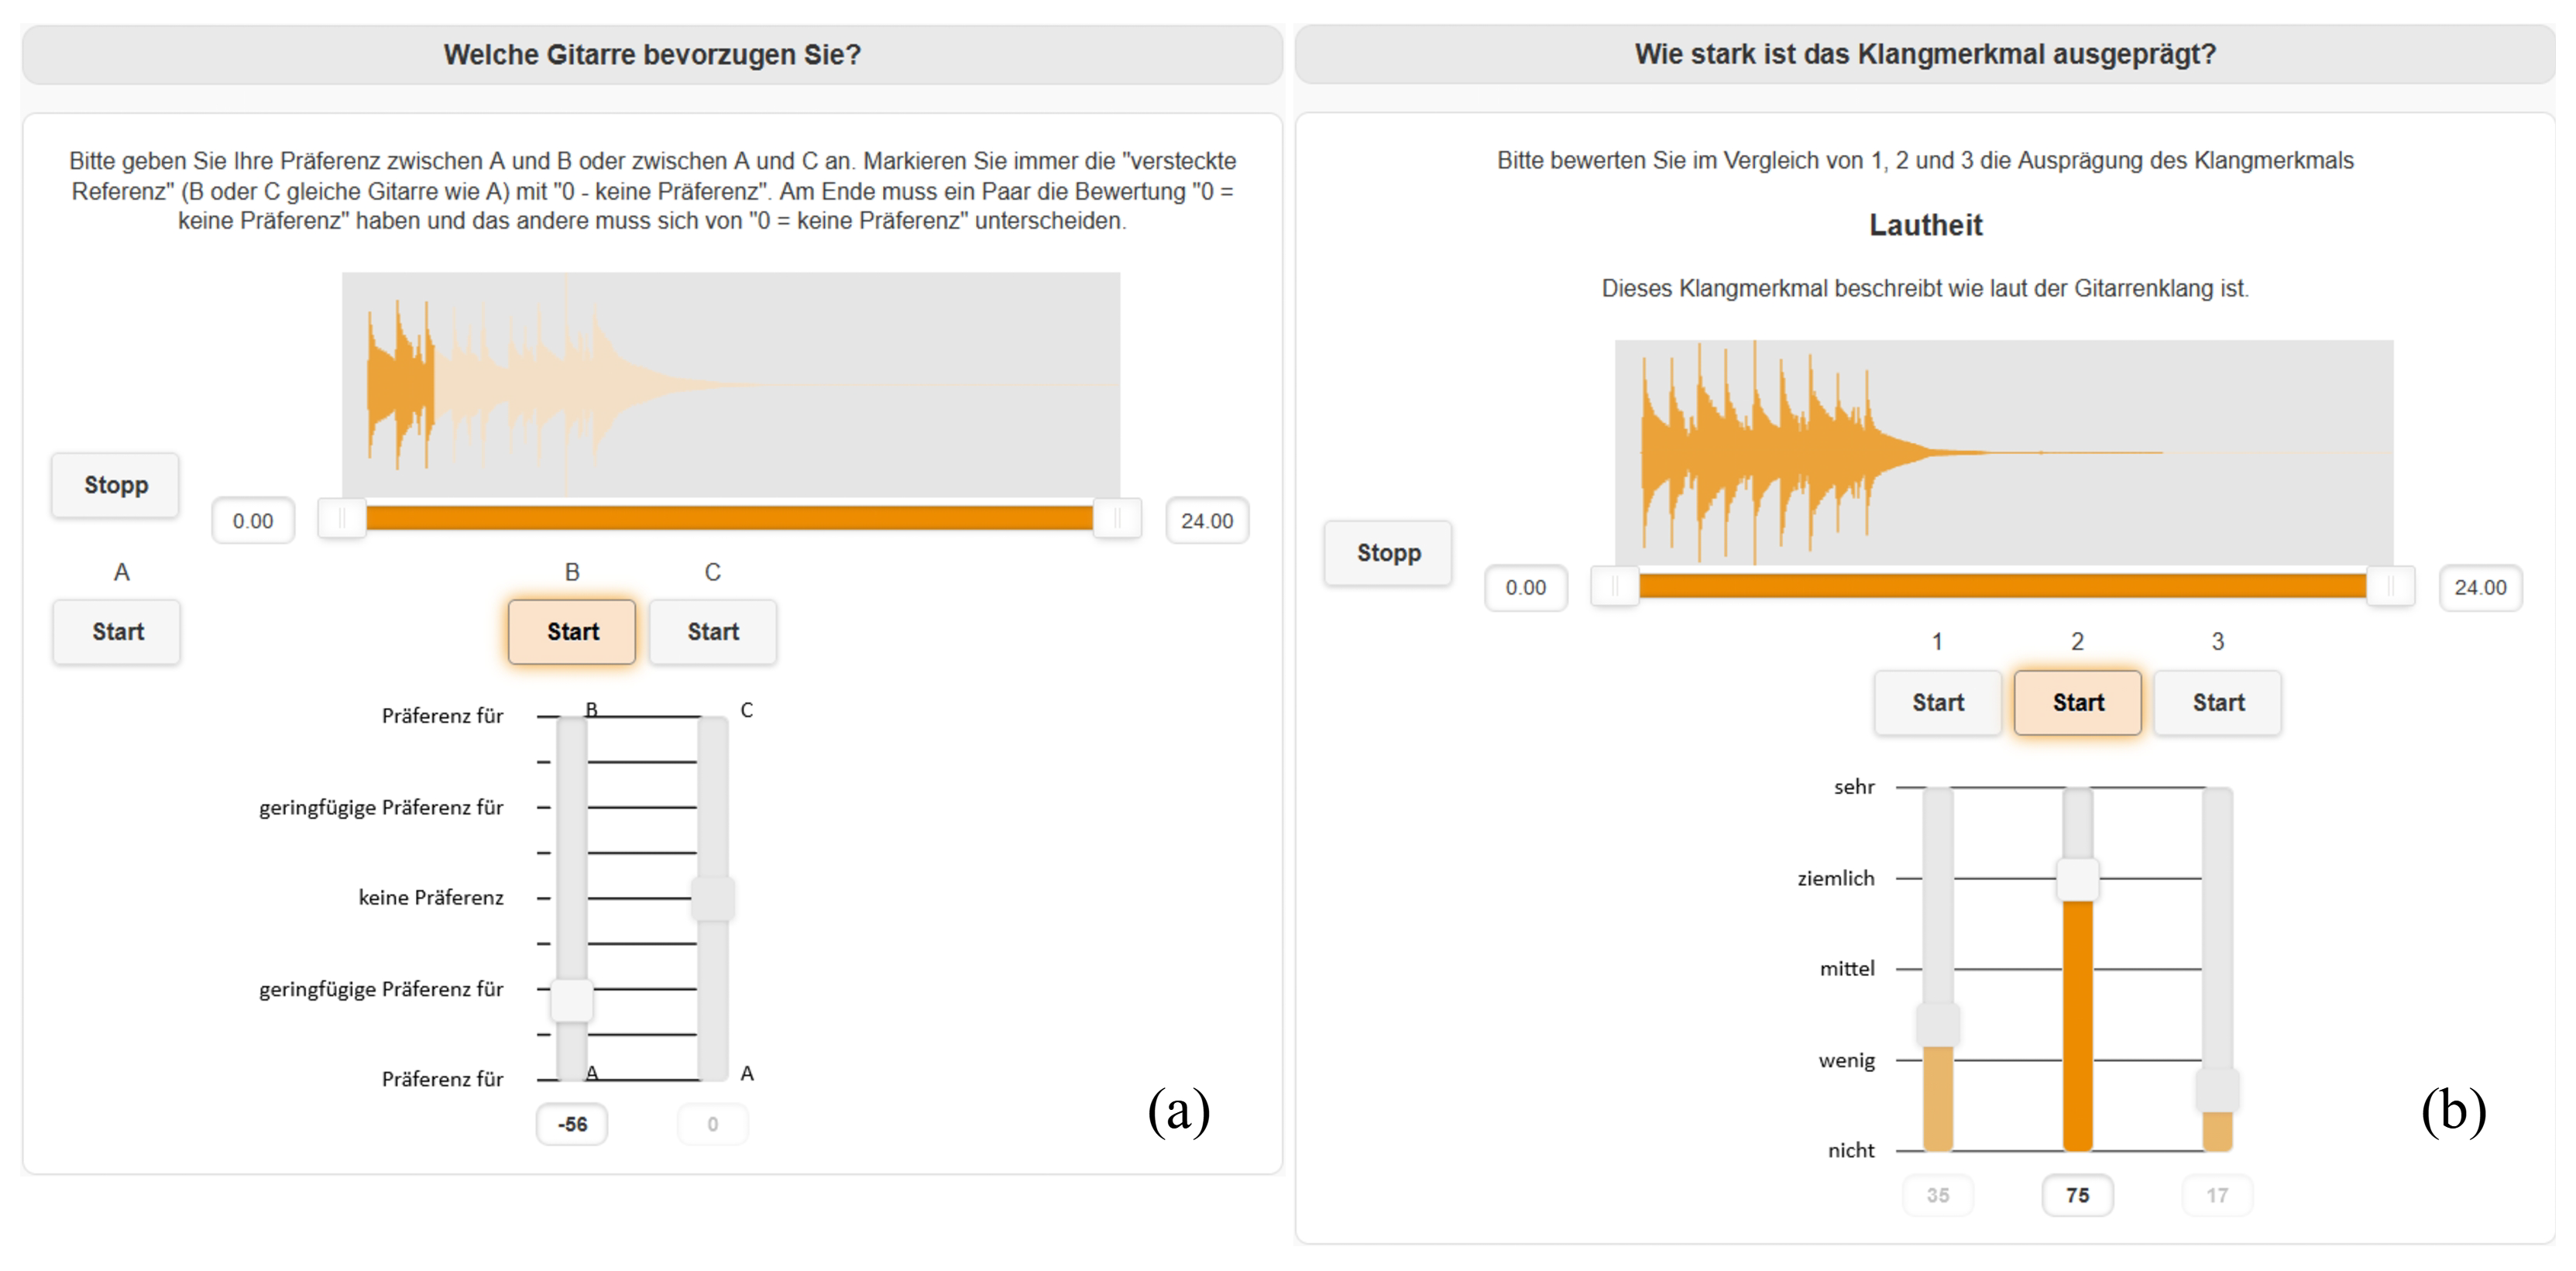
17]. In each trial, three recordings of the sequence were presented (A, B and C). Recording A was always the reference, against which both recordings B and C were to be compared. Recording A was made with the first guitar to be compared. Either recording B or C was made with this guitar as well. This recording was the so-called hidden reference. The other recording was made with the second guitar to be compared. The roles of recordings B and C were randomized between trials. The hidden reference was never the exact same recording as the reference—it was the second of the two recordings made with the corresponding guitar. For each trial, the participants were first asked to identify the hidden reference and afterwards to rate which of the remaining guitars they preferred and to what extent. The rating was performed using a slider with a scale from −100 (“
prefer A”) to 100 (“
prefer B” or “
prefer C”, respectively).
Figure 8a shows the corresponding graphical user interface. The participants could listen to the recordings as often as desired and freely switch between them at any time, even during playback. The playback was looped. The participants could adjust the start and end markers of the playback loop as preferred to focus on specific aspects of the guitar sound. With three guitars, three possible pairs of guitars resulted that were to be compared. The pairs were organized so that each guitar was once used as the reference and, therefore, also as the hidden reference.
Table 2 summarizes the organization of the pairs. In order to evaluate the intra-participant accuracy, each pair was compared twice. Thus, a set of six trials resulted for the preference evaluation. These trials were presented to the participants in random order.
In the second part of the listening test, specific sound attributes were evaluated. This evaluation was realized with the same framework as in the first part.
Table 3 shows the sound attributes selected for evaluation along with their definitions, which were provided to the participants in written form. The attributes were adapted from [
13] and comprise loudness and both spectral and temporal aspects. They were selected to provide a differentiated insight in potential sonic differences between the guitars and thus to supplement the evaluation of preference, which is prone to comprise multiple evaluation dimensions.
In each trial, three recordings of the sequence were presented (1, 2 and 3), corresponding to guitars Q-low, Q-mid and Q-high. The underlying order of the guitars was randomized between each trial. For each trial, the participants were asked to rate how much a specific sound attribute was pronounced in the guitar sound. The rating was performed using a slider with a scale from 0 (“
not”) to 100 (“
very”).
Figure 8b shows the corresponding graphical user interface. The participants could listen to the recordings as often as desired and freely switch between them at any time, even during playback. The playback was looped. The participants could adjust the start and end markers of the playback loop as preferred to focus on specific aspects of the guitar sound. The order in which the sound attributes were evaluated was randomized between participants.
At the beginning of both parts of the listening test, the participants completed a training session to familiarize themselves with the task. After the listening test, the participants had the option to comment on the sonic differences between the guitars in written form.
5. Playing Test
5.1. Setup
The playing test was conducted after the listening test in the same studio room. During the preceding listening test, the guitars were already located on a table behind the participants and were covered with an opaque fabric.
5.2. Method
In the first part of the playing test, preference was evaluated using a scale from 0 (“
no preference”) to 100 (“
preference”). In the second part, the same sound attributes as in the listening test were evaluated (cf.
Table 3) using a scale from 0 (“
not”) to 100 (“
very”). At the beginning of the playing test, the participants played all guitars to familiarize themselves with the instruments. The investigator handed the guitars to the participants. Furthermore, the participants were verbally briefed with the rating scales. The participants could choose whether they played sitting or standing. Most of the participants chose to play sitting. After familiarization, preference and each sound attribute were rated one after another for all guitars at once. The participants could select arbitrary sequences, play the guitars as long as they wanted and change between guitars as they wished. The rating was made verbally by the participants and transferred to a graphical user interface by the investigator. The order in which the guitars were initially played was Q-low, Q-mid and Q-high, and this was identical for all participants. The order in which the sound attributes were rated corresponded to the listing in
Table 3. After the playing test, the participants had the option to comment on the differences between the guitars in written form.
6. Participants
Twenty-one participants took part in the study (four female, seventeen male). They were between 17 and 63 years old (mean: 38.8 years). Eleven participants were luthiers or professional, academically trained guitarists. The remaining participants were passionate amateur guitarists with several years of playing experience. The duration for completing the listening test and the playing test was about 1.6 hours, including small breaks. Twenty participants used the option to give comments after the listening test. All participants used the option to give comments after the playing test.
7. Results
Data analysis and plotting presented in this paper was mainly conducted with the software tools Python 3.11.2 and Jamovi 2.3.21.
7.1. Listening Test
For each of the 21 participants, 6 ratings resulted from the preference evaluation (three pairs of guitars × two runs) and 21 ratings resulted from the sound attribute evaluation (seven attributes × three guitars). An analysis of the correct detection rate of the paired comparison data revealed that the majority of participants detected the hidden reference correctly (average: 16.7 of 21 participants). The correct detection rate was highest for the pair [Q-low, Q-mid] with up to 20 participants (depending on the run) and lowest for the pair [Q-mid, Q-high] with as few as 12 participants (depending on the run). To analyze the intra-participant accuracy during the paired comparison, the difference in the ratings between repeated pairs was evaluated. The median of these differences over all participants was similar for all three pairs of guitars (25 to 26 scale points). The corresponding interquartile range was lowest for the pair [Q-high, Q-low] with 56 points and highest for the pair [Q-mid, Q-high] with 71 points.
Separate reliability analyses were conducted for the paired comparison data and the sound attribute data. There was poor agreement between the participants’ paired comparison ratings (Cronbachs’ ). This might, however, not be problematic. Preference is prone to comprise multiple evaluation dimensions including individual expectation or taste. Therefore, the individual criteria of preference might vary between raters to some extent. Between the participants’ ratings of the sound attributes, whose individual criteria might be more similar between raters, there was good agreement (Cronbachs’ ).
The preference rating of each guitar was calculated individually for each participant based on their paired comparison ratings, similar to a previous study [
8]. First, the paired comparison rating for the pairs that were not rated in the listening test (cf.
Table 2 “o”) was completed using symmetry relations to the corresponding pairs that were rated (cf.
Table 2 “x”). The rating of pair [Q-low, Q-high], for example, corresponds to −1 times the rating of pair [Q-high, Q-low]. Afterwards the preference rating of each guitar was calculated using the arithmetic mean of the ratings of the corresponding row in the paired comparison matrix (cf.
Table 2). According to the scale used in the paired comparison (cf.
Figure 8), the result was then multiplied by −1 so that a positive preference rating means higher preference. The preference rating of guitar Q-low, for example, corresponds to −1 times the arithmetic mean of the ratings of pairs [Q-low, Q-mid] and [Q-low, Q-high]. The final preference rating was calculated using the arithmetic mean of the corresponding preference ratings of each run.
The data were further explored with a repeated-measures analysis of variance (ANOVA). A Shapiro–Wilk test [
18] and explorative analyses were conducted beforehand to check the corresponding prerequisites. In all three conditions, the participants’ preference ratings had a normal distribution. In twenty of the twenty-one conditions, the participants’ attribute ratings had a normal distribution. The violation of the normal distribution occurred due to skewness against which the ANOVA is robust [
19]. Therefore, the prerequisites for conducting an ANOVA were considered to be fulfilled.
Figure 9a shows the mean preference score for the three guitars. The score for all guitars was in quite a similar range. The ANOVA of the preference data revealed no significant effect of the factor guitar on the preference ratings.
Figure 9b shows the mean attribute score for the three guitars. For most of the attributes, the scores for all guitars were in a quite similar range. For some attributes, however, the mean score for guitar Q-low tended to be different. It had a higher loudness score and mid portion score and a lower balance score than guitars Q-mid and Q-high. The ANOVA revealed a significant
interaction effect between the factors attribute and guitar on the attribute ratings. The attribute score, therefore, significantly differed between guitars. It can be suspected from
Figure 9 that this interaction effect was mainly driven by the differing scores for guitar Q-low. The participants’ voluntary comments frequently addressed loudness, mid portion and balance as differentiating factors between the guitars. Often, one guitar was differentiated from the two others.
7.2. Playing Test
For each of the 21 participants, 3 ratings resulted from the preference evaluation (three guitars) and 21 ratings resulted from the sound attribute evaluation (seven attributes × three guitars). Separate reliability analyses were conducted for the preference data and the sound attribute data. There was higher agreement between the participants’ preference ratings (Cronbachs’ ) than in the listening test and good agreement between the participants’ sound attribute ratings (Cronbachs’ ).
The data were further explored with an ANOVA. A Shapiro–Wilk test [
18] and explorative analyses were conducted beforehand to check the corresponding prerequisites. In two of the three conditions, the participants’ preference ratings had a normal distribution. In sixteen of the twenty-one conditions, the participants’ sound attribute ratings had a normal distribution. The violations of the normal distribution occurred due to skewness or kurtosis, against which the ANOVA is robust [
19]. Therefore, the prerequisites for conducting an ANOVA were considered to be fulfilled.
Figure 10a shows the mean preference score for the three guitars. The score for all guitars was in quite a similar range. One might suspect that the score for guitar Q-low tended to be slightly higher. This trend, however, seems to have occurred by chance, since the ANOVA of the preference data revealed no significant effect of the factor guitar on the preference ratings.
Figure 10b shows the mean attribute score for the three guitars. For all of the attributes, the scores for all guitars were in a quite similar range. The slightly lower loudness score and richness in overtones score for guitar Q-mid do not represent a notable trend, since the ANOVA of the attribute data revealed no significant interaction effect between the factors attribute and guitar on the attribute ratings. The participants’ voluntary comments mainly addressed balance, playability or responsiveness as differentiating factors between the guitars. The extent of the differences between the guitars was often described as small. Furthermore, the participants’ voluntary comments contained no indication of differences regarding the haptic feedback of the guitars.
8. Discussion
The correct detection rate in the paired comparison of the listening test, which was lowest for pair [Q-mid, Q-high], suggests that participants had difficulties in differentiating guitars Q-mid and Q-high. This pair of guitars might thus have sounded more similar to each other than the remaining pairs. The interquartile range of the intra-subject accuracy in the paired comparison of the listening test, which was highest for pair [Q-mid, Q-high], supports this assumption. The poor agreement between the participants’ paired comparison ratings of the listening test suggests that the guitars might have sounded generally very similar. Therefore, there might have been no unique differentiating factors influencing preference. This might have caused the participants to focus on different nuances in the sound of the guitars when they derived their judgment. In the playing test, however, there was higher agreement between the participants’ preference ratings. The individuality provided by the playing test (for example, regarding interaction, piece, playing duration and so on (cf. [
11])) might have enabled the participants to reveal more unique differentiating factors in the sound of the guitars influencing preference. In both the listening test and the playing test, however, the mean preference score for all three guitars was in a quite similar range. The corresponding ANOVAs did not reveal any significant effect of the guitars with varying soundboard damping on the preference ratings. Therefore, hypothesis 1, which stated that varying soundboard damping influences preference, had to be rejected in the scope of the present study.
The sound attribute ratings of the listening test suggest that guitar Q-low sounded different from guitars Q-mid and Q-high. Most prominently, this guitar had a higher loudness score. Furthermore, it had a higher mid portion score and a lower balance score. The voluntary comments given after the listening test, which frequently addressed these attributes and often differentiated one guitar from the two others, support this assumption. The spectra of the recorded sequences shown in
Figure 6b support this assumption as well. The sound pressure level between 200 Hz and 500 Hz was higher for guitar Q-low than for guitars Q-mid and Q-high. This frequency range might have been assigned to the mid portion and strongly contributes to the overall level and, thus, to loudness. The sound attribute ratings of the playing test, however, suggest that the guitars did not sound different. For all of the attributes, the ratings for all guitars were in a quite similar range.
One reason for the diverging observations in the listening test and the playing test might be variations in playing. Guitar Q-low was the first guitar with which the sequence was recorded. The guitarist might have unintentionally varied the playing technique when recording with guitars Q-mid and Q-high afterwards. Another reason for the diverging observations in the listening test and the playing test might be the varying judgment position. The sequences for the listening test were recorded and judged in the listener’s position in front of the guitar. The judgments in the playing test, however, were made in the player’s position.
In the listening test, the corresponding ANOVA revealed that specific attribute scores significantly differed between guitars with varying soundboard damping. However, these differences might have occurred due to variations in playing during recording and might have been more pronounced in the listener’s direction than in the player’s direction. In the playing test, no significant differences were found. Therefore, hypothesis 2, which stated that varying soundboard damping influences sound attributes, could not be verified in the scope of the present study. In light of the discussion, however, the potential influence observed in the listening test seems of little practical relevance to the authors.
One could have suspected that the variations observed in the measurement potentially caused perceptual differences, even though they were small and did not occur systematically with varying sound board damping (for example, the slight differences between the transfer functions at higher frequencies (c. f.
Figure 2) or the very small amount of variation in the temporal progression of the decay curves (c. f.
Figure 3)). Since no differences occurred in preference and almost no differences occurred in the sound attributes, however, the variations observed in the measurement were likely to largely have been below the corresponding just noticeable differences.
One could argue that a potential influence of varying sound board damping on both preference and sound attributes is just smaller than being detectable with the number of participants given in the present study and, thus, a bigger participant pool would be necessary to verify hypotheses 1 and 2. Such potentially minor influence, however, still appears of little practical relevance to the authors.
It is obvious that the results of the present study, strictly speaking, only apply to the exact guitar type that was used. The authors are confident that the findings gained can be transferred to guitars with similar designs. However, using divergent guitar designs could lead to different results. This also applies to using a wider sound board damping range, which would, however, include values that are less likely to occur in practical guitar making and thus might be of little practical relevance.
9. Conclusions
This study investigated the relationship between soundboard damping and physical and perceptual aspects of the sound of a guitar. For this purpose, three steel-string guitars (Trevor Gore Guitars small bodied steel string) were built with considerable effort to keep them as similar as possible. The only intended difference was the damping of the Lutz spruce soundboards, varying between low, mid and high. For the physical evaluation, the transfer function and plucked tone decay of the final guitars were measured in an anechoic chamber. For the perceptual evaluation, a listening test and a playing test were conducted. The participants were asked to rate preference and sound attributes. Seven sound attributes were selected comprising loudness and both spectral and temporal aspects of the guitar sound. To prepare the listening test, a short sequence was recorded by a professional guitarist with each guitar in an anechoic chamber. The listening test was conducted in a studio room using a setup that should emulate a scenario in which the participant was listening to a sequence being played on a real instrument. The playing test was conducted in the same studio room.
The measurements did not show any systematic difference between the guitars depending on the soundboard damping. Statistical analysis of the preference ratings of both the listening test and the playing test did not reveal any significant difference either. Statistical analysis of the attribute ratings of the listening test revealed significant differences between the guitars. However, these differences might have occurred due to variations in playing during recording and might have been more pronounced in the listener’s direction than in the player’s direction. They might, therefore, be of little practical relevance. In the playing test, no significant differences were found between the guitars. Therefore, it can be concluded that varying soundboard damping seemed to have no practically relevant influence on the physical and perceptual aspects of the sound of the guitar used in the present study.
In future, the study should be repeated for other guitar designs. Classical guitars could be of particular interest because their overall design provides more constructional degrees of freedom in terms of soundboards. Also, other stringed instruments with simpler designs could be interesting—e.g., the Saz without bracing on the soundboard. Furthermore, other making parameters that potentially influence soundboard damping, such as finish [
20], could be integrated in the experimental design. Another option would be to consider a wider soundboard damping range, including values that are less likely to occur in practical guitar making but that might potentially cause perceptual differences in the guitar sound.
Author Contributions
Conceptualization, methodology, investigation, data curation, formal analysis, visualization and writing—original draft, T.W. and S.M.; funding acquisition and writing—review and editing, T.W., S.M. and M.E.A.; project administration, T.W. and M.E.A.; supervision, M.E.A. All authors have read and agreed to the published version of the manuscript.
Funding
This research was funded by the German Federal Ministry of Education and Research (BMBF) as part of a
WIR!-alliance (accessed on 26th February 2025) initiative of musical instrument craft business.
![Acoustics 07 00011 i001]()
Informed Consent Statement
Informed consent was obtained from all participants involved in the study.
Data Availability Statement
The raw data supporting the conclusions of this article will be made available by the authors on request.
Acknowledgments
The authors thank Trevor Gore Guitars (Cottage Point, NSW, AU) and Pacific Rim Tonewoods (Concrete, WA, USA) for making and providing the guitars used in this study. Thanks to David Olson and Trevor Gore for discussing the results and sharing their insights. The authors are grateful to Judith Beckedorf for the thorough recording session. Thanks to Margitta Lachmann for the great assistance in the acquisition of participants and in conducting the listening test and playing test. Furthermore, the authors would like to thank the participants for taking part in the listening test and playing test. Finally, the authors would like to thank the anonymous reviewers for their valuable comments.
Conflicts of Interest
The authors declare no conflicts of interest. The funders had no role in the design of the study; in the collection, analyses or interpretation of data; in the writing of the manuscript; or in the decision to publish the results.
Appendix A
Table A1.
Sound attributes and their definitions in the original language as used in the perceptual evaluation.
Table A1.
Sound attributes and their definitions in the original language as used in the perceptual evaluation.
| Sound Attribute | Definition |
|---|
| Lautheit | … beschreibt wie laut der Gitarrenklang ist. |
| Tiefenanteil | … beschreibt wie stark der tiefe Frequenzbereich im Gitarrenklang ausgeprägt ist. |
| Mittenanteil | … beschreibt wie stark der mittlere Frequenzbereich im Gitarrenklang ausgeprägt ist. |
| Höhenanteil | … beschreibt wie stark der hohe Frequenzbereich im Gitarrenklang ausgeprägt ist. |
| Ausgewogenheit | … beschreibt wie ausgewogen der tiefe, mittlere und hohe Frequenzbereich im Gitarrenklang sind. |
| Ausklingdauer | … beschreibt wie stark der Gitarrenklang nach dem Schlagen oder Zupfen ausklingt. |
| Obertonreichtum | … beschreibt wie stark die Anzahl und Amplituden der Obertöne ausgeprägt sind. |
References
- Ziegenhals, G. Resonanzholzmerkmale von Gitarrendecken. In Proceedings of the Seminar des Fachausschuss Musikalische Akustik in der DEGA, Zwota, Germany, 28–29 September 2001; pp. 20–23. [Google Scholar]
- Wegst, U.G. Wood for sound. Am. J. Bot. 2006, 93, 1439–1448. [Google Scholar] [CrossRef] [PubMed]
- Viala, R.; Placet, V.; Cogan, S. Simultaneous non-destructive identification of multiple elastic and damping properties of spruce tonewood to improve grading. J. Cult. Herit. 2020, 42, 108–116. [Google Scholar] [CrossRef]
- Quintavalla, M.; Gabrielli, F.; Canevari, C. Grading materials for stringed instruments soundboards: An approach considering the orthotropic elastic and damping properties. Appl. Acoust. 2022, 187, 108521. [Google Scholar] [CrossRef]
- Bourgeois, D. Tapping Tonewoods—How the Selection of Species Helps Define the Sound of Your Guitar. Acoust. Guitar. Mag. 19 April; 4.
- Stanciu, M.D.; Coșniță, M.; Gliga, G.V.; Gurau, L.; Timar, M.C.; Guiman, M.V.; Năstac, S.M.; Călin Roșca, I.; Bucur, V.; Dinulică, F. Tunable Acoustic Properties Using Different Coating Systems on Resonance Spruce Wood. Adv. Mater. Interfaces 2024, 11, 2300781. [Google Scholar] [CrossRef]
- Wright, H. The Acoustics and Psychoacoustics of the Guitar. Ph.D. Thesis, University of Wales, Cardiff, UK, 1996. [Google Scholar]
- Merchel, S.; Altinsoy, M.E.; Olson, D. Perceptual evaluation of bracewood and soundboard wood variations on the preference of a steel-string acoustic guitar. J. Acoust. Soc. Am. 2019, 146, 2608–2618. [Google Scholar] [CrossRef] [PubMed]
- Saitis, C.; Giordano, B.L.; Fritz, C.; Scavone, G.P. Perceptual evaluation of violins: A quantitative analysis of preference judgments by experienced players. J. Acoust. Soc. Am. 2012, 132, 4002–4012. [Google Scholar] [CrossRef] [PubMed]
- Ziegenhals, G. Subjektive und Objektive Beurteilung von Musikinstrumenten: Eine Untersuchung Anhand von Fallstudien; TUD Press: Dresden, Germany, 2010. [Google Scholar]
- Wühle, T.; Merchel, S.; Altinsoy, M.E. Beurteilung der Klangeigenschaften von Musikinstrumenten in Hörtest und Spieltest: Ein Vergleich am Beispiel Konzertgitarre. In Proceedings of the DAGA 2024—50th German Annual Conference on Acoustics, Hannover, Germany, 18–21 March 2024. [Google Scholar]
- ITU-R BS.1116-3; Methods for the Subjective Assessment of Small Impairments in Audio Systems. International Telecommunication Union: Geneva, Switzerland, 2015.
- Gore, T.; Gilet, G. Contemporary Acoustic Guitar Design and Build, 2nd ed.; Trevor Gore: Cottage Point, NSW, Australia, 2016; Volume 1. [Google Scholar]
- Bing System. Available online: https://ur-biowooeb.cirad.fr/en/publications-resources/products/bing-software (accessed on 19 December 2024).
- Brancheriau, L.; Kouchade, C.; Brémaud, I. Internal friction measurement of tropical species by various acoustic methods. J. Wood Sci. 2010, 56, 371–379. [Google Scholar] [CrossRef]
- Kraak, W.; Jahn, G.; Fasold, W. Ein neuer großer reflexionsfreier Raum für Schallwellen. Hochfrequenztech. Und Elektroakustik Jahrb. Der Drahtlosen Telegr. Und Teleph. 1960, 69, 1–7. [Google Scholar]
- Schoeffler, M.; Bartoschek, S.; Stöter, F.R.; Roess, M.; Westphal, S.; Edler, B.; Herre, J. webMUSHRA—A Comprehensive Framework for Web-based Listening Tests. J. Open Res. Softw. 2018, 6, 1–8. [Google Scholar] [CrossRef]
- Field, A. Discovering Statistics Using SPSS, 3rd ed.; Sage: Los Angeles, CA, USA; London, UK; New Delhi, India; Singapore; Washington, DC, USA, 2009. [Google Scholar]
- Bortz, J. Statistik für Human-und Sozialwissenschaftler, 6th ed.; Springer Medizin: Heidelberg, Germany, 2005. [Google Scholar] [CrossRef]
- Gore, T. Wood for Guitars. In Proceedings of the 161st Meeting of Acoustical Society of America, Seattle, WA, USA, 23–27 May 2011. [Google Scholar]
Figure 1.
(a) Configuration for measurements in the anechoic chamber. Marked is the microphone positioned 1.6 m in front of the guitar. (b) Excitation of the bridge using an impact hammer with a force sensor. (c) Manual plucking of single notes using a helper tool made of spring steel wrapped in an insulating hose.
Figure 2.
Transfer function of frontal microphone to force input at bridge for all three guitars.
Figure 2.
Transfer function of frontal microphone to force input at bridge for all three guitars.
Figure 3.
Level versus time plot for plucked tones averaged over the open string and the first 9 frets for all three guitars. Exemplary, the results for the low E string are shown. The decay of the guitars does not differ greatly. In the Q-high curve, a small noise can be seen at about 9.5 s, which is not part of the decay process.
Figure 4.
Sheet music with tabs for the strumming sequence: C, , , and C.
Figure 4.
Sheet music with tabs for the strumming sequence: C, , , and C.
Figure 5.
Recording setup for stimulus generation utilizing a measurement microphone (G.R.A.S. 40HF, marked with a white circle) and a professional data acquisition system (HEAD acoustics labCOMPACT24, ArtemiS SUITE) in the anechoic chamber. Note that only the marked microphone was used for stimulus generation in the present study.
Figure 6.
(a) Sound pressure level vs. time (fast temporal weighting) of the two recorded sequences for guitar Q-high. (b) Average FFT spectrum (4096 samples, 50% overlap, Hanning window, smoothing: 1/24 octave (using intensity averaging)) of one recorded sequence for each guitar. The legends show the overall level of the corresponding recording.
Figure 7.
Listening test setup.
Figure 7.
Listening test setup.
Figure 8.
Graphical user interface for the listening test. Based on an adapted version of the webMUSHRA framework [
17]. (
a) Preference evaluation. (
b) Sound attribute evaluation (example: loudness).
Figure 8.
Graphical user interface for the listening test. Based on an adapted version of the webMUSHRA framework [
17]. (
a) Preference evaluation. (
b) Sound attribute evaluation (example: loudness).
Figure 9.
Preference score (a) and attribute score (b) for the three guitars in the listening test. Mean values and 95% confidence intervals are shown.
Figure 9.
Preference score (a) and attribute score (b) for the three guitars in the listening test. Mean values and 95% confidence intervals are shown.
Figure 10.
Preference score (a) and attribute score (b) for the three guitars in the playing test. Mean values and 95% confidence intervals are shown.
Figure 10.
Preference score (a) and attribute score (b) for the three guitars in the playing test. Mean values and 95% confidence intervals are shown.
Table 1.
Label and damping of the wood for the soundboards of the guitars used in the present study (Trevor Gore Guitars small bodied steel string). As a common representation of damping, the Q-factor is given. A low Q-factor corresponds to high damping. Apart from the damping of the wood for the soundboard, the guitars were built to be as similar as possible.
| Guitar Label | Q-Factor of the Wood for the Soundboard |
|---|
| Q-low | 138.4 |
| Q-mid | 148.7 |
| Q-high | 158.9 |
Table 2.
Paired comparison matrix for the preference evaluation. Pairs marked with “x” were rated in the listening test. The rating for pairs marked with “o” should be completed after the listening test using symmetry relations to the rated pairs.
Table 2.
Paired comparison matrix for the preference evaluation. Pairs marked with “x” were rated in the listening test. The rating for pairs marked with “o” should be completed after the listening test using symmetry relations to the rated pairs.
| | Q-Low | Q-Mid | Q-High |
|---|
| Q-low 1 | - | x | o |
| Q-mid 1 | o | - | x |
| Q-high 1 | x | o | - |
Table 3.
Sound attributes and their definitions translated to English. (The perceptual evaluation was carried out in German. Attributes and definitions in the original language are given in the Appendix in
Table A1).
Table 3.
Sound attributes and their definitions translated to English. (The perceptual evaluation was carried out in German. Attributes and definitions in the original language are given in the Appendix in
Table A1).
| Sound Attribute | Definition |
|---|
| loudness | … describes how loud the guitar sound is. |
| bass portion | … describes how much the low frequency range is pronounced in the guitar sound. |
| mid portion | … describes how much the mid frequency range is pronounced in the guitar sound. |
| treble portion | … describes how much the high frequency range is pronounced in the guitar sound. |
| balance | … describes how balanced the low, mid and high frequency range are in the guitar sound. |
| decay duration | … describes how much the guitar sound decays after strumming or picking. |
| richness in overtones | … describes how much the number and amplitudes of the harmonics are pronounced. |
| Disclaimer/Publisher’s Note: The statements, opinions and data contained in all publications are solely those of the individual author(s) and contributor(s) and not of MDPI and/or the editor(s). MDPI and/or the editor(s) disclaim responsibility for any injury to people or property resulting from any ideas, methods, instructions or products referred to in the content. |
© 2025 by the authors. Licensee MDPI, Basel, Switzerland. This article is an open access article distributed under the terms and conditions of the Creative Commons Attribution (CC BY) license (https://creativecommons.org/licenses/by/4.0/).


