Article

Correlation between Seismic Waves Velocity Changes and the Occurrence of Moderate Earthquakes at the Bending of the Eastern Carpathians (Vrancea)

by
Anica-Otilia Placinta
1,*,
Felix Borleanu
1,
Iren-Adelina Moldovan
1 and
Alina Coman
1,2
1
National Institute for Earth Physics, Calugareni 12, 077125 Magurele, Ilfov, Romania
2
Faculty of Physics, University of Bucharest, 077125 Magurele, Ilfov, Romania
*
Author to whom correspondence should be addressed.
Acoustics 2022, 4(4), 934-947; https://doi.org/10.3390/acoustics4040057
Submission received: 29 September 2022 / Revised: 20 October 2022 / Accepted: 25 October 2022 / Published: 1 November 2022
(This article belongs to the Special Issue Vibration and Noise)

Abstract

:
Seismic velocity is the geophysical property that has a key role in characterizing dynamic processes and the state of the stress around the faults, providing valuable information regarding the change in the tectonic regime. The stress in the crust is an important indicator of the possible occurrence of a major earthquake, and the variation of seismic velocities, in time, can provide a clearer picture on the tectonic processes taking place in the region. In the crust, velocities change before, during, and after earthquakes through several mechanisms related to fault deformations, pore pressure, stress changes, and recovery processes. In this study, we investigate the possible correlation between the changes of seismic velocities (Vp/Vs) in time and the occurrence of moderate size crustal and intermediate depth earthquakes from the Vrancea region. Our findings show that there are no significant variations in Vp/Vs for the intermediate depth earthquakes, while crustal events have decreased seismic activity prior to the main earthquake and no high Vp/Vs anomalies. Our results indicate key aspects, and such analyses should be carried out in real-time to continuously explore any unusual pattern pointed out by the seismic velocity changes. Vp/Vs and their standard errors can also be used to describe seismic activity patterns that shape the tectonic evolution of the area.

1. Introduction

The tectonic units that control the seismic activity in Romania include alpine and pre-alpine formations. They come into contact along major crustal faults, generating earthquakes in the crust. Crustal seismicity consists of events with small and moderate magnitudes (Mw < 6.5), which nevertheless show a destructive potential, especially at the local level [1,2]. Crustal earthquakes are especially distributed along the Eastern and Southern Carpathians, in the North Dobrogean Orogen, the Moesian Platform, and the Pannonian Basin [1,3,4,5]. In contrast to the crustal seismicity dispersed mostly along the Carpathian Orogen (Figure 1), the seismic activity generated at the mantle level is distributed in a limited volume beneath the Vrancea region, located at the bend of the Eastern Carpathians, at the junction of at least three plates [6].
The mechanisms responsible for the generation of mantle earthquakes at the bending of the Eastern Carpathians are still intensely debated, with the most common being slab retreat and roll-back [7,8], delamination [9,10,11], slab-detachment [12], detachment and delamination of the lithospheric fragment [13,14], and gravitational instability [15,16]. Earthquakes generated at intermediate depths in the Vrancea region release the largest amount of energy, which implies the largest degree of deformation (3.5 × 10⁻⁷ year−1), with one to six earthquakes with Mw > 7.0 recorded every century [1].
Previous studies emphasized that the earthquake generation processes have a cyclic evolution [17], and the last strong intermediate depth earthquakes, according to the Romanian earthquake catalogue (ROMPLUS) [18], occurred in the Vrancea region in the previous century (10 November 1940, 4 March 1977, 31 August 1986, 30 May 1990). As a result, there is high probability that a high magnitude earthquake will occur in the Vrancea region in the near future.
To minimize human and economic losses caused by the large magnitude earthquakes, over time the scientific community has developed numerous methods to forecast such events, based either on scientific or, sometimes, empirical arguments [19,20,21,22,23,24,25]. These methods revealed different success rates, with the most notable being that for the 4 February 1975 earthquake in China [26].
In the previously mentioned context and, at the same time, taking advantage of the fact that the Romanian Seismic Network is in continuous expansion throughout the last decade (Figure 1), a significant amount of data is offered [27]. In this study, we aim to analyze the temporal variation of seismic velocities using the recordings of the stations installed in Vrancea and adjacent areas.
Seismic velocities play a key role in characterizing dynamic processes and the state of faults, offering additional information about changes in tectonic stress, being an important indicator of the possible occurrence of an earthquake, and also providing better insights into the evolution of tectonic processes [28,29,30,31,32,33,34].
In the crust, velocities change before, during, and after earthquakes through several mechanisms related to, for example, fault deformations, pore pressure, changes in stress state (e.g., pressure perturbation), and recovery processes [28,29,30]. Previous studies [31,32,33] emphasized precursor variations in seismic velocity, which seismologists perceive as a potential forecast approach [34].
Laboratory experiments [35] show that the velocities of both compression and shear waves decrease significantly before the occurrence of earthquakes with normal or reverse fault mechanisms, and no significant changes occur for earthquakes with a strike-slip mechanism. This explains the contradictory conclusions in the seismic velocity variations of earthquake forecast. For strike-slip earthquakes, the stress level is generally reduced, generating dilations or small or no velocity variations, while for the other types of earthquakes, the stress level is high, which produces large variations in seismic velocities [34]. However, none of the two major earthquakes present strike-slip faulting. A reverse fault plane solution was determined for the subcrustal earthquake [36], which is specific for intermediate depth Vrancea earthquakes [1,36] (For the earthquake that occurred at the limit of the crust–mantle discontinuity, the previous studies [36,37] indicated a normal fault mechanism). On the other hand, anisotropy could provide another possible explanation, with laboratory experiments [38] demonstrating that rock samples under tension show considerable anisotropy caused by dilatation.

2. Methodology Used for Monitoring the Variation of Seismic Velocities in Time

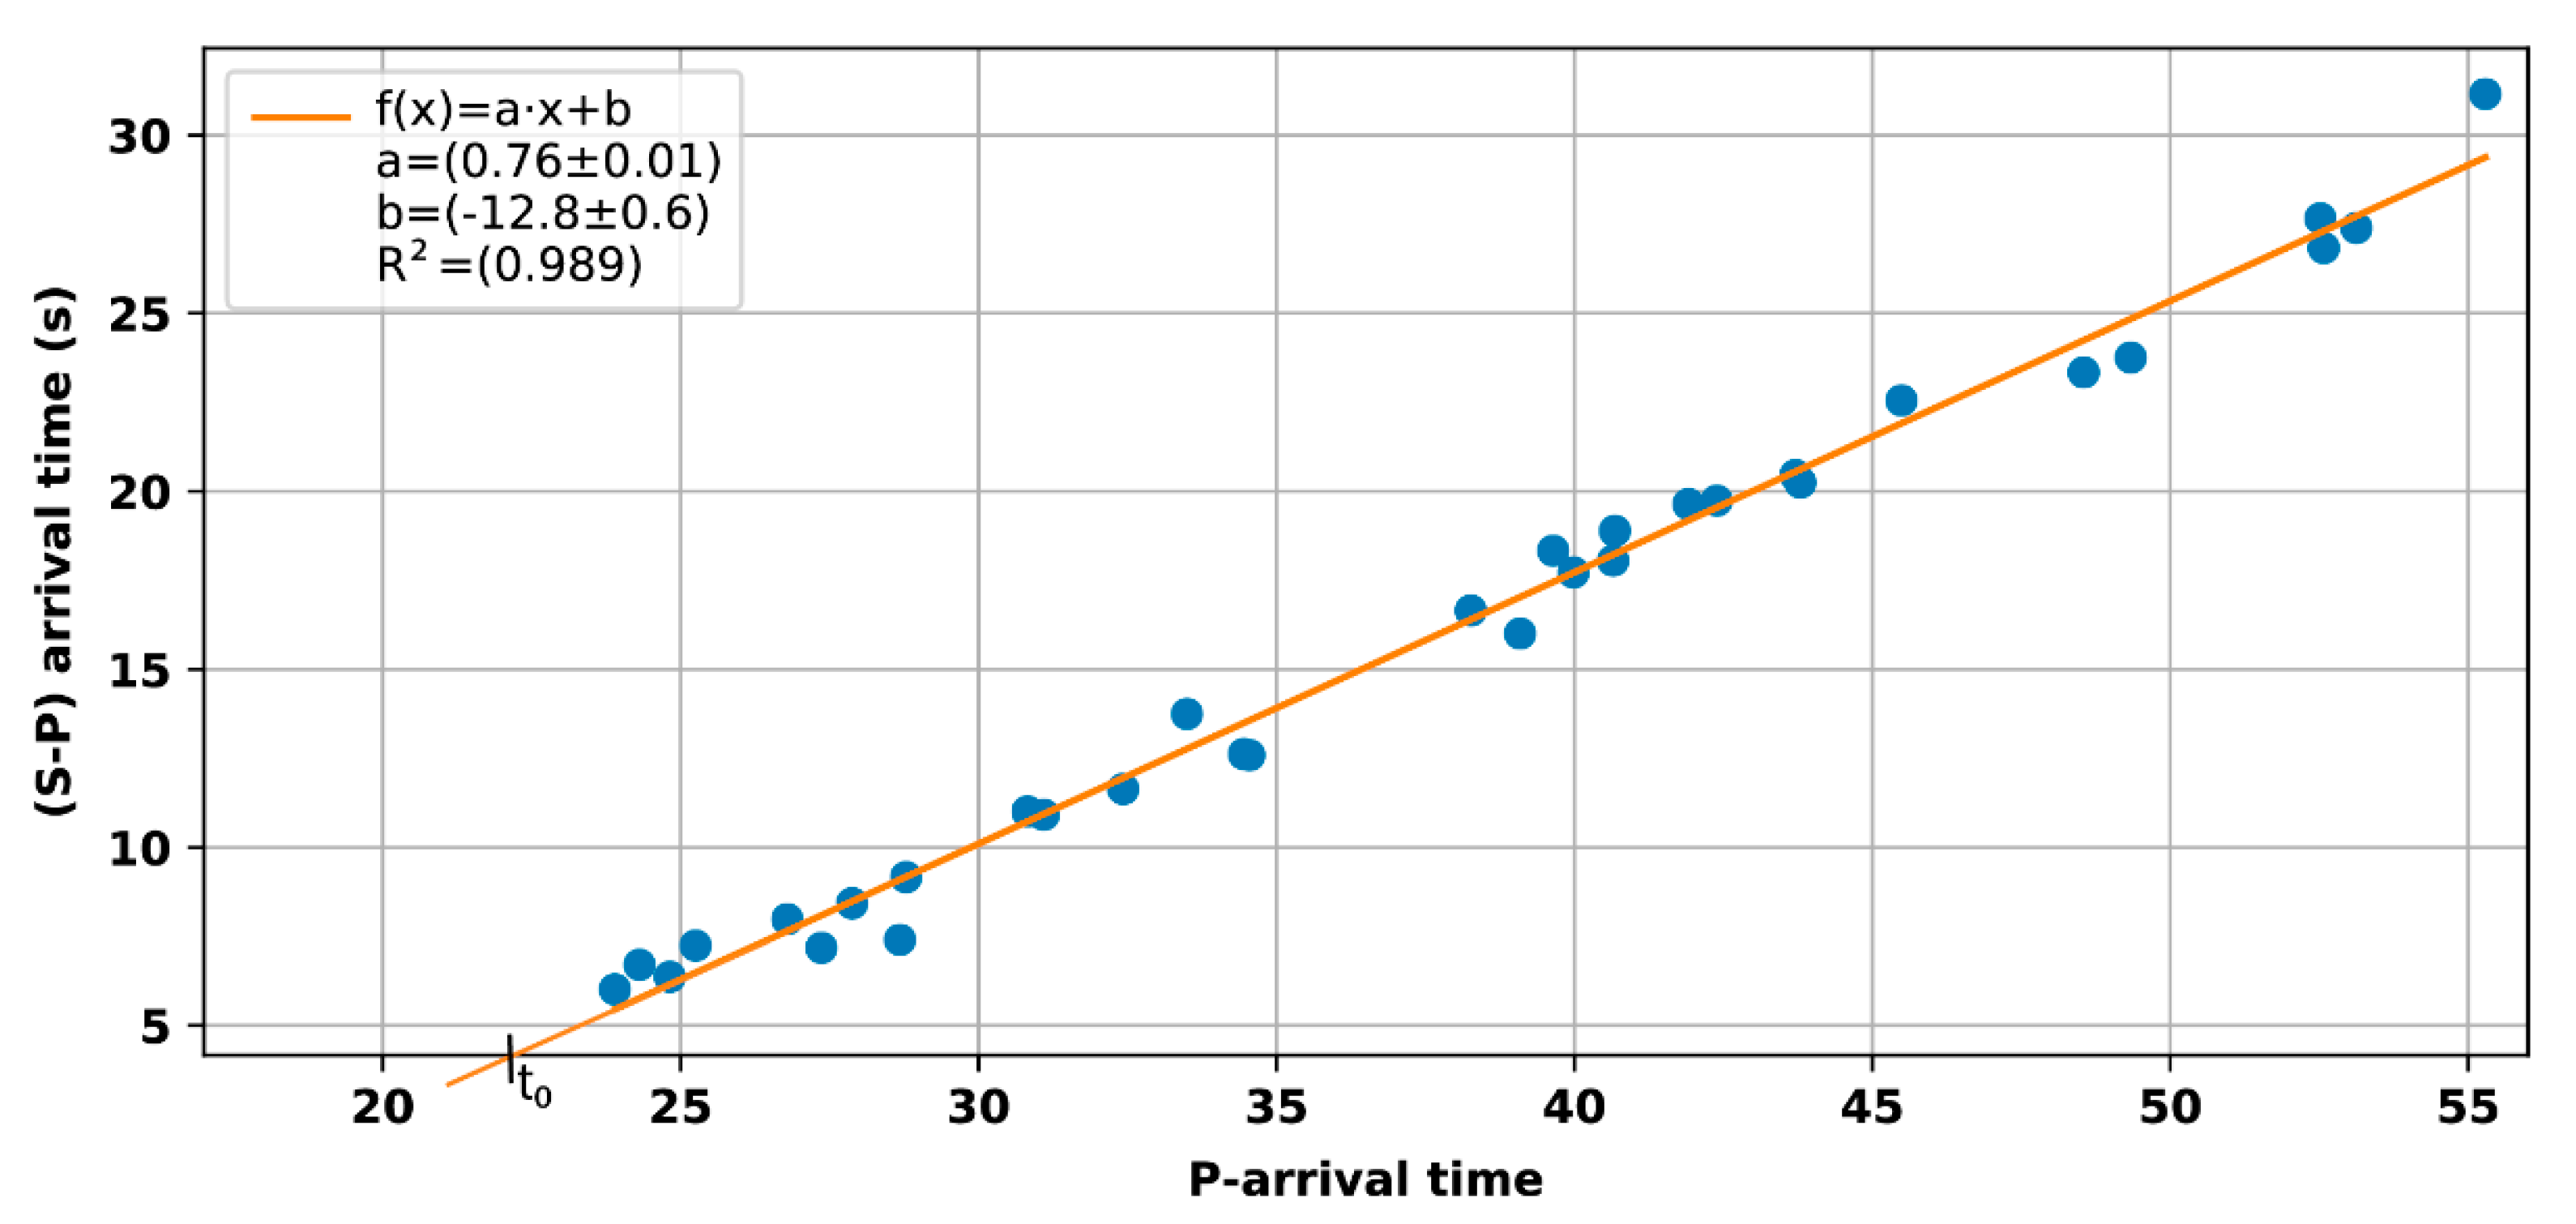
Previous studies [34] investigated either the time variation of the Vp/Vs ratio, determined using the Wadati diagram [39] method, or the temporal variations of the seismic velocities, determined from the cross-correlations of ambient noise [25]. In this study, the Wadati method was applied to monitor the time variation of seismic velocities. The Wadati diagram determined for a seismic event that consists of the representation (Figure 2) of the absolute arrival time of the primary wave (P) as a function of the difference in the arrival times (in seconds) of the secondary (S) and primary waves (P). The time at the origin is given by the point where the extension of the regression line of the selected determination intersects the abscissa, and the ratio Vp/Vs is determined from Equation (1):
Ts Tp Tp = Vp Vs 1
where Ts and Tp represent the arrival times of the P and S waves, respectively, and Vp and Vs represent the velocities for the same types of waves.
The previous studies performed in China [34] indicated a generally normal distribution of Vp/Vs ratios, with a mean value of 1.73 and a standard deviation standard of 0.05. They considered high Vp/Vs anomalies the values that were greater than the average Vp/Vs, including standard deviation, and small anomalies were the ones that were lower than the average, including standard deviations. We follow the same procedure as [34], computing an average Vp/Vs for both major earthquakes and classifying small anomalies as values less than the average, including standard deviations and high anomalies as values greater than the average plus standard deviations.

3. Analysis of the Temporal Variation of Vp/Vs Ratios for Two Moderate Earthquakes That Occurred at the Bending of the Southeastern Carpathians

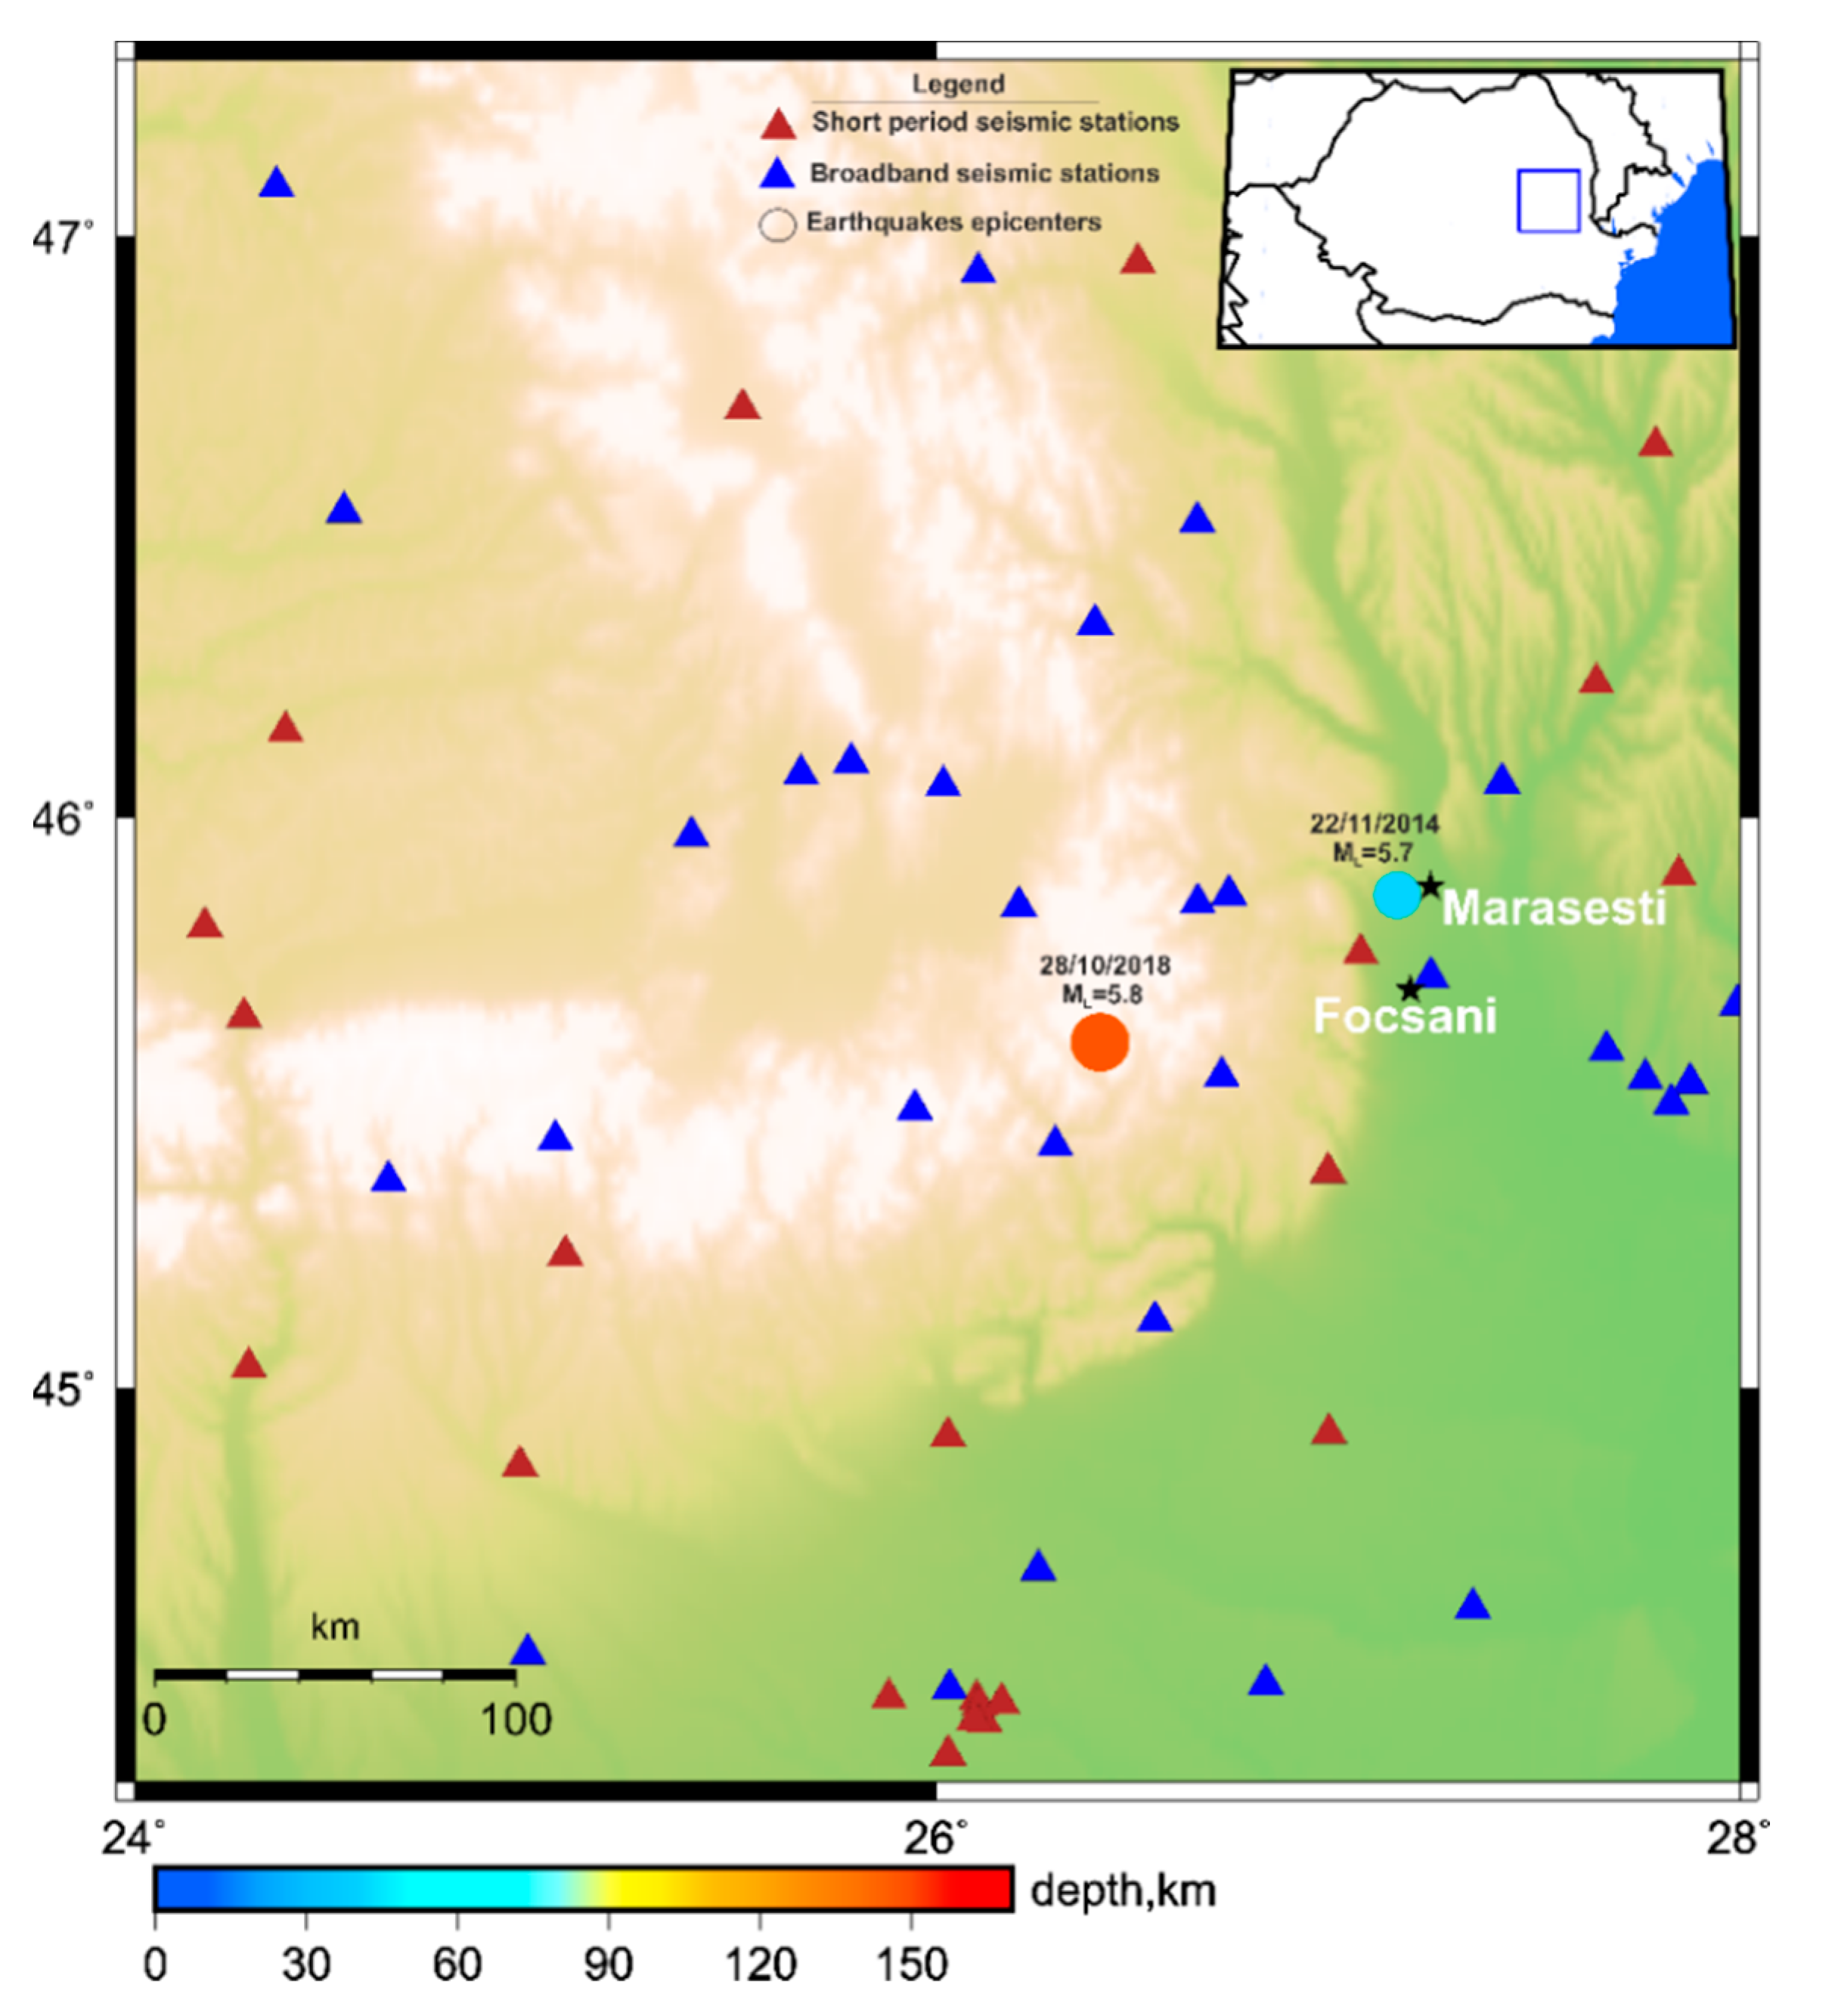
In the following sections, we investigate the temporal variation of Vp/Vs ratios, using the Wadati diagram approach, for two earthquakes: (i) the intermediate depth (H~147 km) earthquake produced in the Vrancea region on 28 October 2018 (00:38, GMT) with a local magnitude (ML) of 5.8, and (ii) the crustal earthquake generated at the northeastern edge of the Focsani Basin (50 km relative to Vrancea) on 22 November 2014 (19:14, GMT), at the limit of the crust–mantle discontinuity (H~40 km), ML = 5.7, according to the ROMPLUS catalogue [18,40]. Previous investigations performed in this area placed the Moho at a maximum depth of 47 km [41,42] The epicenters of both selected earthquakes and the seismic station distribution in the epicentral region are shown in Figure 3.

3.1. Temporal Variation of Vp/Vs Ratios Determined for the Subcrustal Earthquake

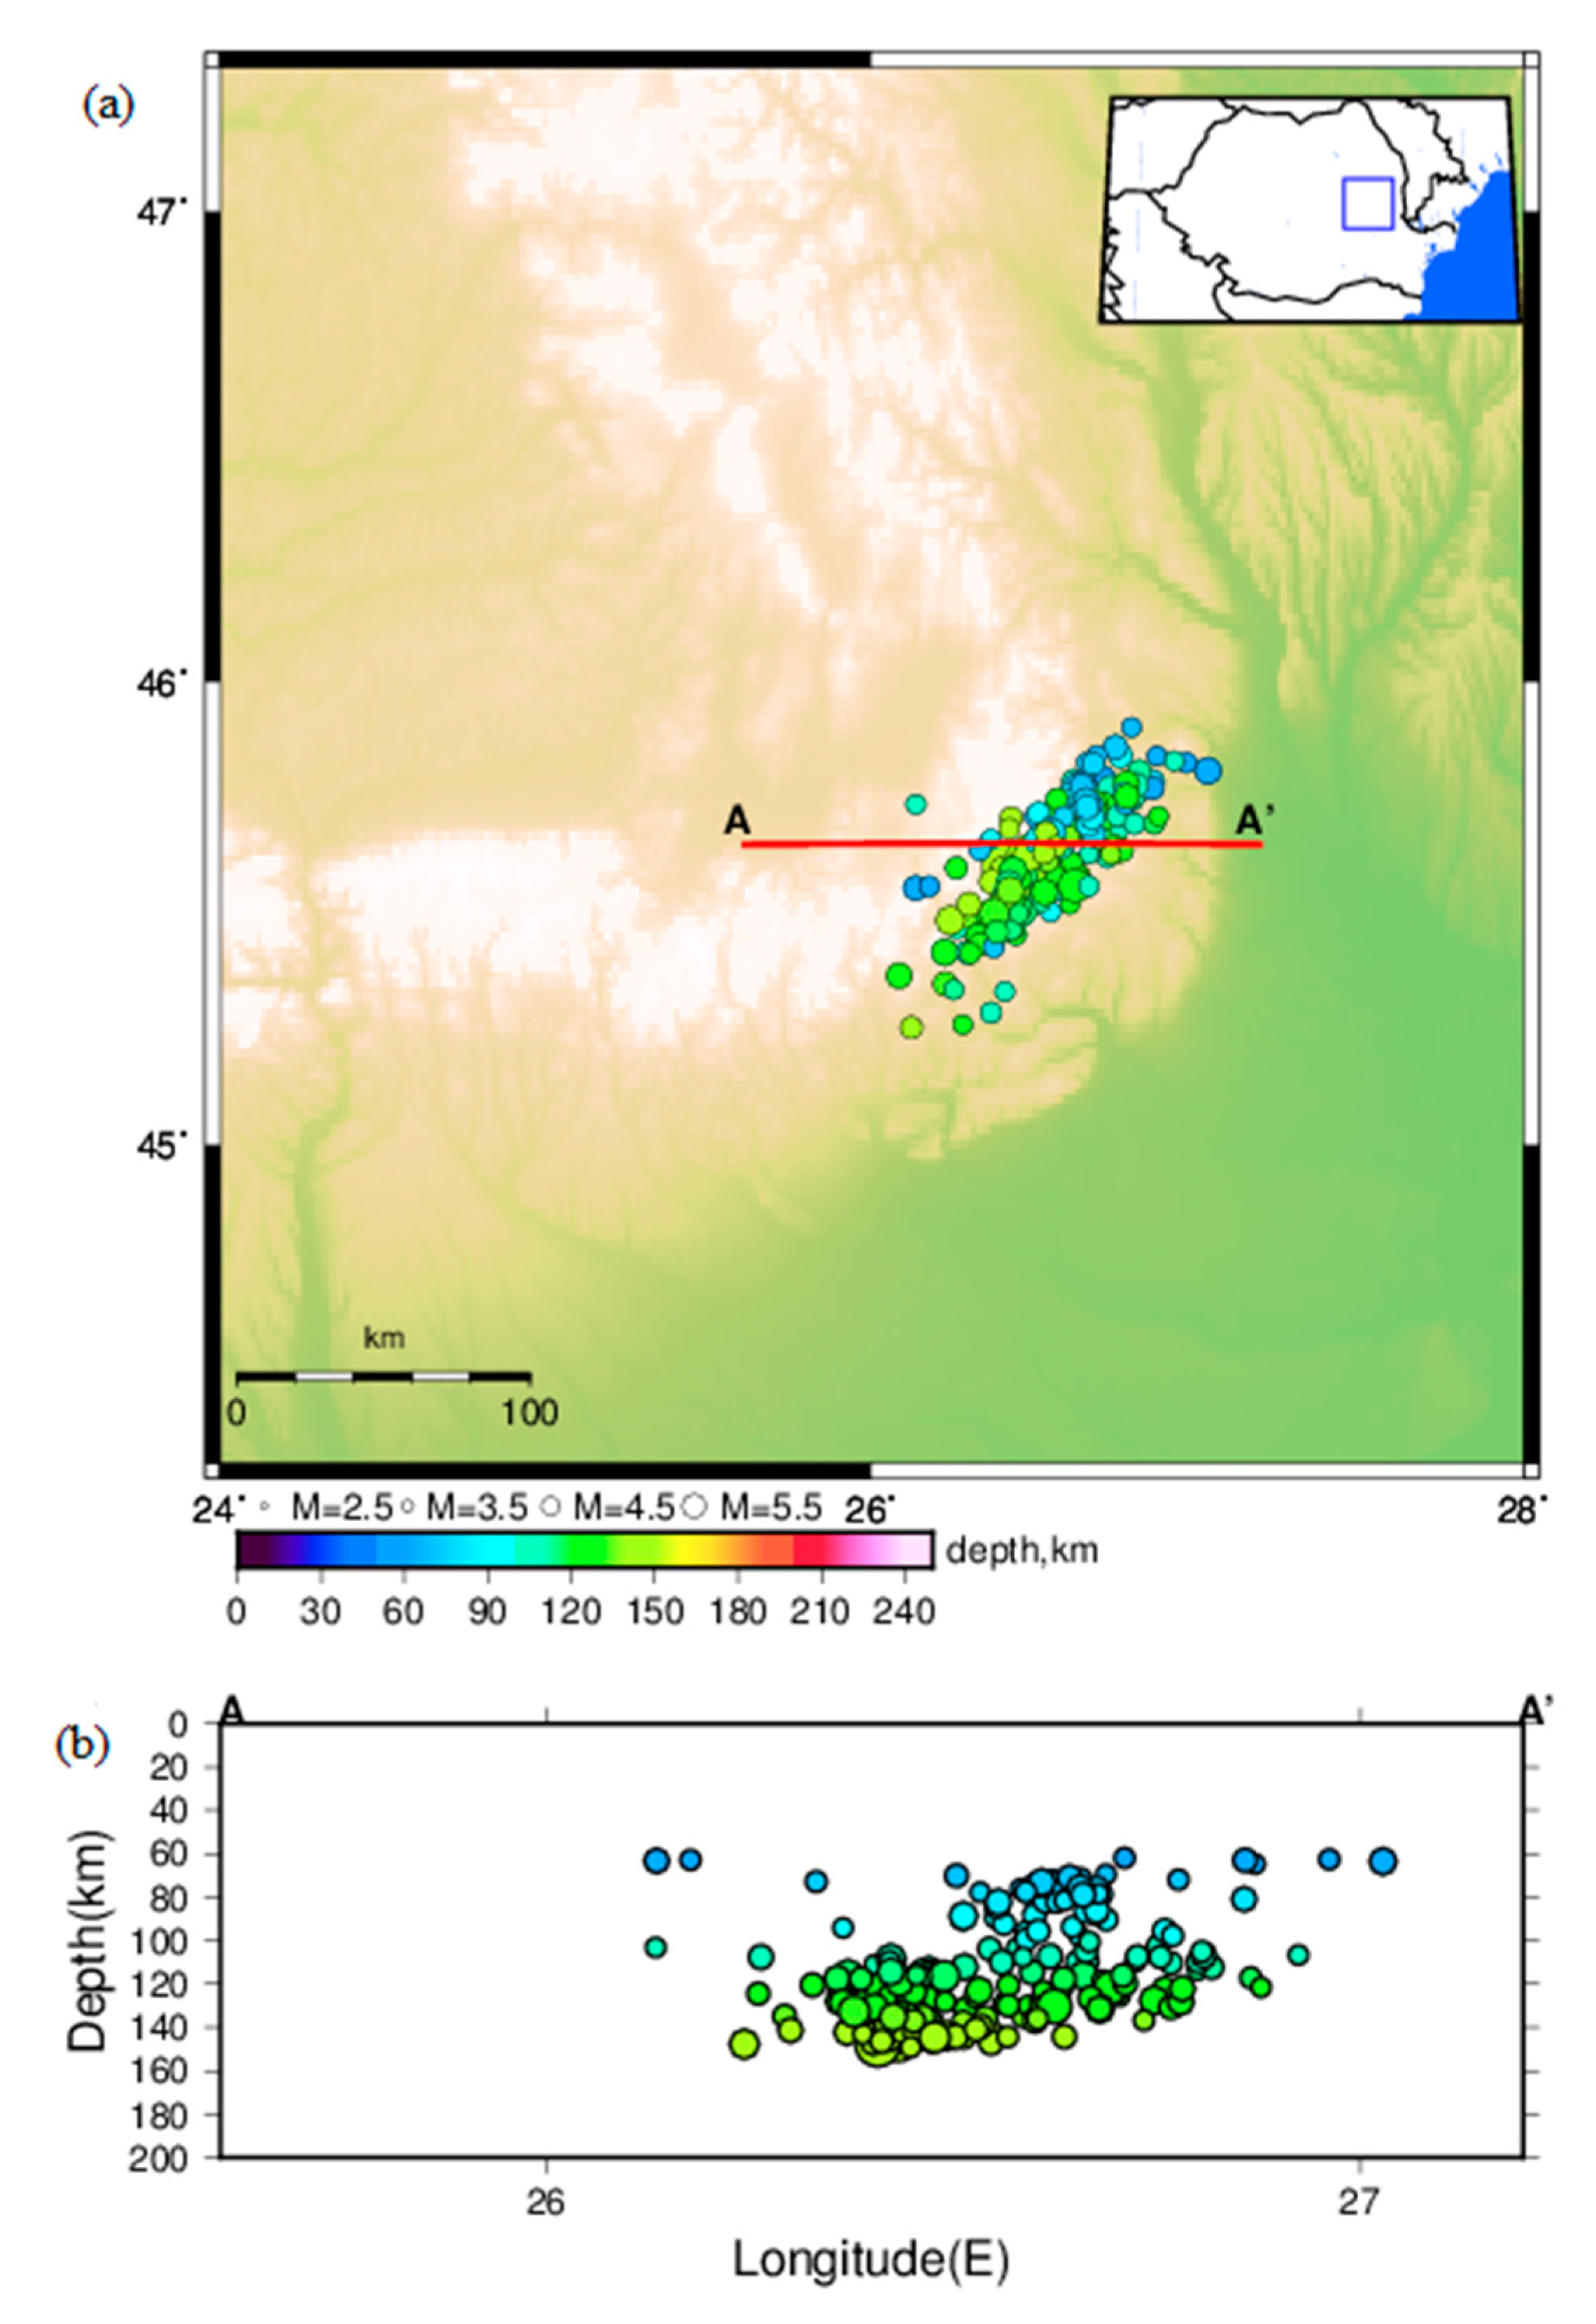
In the following, we investigate the variation of the Vp/Vs ratios for a time period of more than one year, seven months before and six months after the occurrence of the moderate magnitude (ML = 5.8) subcrustal earthquake (H = 147 km) in the Vrancea region (28 October 2018; 00:38, GMT). The data consist of seismic bulletins determined by the International Seismological Center (ISC) for intermediate depth earthquakes (60 ≤ H(km) < 170) generated in the Vrancea area between 1 April 2018 and 30 April 2019, with ML ≥ 2.5. The number of selected events was 209, with 6 earthquakes of ML ≥ 4 occurring within the analyzed time period. Figure 4 depicts the distribution of epicenters and hypocenters for the selected events. It is worth noting that, during the selected time period, the seismic activity is more intense in the lower lithospheric segment (Figure 4), a feature also highlighted by previous studies [43].
For the selected events, the Vp/Vs ratios were calculated, using the Wadati diagram method, based on the solutions from the seismic bulletins. To increase the investigation accuracy, only the events whose location errors were well constrained were selected. As a result, we only included events with low values of root mean square of the travel time residuals (RMS < 0.9) and a high coefficient for determining the regression slope for the Wadati diagram (R2 ≥ 0.95) in the study. In addition, the minimum number of station pairs required to determine Vp/Vs was set at 5, decreasing the number of events to 170. For events that were excluded due to the imposed conditions, the seismic bulletins calculated within the Romanian Data Center (RONDC) were considered. If their solutions did not meet the criteria, the events were manually relocated using IASP91, the Earth reference velocity model [44], and the LocSAT method [45] embedded within the ANTELOPE software version 5.7 (http://ww.brtt.com/software.html (accessed on 12 March 2021)), which is routinely used for location purposes within the RONDC. Finally, the Vp/Vs ratios were determined for the 209 events (Figure 4).
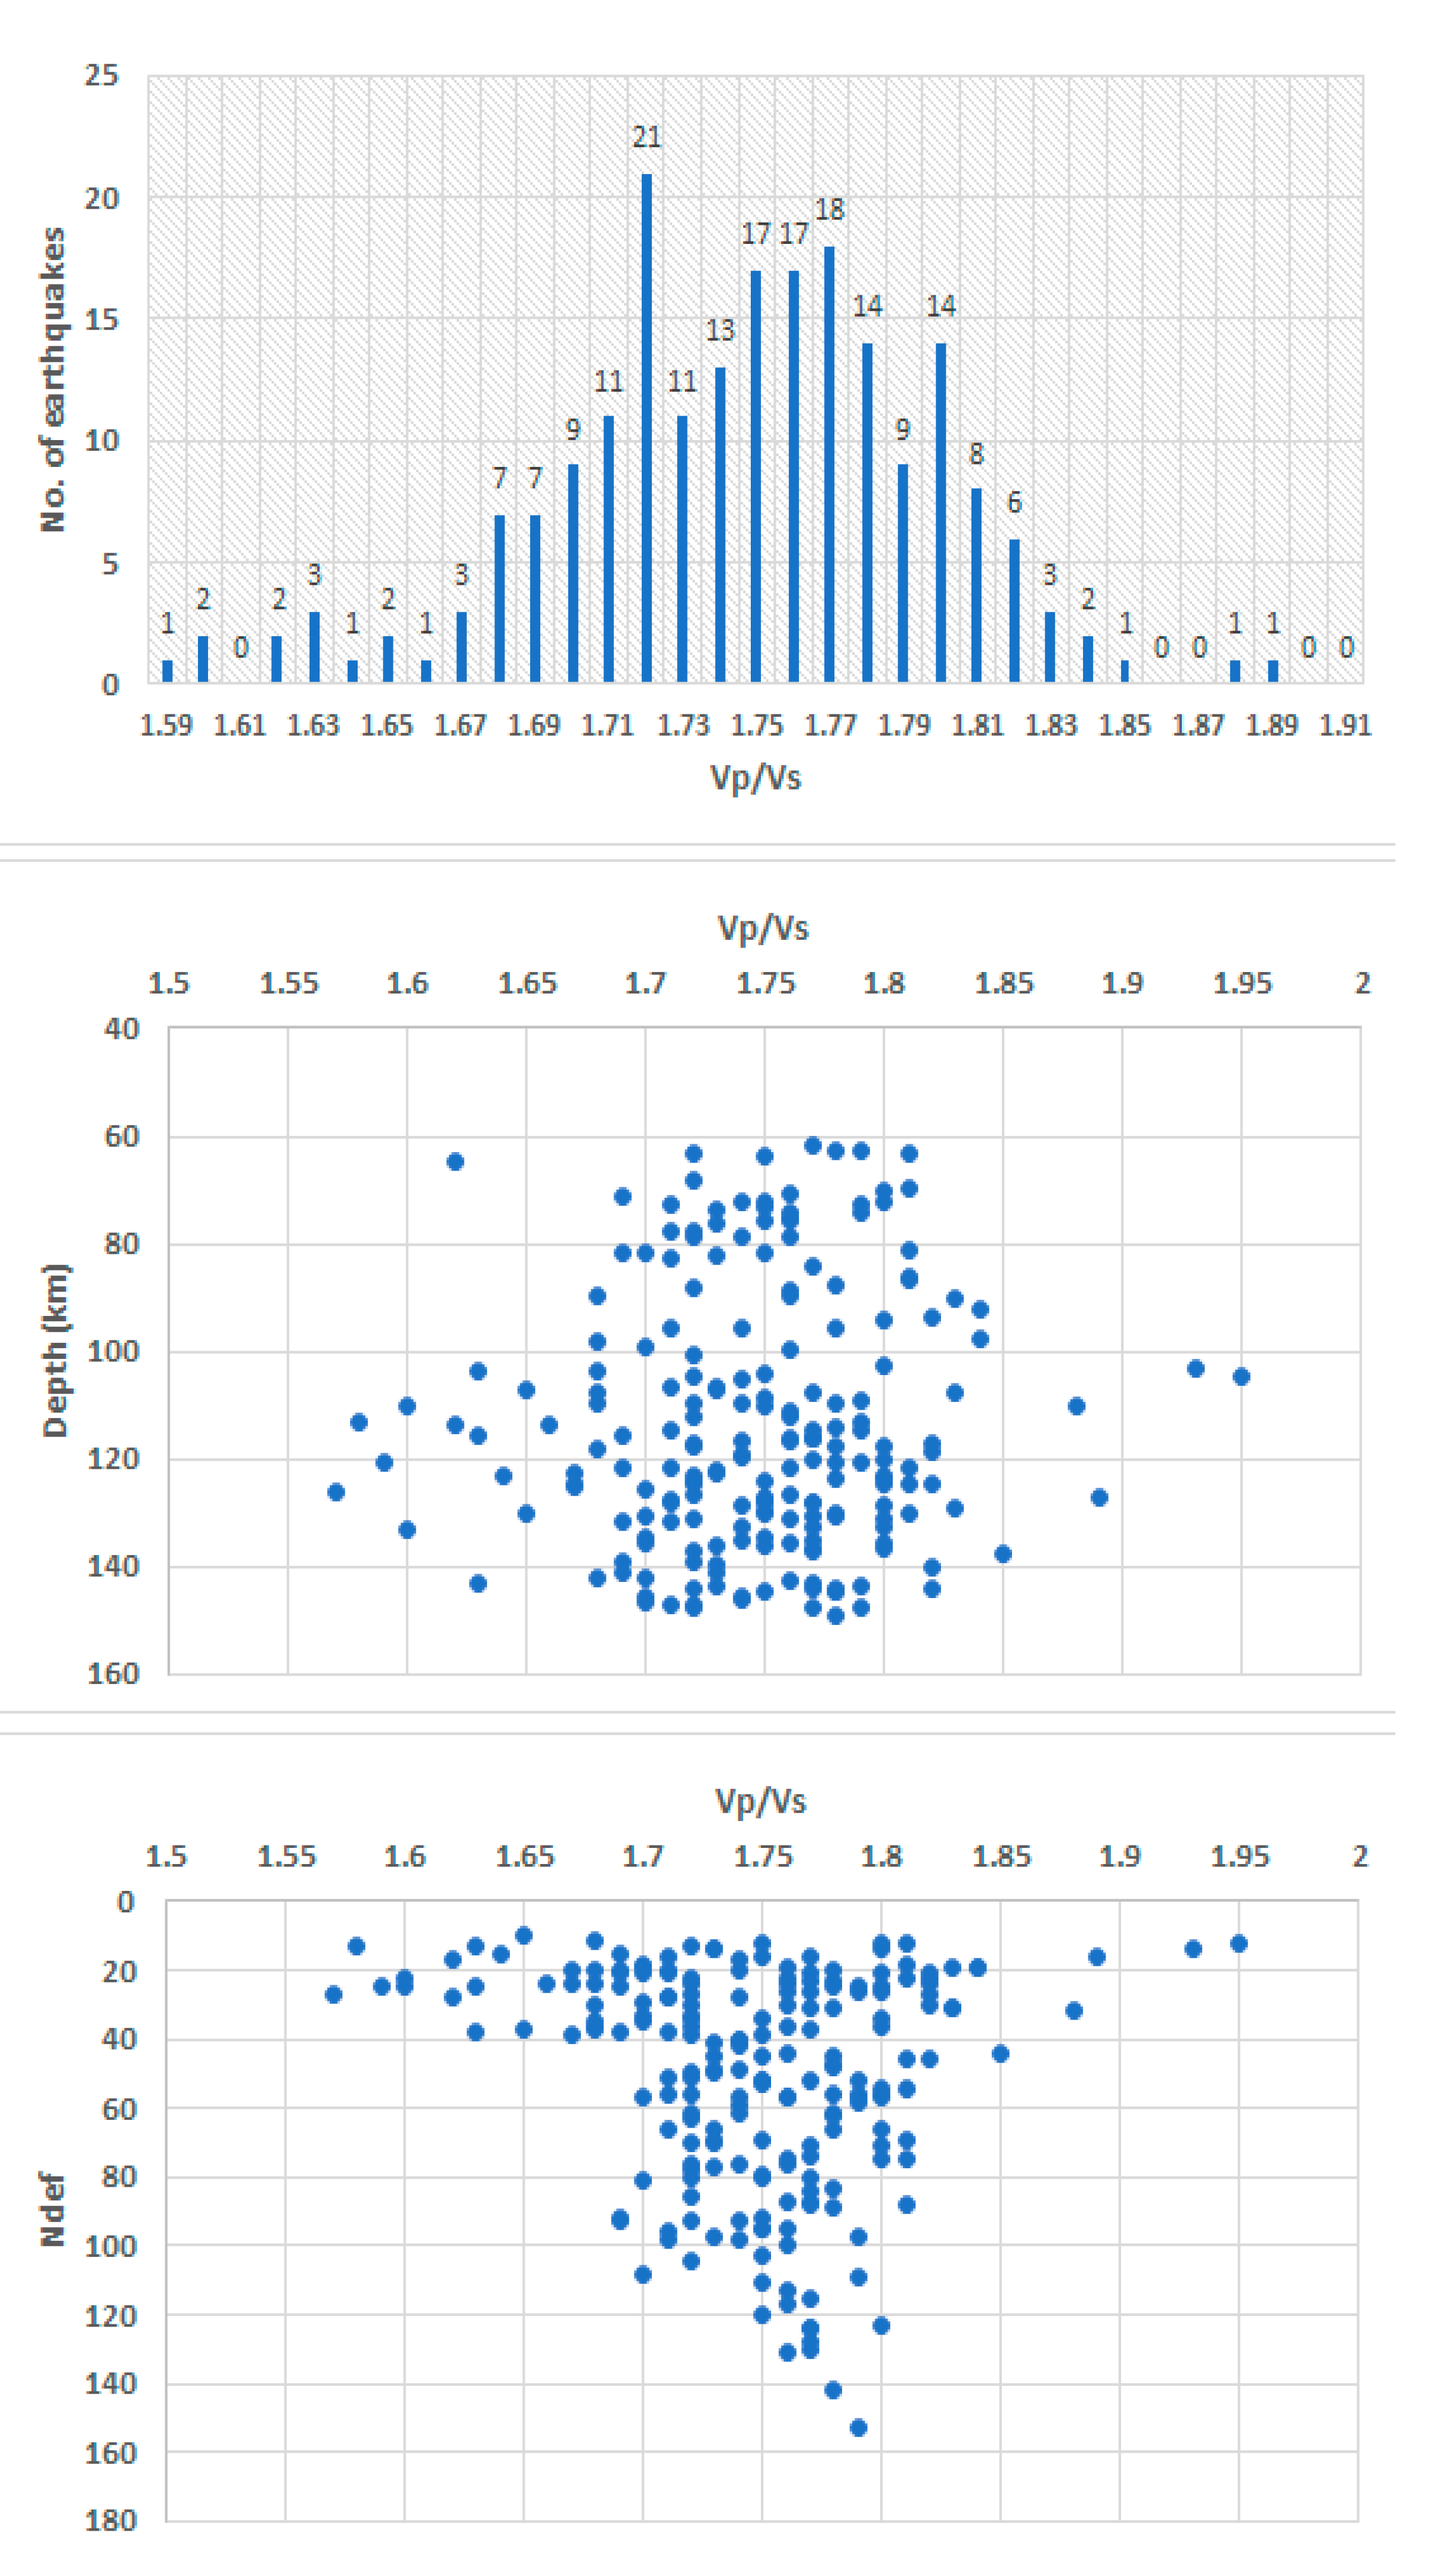
Figure 5 depicts the Vp/Vs distribution function of the selected earthquakes, as well as their distribution, according to the depth and the number of phases used to estimate the location. We notice a significant variation in Vp/Vs with depth. This pattern seems to be caused by low magnitude earthquakes that occur at different depths and are only recorded by a few stations. We also notice that earthquakes located with a high number of seismic phases have higher Vp/Vs stability.
These variations could also be attributed to the structural inhomogeneities associated with the specified depth interval, leading to the attenuation of the seismic signal and implicitly reducing the number of detected phases. On the other hand, in a first stage, no limitation was imposed for the epicentral distance being used in the analysis of the stations located at large distances (Δ > 100).
At this stage, the average value determined for the Vp/Vs ratios was 1.746, with a standard deviation of 0.057. This value is slightly higher compared to the standard value of 1.73 mentioned by previous studies [46]. Based on the standard deviation, we consider the values between 1.689 and 1.803 to be the normal range of variation (of Vp/Vs), while values exceeding these limits are considered anomalies.
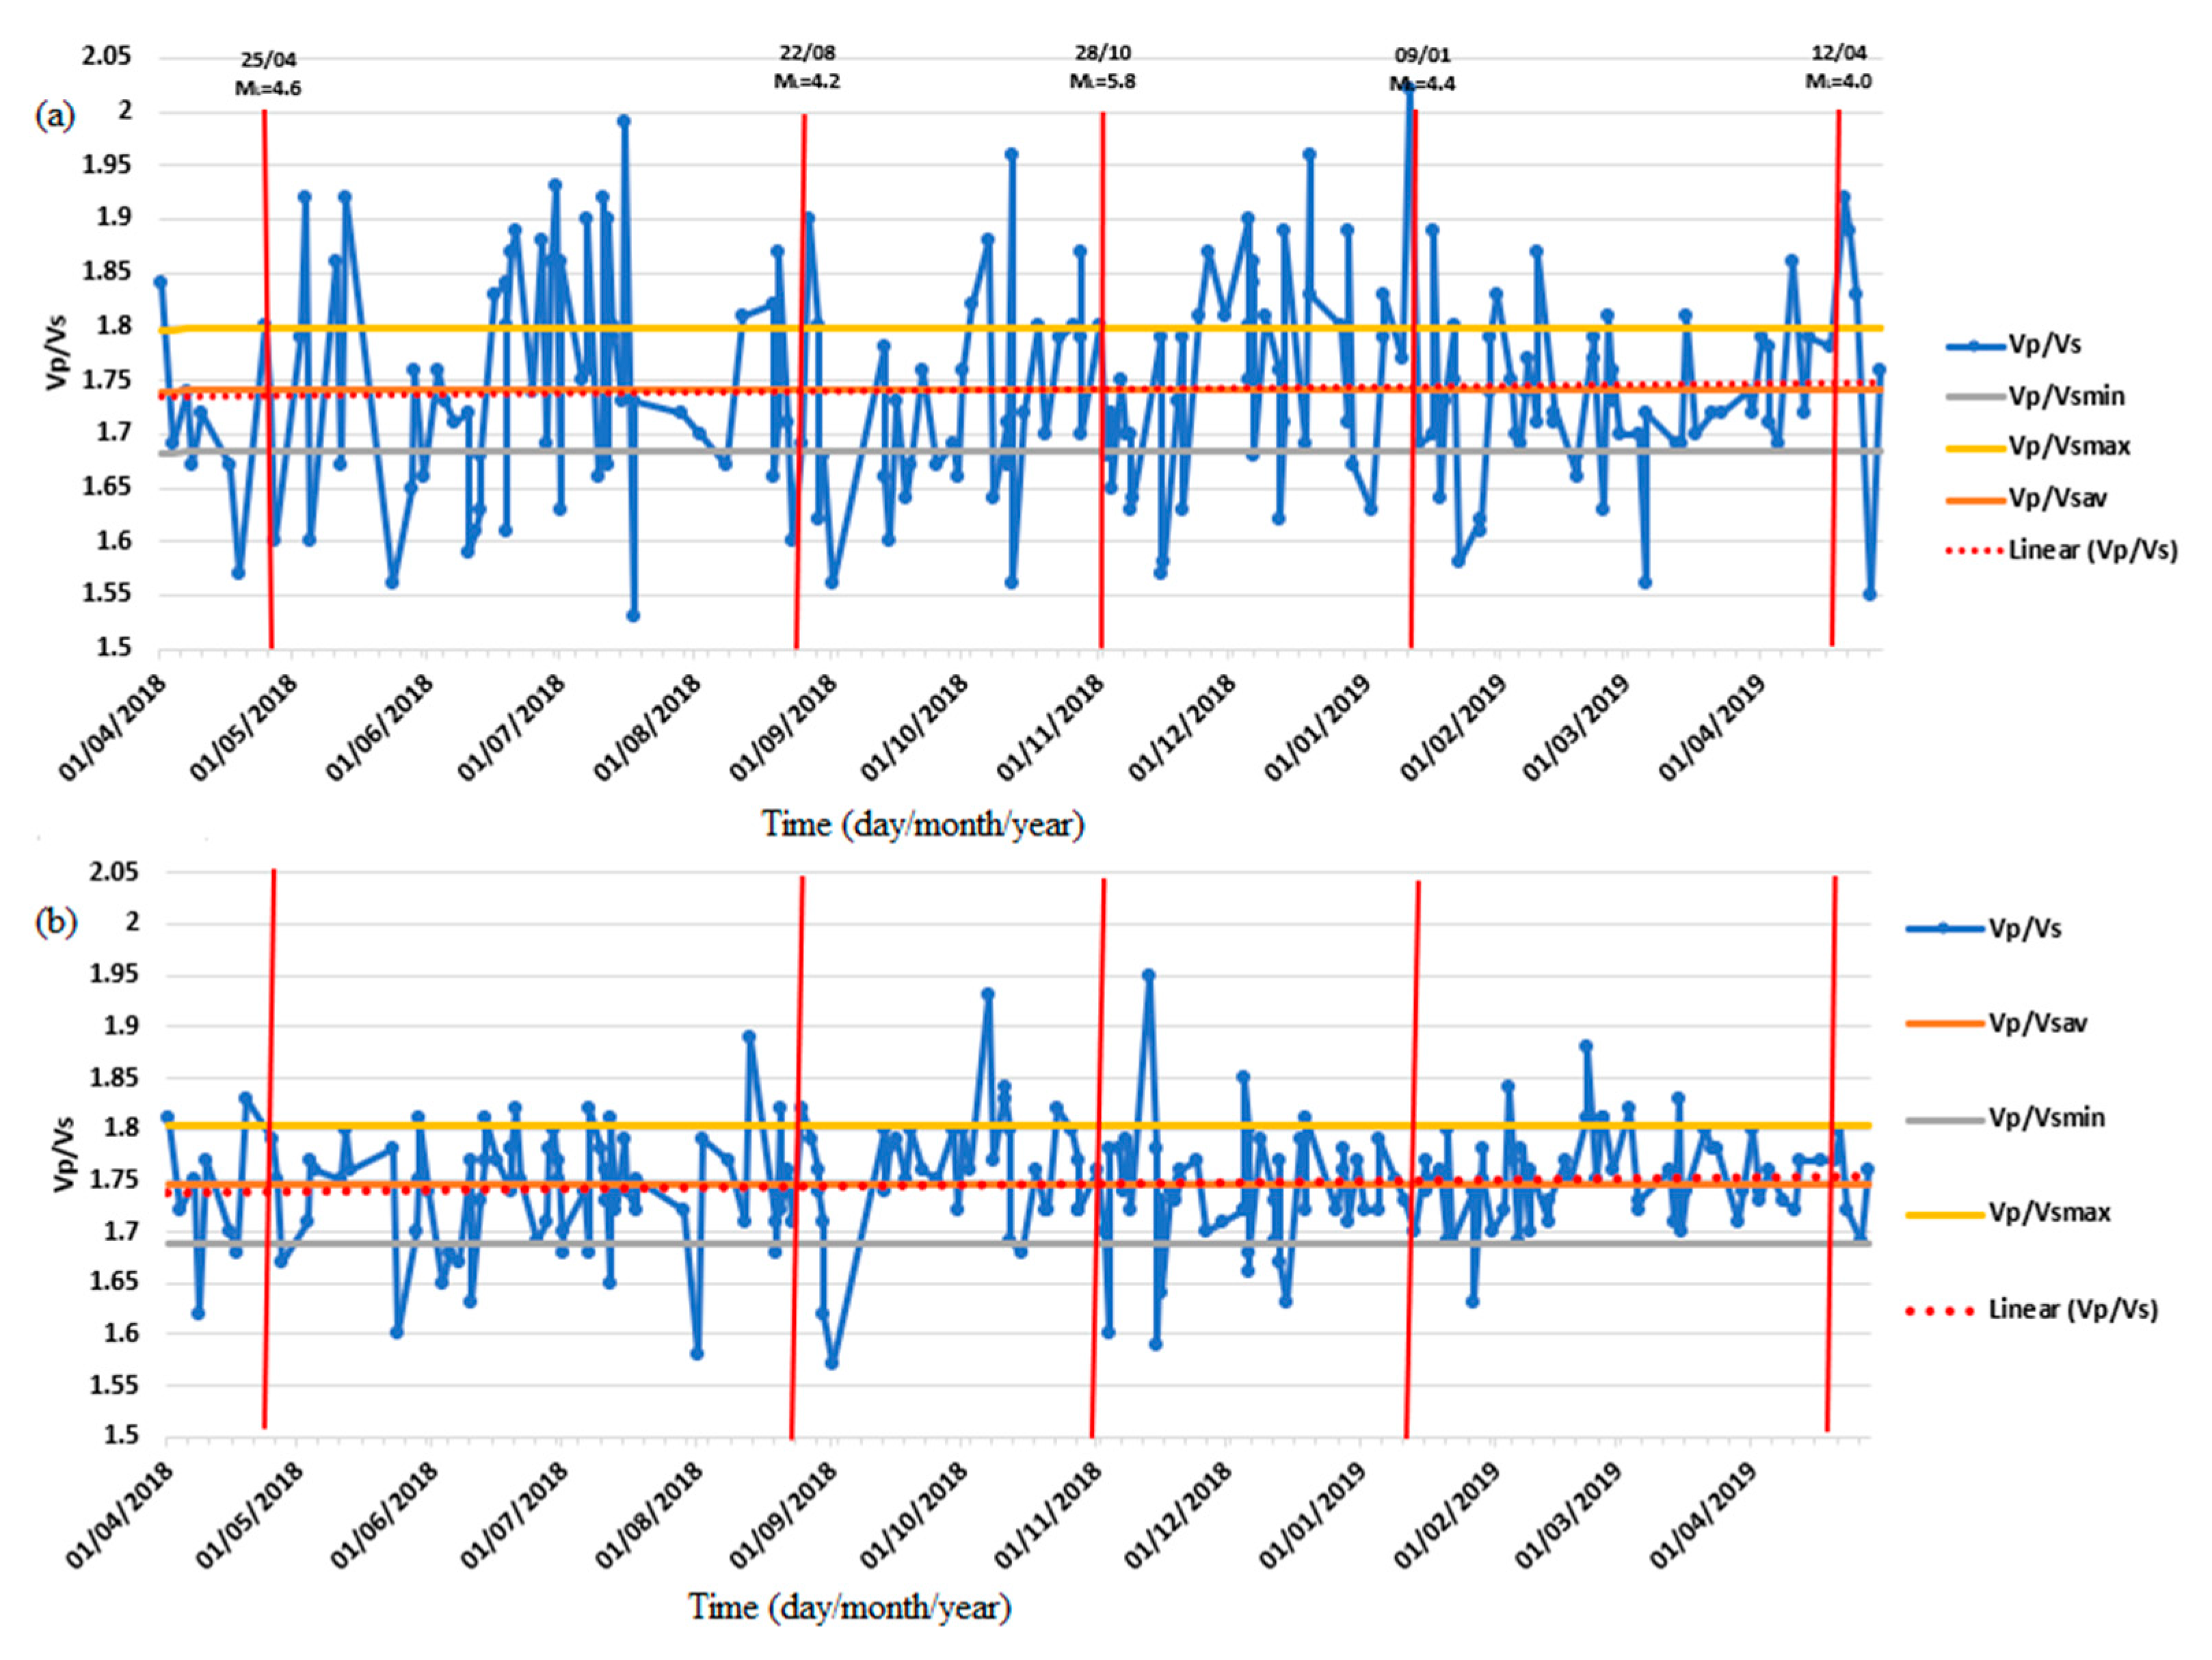
In order to check if the data from stations located at large epicentral distances can introduce certain influences in the variation of Vp/Vs ratios, in the second step, we removed the data from stations located at epicentral distances of more than 1 degree (~111 km) and recalculated Vp/Vs only using the phases provided by the stations deployed in the epicentral area (Figure 3). In this scenario, the average value determined for the Vp/Vs ratios was 1.742, with a standard deviation of 0.057. For comparison, in Figure 6, we represented the variation of Vp/Vs over time, based on the values obtained in the first stage, for the scenario where all available data were used, respectively, for the instance where only the stations located in the epicentral region (Δ ≤ 1°) were used.
The Vp/Vs distribution in Figure 6 was plotted over time together, with the normal variation limits (Vp/Vsmin and Vp/Vsmax) derived based on the value of the standard deviation of Vp/Vs, which was then added and subtracted, respectively, from the mean value of Vp/Vs.

3.2. Temporal Variation of Vp/Vs Ratios Determined for the Crustal Earthquakes

We examined Vp/Vs variations over more than a year, between 1 April 2014 and 30 June 2015, using the same methodology as for the subcrustal earthquakes. The selected time period corresponds to the largest earthquake, which occurred on 22 November 2014 (ML = 5.7; H~40 km) during the period of instrumental recordings in the Focsani Basin area (close to the Marasesti city). In order to check if there are any limitations due to the depth of the source, we extended the analysis using the method described in Section 3.1 (variation of Vp/Vs based on the Wadati diagram) to the crustal earthquakes that occurred in the study region in the selected time interval.
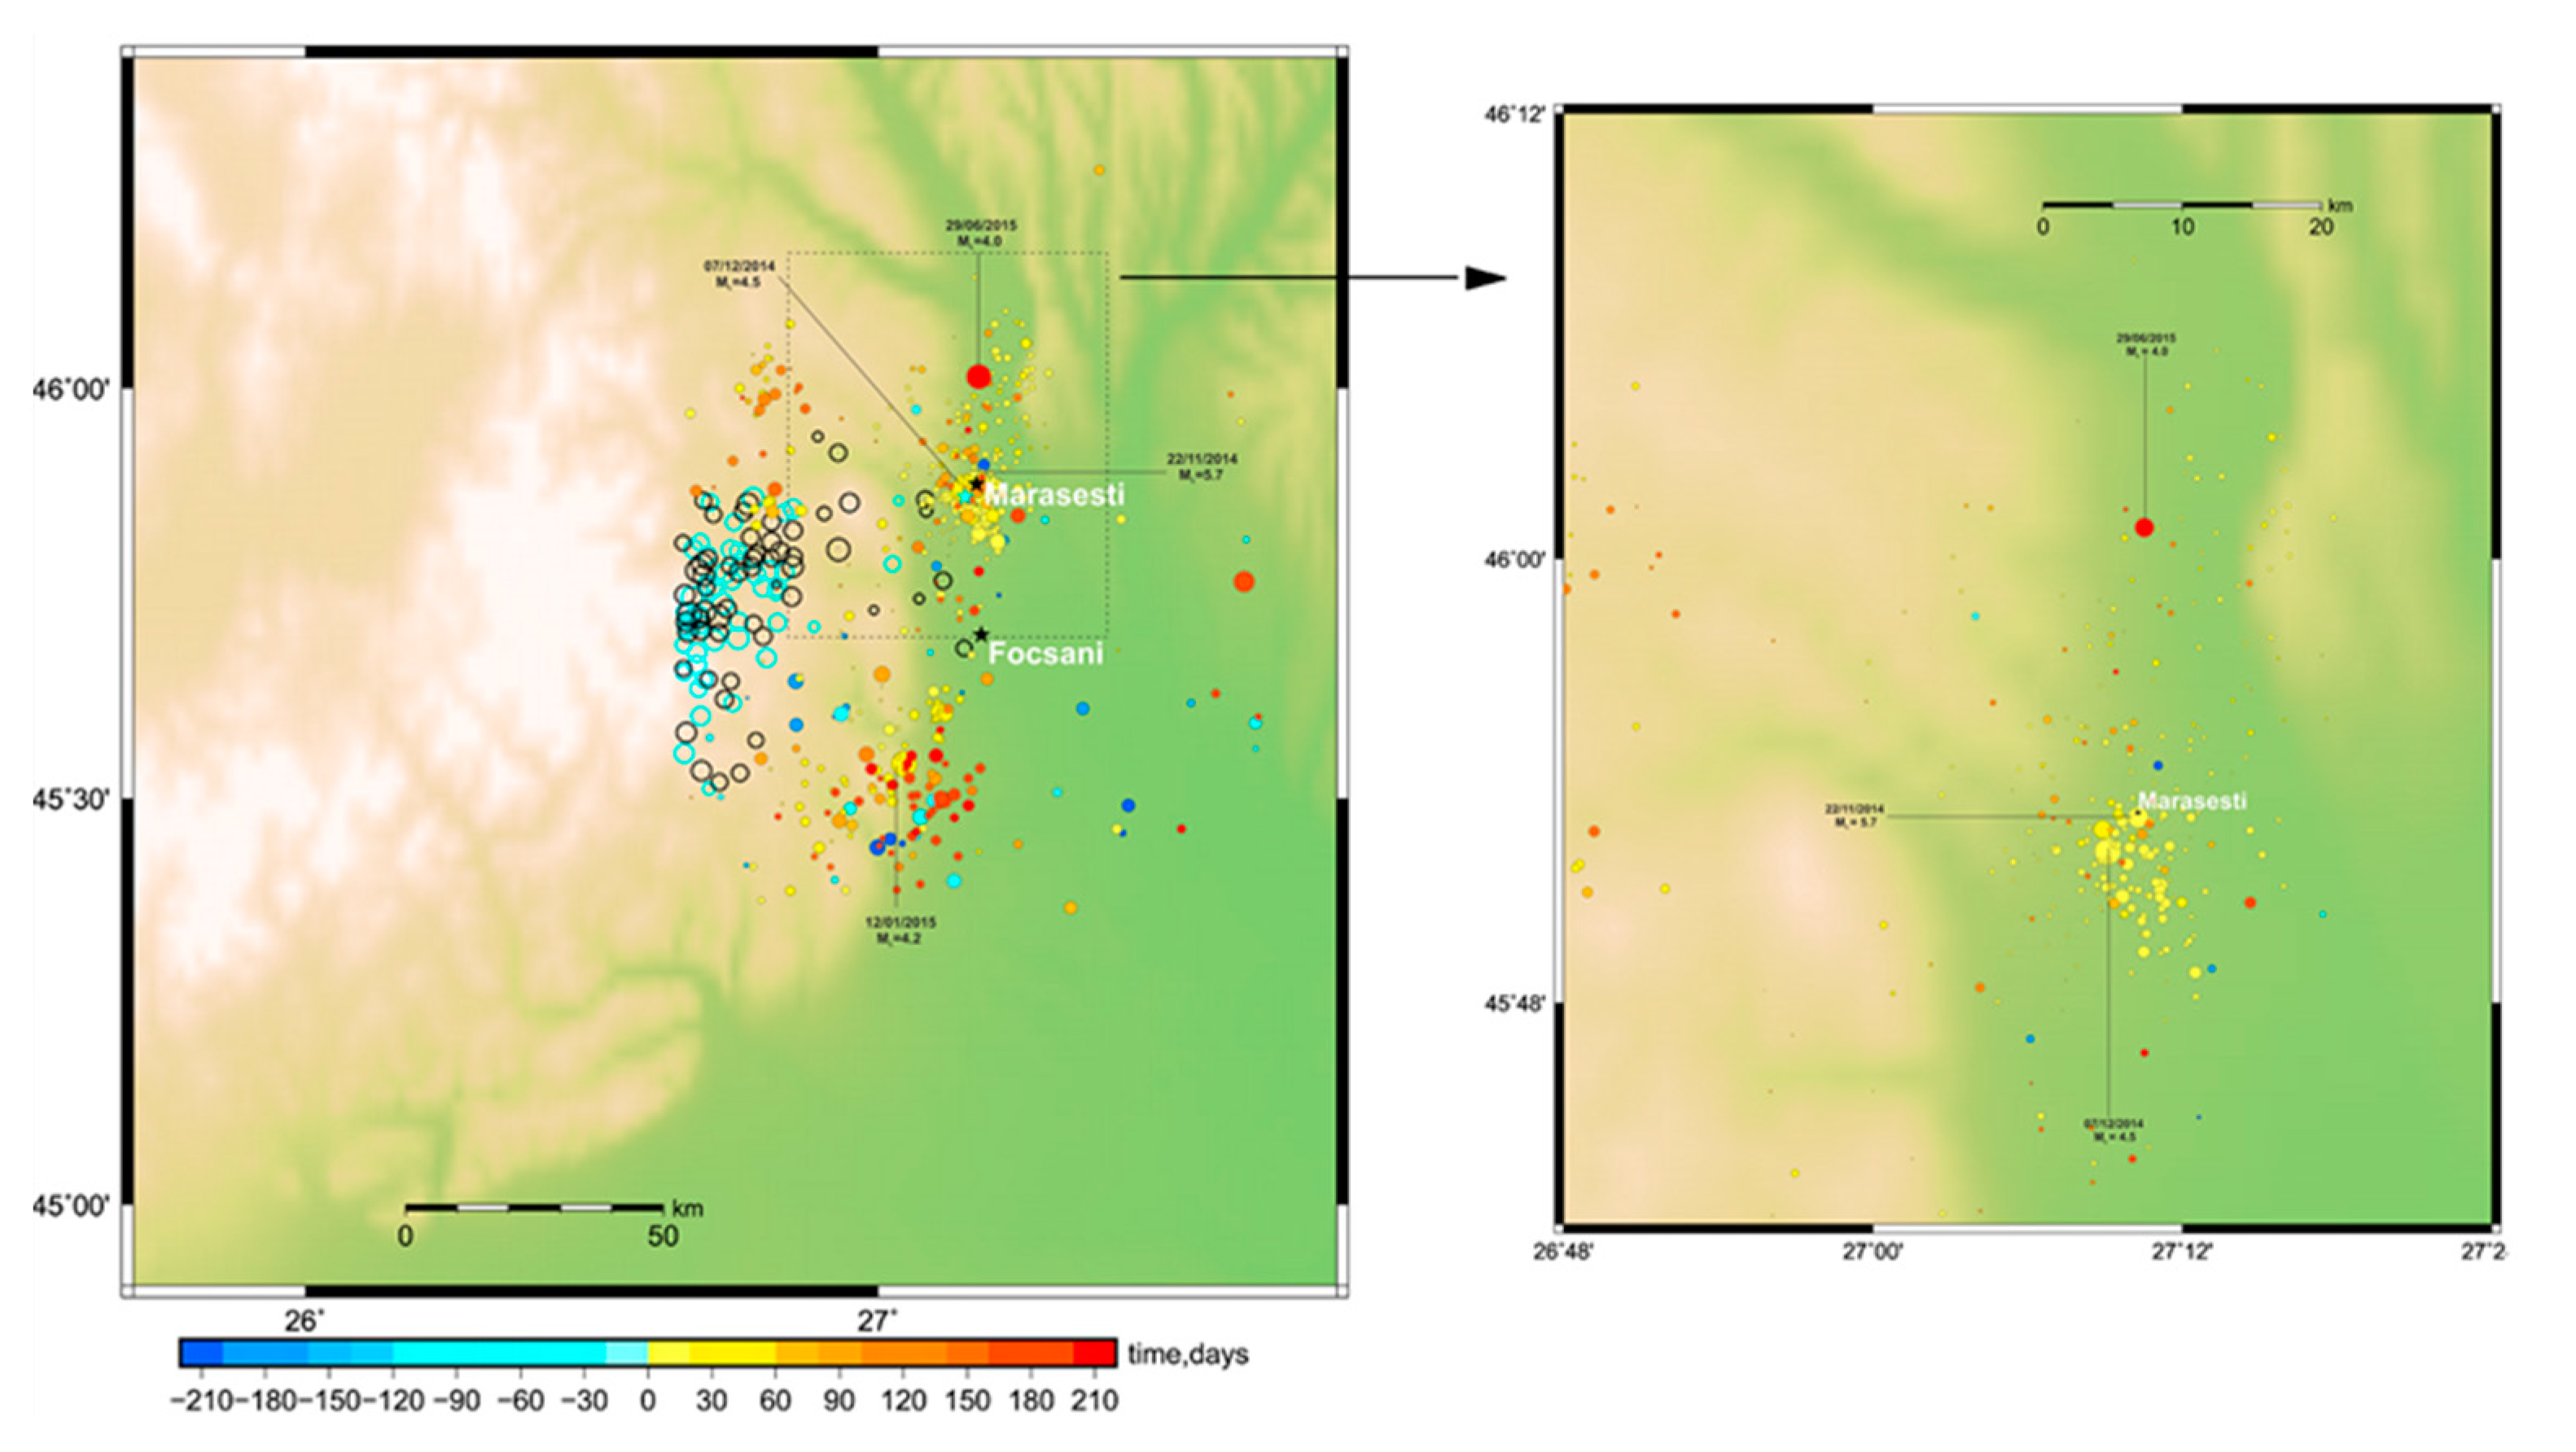
The data used consisted of seismic bulletins of crustal earthquakes (0 ≤ H (km) ≤ 50) produced in the epicentral region during the period 1 April 2014–30 June 2015, selected for a distance of 0.5 degrees around the epicenter of the main earthquake (45.8683–27.1517). Based on the specified criteria, 482 earthquakes were initially selected, with 4 earthquakes of moderate magnitudes (ML ≥ 4). Following the initial selection, criteria RMS < 0.9 and R2 ≥ 0.95, the final number of selected events was reduced to 440. Their seismic bulletins were downloaded from the ISC. The epicenter distribution of the crustal events colored function of the time of occurrence relative to the main earthquake (22 November 2014; 19:14 GMT), as well as the distribution of the epicenters of the subcrustal earthquakes generated in the Vrancea region in the same period, as shown in Figure 7.
Figure 7 highlights at least two notable aspects. The first is given by the distribution of epicenters that show at least three clusters of crustal events (solid symbols): one located near the city of Marasesti, another located to the NW relative to the same city, and the third to the south of the city of Focsani. At the same time, it is observed that the epicenters of the crustal earthquakes are oriented approximately parallel to those of the subcrustal earthquakes in the Vrancea region.
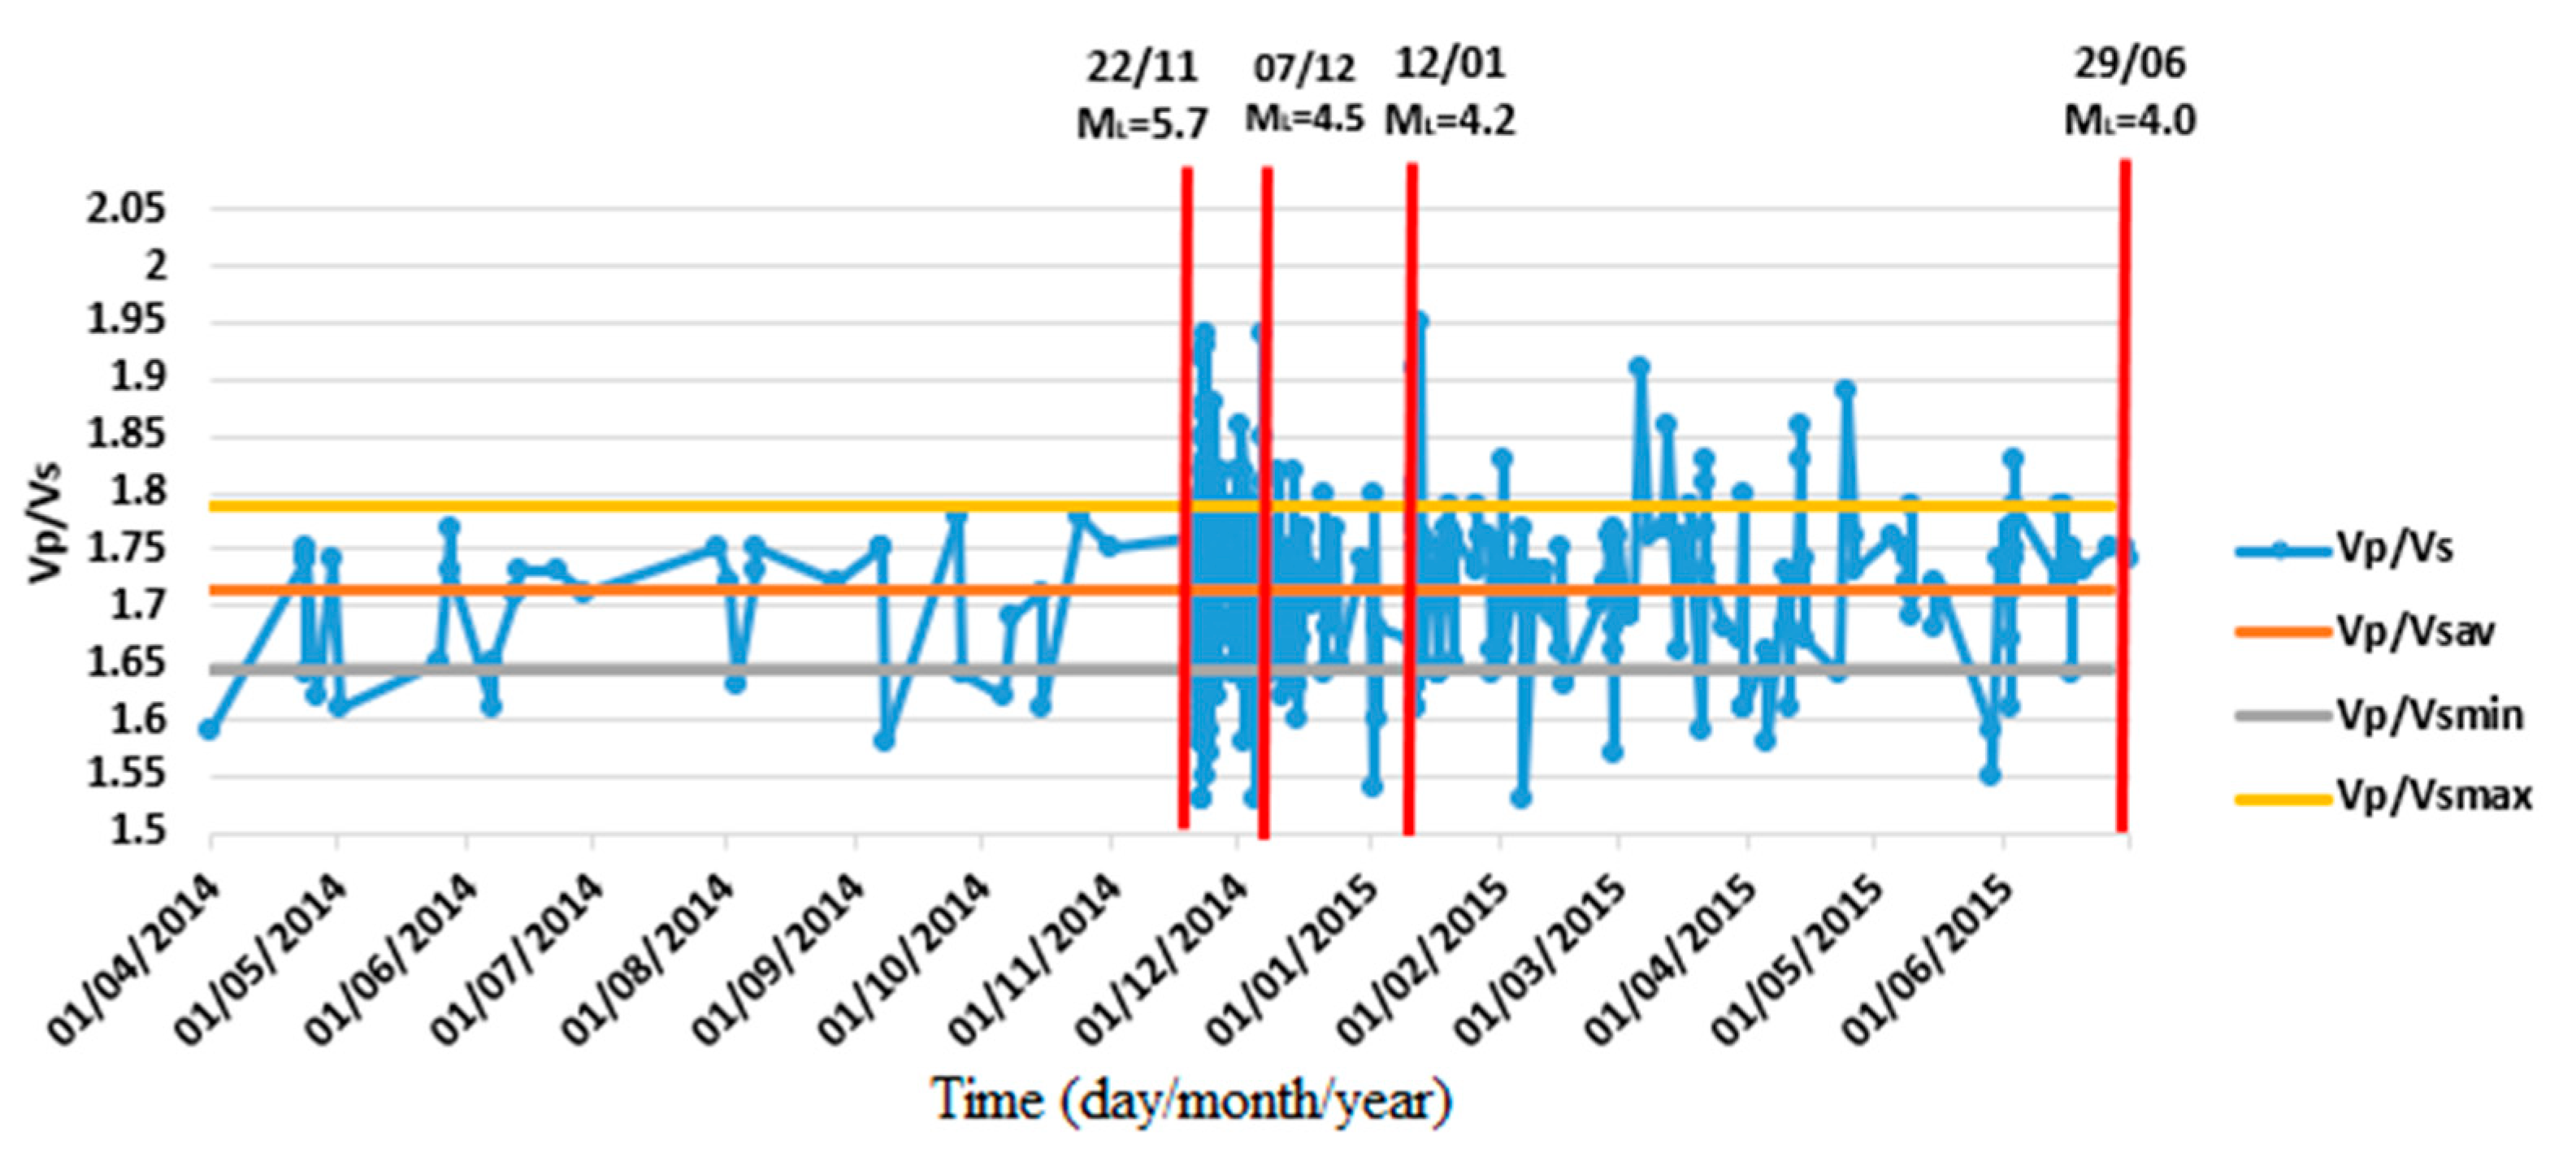
Figure 7 also indicates that part of the subcrustal earthquakes that occurred prior to the main crustal earthquake in the Mărășești region (Figure 3 and Figure 7) are located between the three clusters of crustal events, some even very close to the epicenter of the main earthquake, which could indicate that subcrustal seismic activity may have played a key role in the generation of the main earthquake and subsequent aftershocks. This hypothetical influence has been highlighted by the past research [47]. The second aspect is given by the unusually decreased seismic activity in the Mărășești region before the occurrence of the main event. This pattern contrasts earlier results [48,49,50] that investigated the crustal seismic sequences and highlighted the occurrence of small magnitude earthquakes (preshocks) before the appearance of the main earthquake. Figure 8 depicts the distribution of Vp/Vs ratios over time obtained by applying the Wadati approach on the selected data set. (1 April 2014–30 June 2015). To emphasize the Vp/Vs variation, we used the same algorithm described previously; the Vp/Vs distribution was shown over time, along with the normal variation limits (Vp/Vsmin and Vp/Vsmax) derived using the Vp/Vs standard deviation value (0.071), which was subsequently added or subtracted from the average value of Vp/Vs (1.716). Values that exceeded the normal limits of variation were considered anomalies (high or small).

4. Discussion

The moderate subcrustal earthquake (ML = 5.8) generated in the Vrancea region on 28 October 2018 occurred at a Vp/Vs transition stage, as shown in Figure 6. Based on a comparison of the results obtained in the two scenarios (with all stations respectively only the stations in the epicentral area), we noticed that the values of Vp/Vs have a broader dispersion and a lower average when only the stations in the epicentral region are considered.
The spread might be explained by the lower number of stations used to estimate the Vp/Vs. However, none of the plots (Figure 6) seem to reveal a specific trend of Vp/Vs prior to the occurrence of moderate magnitude earthquakes (ML ≥ 4.0), as has previously been reported in other regions of the world [34]. We separated the selected events into three depth ranges (60–90 km, 90–120 km, and 120–150 km) and analyzed the Vp/Vs variation for each depth interval to see whether there are any changes in Vp/Vs ratios. Our analysis indicates no significant changes in Vp/Vs prior to the occurrence of a major earthquake.
However, it worth mentioning that the last depth interval (120–150 km), a slightly decreasing trend of Vp/Vs, was seen about two months before the major earthquake (Figure 9).
Within this depth range, the Vp/Vs distribution was represented, over time, together with the normal limits of variation (Vp/Vsmin = 1.70, Vp/Vsmax = 1.81) determined using the value of the standard deviation (0.06), which was subtracted, respectively, added from the mean value of Vp/Vs (1.76). Figure 9 indicates that about two months before the major seismic event, with the exception of one event with a high anomaly of Vp/Vs (1.96), many of the values fall under the minimal anomaly range (Vp/Vs 1.70).
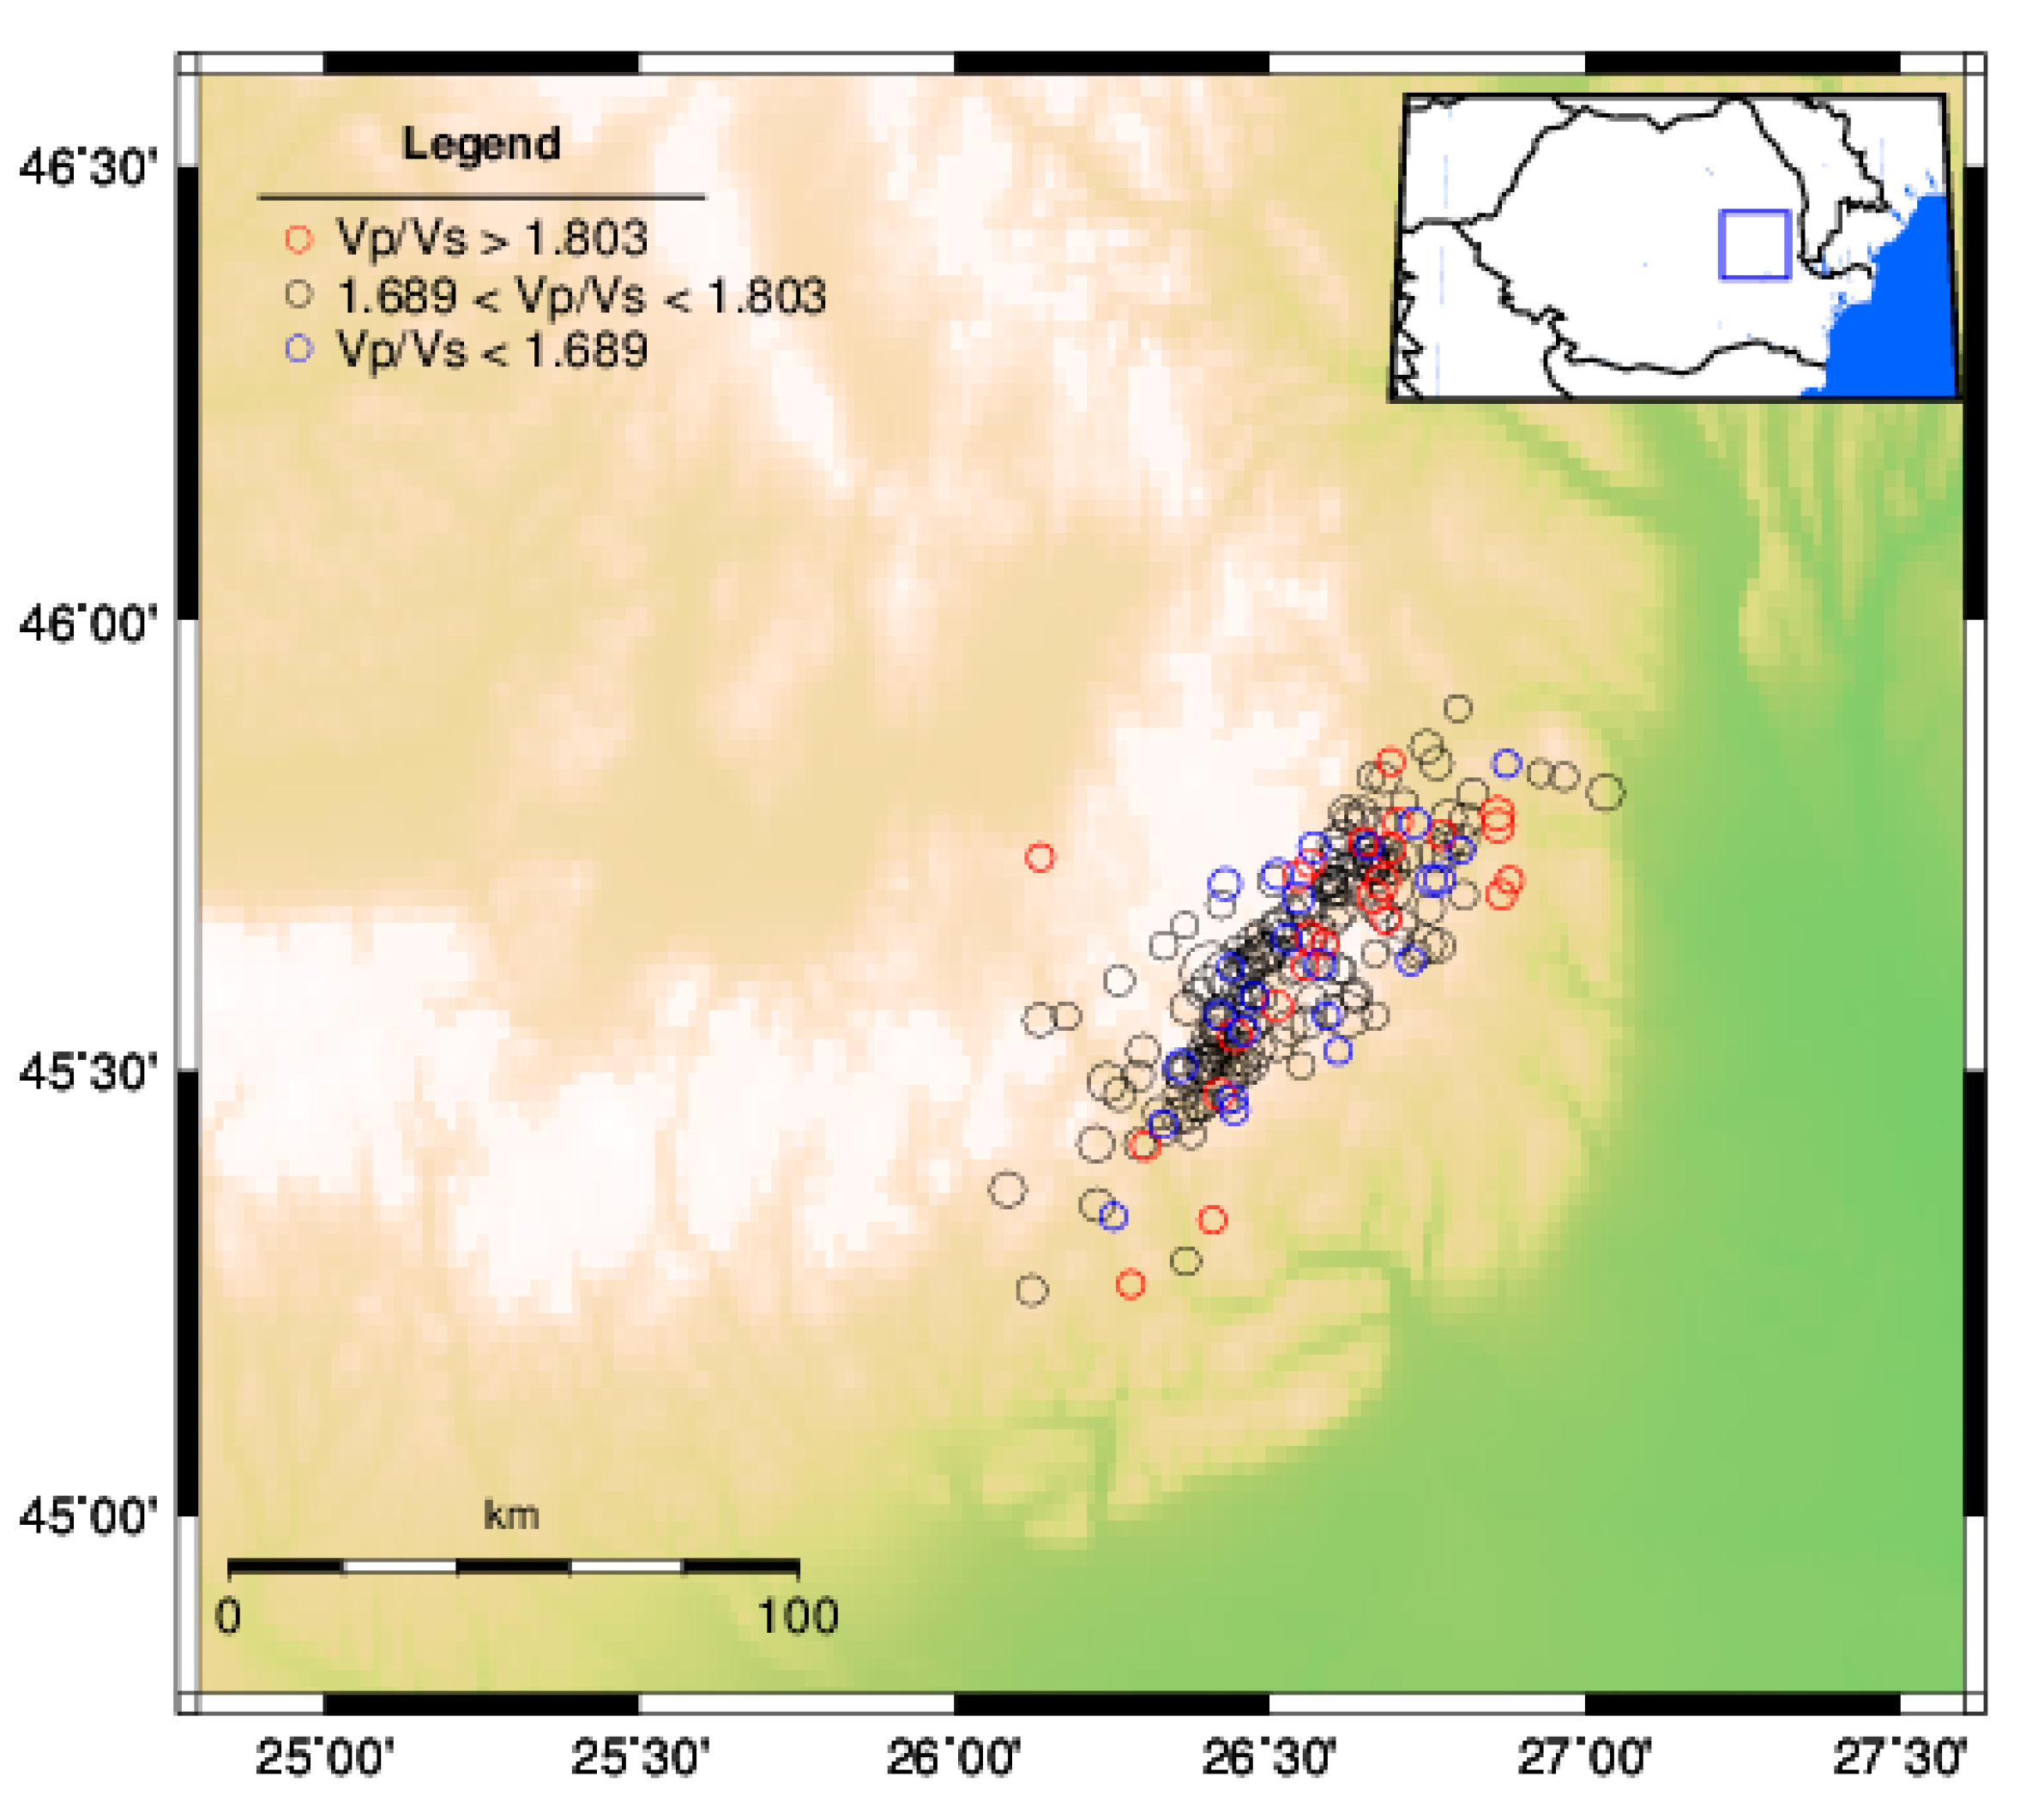
To determine if the Vp/Vs anomalies have a specific orientation in space, we plotted Vp/Vs for each event in Figure 10. The distribution of Vp/Vs anomalies does not appear to have a specific orientation; rather, these anomalies appear to be associated with low-magnitude events, which explains the impact of the number of seismic phases in determining the Vp/Vs ratios.
For crustal earthquakes, we determined the distribution of the Vp/Vs ratios over time, for different magnitude intervals, to investigate the existence of possible influences induced by the magnitude in determining the Vp/Vs ratios. Figure 8 depicts the temporal distribution of Vp/Vs for all selected events (0.1 ≤ ML ≤ 5.7). The absence of high Vp/Vs anomalies before the occurrence of a major earthquake is a key feature emphasized by our results. Figure 11 depicts the Vp/Vs distributions over time for two sets of events: one with ML ≥ 1.9 and another with ML ≥ 2.5. Separate analyses of various magnitude ranges show that the Vp/Vs ratios for the stronger earthquakes (ML ≥ 2.5) fall below the average prior to the occurrence of the major earthquake. This trend is consistent with the findings of earlier research, which show a drop in the Vp/Vs ratio prior to the occurrence of a major earthquake.

5. Conclusions

We investigated the variation of Vp/Vs over time using the Wadati diagram, which was applied to sets of crustal and subcrustal events generated before and after the occurrence of two moderate earthquakes at the bending of the southeastern Carpathians.
Although a series of Vp/Vs anomalies can be seen before and after the occurrence of the moderate subcrustal earthquake of 28 October 2018 (ML = 5.8) in the Vrancea region, they seem to match well the events with low magnitudes and whose solutions were determined using a reduced number of seismic phases (Ndef < 40).
Our results show that there were no significant changes in the Vp/Vs distribution prior to the occurrence of the moderate subcrustal earthquake in the Vrancea region (28 October 2018, ML = 5.8), which could indicate either a limitation of this method applied on the selected subcrustal earthquakes data set or that this earthquake was not large enough to cause noticeable trends.
The results obtained for the moderate crustal earthquake that occurred close to the Marasesti city (22 November 2014, ML = 5.7) show that the number of earthquakes generated in the epicentral region was reduced prior to its occurrence, and Vp/Vs values are generally within normal limits, with no significantly high deviations. This characteristic appears to be fairly stable, as evidenced by multiple sets of events selected at different magnitude intervals.
Another notable feature of this research is the increasing trend of Vp/Vs across the selected magnitude ranges. We found significant differences between the average values of Vp/Vs (1.716) obtained for all selected events, the average value of Vp/Vs (1.739) obtained for earthquakes with ML ≥ 1.9, and the average value of Vp/Vs (1.753) obtained for earthquakes with ML ≥ 2.5.
The mean Vp/Vs for crustal and mantle earthquakes, as well as their standard errors, are key indicators of dynamic processes with multidisciplinary implications (e.g., numerical modeling, petrology).

Author Contributions

Individual contributions of coauthors is as follows: Conceptualization, F.B. and I.-A.M.; methodology and software, F.B.; validation, A.-O.P.; formal analysis, A.-O.P. and F.B.; investigation, A.-O.P. and F.B.; data curation, A.-O.P., A.C. and F.B.; writing—original draft preparation, I.-A.M.; writing—review and editing, F.B.; visualization, I.-A.M.; supervision, A.-O.P.; project administration, I.-A.M. and F.B. All authors have read and agreed to the published version of the manuscript.

Funding

This research received no external funding.

Data Availability Statement

Data supporting reported results, or data generated during the study, and are free for public use are: 1. ROMPLUS catalogue that can be found at, and downloaded from: http://www.infp.ro/index.php?i=romplus (accessed on 1 September 2022); 2. Seismic bulletins for the Romanian earthquakes, can be found at https://dataportal.infp.ro/ (accessed on 1 September 2022), after selecting one specific earthquake, “produse” (products) and finally, “reb”. The bulletin will appear in txt format and can be downloaded; 3. Vp/Vs using the Romanian seismic bulletins, can be downloaded for a selected area and period of time from the Phenomenal Platform at https://ph.infp.ro/ (accessed on 1 September 2021), from the button “descarca (download) vp/vs”.

Acknowledgments

We thank to UEFISCDI PCE AFROS, number PN-III-P4-ID-PCE-2020-1361, and PED PHENOMENAL PN-III-P2-2.1-PED-2019-1693 projects, NUCLEU MULTIRISC PN 19080102 by MCI, and Manea Liviu for technical and IT support. We are grateful as well to the anonymous reviewers for their useful remarks which helped us to improve the paper.

Conflicts of Interest

The authors declare no conflict of interest.

References

  1. Radulian, M.; Mandrescu, N.; Panza, G.; Popescu, E.; Utale, A. Characterization of Seismogenic Zones of Romania. Pure Appl. Geophys. 2000, 157, 57. [Google Scholar] [CrossRef]
  2. Diaconescu, M. Sisteme de Fracturi Active Crustale pe Teritoriul Romaniei. Ph.D. Thesis, University of Bucharest, Bucharest, Romania, 2017. [Google Scholar]
  3. Radu, C.; Apopei, I.; Utale, A. Contributions to the Study of the Seismicity of Romania. In Progrese in Fizica; Symposium: Cluj-Napoca, Romania, 1980. (In Romanian) [Google Scholar]
  4. Constantinescu, L.; Marza, V. A Computer-compiled and Computer-oriented Catalogue of Romania’s Earthquakes During a Millennium (AD 984—1979). Rev. Roum. Geol. Geophys. Geogr. Ser Geophys. 1980, 24, 171–191. [Google Scholar]
  5. Bala, A.; Raileanu, V.; Dinu, C.; Diaconescu, M. Crustal seismicity and active fault systems in Romania. Rom. Rep. Phys. 2015, 67, 1176–1191. [Google Scholar]
  6. Beşuţiu, L.; Manea, V.; Pomeran, M. Vrancea Seismic Zone as an Unstable Triple Junction: New Evidence from Observations and Numerical Modelling. In Proceedings of the 9th Congress of the Balkan Geophysical Society, Antalya, Turkey, 5–9 November 2017; European Association of Geoscientists & Engineers: Houten, The Netherlands, 2017. [Google Scholar]
  7. Royden, L.H. Evolution of retreating subduction boundaries formed during continental collision. Tectonics 1993, 12, 629–638. [Google Scholar] [CrossRef]
  8. Linzer, H.G. Kinematics of retreating subduction along the Carpathian arc, Romania. Geology 1996, 24, 167–170. [Google Scholar] [CrossRef]
  9. Gîrbacea, R.; Frisch, W. Slab in the wrong place: Lower lithospheric mantle delamination in the last stage of the Eastern Carpathian subduction retreat. Geology 1998, 26, 611–614. [Google Scholar] [CrossRef]
  10. Knapp, J.; Asencio, E.; Owens, T.; Helffrich, G. Integration of passive and active source seismology: Mapping lithospheric structure beneath Scotland. In Proceedings of the AGU Fall Meeting, San Francisco, CA, USA, 5–10 December 2005. [Google Scholar]
  11. Fillerup, M.A.; Knapp, J.H.; Knapp, C.C.; Raileanu, V. Mantle earthquakes in the absence of subduction? Continental delamination in the Romanian Carpathians. Lithosphere 2010, 2, 333–340. [Google Scholar] [CrossRef] [Green Version]
  12. Sperner, B.; Lorenz, F.; Bonjer, K.; Hettel, S.; Müller, B.; Wenzel, F. Slab break-off–abrupt cut or gradual detachment? New insights from the Vrancea Region (SE Carpathians, Romania). Terra Nova 2001, 13, 172–179. [Google Scholar] [CrossRef]
  13. Gvirtzman, Z. Partial detachment of a lithospheric root under the southeast Carpathians: Toward a better definition of the detachment concept. Geology 2002, 30, 51–54. [Google Scholar] [CrossRef]
  14. Göğüş, O.H.; Pysklywec, R.N.; Faccenna, C. Postcollisional lithospheric evolution of the Southeast Carpathians: Comparison of geodynamical models and observations. Tectonics 2016, 35, 1205–1224. [Google Scholar] [CrossRef]
  15. Ismail-Zadeh, A.; Panza, G.; Naimark, B. Stress in the descending relic slab beneath the Vrancea region, Romania. Pure Appl. Geophys. 2000, 157, 111–130. [Google Scholar] [CrossRef]
  16. Lorinczi, P.; Houseman, G. Lithospheric gravitational instability beneath the Southeast Carpathians. Tectonophysics 2009, 474, 322–336. [Google Scholar] [CrossRef]
  17. Trifu, C.I.; Radulian, M. Asperity distribution and percolation as fundamentals of an earthquake cycle. Phys. Earth Planet. Inter. 1989, 58, 277–288. [Google Scholar] [CrossRef]
  18. Oncescu, M.; Marza, V.I.; Rizescu, M.; Popa, M. The Romanian Earthquake Catalogue between 984–1997. In Vrancea Earthquakes: Tectonics, Hazard and Risk Mitigation; Wenzel, F., Ed.; Springer: Dordrecht, The Netherlands, 1999; pp. 43–47. [Google Scholar]
  19. Purcaru, G. The Vrancea, Romania, earthquake of March 4, 1977—A quite successful prediction. Phys. Earth Planet. Inter. 1979, 18, 274–287. [Google Scholar] [CrossRef]
  20. Enescu, D. New Data Regarding the Periodicity of Vrancea Earthquakes and Attempts to Give a Tectonophysical Explanation of this Periodicity. Stud. Res. Geophys. 1983, 21, 24–30. (In Romanian) [Google Scholar]
  21. Enescu, D.; Enescu, B.D. Possible Cause-Effect Relationships Between Vrancea (Romania) Earthquakes and Some Global Geophysical Phenomena. Nat. Hazards 1999, 19, 233–245. [Google Scholar] [CrossRef]
  22. Kirschvink, J.L. Earthquake Prediction by Animals: Evolution and Sensory Perception. Bull. Seismol. Soc. Am. 2000, 90, 312–323. [Google Scholar] [CrossRef] [Green Version]
  23. Moldovan, I.A.; Constantin, A.P.; Biagi, P.F.; Danila, D.T.; Moldovan, A.S.; Dolea, P.; Toader, V.E.; Maggipinto, T. The development of the romanian VLF/LF monitoring system as part of the international network for frontier research on earthquake precursors (INFREP). Rom. J. Phys. 2015, 60, 1203–1217. [Google Scholar]
  24. Nimiya, H.; Ikeda, T.; Tsuji, T. Spatial and temporal seismic velocity changes on Kyushu Island during the 2016 Kumamoto earthquake. Sci. Adv. 2017, 3, e1700813. [Google Scholar] [CrossRef] [Green Version]
  25. Ikeda, T.; Tsuji, T. Temporal change in seismic velocity associated with an offshore MW 5.9 Off-Mie earthquake in the Nankai subduction zone from ambient noise cross-correlation. Prog. Earth Planet. Sci. 2018, 5, 62. [Google Scholar] [CrossRef]
  26. Adams, R.D. The Haicheng, China, earthquake of 4 February 1975: The first successfully predicted major earthquake. Earthq. Eng. Struct. Dyn. 1976, 4, 423–437. [Google Scholar] [CrossRef]
  27. Neagoe, C.; Manea, L.M.; Marmureanu, A.; Ionescu, C. A Review of Seismic Monitoring in Romania: Improved earthquake detection network capabilities. Geophys. Res. Abstr. 2019, 21, EGU2019-14427. [Google Scholar]
  28. Vidale, J.E.; Li, Y.G. Damage to the shallow Landers fault from the nearby Hector Mine earthquake. Nature 2003, 421, 524–526. [Google Scholar] [CrossRef]
  29. Minato, S.; Tsuji, T.; Ohmi, S.; Matsuoka, T. Monitoring seismic velocity change caused by the 2011 Tohoku-oki earthquake using ambient noise records. Geophys. Res. Lett. 2012, 39, L09309. [Google Scholar] [CrossRef] [Green Version]
  30. Brenguier, F.; Campillo, M.; Takeda, T.; Aoki, Y.; Shapiro, N.M.; Briand, X.; Emoto, K.; Miyake, H. Mapping pressurized volcanic fluids from induced crustal seismic velocity drops. Science 2014, 345, 80–82. [Google Scholar] [CrossRef]
  31. Aggarwal, Y.P.; Sykes, L.R.; Armbruster, J.; Sbar, M.L. Premonitory changes in seismic velocities and prediction of earthquakes. Nature 1973, 241, 101–104. [Google Scholar] [CrossRef]
  32. Kanamori, H.; Chung, W. Temporal changes in P-wave velocity in southern California. Tectonophysics 1974, 23, 67. [Google Scholar] [CrossRef]
  33. Hobiger, M.; Wegler, U.; Shiomi, K.; Nakahara, H. Single-station crosscorrelation analysis of ambient seismic noise: Application to stations in the surroundings of the 2008 Iwate-Miyagi Nairiku earthquake. Geophys. J. Int. 2014, 198, 90–109. [Google Scholar] [CrossRef] [Green Version]
  34. Dung, S.-S.; Ge, H.-C.; Lo, Y.-L.; Hsu, C.-Y.; Wang, F.-C. Earthquakes prediction of on the basis of Vp/Vs variations—A case history. Phys. Earth Planet. Inter. 1979, 18, 309–318. [Google Scholar] [CrossRef]
  35. Wang, C.Y. Variations of Vp and Vs in granite premonitory to shear rupture and stick-slip sliding: Application earthquake prediction. Geophys. Res. Lett. 1975, 2, 309–311. [Google Scholar] [CrossRef]
  36. Petrescu, L.; Borleanu, F.; Radulian, M.; Ismail-Zadeh, A.; Maţenco, L. Tectonic regimes and stress patterns in the Vrancea Seismic Zone: Insights into intermediate-depth earthquake nests in locked collisional settings. Tectonophysics 2021, 799, 228688. [Google Scholar] [CrossRef]
  37. Placinta, A.O.; Borleanu, F.; Popescu, E.; Radulian, M.; Munteanu, I. Earthquake source properties of a lower crust sequence and associated seismicity perturbation in the SE Carpathians, Romania, Collisional Setting. Acoustics 2021, 3, 270–296. [Google Scholar] [CrossRef]
  38. Gupta, I.N. Seismic velocities in rock subjected to axial loading up to shear fracture. J. Geophys. Res. 1973, 78, 6936–6942. [Google Scholar] [CrossRef]
  39. Wadati, K. On the Travel Times of Earthquake Waves, Part II. Geophys. Mag. 1933, 7, 101–111. [Google Scholar]
  40. Popa, M.; Chircea, A.; Dinescu, R.; Neagoe, C.; Grecu, B. Romanian Earthquake Catalogue (ROMPLUS), Version 1; Mendeley Data: Amsterdam, The Netherlands, 2022. [Google Scholar] [CrossRef]
  41. Mucuta, D.M.; Knapp, C.C.; Knapp, J.H. Constraints from Moho geometry and crustal thickness on the geodynamic origin of the Vrancea Seismogenic Zone (Romania). Tectonophysics 2006, 420, 23–36. [Google Scholar] [CrossRef]
  42. Petrescu, L.; Stuart, G.; Tataru, D.; Grecu, B. Crustal structure of the Carpathian Orogen in Romania from receiver functions and ambient noise tomography: How craton collision, subduction and detachment affect the crust. Geophys. J. Int. 2019, 218, 163–178. [Google Scholar] [CrossRef]
  43. Radulian, M.; Bonjer, K.P.; Popa, M.; Popescu, E. Seismicity patterns in SE Carpathians at crustal and subcrustal domains: Tectonic and geodynamic implications. In Proceedings of the International Symposium on Strong Vrancea Earthquakes and Risk Mitigation, Bucharest, Romania, 4–6 October 2007. [Google Scholar]
  44. Kennett, B.L.N.; Engdahl, E.R. Traveltimes for global earthquake location and phase identification. Geophys. J. Int. 1991, 105, 429–465. [Google Scholar] [CrossRef] [Green Version]
  45. Bratt, S.R.; Nagy, W. The LocSAT Program; Science Applications International Corporation (SAIC): San Diego, CA, USA, 1991. [Google Scholar]
  46. Koulakov, I. High-frequency P and S velocity anomalies in the upper mantle beneath Asia from inversion of worldwide traveltime data. J. Geophys. Res. 2011, 116, B04301. [Google Scholar]
  47. Mitrofan, H.; Anghelache, M.A.; Chitea, F.; Damian, A.; Cadicheanu, N.; Vişan, M. Lateral detachment in progress within the Vrancea slab (Romania): Inferences from intermediate-depth seismicity patterns. Geophys. J. Int. 2016, 205, 864–875. [Google Scholar] [CrossRef]
  48. Placinta, A.O.; Popescu, E.; Borleanu, F.; Radulian, M.; Popa, M. Analysis of source properties for the earthquake sequences in the south-western Carpathians (Romania). Rom. Rep. Phys. 2016, 68, 1240–1258. [Google Scholar]
  49. Ghita, C.; Diaconescu, M.; Raicu, R.; Moldovan, I.A.; Rosu, G. The analysis of the seismic sequence started on November 22, 2014 based on ETAS model. Rom. Rep. Phys. 2021, 73, 708. [Google Scholar]
  50. Craiu, A.; Ghita, C.; Craiu, M.; Diaconescu, M.; Mihai, M.; Ardeleanu, L. The source mechanism of the seismic events during the sequence of the moderate-size crustal earthquake of November 22, 2014 of Vrancea region (Romania). Ann. Geophys. 2019, 61, SE666. [Google Scholar] [CrossRef]
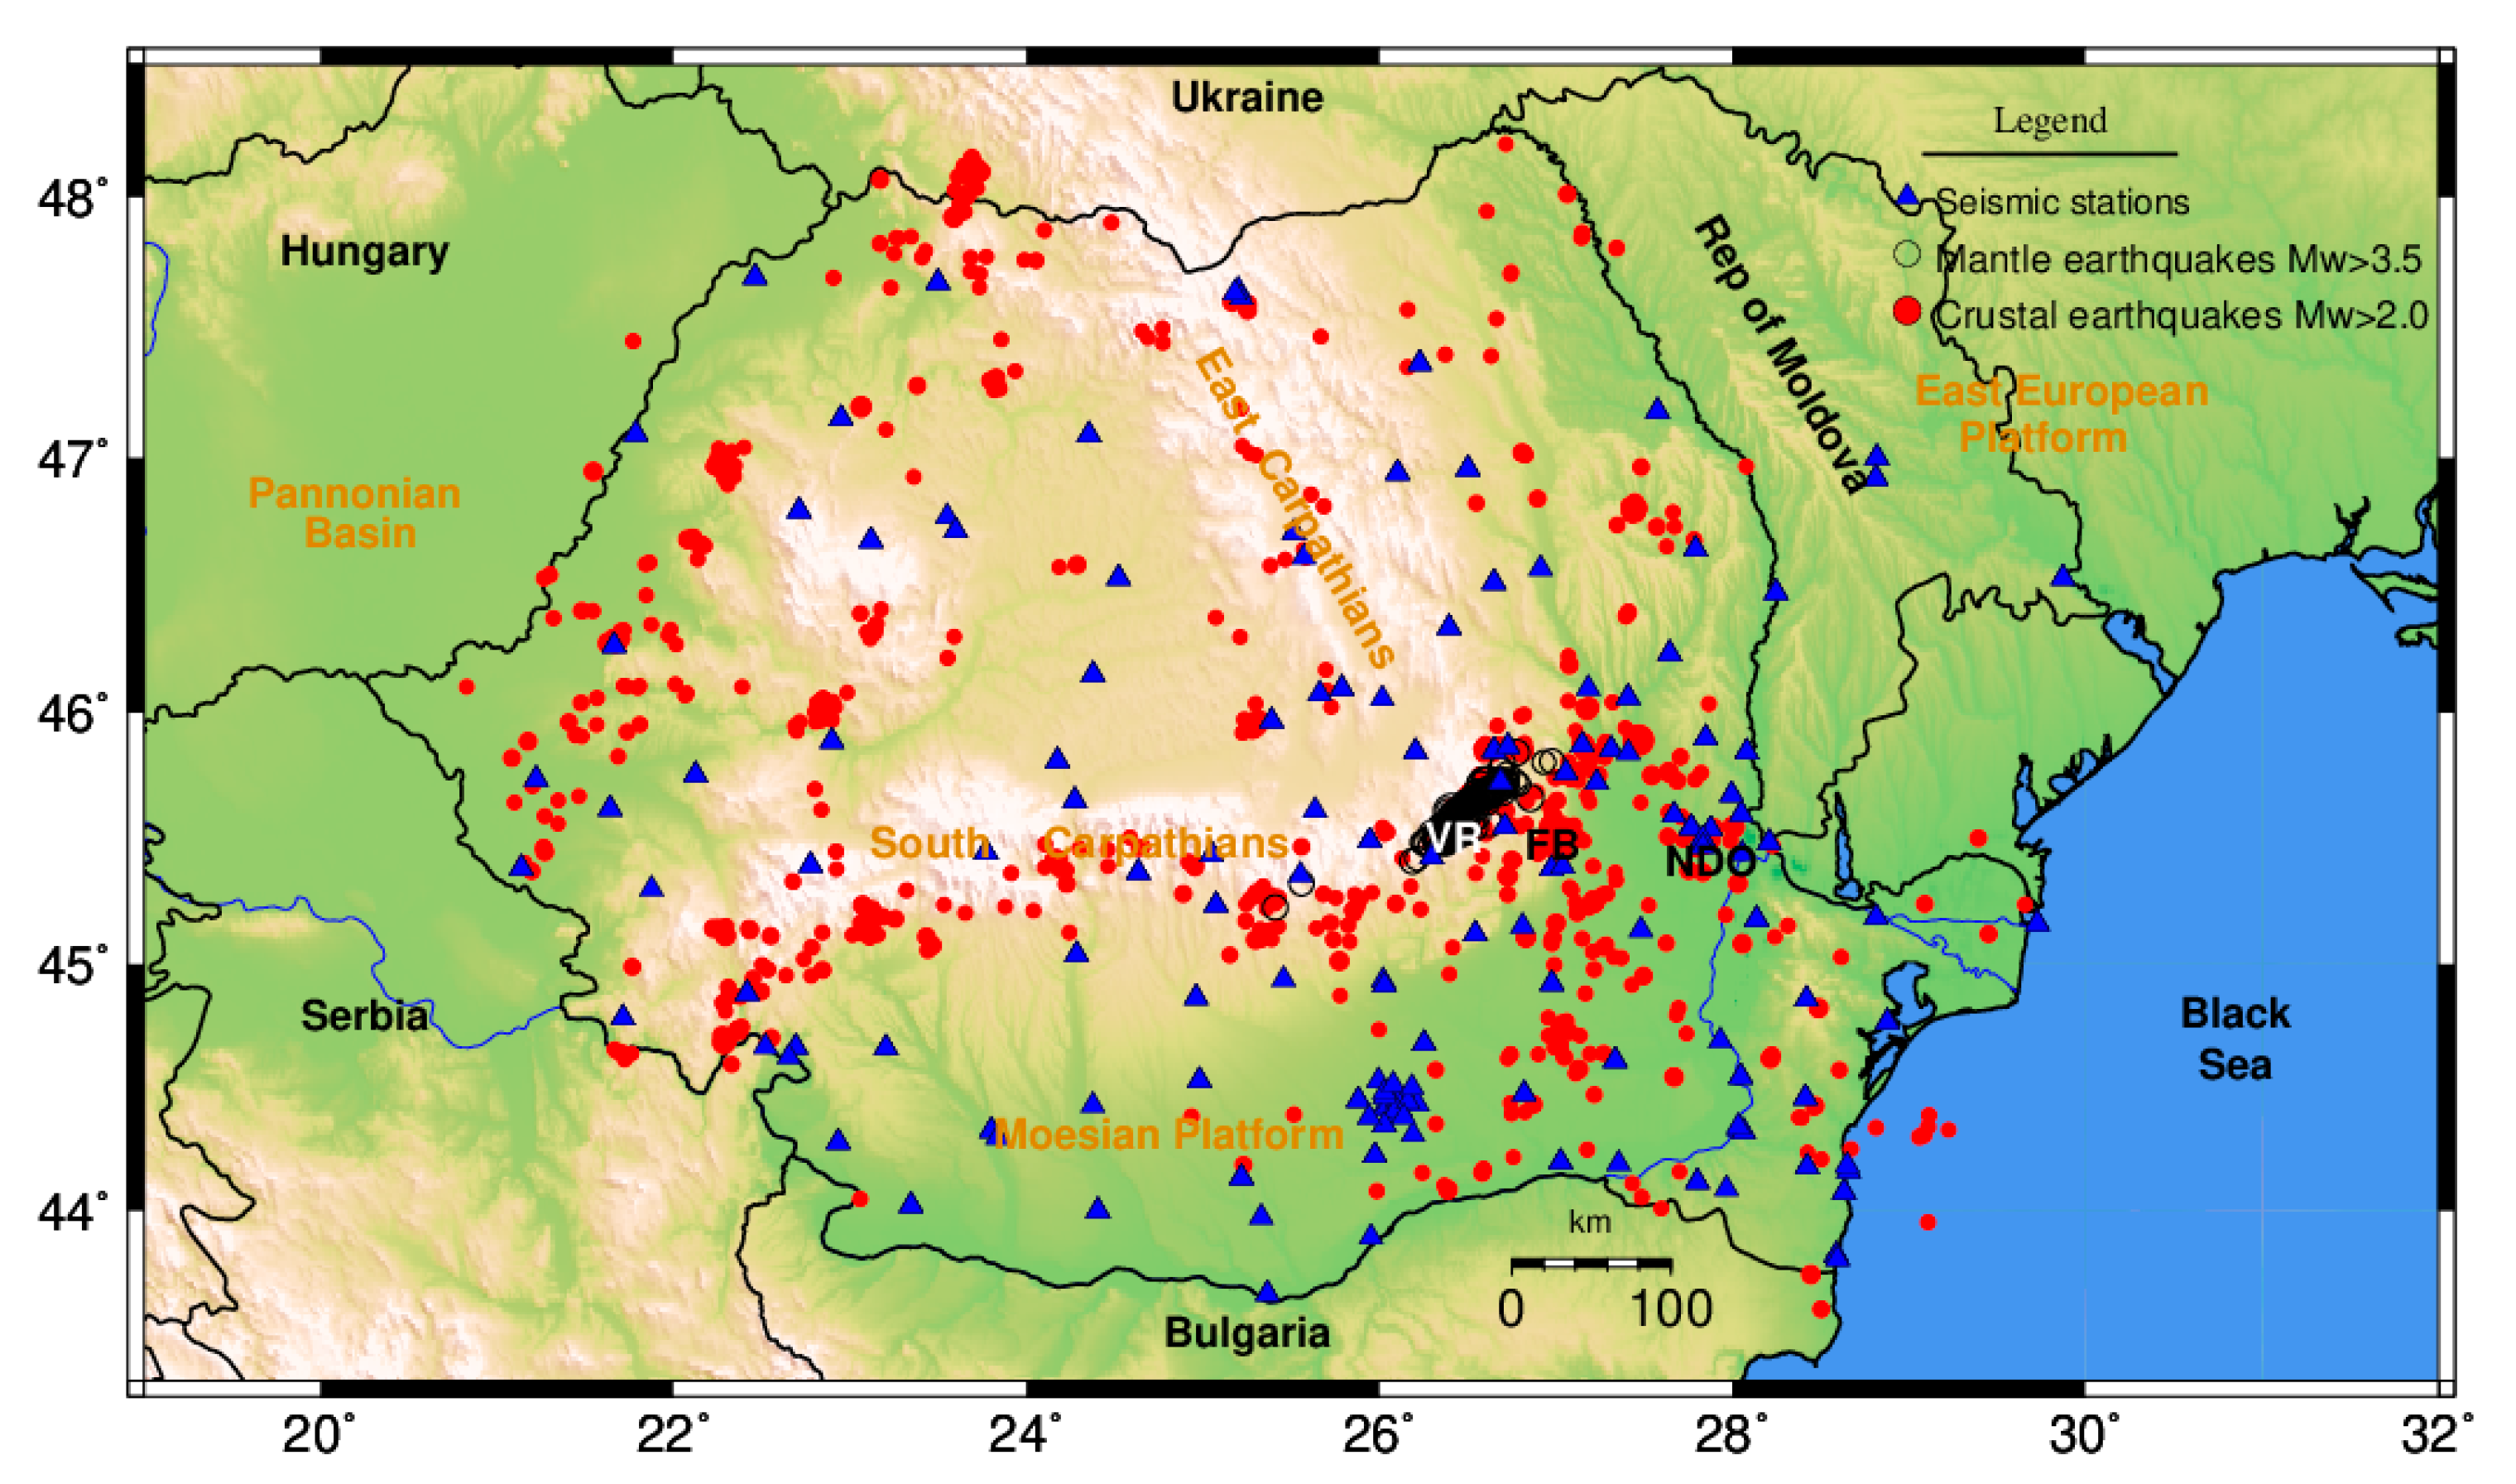
Figure 1. Distribution of seismic stations and epicenters associated with crustal (Mw > 2.0) and intermediate depth (Mw > 3.5) earthquakes, selected from the ROMPLUS catalogue [18] between January 2015 and October 2020. The main tectonic features are also displayed. The abbreviations are as follows: VR—Vrancea region, FB—Focsani Basin, NDO—North Dobrogean Orogen.
Acoustics 04 00057 g001
Figure 2. Example of Wadati diagram of a moderate sized (ML = 5.7) earthquake that occurred on 22 November 2014 at the northeastern edge of the Focsani Basin (Marasesti area, see [37]). The slope of the linear fit indicates the correlation of P to S-phase velocities, as a = Vp/Vs − 1. The intersection between the linear fit and P arrival time indicates the origin time of the earthquake (t0).
Acoustics 04 00057 g002
Figure 3. Epicenters of the selected earthquakes and seismic station distribution in the epicentral region. The symbols of the two earthquakes are colored according to depth, and their size is proportional to magnitude. Cities near the epicenters are represented with black symbols. The inset shows the location of the study region on the map of Romania.
Acoustics 04 00057 g003
Figure 4. (a). Distribution of epicenters (size function of magnitude and color, according to depth) associated with subcrustal earthquakes (ML ≥ 2.5) produced during the period 1 April 2018–30 April 2019. The vertical profile A–A’ is shown in red. The inset shows the location of the study region on the map of Romania. (b) Vertical cross-sections along the A–A’ profile and hypocenters distribution within a distance of ±1.0 deg. relative to the same profile.
Acoustics 04 00057 g004
Figure 5. Distribution of Vp/Vs ratios as a function of: number of events (top), earthquake depth (middle), and number of seismic phases used in the location process (bottom).
Acoustics 04 00057 g005
Figure 6. Vp/Vs variation over time, in the period 1 April 2018–30 April 2019, (a) determined using data from stations located at epicentral distances less than 1-degree and (b) determined with all available data. Significant earthquakes produced during the specified time period are marked with red vertical lines.
Acoustics 04 00057 g006
Figure 7. Epicenter distribution of selected earthquakes, colored according to the time of occurrence relative to the main earthquake (22 November 2014; 19:14 GMT). Cold colors depict earthquakes that occurred before the main event, whereas warm colors show the earthquakes produced after the main event. The epicenters of subcrustal earthquakes (H > 50 km) are also depicted; those that occurred prior to the main earthquake are indicated in cyan, while those that occurred after the main earthquake are marked in black. Black dotted lines mark the area close to the Marasesti city (left). A zoom in showing the epicenters distribution of crustal earthquakes close to the Marasesti city (right). The size of the symbols is proportional to the magnitude of the earthquake.
Acoustics 04 00057 g007
Figure 8. Vp/Vs temporal variation, as determined by the analysis of crustal earthquakes that occurred in the Focsani Basin and surrounding areas during the selected time period (1 April 2014–30 June 2015). Significant earthquakes produced during the specified period are marked with red vertical lines.
Acoustics 04 00057 g008
Figure 9. Vp/Vs temporal variation as determined by analysis of earthquakes that occurred in the Vrancea and surrounding areas during the specified time period (1 April 2018–30 April 2019) within a depth interval of 120 to 150 km. Significant earthquakes produced during the specified period are marked with red vertical lines.
Acoustics 04 00057 g009
Figure 10. Vp/Vs distribution associated with selected subcrustal earthquakes (ML ≥ 2.5) that occurred in the Vrancea region from 1 April 2018 to 30 April 2019. The size of the symbols is proportional to the magnitude of the earthquake. The inset shows the location of the study region on the map of Romania.
Acoustics 04 00057 g010
Figure 11. Vp/Vs temporal variation, as determined by the analysis of earthquakes that occurred in the Focsani Basin and surrounding areas during the specified time period (1 April 2014–30 June 2015), with ML ≥ 1.9 (top) and ML ≥ 2.5 (bottom). Significant earthquakes produced during the specified period are marked with red vertical lines.
Acoustics 04 00057 g011
Publisher’s Note: MDPI stays neutral with regard to jurisdictional claims in published maps and institutional affiliations.