
Experimental Study of the Acoustic Cavitation Threshold in Sunflower Oil Depending on Different Impact Regime

Mathematics and Mechanics Faculty, Saint Petersburg State University, Universitetskaya Nab. 7/9, Saint Petersburg 199034, Russia
*
Author to whom correspondence should be addressed.
Acoustics 2022, 4(4), 894-902; https://doi.org/10.3390/acoustics4040054
Submission received: 31 August 2022
/
Revised: 6 October 2022
/
Accepted: 10 October 2022
/
Published: 17 October 2022
Abstract
:In engineering problems associated with acoustic wave propagation in a liquid, cavitation onset could be an adverse phenomenon, or, conversely, a required process. In both cases, knowledge of the ultrasonic parameters that lead to cavitation onset under given external conditions is relevant and necessary for solving both fundamental and practical problems. The present work proposes experimental results of studying the threshold of acoustic cavitation, which was implemented at different ultrasound frequencies with a change in external pressure, power of transducer and temperature of the liquid. The experiments were carried out for sunflower oil. The test findings demonstrated how the cavitation threshold changes with varying the power of ultrasound exposure in time. In addition, the effect of external pressure fluctuations on cavitation onset was investigated. The obtained results contribute to the understanding of cavitation processes and could be necessary for verification of theoretical models.
1. Introduction
Acoustic cavitation is a complex dynamic process that is highly sensitive to the presence of gas-vapor nuclei and other inhomogeneities in a liquid medium [1,2]. The cavitation process has been widely studied for many decades from various perspectives [3,4,5,6,7]. Cavitation is of relevance from a fundamental standpoint because of liquid–vapor phase transitions, which occur in a dynamic mode under ultrasonic treatment [8,9,10]. Bubble behaviour, transformation and collapse, flow movement, and micro-jets are also studied [11,12,13,14]. The practical interest in this field of research stems from cavitation’s side effects, which include erosion, degassing, filter cleaning, and more. In this regard, cavitation has both negative effects, such as erosion [13,15], which tend to be eliminated or significantly reduced, and positive improvements in processes like cleaning surfaces, disinfecting water through the destruction of viruses and bacteria, drug delivery, etc. [7,16,17]. The ability to predict and then control cavitation in a liquid is essential in all these cases.
Now, existing theoretical models cannot accurately and fully predict cavitation when external conditions and fluid parameters are taken into account. According to experimental studies [4,18,19,20,21], cavitation depends on the amplitude–frequency characteristics of ultrasound, liquid properties, and the condition of external loading. However, the experimental results may have significant data scatter because cavitation is sensitive to inhomogeneities in fluid. It also complicates the development of theoretical models, requiring the introduction of more parameters to provide a more accurate description of cavitation. As an outcome, a higher number of experiments in a wide range of ultrasonic amplitude–frequency characteristics and other external parameters will lead to a deeper understanding of the processes that occur during cavitation. Furthermore, the development of experimental procedures is essential for the advancement of cavitation’s applicability in engineering and practical applications. Such experimental studies will aid in identifying the ultrasonic parameter ranges and other external factors that lead to cavitation generation.
In this paper, cavitation in sunflower oil is investigated. The following reasoning influences the choice of fluid. Ultrasound is used in a variety of applications in food science and technology. For example, it is employed in various processes including sterilization, preservation, extraction, cleaning, cutting, filtering and many others where ultrasound is shorten processing times and increase productivity [22,23,24]. Among numerous applications is the ultrasound-assisted extraction (UAE) technique which reduces the time required to extract edible oils [25,26,27].
In this technique, shredded raw materials are mixed with a solvent and then sonicated with ultrasound that creates cavitation in the mixture. Subsequently, shear forces induced by bubble collapse near plant membranes may cause microfractures in the tissues of the plants [27]. This can lead to improved extraction efficiency. Simultaneously, research [28] found that cavitation can degrade the flavor and quality of sunflower oil, owing to lipid oxidation and degradation, which also causes cloudiness. Therefore, it is necessary to apply such ultrasonic action when extracting oil in order to prevent cavitation of the finished product while simultaneously generating it in the mixture of raw product and solvent.
Oils, in addition to being the final product of extraction, may be employed as a solvent. In work [29], sunflower oil was applied as a substitute to organic solvents in the UAE of carotenoids from carrot. The authors claim that the UAE using sunflower as solvent has obtained the highest β-carotene yield in comparison with conventional solvent extraction using hexane as solvent. Such application of sunflower oil, on the contrary, requires ultrasonic treatment, which will lead to cavitation. Thus, it is essential to investigate the cavitation threshold in food products such as sunflower oil to avoid or, conversely, use this phenomenon in processes.
The paper presents experimental results on measuring the threshold characteristics of sunflower oil cavitation. The tests were carried out in the low-frequency ultrasound range for four different frequencies. The oil was subjected to ultrasonic treatment along with an increase in the transducer power or with a change in external pressure from 1 to 5 bar. The tests were conducted at both room and enhanced temperatures (about 50 °C). The obtained results for the two loading modes were compared. In particular, the paper presents the dependence of the cavitation threshold on external pressure and temperature. It is demonstrated that by varying the external pressure under active ultrasonic action, cavitation may be stopped and restarted.
2. Materials and Methods
A study on the cavitation onset for sunflower oil was carried out. The oil was refined, frozen, deodorized, first grade, and complied with GOST 1129-2013 (the Russian standard). According to the standard, the oil was transparent without sediment; it did not contain non-fat impurities, phosphorus-containing substances, or soap. The mass fraction of moisture and volatile substances did not exceed 0.1%. Using a density meter DMA 5000 MCK (Anton Paar GmbH, Graz, Austria), the relationship between oil density and temperature was discovered. The measurement results are shown in Figure 1.
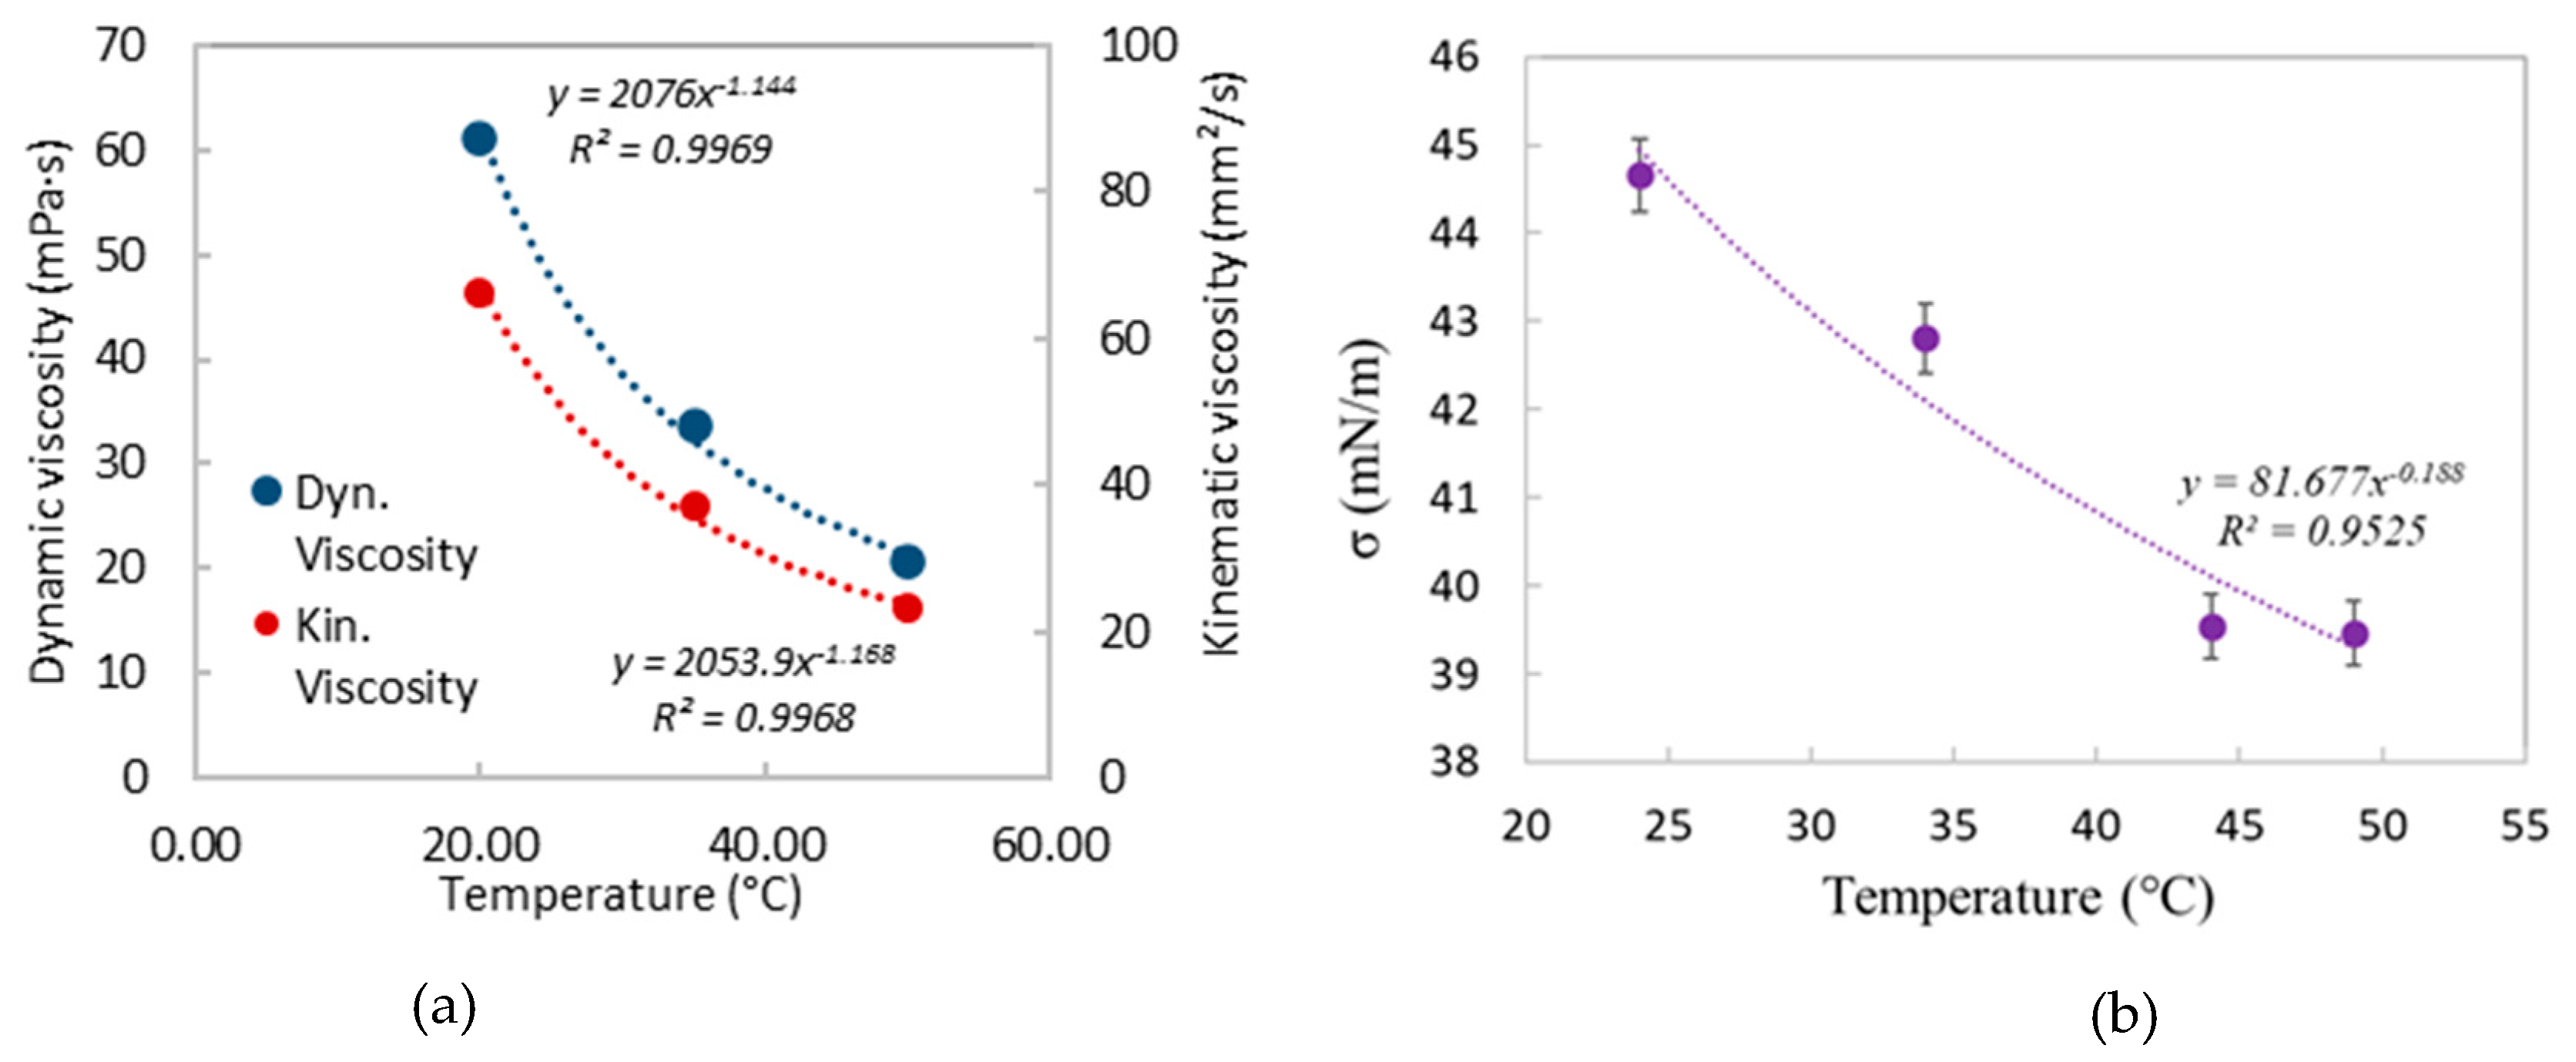
Figure 2 depicts the temperature dependencies of the viscosity and coefficient of the surface tension of the oil. The liquid’s dynamic and kinematic viscosity were measured with an MCR 702 TwinDrive rheometer (Anton Paar GmbH, Graz, Austria), and the surface tension coefficient was calculated using the Du Noüy ring method. The errors in testing the oil’s density and viscosity do not exceed 0.1%.
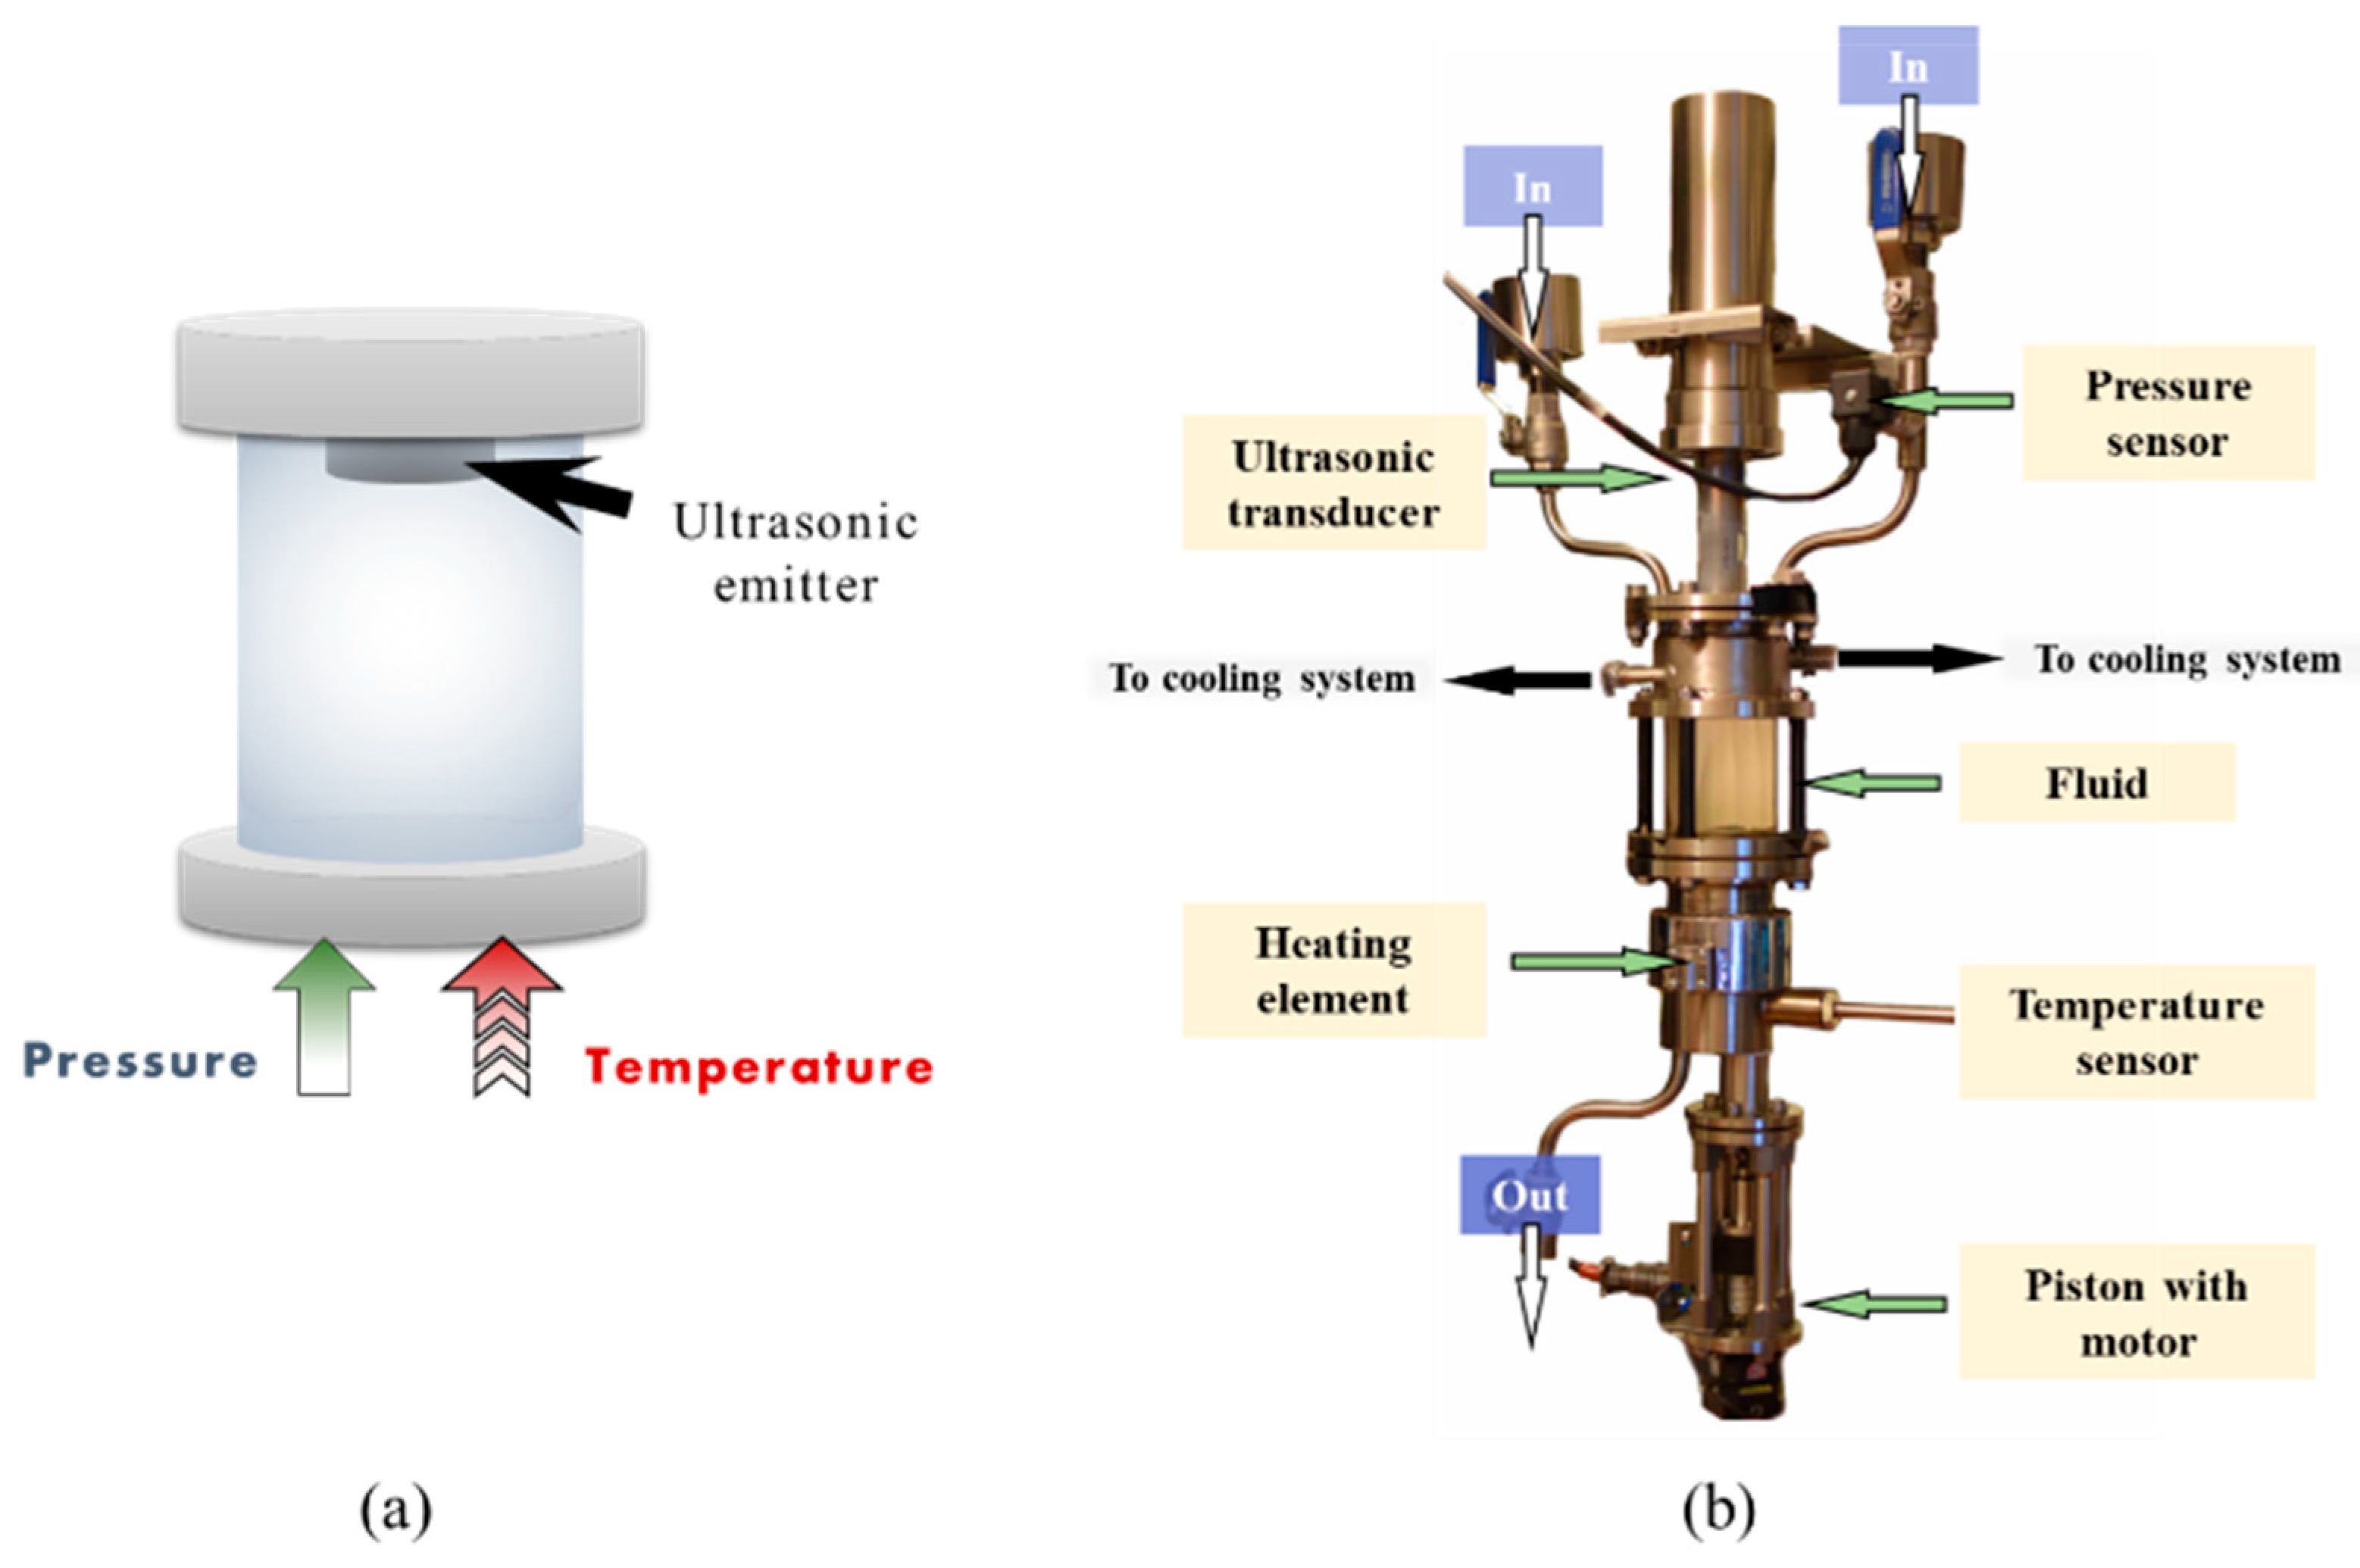
Ultrasonic studies of the liquid were carried out on an installation for producing acoustic cavitation (LLC «Ultrasonic technique — INLAB»). The liquid was tested in a pressurised, temperature-controlled closed reactor (Figure 3). A middle section of the reactor is built of borosilicate glass to observe cavitation. Ultrasonic vibrations were generated through a titanium emitter by magnetostrictive transducers, which were connected to high-frequency electrical energy generators. The resulting mechanical vibrations were transmitted to the emitter, the end of which was immersed in the liquid in the reactor’s top section. The experimental setup included four different ultrasonic transducers, the parameters of which are shown in Table 1 along with the volumes of the reactors. At the bottom of the reactor there was an electric coil heating element with a thermostat, as well as a piston with a motor for changing external pressure. The reactors were equipped with measuring sensors to track and regulate pressure and temperature. All control of the installation parameters was carried out using special software.
Cavitation was visibly registered. The appearance of the first visible bubbles, cavitation small clouds or first formation of bubble chains marked the beginning of cavitation.
Modes of Liquid Loading
Two different modes of loading on the liquid were used to investigate the onset of cavitation in oil. In the first mode, the ultrasonic transducer power increased to 100% in 100 s at a constant external pressure. In the second mode, the external pressure varied in waves as shown in Figure 4b with a maximum value of 5 bar at a fixed power of the ultrasonic transducer.
In the first loading mode, tests were carried out at external pressures of 1, 1.5, 2, and 3 bar. In the second loading mode, when external pressure varies, the transducer power was set at 50% and 75%. All the loading modes described here were carried out at room temperature and increased one, that is, around 50 °C. Each test was done twice or three times before the results were averaged. Also, before each test, the oil was sonicated at a low ultrasound power of 10% and a high pressure of 5 bar. This type of impact does not cause cavitation and allows the vapor-gas bubbles generated during the previous test to dissolve.
3. Results
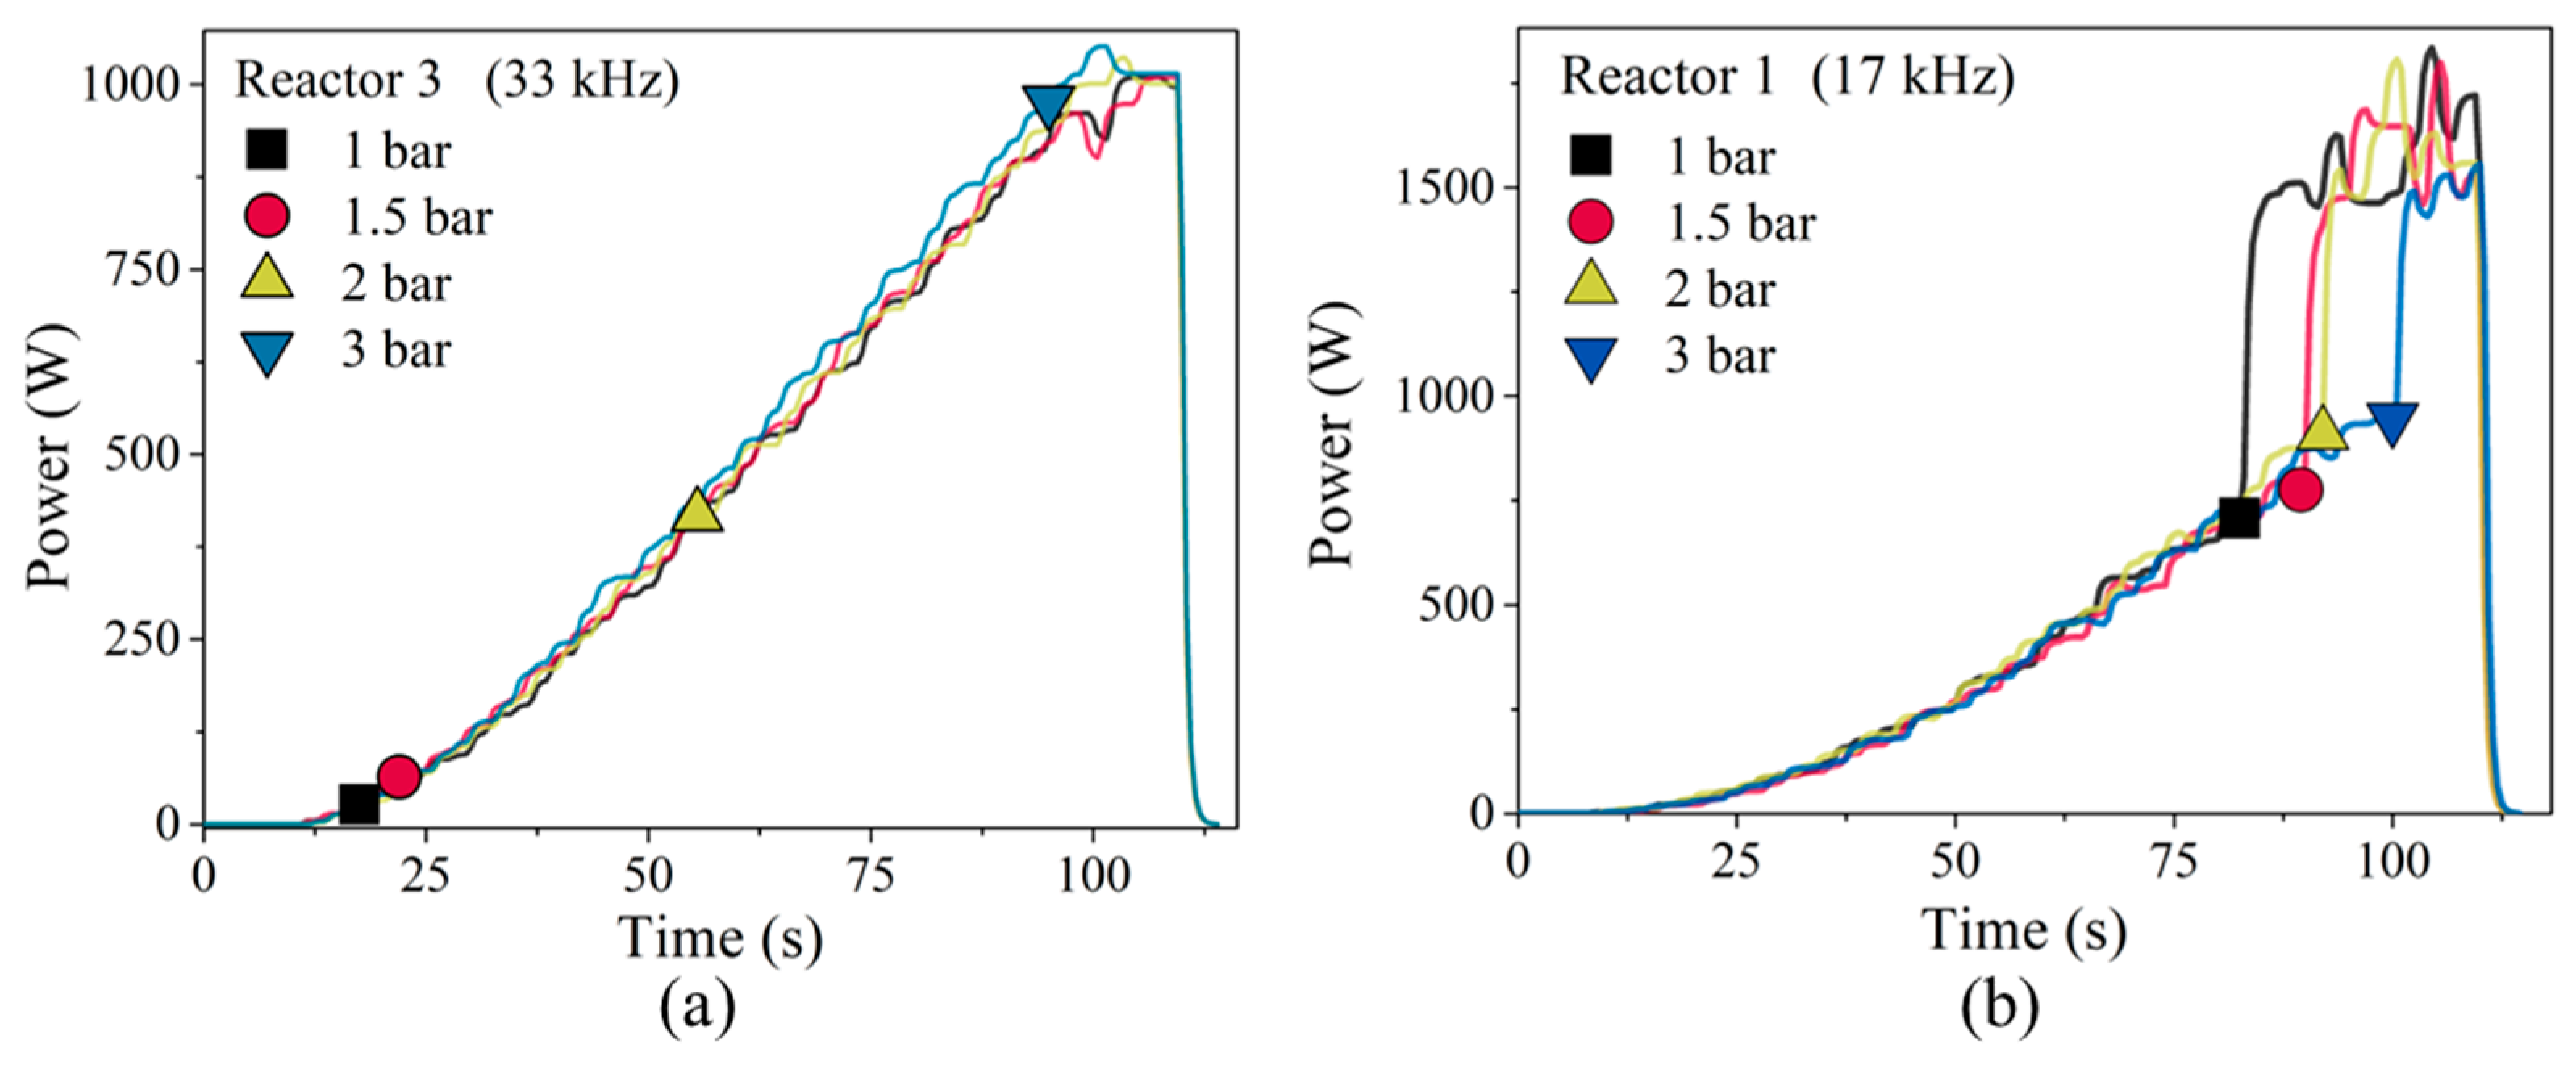
Figure 5 depicts instances of the temporal dependency of the transducer’s power, which rose to a maximum value in 100 s, indicating that the loading mode shown in Figure 4a was implemented. The dots on the graph represent the onset of cavitation. Tests in Figure 5 were performed at room temperature under various external pressures. It can be seen that the rise in power occurred gradually in Reactor 3. An analogous gradual growth was observed in Reactors 2 and 4. However, in Reactor 1 with the beginning of cavitation, there was a sharp increase in power to its maximum value. A similar effect was discussed in the book [6]. It was shown there that such a jump in power can be associated with the onset of intense cavitation. This phenomenon can be used as an indirect signal of cavitation initiation.
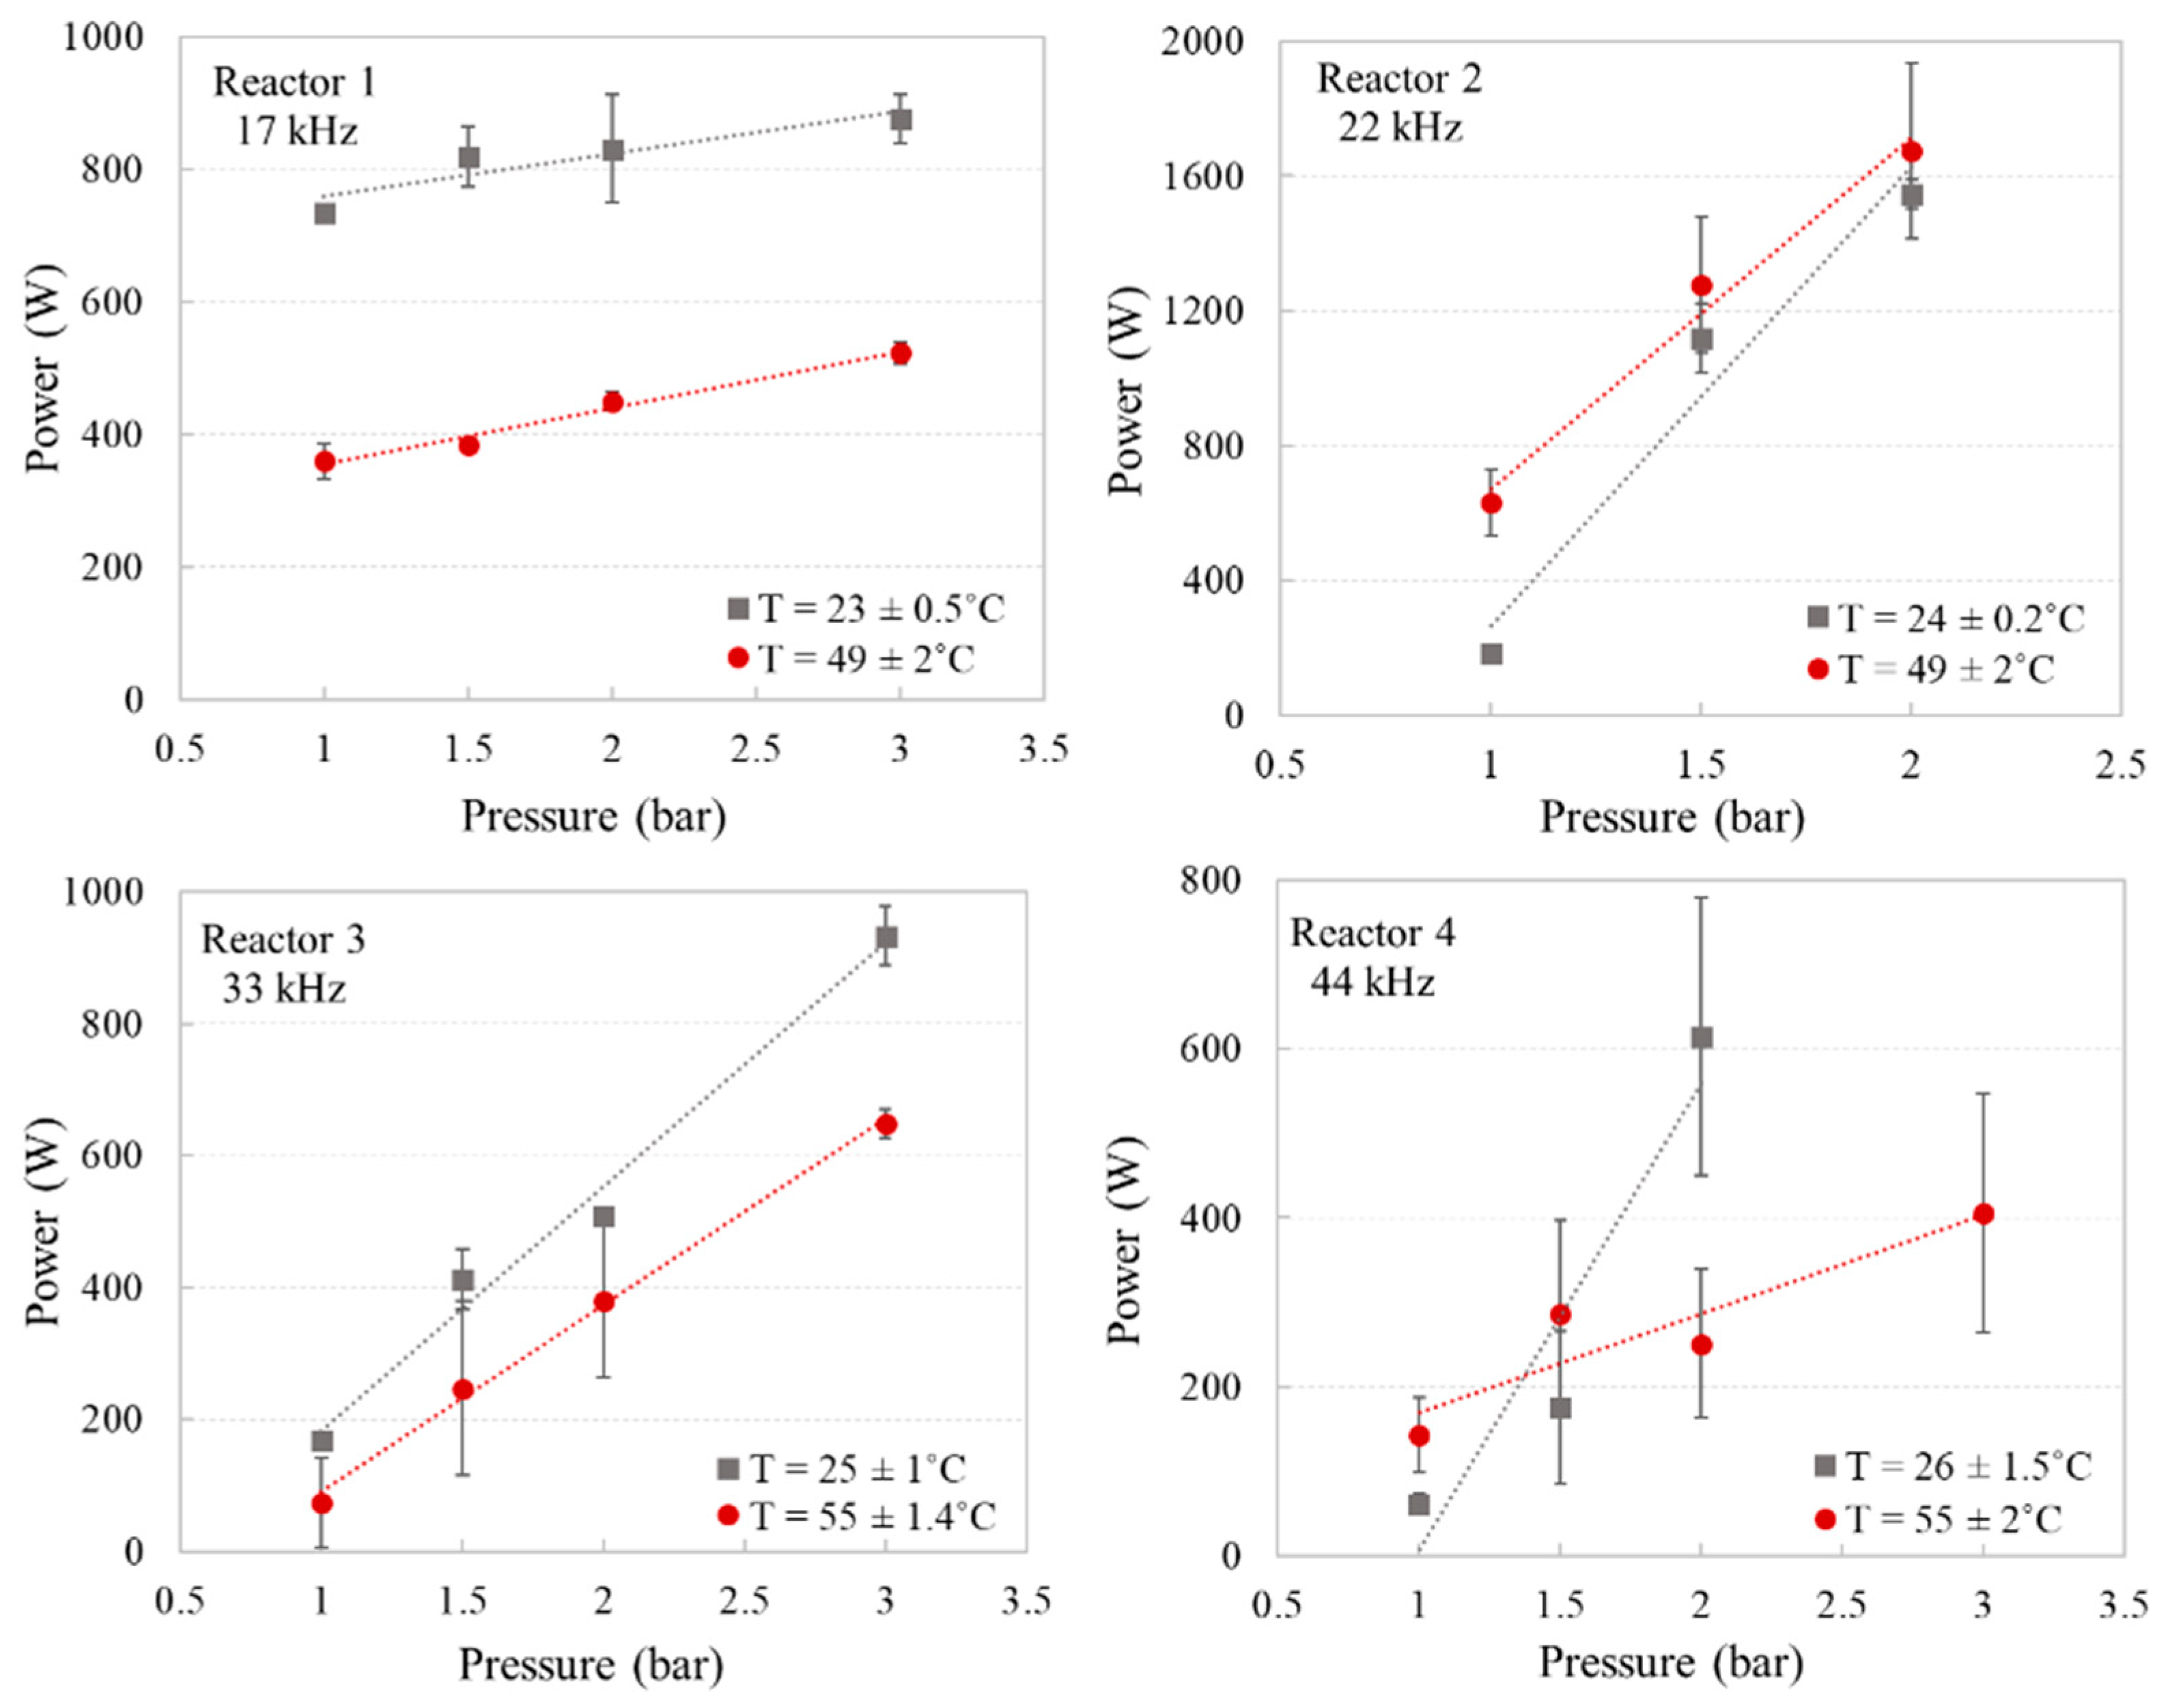
Figure 6 depicts the relationship between the power of the transducer and the external pressure at which cavitation begins. The results are shown for both ambient and enhanced temperatures (around 50 °C). Cavitation was investigated at four different hydrostatic pressures: 1, 1.5, 2, and 3 bar. The absence of values at 3 bar external pressure in Reactor 2 and Reactor 4 at ambient temperature indicates that no cavitation occurred. At such external pressures, the initiation of cavitation requires more powerful ultrasound than our experimental setup can provide. It should also be noted that the decrease in the threshold power in Reactor 3 compared to Reactor 2 is associated with a smaller reactor size and emitter diameter.
The test results show that the rise in external pressure leads to an increase in the power needed to start cavitation. This is similar to the findings of previous cavitation studies [20,30], in which the threshold pressure grows with increasing hydrostatic pressure.
On the other hand, the temperature dependency in Figure 6 differs based on the ultrasonic frequency. For Reactors 1 and 3, there is a decrease in transducer power, leading to cavitation, as temperature increases. This trend is consistent with studies’ observations of liquid cavitation [31,32]. However, in all tests in Reactor 2 and at external pressures of 1 and 1.5 bar in Reactor 4, a higher transducer power for heated oil was required to initiate cavitation, when compared with results obtained at ambient temperature. It should be noted that, except for tests at atmospheric pressure in Reactor 2, such an excess of the cavitation threshold at enhanced temperature is within the margins of error. This leads us to the conclusion that an increase in temperature either reduces or has no effect on the cavitation threshold.
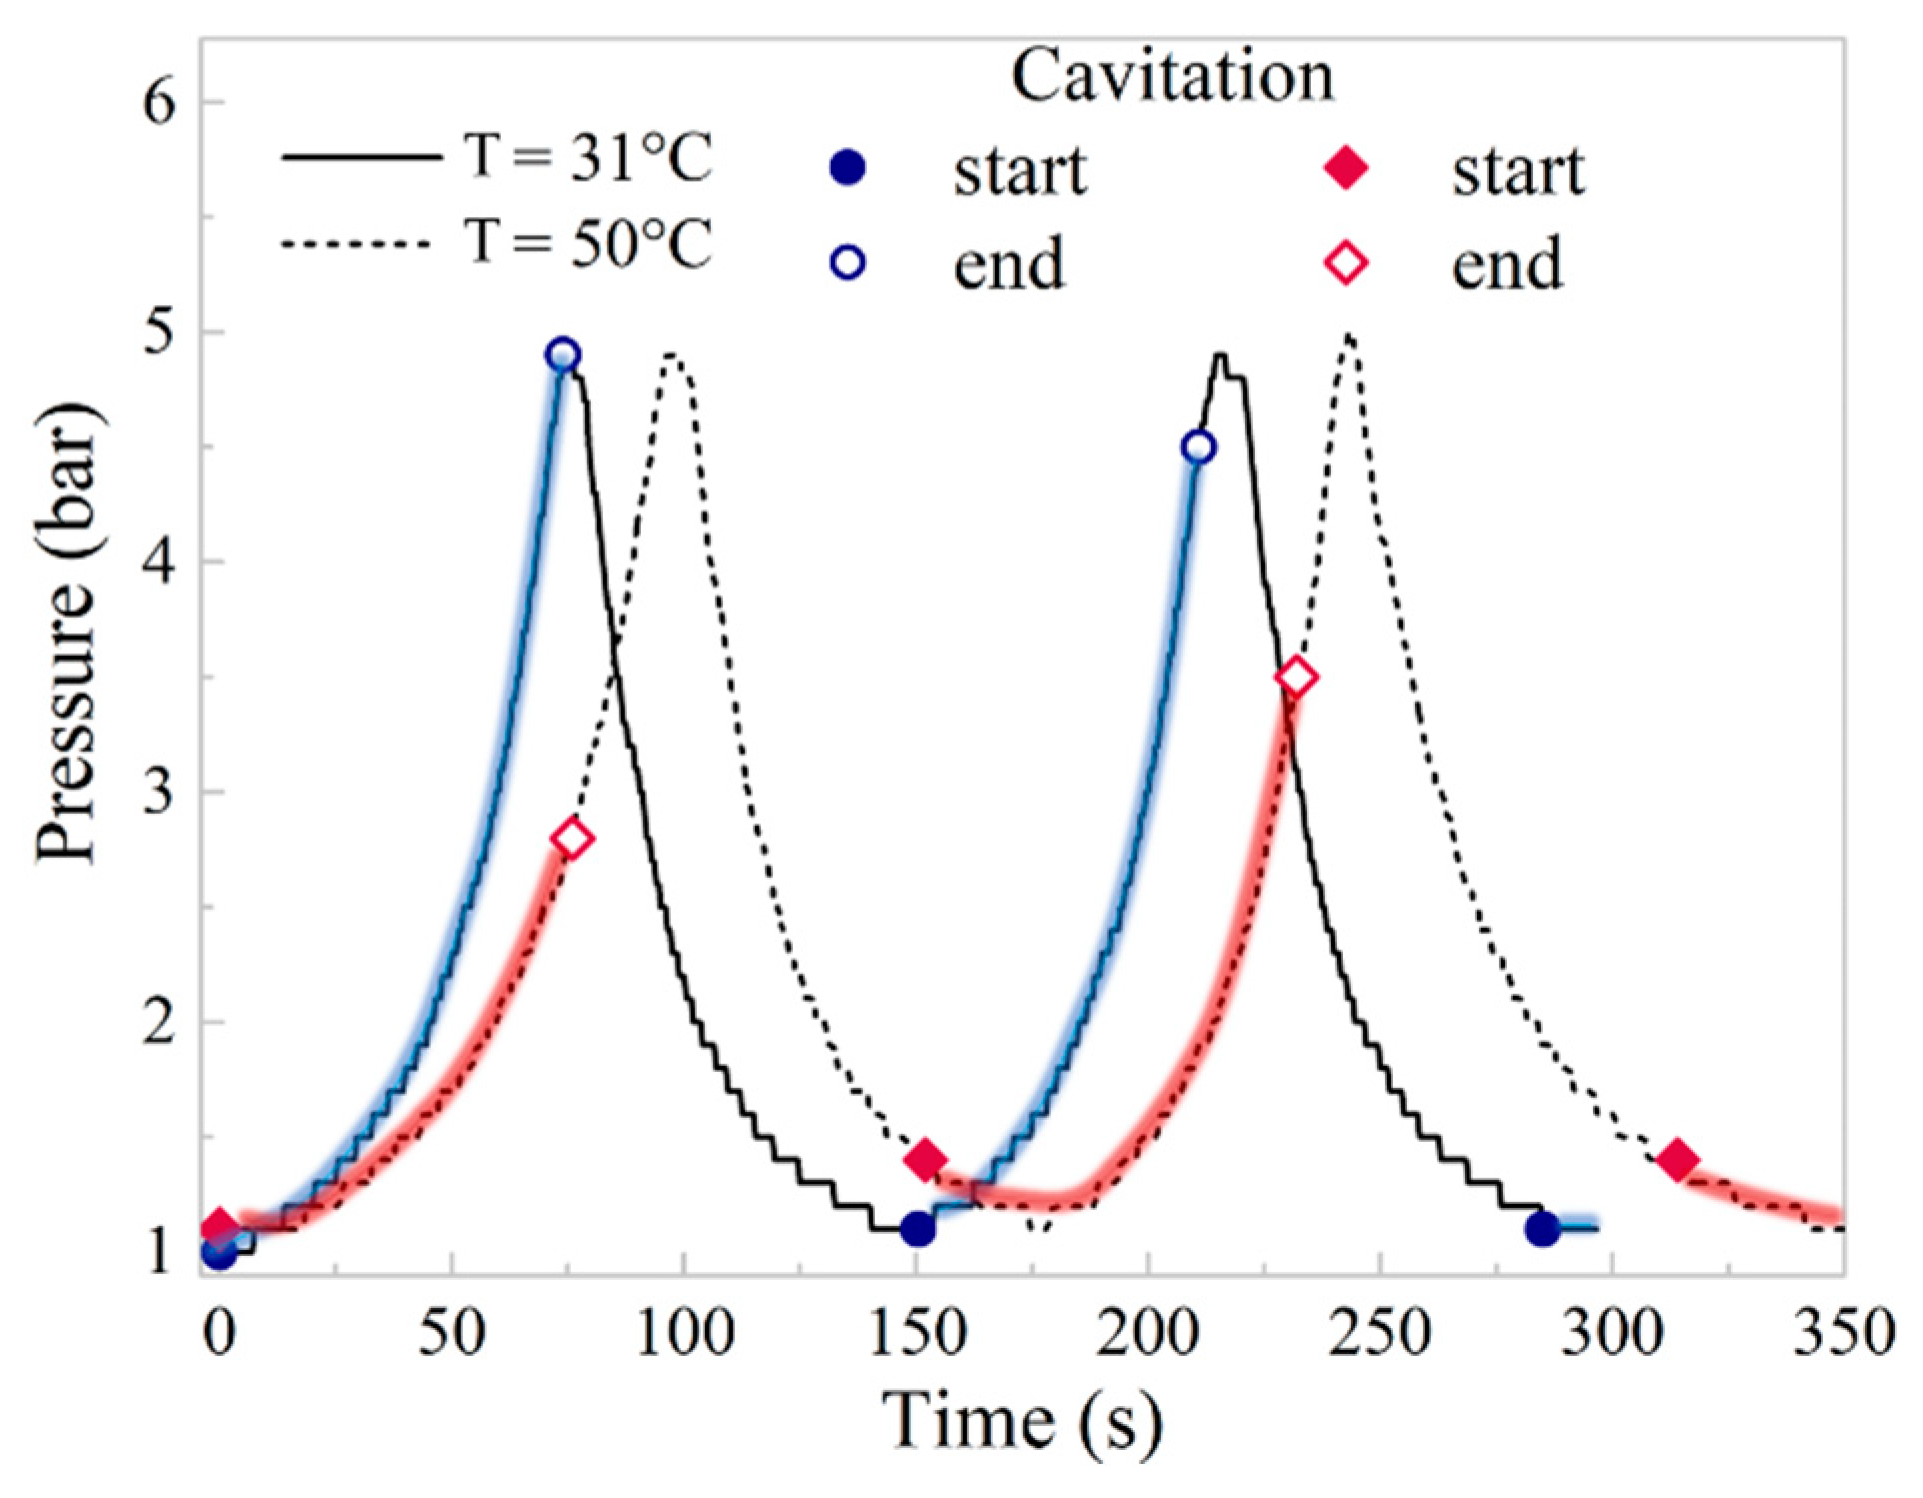
In the second loading mode, the external pressure in the liquid varied while the transducer power remained constant (Figure 4b). The external pressure was increased to 5 bar, then returned to atmospheric pressure, and the process was repeated. Figure 7 depicts an example of such testing, showing an indication of the beginning and end of the cavitation as well as how the pressure fluctuated over time. The red and blue highlighted areas of the curves correspond to the occurrence of visible cavitation in the oil at temperatures of 31 °C and 50 °C, respectively.
It can be seen that at the stages of external pressure reduction from 5 bar to 1 bar, cavitation does not occur, although it is active at the stage of growth for the same pressure range. This is possibly due to the fact that the liquid was compressed prior to the pressure reduction stage, forcing the steam-gas nuclei to partially dissolve and collapse. As a consequence, cavitation occurred only when the pressure approached atmospheric. As an outcome, there exists a possibility of controlling cavitation by producing the necessary loading history.
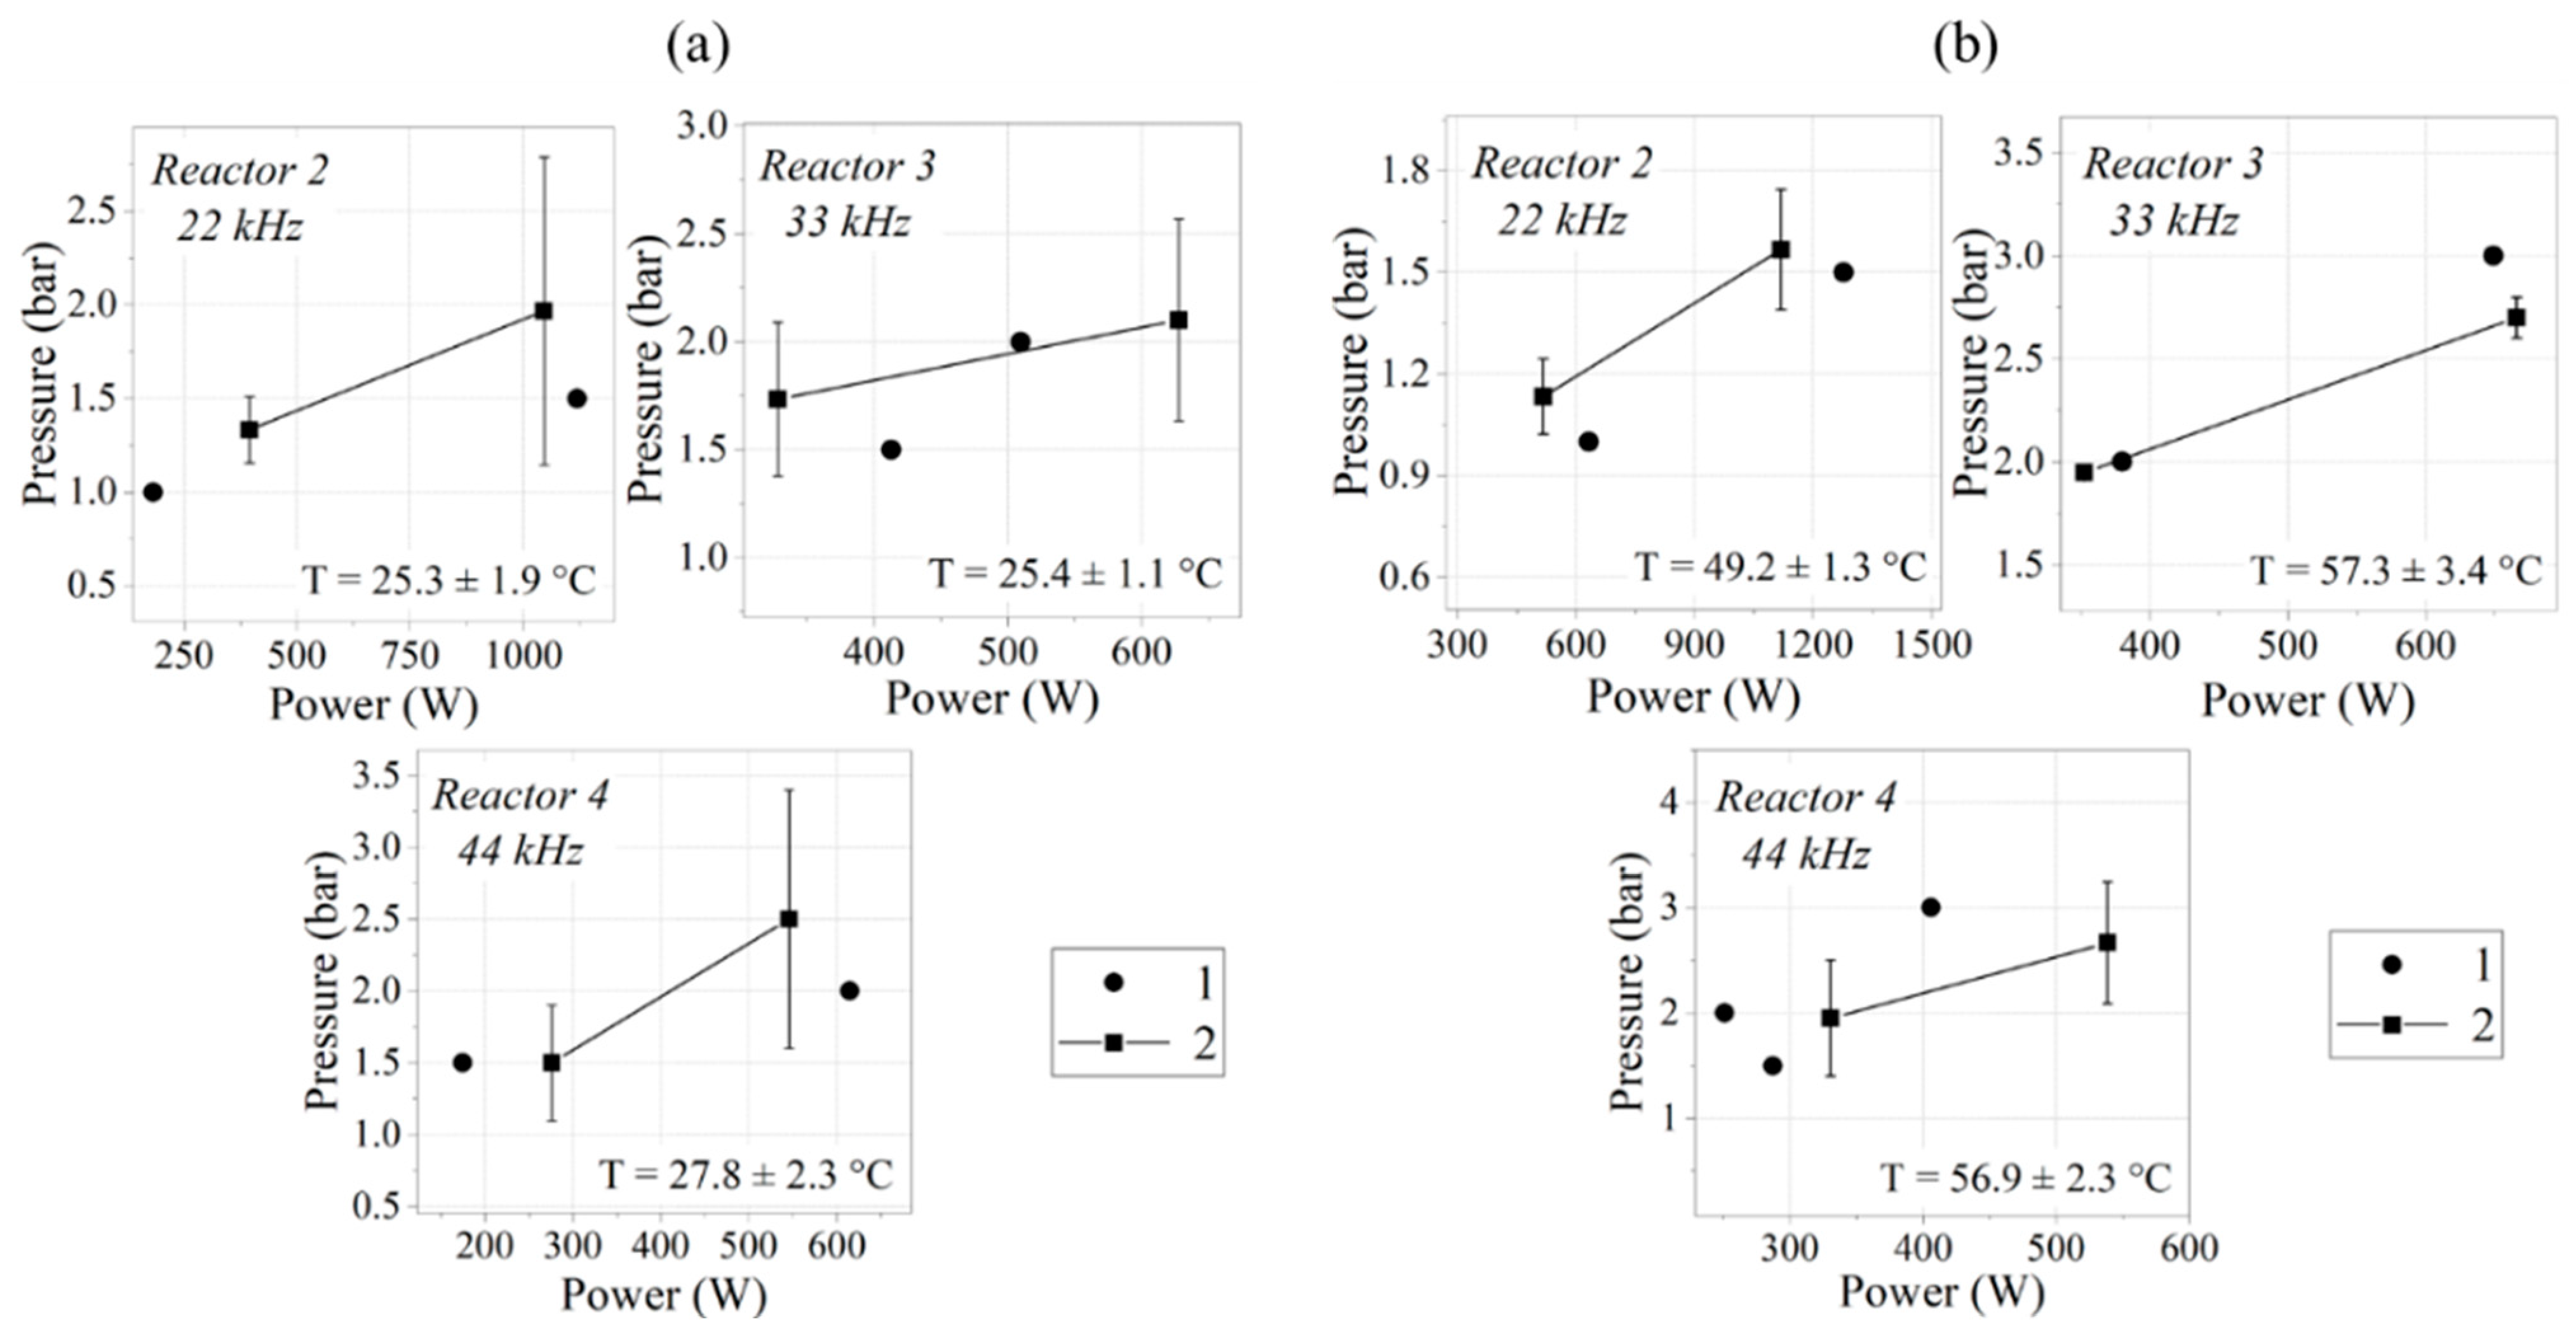
Let us consider how loading modes affect the cavitation threshold in oil. Figure 8 depicts the relationship between the transducer power and the external pressure required to cause cavitation in both loading modes. In the case of testing with varying external pressure, the cavitation threshold considered in Figure 8 is that which is realised after the first wave. In Figure 7, for example, this pressure is reached at about 150 s and is 1.1 and 1.4 bar for temperatures of 31 °C and 50 °C, respectively. Due to experimental setup restrictions, it was not possible to perform loading with varying external pressure in Reactor 1. According to the test results, the cavitation threshold is nearly the same for both modes of liquid loading at both temperatures. The standard deviation was used as the error; therefore, it is equal to 0 for experiments in the first mode because the pressure was constant during the test.
4. Discussion
The food industry is actively using ultrasonic treatment to improve the quality and increase the intensity of processes. The results obtained in the work can be used to estimate the ultrasound power required to start cavitation in sunflower oil. For example, if it is required to preserve the taste and appearance of the oil, then the cavitation threshold data presented for the regime with a gradual increase in power allow us to estimate the power range at which cavitation is not realized. If high-power ultrasonic transducers are used in production, which are not capable of operating in the sub-threshold cavitation mode, then an increase in hydrostatic pressure will allow oil to be processed without quality loss. Preliminary liquid compression can also reduce the likelihood of cavitation in the oil, allowing the concentration of gas-vapor nuclei to be reduced.
It should be noted that filaments and areas of turbidity were observed during cavitation tests in oil, which, according to [28], indicates the formation of polymers and lipid oxidation, which significantly reduce the quality of the oil. As a result, the parameters for ultrasonic treatment of sunflower oil should be chosen after a preliminary analysis of the cavitation threshold.
If for the production process, however, it is required to implement cavitation in sunflower oil, then for room temperature the lowest power was achieved in Reactor 4, which has the highest frequency. At an enhanced temperature, the lowest power leading to cavitation was achieved at Reactor 3.
Also, for Reactor 4, the results contain significant errors, which indicates a large scatter of data (Figure 6). This demonstrates that in order to obtain more accurate and representative liquid cavitation threshold values, a broad array of experimental data for each stationary condition is required.
5. Conclusions
The paper presents a study of the acoustic cavitation of sunflower oil under changing external conditions. The oil was tested in closed reactors where hydrostatic pressure and temperature were measured and controlled. The experimental setup allowed for a number of frequencies to be employed to sonicate the liquid: 17, 22, 33, and 44 kHz. Two modes of external loading on the liquid were employed to investigate the effect of transducer power and external pressure on the cavitation threshold. In the first case, the transducer power was gradually increased to its maximum value, and in the second mode, the external pressure was varied in triangle waves. The onset and end of cavitation were captured during the testing. The experiments were carried out at room and enhanced (about 50 °C) temperatures.
The results of the tests revealed that increasing the hydrostatic pressure in the liquid raises the cavitation threshold. However, increasing the temperature of the oil did not necessarily lead to a reduction in transducer power-generated cavitation. A comparison of two loading modes on oil was also performed, which revealed comparable cavitation threshold values.
Thus, by varying the stationary parameters, a liquid–vapor phase transition was achieved, and the dependencies of the onset of cavitation were produced. The results of testing with varying external pressure revealed the potential for regulating the cavitation process while maintaining the ultrasonic action parameters constant.
Author Contributions
Conceptualization: I.S.; methodology: I.S.; validation: N.M. and B.Y.; formal analysis: N.M.; investigation: N.M., I.S. and B.Y.; data curation: I.S.; writing—original draft preparation: N.M.; writing—review and editing: I.S.; visualization: N.M.; supervision: I.S. All authors have read and agreed to the published version of the manuscript.
Funding
This research was funded by the Russian Science Foundation, grant number: 20-79-10078.
Acknowledgments
Scientific research was performed at the Research Park of Saint Petersburg State University «Centre for Diagnostics of Functional Materials for Medicine, Pharmacology and Nanoelectronics» and «Physics Educational Centre».
Conflicts of Interest
The authors declare no conflict of interest.
References
- Neppiras, E.A. Acoustic cavitation. Phys. Rep. 1980, 61, 159–251. [Google Scholar] [CrossRef]
- Apfel, R.E. The role of impurities in cavitation-threshold determination. Ultrasonics 1971, 9, 181. [Google Scholar]
- Noltingk, B.E.; Neppiras, E.A. Cavitation produced by Ultrasonics. Proc. Phys. Soc. Sect. B 1950, 63, 674–685. [Google Scholar] [CrossRef]
- Galloway, W.J. An Experimental Study of Acoustically Induced Cavitation in Liquids. J. Acoust. Soc. Am. 1954, 26, 849–857. [Google Scholar] [CrossRef]
- Houghton, G. Theory of Bubble Pulsation and Cavitation. J. Acoust. Soc. Am. 1963, 35, 1387–1393. [Google Scholar] [CrossRef]
- Rozenberg, L.D. High-Intensity Ultrasonic Fields; Springer: Boston, MA, USA, 1971. [Google Scholar]
- Sun, X.; Liu, J.; Ji, L.; Wang, G.; Zhao, S.; Yoon, J.Y.; Chen, S. A review on hydrodynamic cavitation disinfection: The current state of knowledge. Sci. Total Environ. 2020, 737, 139606. [Google Scholar] [CrossRef] [PubMed]
- Podio-Guiougli, P.; Vergara Caffarelli, G.; Virga, E.G. Cavitation and phase transition of hyperelastic fluids. Arch. Ration. Mech. Anal. 1986, 92, 121–136. [Google Scholar] [CrossRef]
- Feng, Y.; Qin, D.; Zhang, L.; Zong, Y.; Wan, M. Optical and acoustic study on phase transition of nanodroplets: Acoustic droplet vaporization versus photoacoustic cavitation. In Proceedings of the 2017 IEEE International Ultrasonics Symposium (IUS), Washington, DC, USA, 6–9 September 2017. [Google Scholar]
- Yu, J.; Liu, J.; Wang, H.; Wang, J.; Zhou, Z.; Mao, H. Application of two-phase transition model in underwater explosion cavitation based on compressible multiphase flows. AIP Adv. 2022, 12, 025209. [Google Scholar] [CrossRef]
- Chahine, G.L.; Hsiao, C.-T. Modelling cavitation erosion using fluid–material interaction simulations. Interface Focus 2015, 5, 20150016. [Google Scholar] [CrossRef]
- Brennen, C.E. Cavitation and Bubble Dynamics; Cambridge University Press: Cambridge, UK, 2013. [Google Scholar]
- Dular, M.; Požar, T.; Zevnik, J.; Petkovšek, R. High speed observation of damage created by a collapse of a single cavitation bubble. Wear 2019, 418–419, 13–23. [Google Scholar] [CrossRef]
- Ye, L.; Zhu, X.; Liu, Y. Numerical study on dual-frequency ultrasonic enhancing cavitation effect based on bubble dynamic evolution. Ultrason. Sonochem. 2019, 59, 104744. [Google Scholar] [CrossRef] [PubMed]
- Paolantonio, M.; Hanke, S. Damage mechanisms in cavitation erosion of nitrogen-containing austenitic steels in 3.5% NaCl solution. Wear 2021, 464–465, 203526. [Google Scholar] [CrossRef]
- Kooiman, K.; Roovers, S.; Langeveld, S.A.G.; Kleven, R.T.; Dewitte, H.; O’Reilly, M.A.; Escoffre, J.M.; Bouakaz, A.; Verweij, M.D.; Hynynen, K.; et al. Ultrasound-Responsive Cavitation Nuclei for Therapy and Drug Delivery. Ultrasound Med. Biol. 2020, 46, 1296–1325. [Google Scholar] [CrossRef] [PubMed] [Green Version]
- Zupanc, M.; Pandur, Ž.; Stepišnik Perdih, T.; Stopar, D.; Petkovšek, M.; Dular, M. Effects of cavitation on different microorganisms: The current understanding of the mechanisms taking place behind the phenomenon: A review and proposals for further research. Ultrason. Sonochem. 2019, 57, 147–165. [Google Scholar] [CrossRef]
- Tzanakis, I.; Lebon, G.S.B.; Eskin, D.G.; Pericleous, K.A. Characterizing the cavitation development and acoustic spectrum in various liquids. Ultrason. Sonochem. 2017, 34, 651–662. [Google Scholar] [CrossRef] [Green Version]
- Caupin, F.; Balibar, S. Cavitation pressure in liquid helium. Phys. Rev. B 2001, 64, 064507. [Google Scholar] [CrossRef] [Green Version]
- Bader, K.B.; Mobley, J.; Church, C.C.; Gaitan, D.F. The effect of static pressure on the strength of inertial cavitation events. J. Acoust. Soc. Am. 2012, 132, 2286–2291. [Google Scholar] [CrossRef]
- Arvengas, A.; Herbert, E.; Cersoy, S.; Davitt, K.; Caupin, F. Cavitation in Heavy Water and Other Liquids. J. Phys. Chem. B 2011, 115, 14240–14245. [Google Scholar] [CrossRef]
- Körzendörfer, A. Vibrations and ultrasound in food processing—Sources of vibrations, adverse effects, and beneficial applications—An overview. J. Food Eng. 2022, 324, 110875. [Google Scholar] [CrossRef]
- Bhargava, N.; Mor, R.S.; Kumar, K.; Sharanagat, V.S. Advances in application of ultrasound in food processing: A review. Ultrason. Sonochem. 2021, 70, 105293. [Google Scholar] [CrossRef]
- Chemat, F.; Zill-e-Huma; Khan, M.K. Applications of ultrasound in food technology: Processing, preservation and extraction. Ultrason. Sonochem. 2011, 18, 813–835. [Google Scholar] [CrossRef]
- Orio, L.; Alexandru, L.; Cravotto, G.; Mantegna, S.; Barge, A. UAE, MAE, SFE-CO2 and classical methods for the extraction of Mitragyna speciosa leaves. Ultrason. Sonochem. 2012, 19, 591–595. [Google Scholar] [CrossRef]
- Cravotto, G.; Boffa, L.; Mantegna, S.; Perego, P.; Avogadro, M.; Cintas, P. Improved extraction of vegetable oils under high-intensity ultrasound and/or microwaves. Ultrason. Sonochem. 2008, 15, 898–902. [Google Scholar] [CrossRef]
- Li, H.; Pordesimo, L.; Weiss, J. High intensity ultrasound-assisted extraction of oil from soybeans. Food Res. Int. 2004, 37, 731–738. [Google Scholar] [CrossRef]
- Chemat, F.; Grondin, I.; Costes, P.; Moutoussamy, L.; Sing, A.S.C.; Smadja, J. High power ultrasound effects on lipid oxidation of refined sunflower oil. Ultrason. Sonochem. 2004, 11, 281–285. [Google Scholar] [CrossRef]
- Li, Y.; Fabiano-Tixier, A.S.; Tomao, V.; Cravotto, G.; Chemat, F. Green ultrasound-assisted extraction of carotenoids based on the bio-refinery concept using sunflower oil as an alternative solvent. Ultrason. Sonochem. 2013, 20, 12–18. [Google Scholar] [CrossRef]
- Bader, K.B.; Raymond, J.L.; Mobley, J.; Church, C.C.; Gaitan, D.F. Inertial cavitation threshold dependence on static pressure. J. Acoust. Soc. Am. 2010, 128, 2313. [Google Scholar] [CrossRef]
- Caupin, F.; Herbert, E. Cavitation in water: A review. Comptes Rendus Phys. 2006, 7, 1000–1017. [Google Scholar] [CrossRef]
- Caupin, F.; Arvengas, A.; Davitt, K.; Azouzi, M.E.M.; Shmulovich, K.I.; Ramboz, C.; Sessoms, D.A.; Stroock, A.D. Exploring water and other liquids at negative pressure. J. Phys. Condens. Matter 2012, 24, 284110. [Google Scholar] [CrossRef] [PubMed]
Figure 1.
Temperature dependence of oil density.
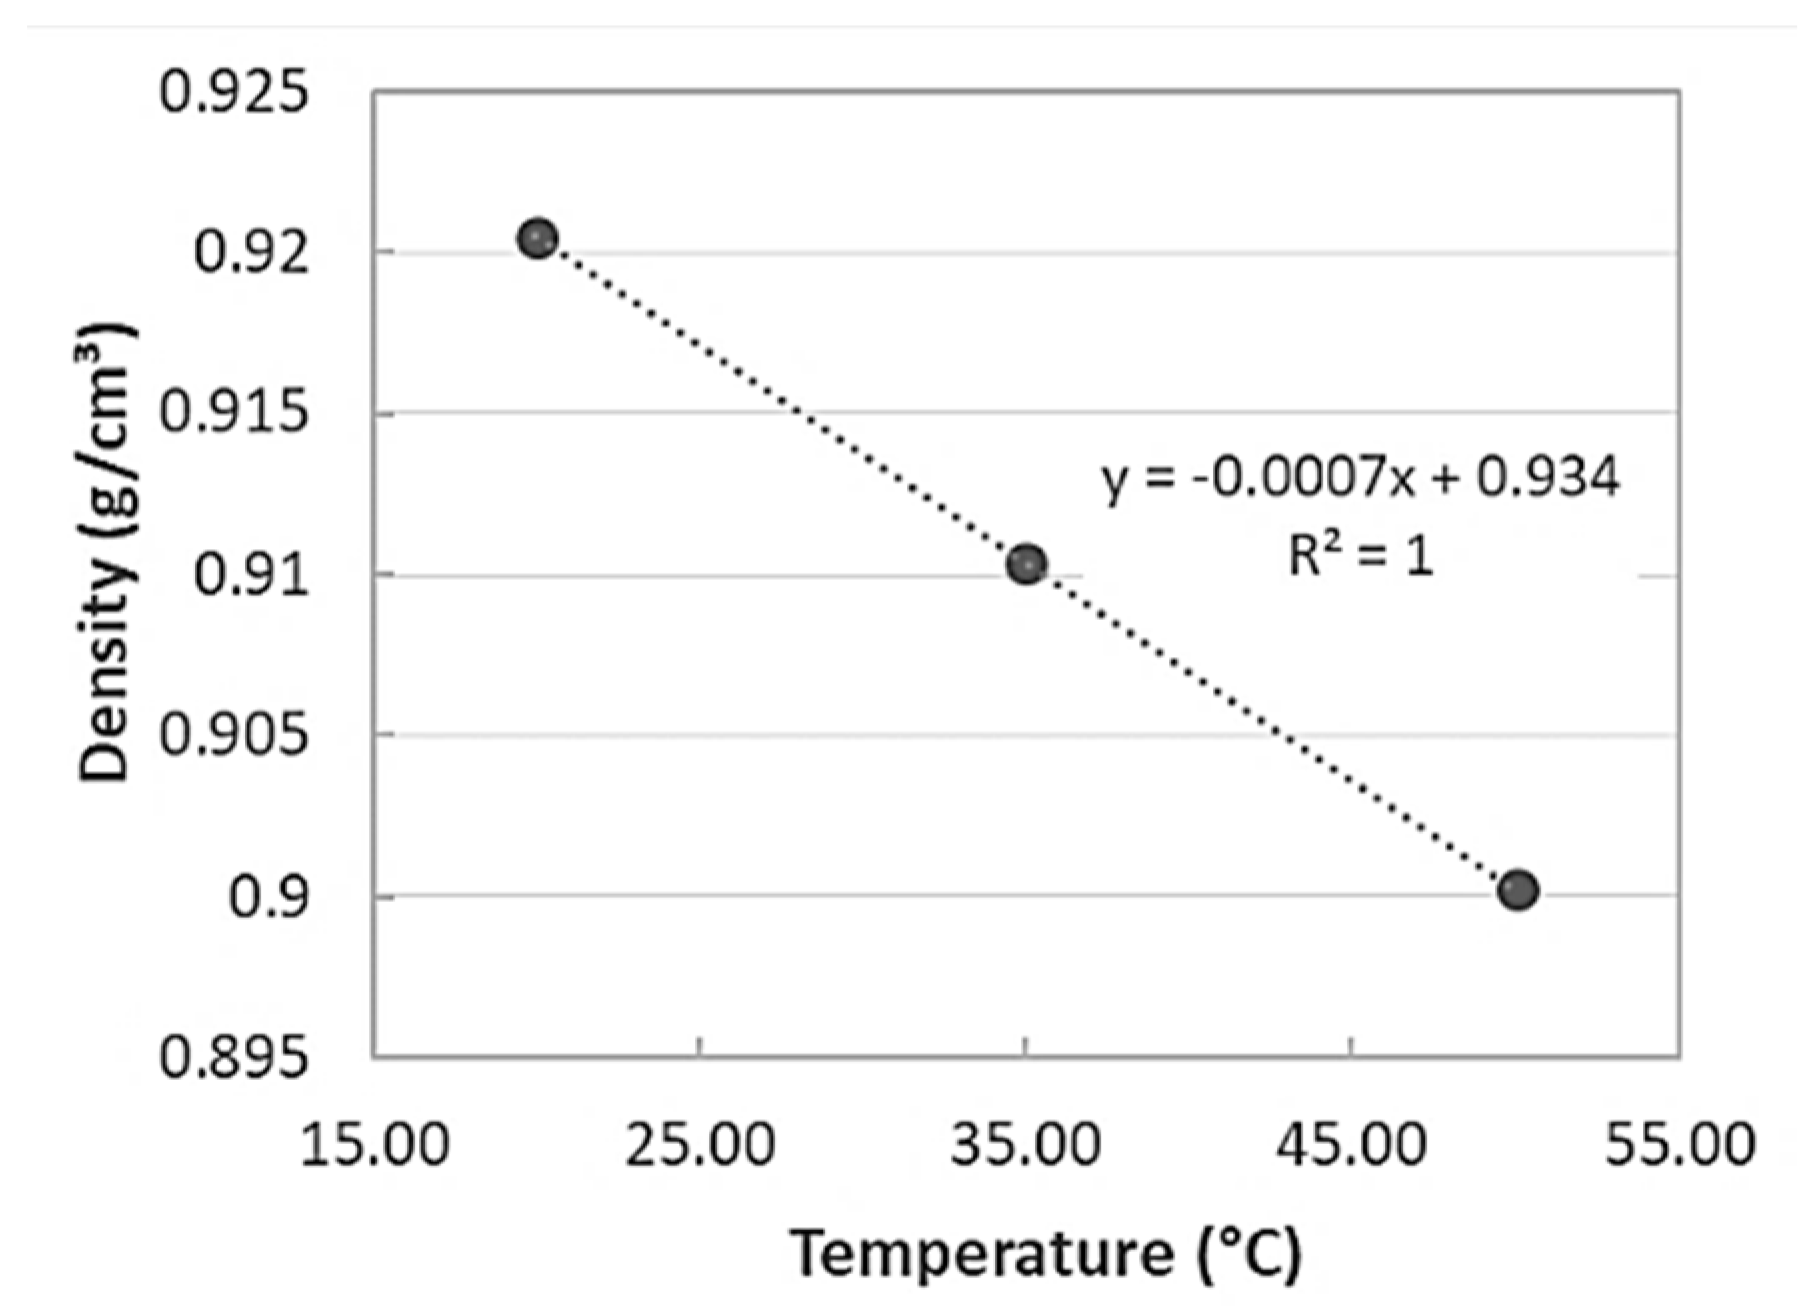
Figure 2.
Temperature dependencies of kinematic and dynamic viscosity (a) and surface tension coefficient (b) of sunflower oil.
Figure 2.
Temperature dependencies of kinematic and dynamic viscosity (a) and surface tension coefficient (b) of sunflower oil.

Figure 3.
(a) A schematic illustration of a reactor component in cavitation testing. (b) An experimental setup.
Figure 3.
(a) A schematic illustration of a reactor component in cavitation testing. (b) An experimental setup.

Figure 4.
Modes of liquid loading (a) with constant external pressure; (b) with constant ultrasonic transducer power.
Figure 4.
Modes of liquid loading (a) with constant external pressure; (b) with constant ultrasonic transducer power.
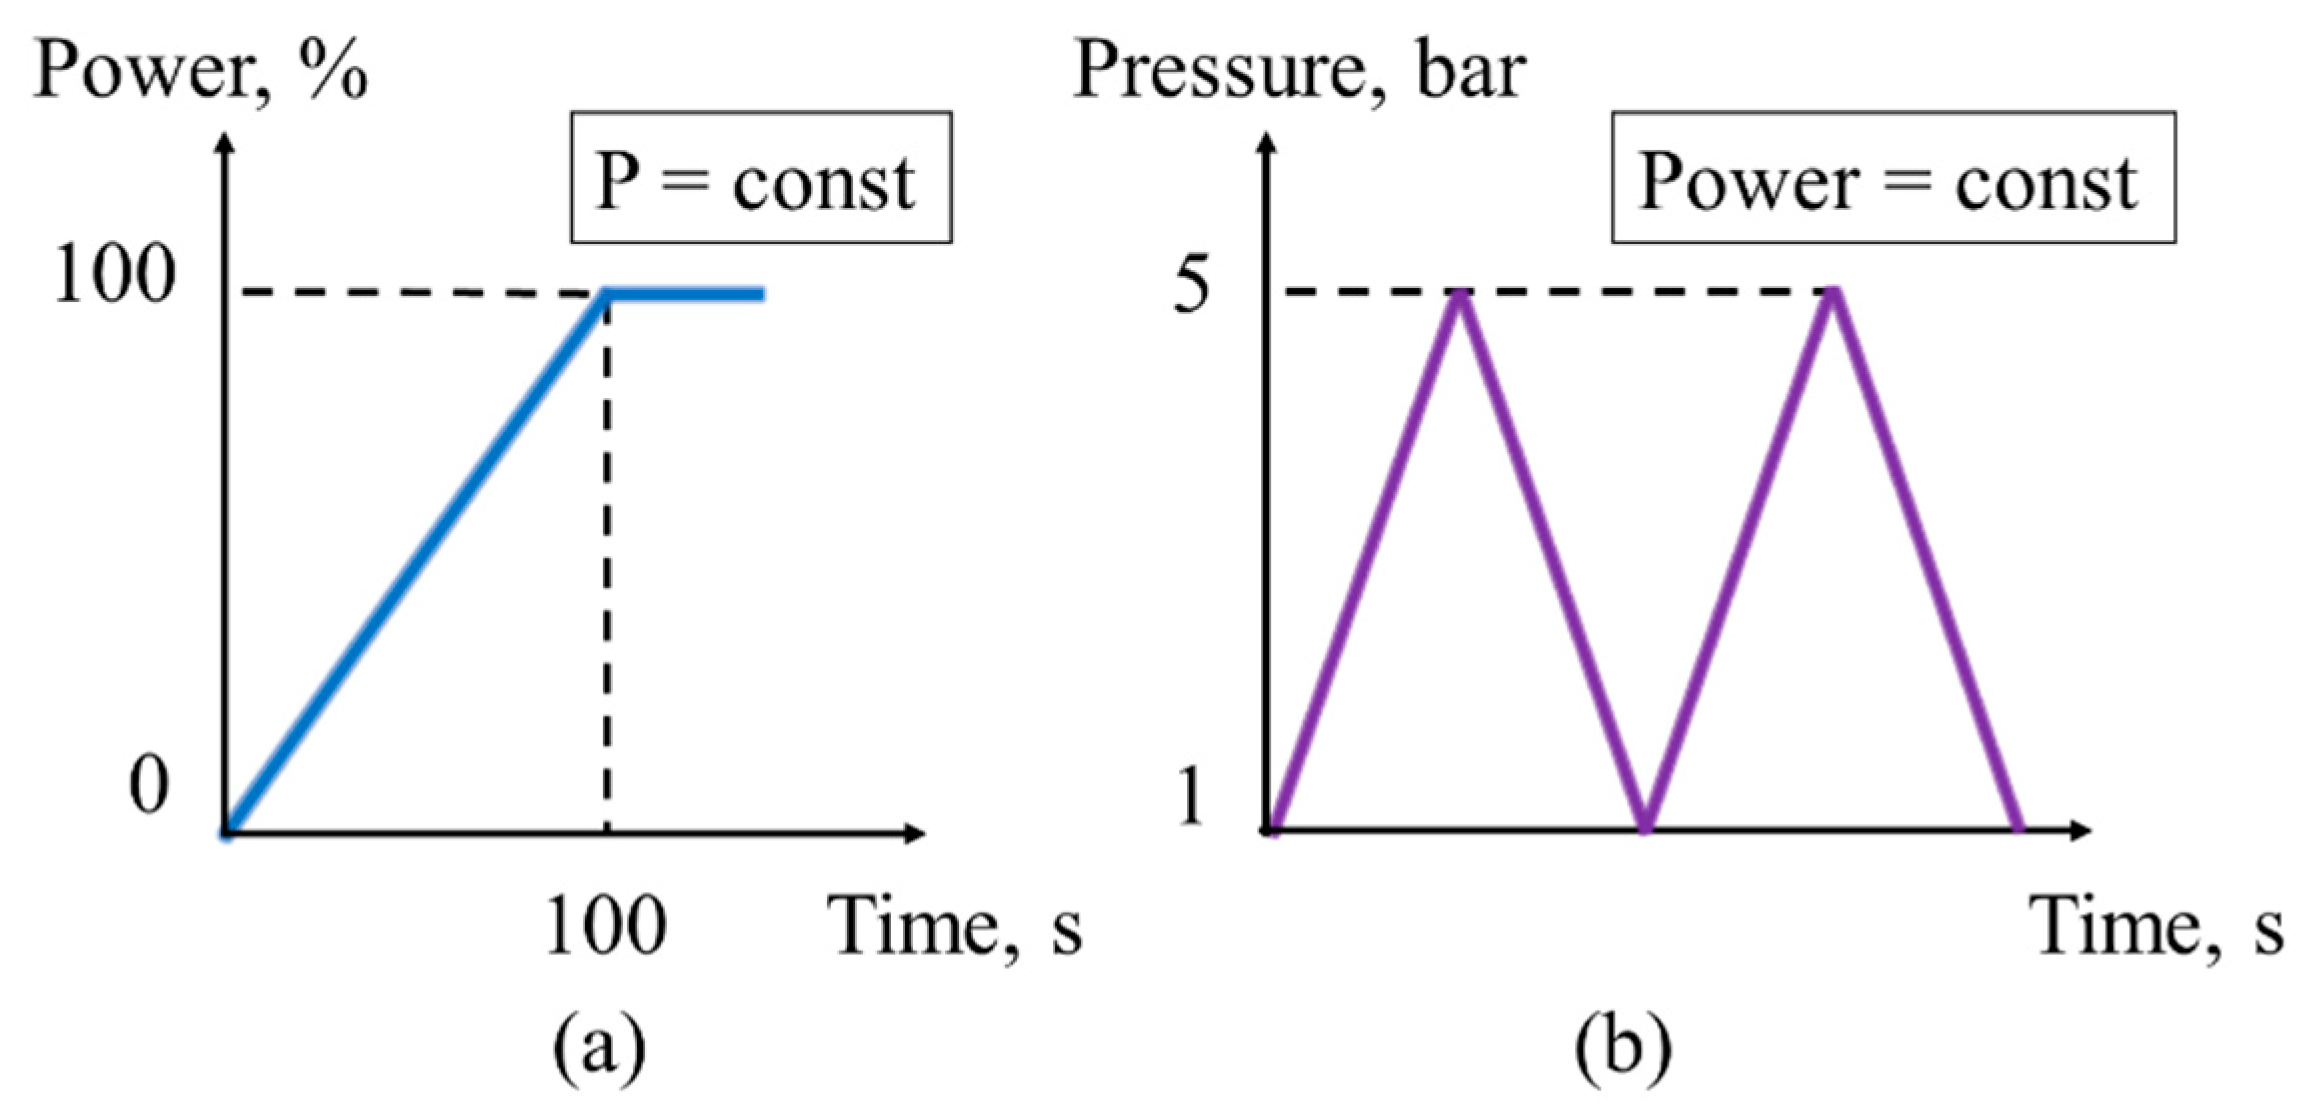
Figure 5.
The cavitation onset at various external pressures with a gradual increase in the power of the ultrasonic transducer in (a) Reactor 3, and (b) in Reactor 1, at ambient temperature.
Figure 5.
The cavitation onset at various external pressures with a gradual increase in the power of the ultrasonic transducer in (a) Reactor 3, and (b) in Reactor 1, at ambient temperature.

Figure 6.
The threshold power of the ultrasonic transducer, leading to cavitation, in dependance on the external pressure for room temperature and 50 °C, subject to an increase in power to 100% in 100 s (Figure 4a).
Figure 6.
The threshold power of the ultrasonic transducer, leading to cavitation, in dependance on the external pressure for room temperature and 50 °C, subject to an increase in power to 100% in 100 s (Figure 4a).

Figure 7.
The onset of cavitation at a fixed transducer power of 50% (about 280 W) in Reactor 4 when the external pressure fluctuates over time (loading mode as shown in Figure 4b). The onset and end of cavitation are shown by filled and empty dots, respectively.
Figure 7.
The onset of cavitation at a fixed transducer power of 50% (about 280 W) in Reactor 4 when the external pressure fluctuates over time (loading mode as shown in Figure 4b). The onset and end of cavitation are shown by filled and empty dots, respectively.

Figure 8.
Comparison of the threshold transducer power that led to the cavitation onset obtained under two loading modes: 1—with a gradual increase in power at a constant external pressure (loading mode as shown in Figure 4a); 2—with a wave-like change in external pressure (loading mode as shown in Figure 4b). The tests were performed (a) at room temperature; (b) at 50 °C.


Table 1.
Parameters of reactor components.
| Reactor | Transducer | Volume | ||
|---|---|---|---|---|
| Diameter | Frequency | Max Power | ||
| 1 | 32 mm | 17 kHz | 2 kW | 900 mL |
| 2 | 32 mm | 22 kHz | 2 kW | 900 mL |
| 3 | 22 mm | 33 kHz | 1 kW | 400 mL |
| 4 | 22 mm | 44 kHz | 1 kW | 400 mL |
Publisher’s Note: MDPI stays neutral with regard to jurisdictional claims in published maps and institutional affiliations. |
© 2022 by the authors. Licensee MDPI, Basel, Switzerland. This article is an open access article distributed under the terms and conditions of the Creative Commons Attribution (CC BY) license (https://creativecommons.org/licenses/by/4.0/).
Share and Cite
MDPI and ACS Style
Mikhailova, N.; Smirnov, I.; Yakupov, B. Experimental Study of the Acoustic Cavitation Threshold in Sunflower Oil Depending on Different Impact Regime. Acoustics 2022, 4, 894-902. https://doi.org/10.3390/acoustics4040054
AMA Style
Mikhailova N, Smirnov I, Yakupov B. Experimental Study of the Acoustic Cavitation Threshold in Sunflower Oil Depending on Different Impact Regime. Acoustics. 2022; 4(4):894-902. https://doi.org/10.3390/acoustics4040054
Chicago/Turabian StyleMikhailova, Natalia, Ivan Smirnov, and Bulat Yakupov. 2022. "Experimental Study of the Acoustic Cavitation Threshold in Sunflower Oil Depending on Different Impact Regime" Acoustics 4, no. 4: 894-902. https://doi.org/10.3390/acoustics4040054