Abstract
The quality of the acoustic environments at Xi’an Jiatong-Liverpool University (XJTLU) and Soochow University (Dushuhu Campus, SUDC) in Suzhou City were investigated in the present work through real-time noise level measurements and questionnaire surveys. Before commencing the measurements and surveys, these two campuses’ sound sources were summarized and classified into four categories through on-site observation: human-made, machinery, living creatures, and natural physical sounds. For the zones near the main traffic road, with a high volume of crowds and surrounded by a park, sound from road vehicles, humans talking, and birds/insects were selected by the interviewees as the major sound sources, respectively. Only zone 3 (near to a park) at XJTLU could be classified as A zone (noise level < 55 dBA) with an excellent quality acoustical environment. All other zones had either good or average quality acoustical environments, except zone 1 (near to main traffic road) at XJTLU, with a fair-quality acoustical environment.
1. Introduction
The attention given by the public and researchers toward the quality of the acoustic environment in some learning spaces, such as classrooms, is increasing. Kristiansen et al. [1] tried to identify the determinants of noise exposure among 419 secondary school teachers in ten schools in Denmark. Results showed that the major determinants of the noise exposure were low teacher seniority, a high number of children in the class, and the children’s young age. Connolly et al. [2] designed an online questionnaire survey to study the impressions of a group of teenagers on their school’s acoustical environment. Results showed that pupils who reported additional learning needs, such as hearing impairment or speaking English as a second language, were significantly more affected by poor school acoustics than pupils reporting no additional learning needs. Pȧȧkkönen et al. [3] studied classrooms’ acoustic performance and their corridors in a Finnish Oulu Normal School. They found that the sound insulation and background noise level of all classrooms did not meet Finnish Standards. Mealings et al. [4] compared the ambient, instructive, and occupied noise levels among an (1) enclosed; (2) double; (3) linear, fully open-plan triple; (4) and semi-open-plan K-6 classroom in Australian primary schools. The results indicated that much higher intrusive noise levels were found in the two largest open-plan classrooms. Therefore, the speech transmission index scores and signal-to-noise ratios of these classrooms were well below those recommended for students of this age. Sala and Rantala [5] measured the activity and background noise levels of 40 classrooms in Finland, and the results were evaluated using the Finnish national standard. They found that only a few classrooms fulfilled the acoustic criteria of the Finish national standard. Consequently, they concluded that the acoustical environment of these classrooms was detrimental to learning and speech communication.
Pinho et al. [6] measured the reverberation time and sound insulation between classrooms and corridors in eight schools (from kindergarten to college) in Portugal. They claimed that six school buildings revealed disabled constructive aspects concerning their acoustic requirements, thus compromising education quality. Madbouly et al. [7] proposed a new classroom acoustics assessment model based on an analytic hierarchy process to enhance learning quality and speech intelligibility. The model was based on five criteria: noise sources inside and outside the classroom, classroom specifications, vocal effort, and teaching style. Gramez and Boubenider [8] evaluated a conference room’s acoustic comfort by measuring its inside and outside ambient noise, reverberation time, and interior sound insulation. They concluded that the conference room’s acoustical quality was poor due to a high level of ambient noise and reverberation time. Nedojedla et al. [9] measured the noise levels of twelve classrooms during lessons at a primary school in the Czech Republic. They found that the mean equivalent sound pressure level () was about 68.0 ± 3.4 dBA, where the noisiest and quietest lessons were physical education and English, respectively. Peng et al. [10] compared the subjective speech perception, and objective acoustical indices of students in two classrooms of a primary school before and after the sound absorption materials were installed on the ceilings. They found that the reverberation time reduced, while the speech transmission index and intelligibility improved. Pillay and Vieira [11] concluded that classroom acoustic specifications were necessary as both students and teachers from 31 foundation-phase classrooms claimed air traffic noise and noise from adjoining classrooms affected the quality of teaching. Levandoski and Zannin [12] found that acoustic discomfort’s major causes do not stem from the noise sources outside the halls and classrooms.
From the reported works, the quality of an acoustical environment strongly affects the quality of teaching and learning. However, most of the reported studies only focused on the acoustical environment inside a classroom, such as how outside and inside noise sources can affect the classroom’s noise level. None or few of these works studied the acoustical environment of the zone outside the classroom, which is the campus area. Notably, a pleasant and quiet campus area has a significant effect on the quality of teaching and learning as the quietness of the places where teachers or students passing by every day will affect their emotion and health, which consequently will affect how well they can teach and concentrate in the classroom, respectively. Therefore, this study will investigate the qualities of the acoustical environment of Xi’an Jiaotong-Liverpool University (XJTLU) and Soochow University (Dushuhu Campus, SUDC). These two universities are located in Suzhou, China. In the beginning, the real-time noise levels of these two universities were recorded using a calibrated smartphone. After that, questionnaires were distributed to the respondents to determine the university’s major sound source from their perspective. The current studies’ outcome is expected to provide some possible noise control solutions such as traffic speed or traffic flow controls to the university environmental control department after the major sound sources within the campuses are identified.
2. Methods
Through the on-site observation of sound environment characteristics at XJTLU and SUDC, these two campuses were divided into different zones for data collection and to gain a more accurate and in-depth grasp of their acoustical environment conditions. The map of XJTLU with three data collection zones is shown in Figure 1. The campus area of XJTLU is around 0.41 km. The real views of these three zones are shown in Figure 2. Zone 1 is located in between XJTL International Conference Centre and a main traffic road. Zone 2 is located in between XJTL library and some teaching buildings. Zone 3 is located in between a basketball court and a park. The map of SUDC with seven data collection zones is shown in Figure 3, and its whole campus area is about 1.02 km. The real views of these seven zones are shown in Figure 4. Zone 1 is located in the area of a main traffic road. Zone 2 is located in the library square. Zone 3 is located in the area of teaching buildings. Zone 4 is located in the area of the School of Art. Zone 5 is located beside a park with a football field. Zone 6 is located in a park with some student hostels around it. Zone 7 is located in the area of student hostels. Additionally, from the on-site observation, the sound sources at these two campuses were summarized and classified into four categories: human-made, machinery, living creatures, and natural physical sounds. Human-made sound sources included sounds from humans talking, footsteps, exercising, music, and so on. Machinery sound sources included sounds from cars, buses, vans, bicycles, and so son. Living creature sound sources included sounds from birds, insects, and so on. Natural physical sound sources included sounds from raining, leaves rubbing, and so on.
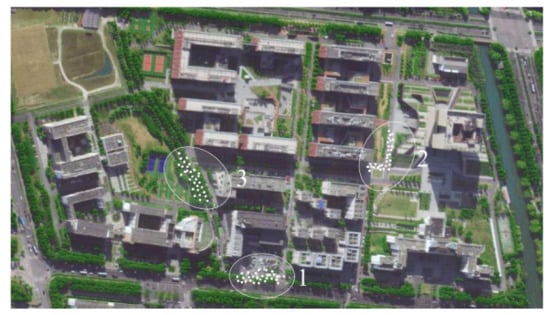
Figure 1.
The map of Xi’an Jiatong-Liverpool University with three data collection zones.
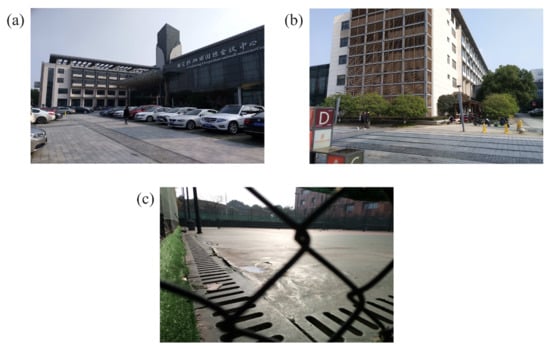
Figure 2.
The real views of the three data collection zones at Xi’an Jiatong-Liverpool University: (a) zone 1, (b) zone 2, and (c) zone 3.
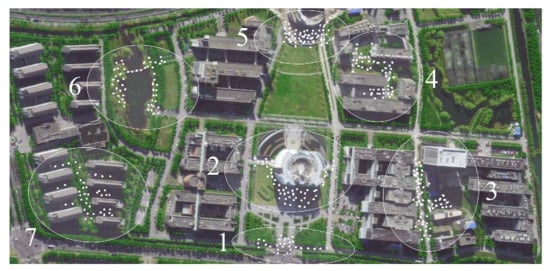
Figure 3.
The map of Soochow University (Dushuhu Campus) with seven data collection zones.
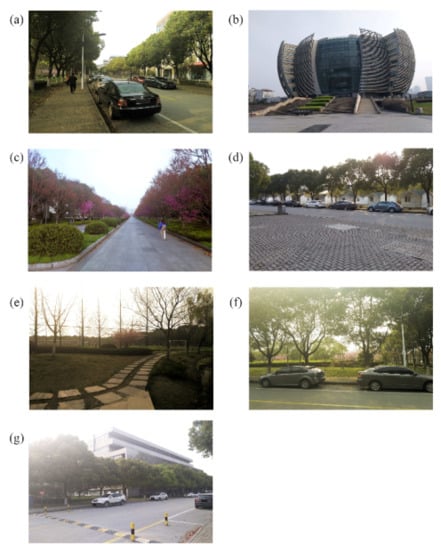
Figure 4.
The real views of the seven data collection zones at Soochow University (Dushuhu Campus): (a) zone 1, (b) zone 2, (c) zone 3, (d) zone 4, (e) zone 5, (f) zone 6, and (g) zone 7.
2.1. Sound Level Measurements
A Samsung A9 smartphone was used in the present study for sound level measurements [13,14]. An app developed in-house (Noise Explorer) was installed in the smartphone for data acquisition. Before starting the data acquisition, the smartphone microphone (built-in microphone) was calibrated against a PCB Piezotronics class 1 type microphone (model 377B02), with the procedure elaborated in an earlier reported work by Garg et al. [15]. The developed technique calibrates smartphone microphone not only in term of sound pressure level, but also for the frequency spectrum. After the calibration, the smartphone was proved to achieve measurement accuracy up to ±0.7 dB. In the present study, each zone has 30 data collection points. was recorded at each point where the smartphone was hold in hand with the body stood at the particular point. The sampling time at each point was about 20 s. The measurements were conducted at each zone every hour, starting from 6:40 to 19:40. Data at each zone were collected twice, one time during the weekday and one time during the weekend.
2.2. Questionnaire Survey
The questionnaire used in the current study is shown in Table A1 in the Appendix A. According to the research’s needs, the questionnaire included the venue of the interview, zone of the venue, gender of the interviewee, whether interviewee often goes to that particular zone and sound source in the particular zone. The questionnaires were distributed on the same day that sound recording was conducted (one weekday and one weekend) if any student, staff or visitor passed the particular zone. Finally, 273 valid questionnaires were collected for both campuses: 152 questionnaires were from male interviewees, while 121 were from females.
3. Results and Discussion
3.1. Survey Data
The score (S) of each sound source at each particular zone is calculated using
where f is how many times the source is selected for the particular ranking, w is the weight of the ranking (3 and 2 for ranking of 1 and 2, respectively), and N is the total number of interviewees. For example, the questionnaire is filled in six times in a particular zone, and the birds sound is selected and ranked as number 1 and 2 for 2 and 4 times, respectively. Consequently, the birds sound score in the particular zone is equal to (2 × 3 + 4 × 2)/6 = 2.33. By using this method, two major sound sources for each zone at XJTLU and SUDC are found and shown in Table 1. The two major sound sources at zone 1 of XJTLU are sounds from road vehicles and footsteps as many vehicles pass by the main traffic road and many visitors walking around the conference centre. Beyond footsteps, sounds from leaves rubbing are also major sound sources in zone 2 since the library and teaching buildings are surrounded by many trees. As expected, the major sound sources in zone 3 are from exercising and birds since these are the most common sounds that can be found in a basketball court and park. For SUDC, the sound of humans talking is one of the major sound sources in zone 1, beyond the sounds from road vehicles as many pedestrians talk to each other when walking in this zone. The major sound sources in zones 2 and 3 are caused by humans and road vehicles, respectively. Since zone 4 is located in the School of Art, the top sound source is music. The footstep sounds in zone 5 are due to people’s footstep who walk around the park. As expected, the major sound sources in zones 6 and 7 are from living creatures and sounds caused by humans, respectively, as these two zones are located in a park and student hostel, respectively.

Table 1.
Two major sound sources for each zone at Xi’an Jiatong-Liverpool University and Soochow University (Dushuhu Campus).
3.2. Sound Data
Figure 5 shows the average measured at the three data collection zones at XJTLU over weekdays and the weekend. This average is computed by averaging the measured from the 30 data collection points in each zone. For zone 1, the trend of average over the weekend is similar to that of a weekday. Additionally, the values of average over the weekend are also higher than that of the weekday, except for those on 12:40 and from 17:40 to 18:40. This is because the volumes of traffic flow and crowd are higher during the weekend, where conferences and exhibitions are normally held during. The timings of 12:40 and from 17:40 to 18:40 are when large groups of students and staff from XJTLU pass by this area for lunch and dinner. Therefore, the average of these times during the weekday are higher than those during the weekend. The average of zone 2 during both weekdays and the weekend are much lower than that of zone 1. Indeed, sound levels from footsteps or leaves rubbing are much lower than road vehicles’ sound level. The average of zone 2 during the weekend is generally lower than that of weekdays since lectures are normally not conducted during the weekend. Consequently, the number of students and staff in this zone during the weekend are also reduced significantly. The average obtained from zone 3 is the lowest among all zones at XJTLU since the volume of crowds in this zone is the lowest (see Table 1, where major sound sources in this zone are from exercising and birds). The average of zone 3 during the weekend is generally lower than that of weekdays, except for from 11:40 to 13:40 and from 16:40 to 17:40. During the weekend, not many students, staff, or visitors are walking in the park. The average of the mentioned two periods of time during the weekend is high since people normally play basketball during these two periods. Another two figures showing the sound level data from all zones in one graph for weekdays and the weekend are shown in Figure A1a and Figure A2a in the Appendix A, respectively, to compare the sound levels among these three zones at XJTLU.
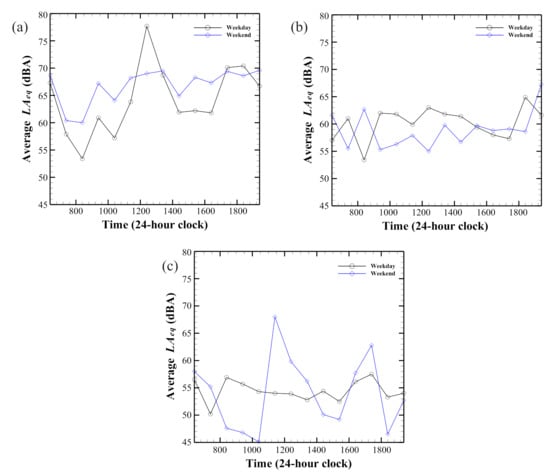
Figure 5.
Average measured at the three data collection zones at Xi’an Jiatong-Liverpool University from 6:40 to 19:40 over weekday and weekend: (a) zone 1, (b) zone 2, and (c) zone 3.
Figure 6 shows the average measured at the seven data collection zones at SUDC over weekdays and weekends. For zone 1, the average during weekdays when people go to work (7:40), go for lunch (from 11:40 to 13:40), and go back from work (17:40 to 18:40) are much higher than those during the weekend. The average of zone 2 over weekdays and the weekend is much lower than zone 1 as zone 2 is located at the library square, while zone 1 is near a main traffic road. Like zone 1, the average on some specific timings in zone 2 during weekdays is much higher than that of the weekend. These times are from 11:40 to 12:40 (students and staff leave the library for lunch) and from 18:40 to 19:40 (students and staff leave the library for dinner or to go home). Due to the good scenery along the sidewalks in zone 3, its average over the weekend is much higher than the weekdays from 9:40 to 17:40. Many people like to take a walk along the sidewalks in this zone over the weekend. For the School of Art in zone 4, the average over the weekend is much higher than over weekdays from 8:40 to 10:40, 13:40, 15:40, and 17:40. This is because, during the weekend, there are some bands or orchestras from SUDC conducting their training during these times. For zone 5, many people like to take a walk around the park from 16:40 to 18:40 during the weekend. Therefore, the average during these times over the weekend is much higher than those over weekdays. For both weekdays and the weekend, zone 6 has the minimum average among all seven zones at SUDC as this zone is located beside a park (see Table 1, where major sound sources at this zone are from birds and inserts). Student hostels in this area are also quite far away from the data collection points. The average of zone 7 over the weekdays is generally lower than that of weekend because students spend most of their time in the hostel during the weekend, while they attend lectures during weekdays. Another two figures with sound level data from all zones in one graph for weekdays and the weekend are shown in Figure A1b and Figure A2b in the Appendix A, respectively, to compare the sound levels among the seven zones at SUDC.
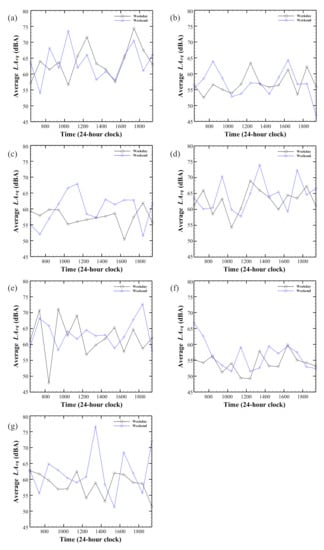
Figure 6.
Average measured at the seven data collection zones at Soochow University (Dushuhu Campus) from 6:40 to 19:40 over weekday and weekend: (a) zone 1, (b) zone 2, (c) zone 3, (d) zone 4, (e) zone 5, (f) zone 6, and (g) zone 7.
The quality of the acoustic environment in different zones of XJTLU and SUDC is shown in Table 2. The evaluation criteria, such as the rank and threshold of the noise level, are used in Table 1 to refer to the Environmental Quality Standard for Noise (GB 3096-2008). This is a Chinese National Standard used for noise quality evaluation. Notably, only the threshold of noise levels during the daytime in GB 3096-2008 are used as the present study’s sound data are all collected during the day. The results shown in Table 2 are obtained by averaging all the in the particular zone for both weekdays and weekends. Only zone 3 at XJTLU can be classified as an A zone with an average noise level lower than 55 dBA, where the major sound sources in this zone are from exercising and birds. Zone 1 at XJTLU is located in between the XJTL International Conference Centre and a main traffic road. It is the only zone classified as D zone, with an average noise level higher than 65 dBA. Zone 2 at XJTLU and zones 2, 3, and 6 at SUDC are classified as B zones, with the average noise level ranging from 55.1 dBA to 60 dBA. Zones 1, 4, 5, and 7 at SUDC are classified as C zones, with the average noise level ranging from 60.1 dBA to 65 dBA.
Table 2.
The quality of acoustic environment at different zones of XJTLU and SUDC.
4. Conclusions
The qualities of the acoustic environments at XJTLU and SUDC were through real-time noise level measurements and questionnaire surveys. There were three and seven data collection zones at XJTLU and SUDC, respectively. From the on-site observations, the sound sources at these two campuses were summarized and classified into four categories: human-made, machinery, living creatures, and natural physical sounds. For the zones near the main traffic road, sounds from road vehicles were selected by interviewees as the major sound source, such as in zone 1 at XJTLU and SUDC. For the zones with high crowd volumes, sounds from human chatting were selected by interviewees as the major sound source, such as in zones 2, 3, and 7 at SUDC. For zones surrounded by a park, sounds from birds and insects were selected by interviewees as major sound sources, such as in zones 3 and 6 at XJTLU and SUDC, respectively. For XJTLU zones 1 and 3 had the highest and lowest noise levels, respectively, on weekdays and weekends. For SUDC, only the noise level at zone 6 was lower than all the other six zones for weekdays and weekends. In conclusion, only zone 3 at XJTLU could be classified as an A zone, with an excellent quality acoustic environment. All other zones had either a good or average quality acoustic environment, except zone 1 at XJTLU, with a fair quality acoustic environment.
From the results of the present study, it can be concluded that sound from road vehicles is the major contributor to noise pollution in the campus area. Therefore, it is suggested that certain traffic rules can be applied in the campus to reduce the environment’s noise level in the campus, such as reducing the speed limits of road vehicles when driving inside the campus. Other than the speed limit, the numbers and types of vehicles could be controlled during certain periods. For example, the number of vehicles driving in the campus could be controlled to a certain amount during lunch hour and heavy vehicles could be prohibited to enter the campus area from 17:00–19:00 as most lessons end during this period. For future works, a noise map will be constructed using CadnaA software to evaluate the effectiveness of all possible traffic noise mitigation measures such as traffic speed and flow controls, plantation of trees and construction of noise barriers.
Author Contributions
Conceptualization, H.P.L.; methodology, Z.L.; software, H.P.L.; validation, Z.L. and H.P.L.; formal analysis, Z.L.; investigation, H.M.L.; resources, Z.L.; data curation, Z.L.; writing—original draft preparation, H.M.L.; writing—review and editing, H.M.L.; visualization, H.M.L.; supervision, H.P.L.; project administration, H.P.L.; funding acquisition, H.M.L. All authors have read and agreed to the published version of the manuscript.
Funding
This research was funded by National Natural Science Foundation of China [51908142], Natural Science Foundation of Guangdong Province [2019A1515012223, 2021A1515012269] and Guangzhou Basic Research Program - City School (College) Joint Funding Project [202102010384, 202102010410].
Institutional Review Board Statement
Not applicable.
Informed Consent Statement
Not applicable.
Data Availability Statement
Data available on request from the authors.
Acknowledgments
We would like to thank the Soochow University for providing administrative supports to this study.
Conflicts of Interest
The authors declare no conflict of interest. The funders had no role in the design of the study; in the collection, analyses, or interpretation of data; in the writing of the manuscript; or in the decision to publish the results.
Appendix A
Table A1.
Questionnaire for the survey at Xi’an Jiatong-Liverpool University and Soochow University (Dushuhu Campus).
Table A1.
Questionnaire for the survey at Xi’an Jiatong-Liverpool University and Soochow University (Dushuhu Campus).
| (1) Location: | ·Xi’an Jiatong-Liverpool University |
| ·Soochow University (Dushuhu Campus) | |
| (2) Zone: | ·1 |
| ·2 | |
| ·3 | |
| ·4 | |
| ·5 | |
| ·6 | |
| ·7 | |
| (3) Gender: | ·Male |
| ·Female | |
| (4) Do you often come to this area?: | ·Yes |
| ·No | |
| (8) Please choose and rank two types of sound that you can hear in this zone: | ·Human talking |
| ·Footstep | |
| ·Exercising | |
| ·Music | |
| ·Other man-made sound | |
| ·Car, bus or van | |
| ·Bicycle | |
| ·Other machinery sound | |
| ·Bird | |
| ·Insect | |
| ·Other living creature sound | |
| ·Raining | |
| ·Leaf rubbing | |
| ·Other natural physical sound |
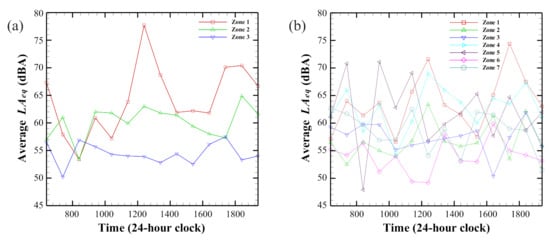
Figure A1.
Average measured at the three and seven data collection zones at (a) Xi’an Jiatong-Liverpool University and (b) Soochow University (Dushuhu Campus), respectively, from 6:40 a.m. to 19:40 p.m. over an average weekday.
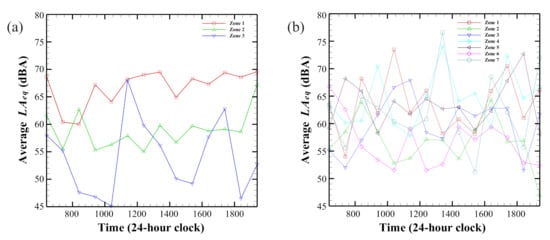
Figure A2.
Average measured at the three and seven data collection zones at (a) Xi’an Jiatong-Liverpool University and (b) Soochow University (Dushuhu Campus), respectively, from 6:40 a.m. to 19:40 p.m. over the weekend.
References
- Kristiansen, J.; Lund, S.P.; Nielsen, P.M.; Persson, R.; Shibuya, H. Determinants of noise annoyance in teachers from schools with different classroom reverberation times. J. Environ. Psychol. 2011, 31, 383–392. [Google Scholar] [CrossRef]
- Connolly, D.M.; Dockrell, J.E.; Shield, B.M.; Conetta, R.; Cox, T.J. Students’ perceptions of school acoustics and the impact of noise on teaching and learning in secondary schools: Findings of a questionnaire survey. In Proceedings of the 6th International Building Physics Conference (IBPC 2015), Torino, Italy, 14–17 June 2015; Volume 78. [Google Scholar] [CrossRef] [Green Version]
- Paakkonen, R.; Vehvilainen, T.; Jokitulppo, J.; Niemi, O.; Nenonen, S.; Vinha, J. Acoustics and new learning environment—A case study. Appl. Acoust. 2015, 100, 74–78. [Google Scholar] [CrossRef]
- Mealings, K.T.; Buchholz, J.M.; Demuth, K.; Dillon, H. Investigating the acoustics of a sample of open plan and enclosed Kindergarten classrooms in Australia. Appl. Acoust. 2015, 100, 95–105. [Google Scholar] [CrossRef]
- Sala, E.; Rantala, L. Acoustics and activity noise in school classrooms in Finland. Appl. Acoust. 2016, 114, 252–259. [Google Scholar] [CrossRef]
- Pinho, P.G.; Pinto, M.; Almeida, R.M.S.F.; Lopes, S.M.; Lemos, L.T. Aspects concerning the acoustical performance of school buildings in Portugal. Appl. Acoust. 2016, 106, 129–134. [Google Scholar] [CrossRef]
- Madbouly, A.I.; Noaman, A.Y.; Ragab, A.H.M.; Khedra, A.M.; Fayoumi, A.G. Assessment model of classroom acoustics criteria for enhancing speech intelligibility and learning quality. Appl. Acoust. 2016, 114, 147–158. [Google Scholar] [CrossRef]
- Gramez, A.; Boubenider, F. Acoustic comfort evaluation for a conference room: A case study. Appl. Acoust. 2017, 118, 39–49. [Google Scholar] [CrossRef]
- Nedojedla, P.; Kollarova, H.; Azeem, K.; Mrazkova, E.; Jirik, V.; Vojkovska, K.; Kozakova, I.; Janout, V. A Study Evaluating Noise Levels at Selected Schools in the Czech Republic. Cent. Eur. J. Public Health 2018, 26, 316–320. [Google Scholar] [CrossRef] [PubMed] [Green Version]
- Peng, J.; Lau, S.K.; Zhao, Y. Comparative study of acoustical indices and speech perception of students in two primary school classrooms with an acoustical treatment. Appl. Acoust. 2020, 164, 107297. [Google Scholar] [CrossRef]
- Pillay, D.; Vieira, B.L. Noise, screaming and shouting: Classroom acoustics and teachers’ perceptions of their voice in a developing country. S. Afr. J. Child. Educ. 2020, 10, a681. [Google Scholar] [CrossRef] [Green Version]
- Levandoski, G.; Zannin, P.H.T. Quality of Life and Acoustic Comfort in Educational Environments of Curitiba, Brazil. J. Voice 2020, 164. [Google Scholar] [CrossRef] [PubMed]
- Lee, H.P.; Lim, K.M.; Kumar, S. Noise assessment of elevated rapid transit railway lines and acoustic performance comparison of different noise barriers for mitigation of elevated railway tracks noise. Appl. Acoust. 2021, 183, 108340. [Google Scholar] [CrossRef]
- Lee, H.P.; Kumar, S.; Garg, S.; Lim, K.M. Characteristics of aircraft flypast noise around Singapore Changi international airport. Appl. Acoust. 2022, 185, 108418. [Google Scholar] [CrossRef]
- Garg, S.; Lim, K.M.; Lee, H.P. An averaging method for accurately calibrating smartphone microphones for environmental noise measurement. Appl. Acoust. 2019, 143, 222–228. [Google Scholar] [CrossRef]
Publisher’s Note: MDPI stays neutral with regard to jurisdictional claims in published maps and institutional affiliations. |
© 2022 by the authors. Licensee MDPI, Basel, Switzerland. This article is an open access article distributed under the terms and conditions of the Creative Commons Attribution (CC BY) license (https://creativecommons.org/licenses/by/4.0/).