Article

Influence of Sound-Absorbing Material Placement on Room Acoustical Parameters

1
Lumir Oy, 01510 Vantaa, Finland
2
Department of Computer Science, School of Science, Aalto University, 00076 Aalto, Finland
3
Department of Bioproducts and Biosystems, School of Chemical Engineering, Aalto University, 00076 Aalto, Finland
*
Author to whom correspondence should be addressed.
Acoustics 2019, 1(3), 644-660; https://doi.org/10.3390/acoustics1030038
Submission received: 29 June 2019 / Revised: 31 July 2019 / Accepted: 3 August 2019 / Published: 7 August 2019
(This article belongs to the Special Issue Room Acoustics)

Abstract

:
The reverberation of a room is often controlled by installing sound absorption panels to the ceiling and on the walls. The reduced reverberation is particularly important in classrooms to maximize the speech intelligibility and in open-plan offices to make spaces more pleasant. In this study, the impact of the placement of the absorption material in a room was measured in a reverberation room and in a mockup classroom. The results show that absorption material is less efficient if it is mounted to the corners or on the edges between the walls and ceiling, if the sound field is more or less diffuse. If the room modes dominate the sound field, the most efficient location for the sound-absorbing material was found at one of the surfaces causing the modes. The results help acoustical consultants to place the absorption material in optimal locations and, generally, minimize the amount of material and save costs.

1. Introduction

Acoustic conditions of classrooms have been proven to have significant influence on the performance of students and working stress of teachers. Poor acoustics may lead to difficulties in learning and social interaction as well as to greater time lost to disruptive activities during lessons [1,2,3,4]. In general, the younger the child, the higher the susceptibility to high noise levels and reverberation [3]. Special consideration should be given to the acoustics of spaces where children attend classes that are given in a foreign language, and spaces where there are hearing-impaired students or children with speech and language difficulties, and attention deficit or hyperactivity disorders [1]. Improvements in the acoustic conditions of classrooms also have a positive impact on well-being of teachers [5,6].
The main acoustic elements employed in the control of sound fields are sound absorbers, reflective surfaces, and diffusers. The latter two are mainly used to preserve and distribute sound energy, whereas the role of sound absorbers is the reduction of sound levels and control of reverberation [7]. The effect of diffusers depends on scattering properties, as well as on the position of the source, the receiver and the diffuser [8,9]. In addition to prevention of echoes and focusing effects, diffusers can also be used to reduce sound levels and control reverberation [9]. This is because diffusers can be placed strategically to disperse incidence sound energy to areas with greater absorption.
An adequate selection and placement of acoustic elements is essential to achieve optimal acoustic conditions with minimal costs. Optimal conditions are determined by the use of a space. In meeting and teaching situations speech intelligibility is the most relevant room acoustic parameter. High speech intelligibility is achieved by increasing signal-to-noise ratio (SNR) and reducing reverberation time. The former requires reducing noise and increasing speech levels, whereas the latter involves eliminating late sound reflections, reflected sound arriving at the listeners after 50 ms. Early reflections, on the contrary, are beneficial for speech intelligibility as they reinforce direct sound, resulting in an increase in SNR [10].
In this study, the influence of sound-absorbing material placement was investigated by both performing measurements of sound absorption coefficients in a reverberation room and in a furnished mockup classroom characterized by a considerably lower degree of diffusion. In the classroom, reverberation time ( T 20 ), speech clarity ( C 50 ) and speech transmission index (STI) were measured with the same amount of sound-absorbing material placed at different locations. C 50 and STI are appropriate supplementary acoustic descriptors to reverberation time as they account for early reflections which are ignored in reverberation time measurements [11]. The purpose of the study was to evaluate variations on the main acoustical parameters for speech as the same amount of sound-absorbing material is displaced from the middle of the room to the corners. The results show the worst placing for sound absorbers that should be avoided to achieve target acoustic conditions with the minimum amount of sound-absorbing material.

2. Background and Related Research

As the effect of signal-to-noise ratio is much more significant for speech intelligibility than room acoustic characteristics, priority should always be given to the reduction of ambient noise levels [12]. In general, noise sources in classrooms are HVAC systems, external sources and, above everything, the pupils themselves [13,14]. Once an adequate SNR has been achieved, the focus should be on optimizing room acoustics by increasing the early-to-late sound energy ratio [12]. An effective acoustic treatment to increase early-to-late sound energy in classrooms involves the use of combinations of diffusers and sound-absorbing materials [15].
Reverberation times longer than 0.5 s [16], and longer than 0.6 s [14] have been reported to deteriorate speech quality in classrooms. This effect is attributed to masking effects caused by late reflections on direct and early sound. Furthermore, long reverberation times may also deteriorate speech quality by reducing SNR. This effect depends on the distances of speech and noise sources to the listeners [17]. Tumultuous pupils close to listener excite the room and when the teacher is more far away, the noise levels are increased resulting in smaller SNR. The opposite occurs when listeners find speech sources closer than noise sources. Too short reverberation times, due to excessive use of sound-absorbing materials, are also undesirable as they force teachers to speak louder in an effort to be heard by students located at back rows [14]. In such situations, sound energy contribution from early reflections to direct sound is insufficient [10]. Efforts in speaking louder increase risks of developing voice disorders [18,19].
The influence of placement and amount of sound-absorbing material on acoustics of classrooms has been studied by many authors. Sala and Viljanen [19] investigated the optimal acoustic treatment for speech rooms rather than the optimal placement of sound absorbers for maximum efficiency, as they varied the amount of material used between the absorption material arrangements tested. Their work concluded that the optimal arrangement of sound-absorbing material to achieve acceptable acoustic conditions for speech involves the distribution of the material in at least two surfaces (ceiling and back wall), and covering around 30% of the total surface area of walls and ceiling. They reported that using larger amount of absorbing material results in an increment in the costs of building materials that leads to an insignificant improvement in speech intelligibility and excessive attenuation of sound levels. Bistafa and Bradley [20] studied both different acoustic treatments with varying amount of sound-absorbing material, and the efficiency of sound-absorbing materials by testing the same amount of material in different configurations. They also compared the accuracy of seven analytical expressions (Sabine [21], Eyring [22], Millington [23], Cremer [24], Kuttruff [25], Fritzroy [26] and Arau-Puchades [27]) and two pieces of room acoustic software (ODEON 2.6 and RAYNOISE 3.0) to predict reverberation times measured in a simulated rectangular classroom, for different configurations of sound-absorbing materials. Their study concluded that none of the analytical expressions or the acoustic software was able to consistently predict reverberation times within a prediction accuracy of 10%. The most accurate analytical expression was shown to depend on the amount and distribution of sound-absorbing material in the room. Overall, the expression developed by Arau-Puchades was concluded to be the formulas that predicted reverberation times with the smallest average relative error. Their reverberation time measurements for the different configurations of sound absorbers showed differences in average reverberation time up to 0.3 s. The phenomenon was attributed to the higher efficiency of sound-absorbing materials when materials are uniformly distributed in the room. The present study contributes to the work in [19,20] by providing evidence on the influence of placing sound-absorbing materials separated from edges and corners. Such material arrangements were not tested in these works.
Kuttruff [28] developed a method that was not based on the assumption of diffuse field. The method assumes diffuse reflections and not constant irradiation strength, the latter concept defined as the incident energy on a unit area per second. Kuttruff recognized that assuming diffuse reflections may not be realistic; however, he knew that at each reflection, a small portion of the reflected energy is dispersed into nonspecular directions. Thus, after several reflections, all the specular energy is converted into diffuse sound energy. This results in an exponential decay curve with the same decay constant all around the room.
Schroeder and Gerlach [29] computed reverberation times in rooms of different shape and with varying absorber location. In their computations, the authors rejected the traditional formulas of Sabine and Eyring [21,22] as these formulas do not consider room shape and absorber locations, factors that have been shown to have an influence in reverberation times [30]. They applied the first-order Markov theory to calculate the probabilities of a sound ray to hit a given wall taking into account the wall that was previously hit. This technique was shown to provide reverberation times closer to experimental measurements than those given by the traditional formulas. Their results consistently showed that the smallest reverberation times were obtained when absorbers were located on the smallest walls. It was also reported that for rooms with nearly equal dimensions, absorber locations had no significant influence in computed reverberation times.
An additional shortcoming in the research on influence of sound absorber placement on room acoustics is related to the degree of sound field diffusion [29]. Room acoustic theory applies to ideal conditions that assume perfect diffusion of sound field [30]. Perfect diffuse sound field involves the following assumptions, sound energy arriving from all directions with equal intensity and random phase; and uniform reverberant sound field at every position [31]. The lack of diffuseness in enclosures has been attributed to simplicity of room geometry and poor distribution of sound-absorbing materials [32]. Furthermore, furnishing or adding items in rooms modifies the degree of diffusion [30,33].
Several methods have been proposed to quantify diffuseness [30,32,34,35]. These methods are often classified in different categories based on the raw data needed for their implementation [34]. However, none of them has been accepted as a standard method so far.

3. Methods to Study Absorption Placement

The placement of absorption material was studied in two different rooms. First, the measurements were conducted in a standard reverberation room. Second, to validate the reverberation room measurements in a more realistic scenario, a mockup classroom was built. The mockup classroom was built in a different empty space not as reverberant as the reverberation chamber. It was furnished with 13 tables and 13 chairs.

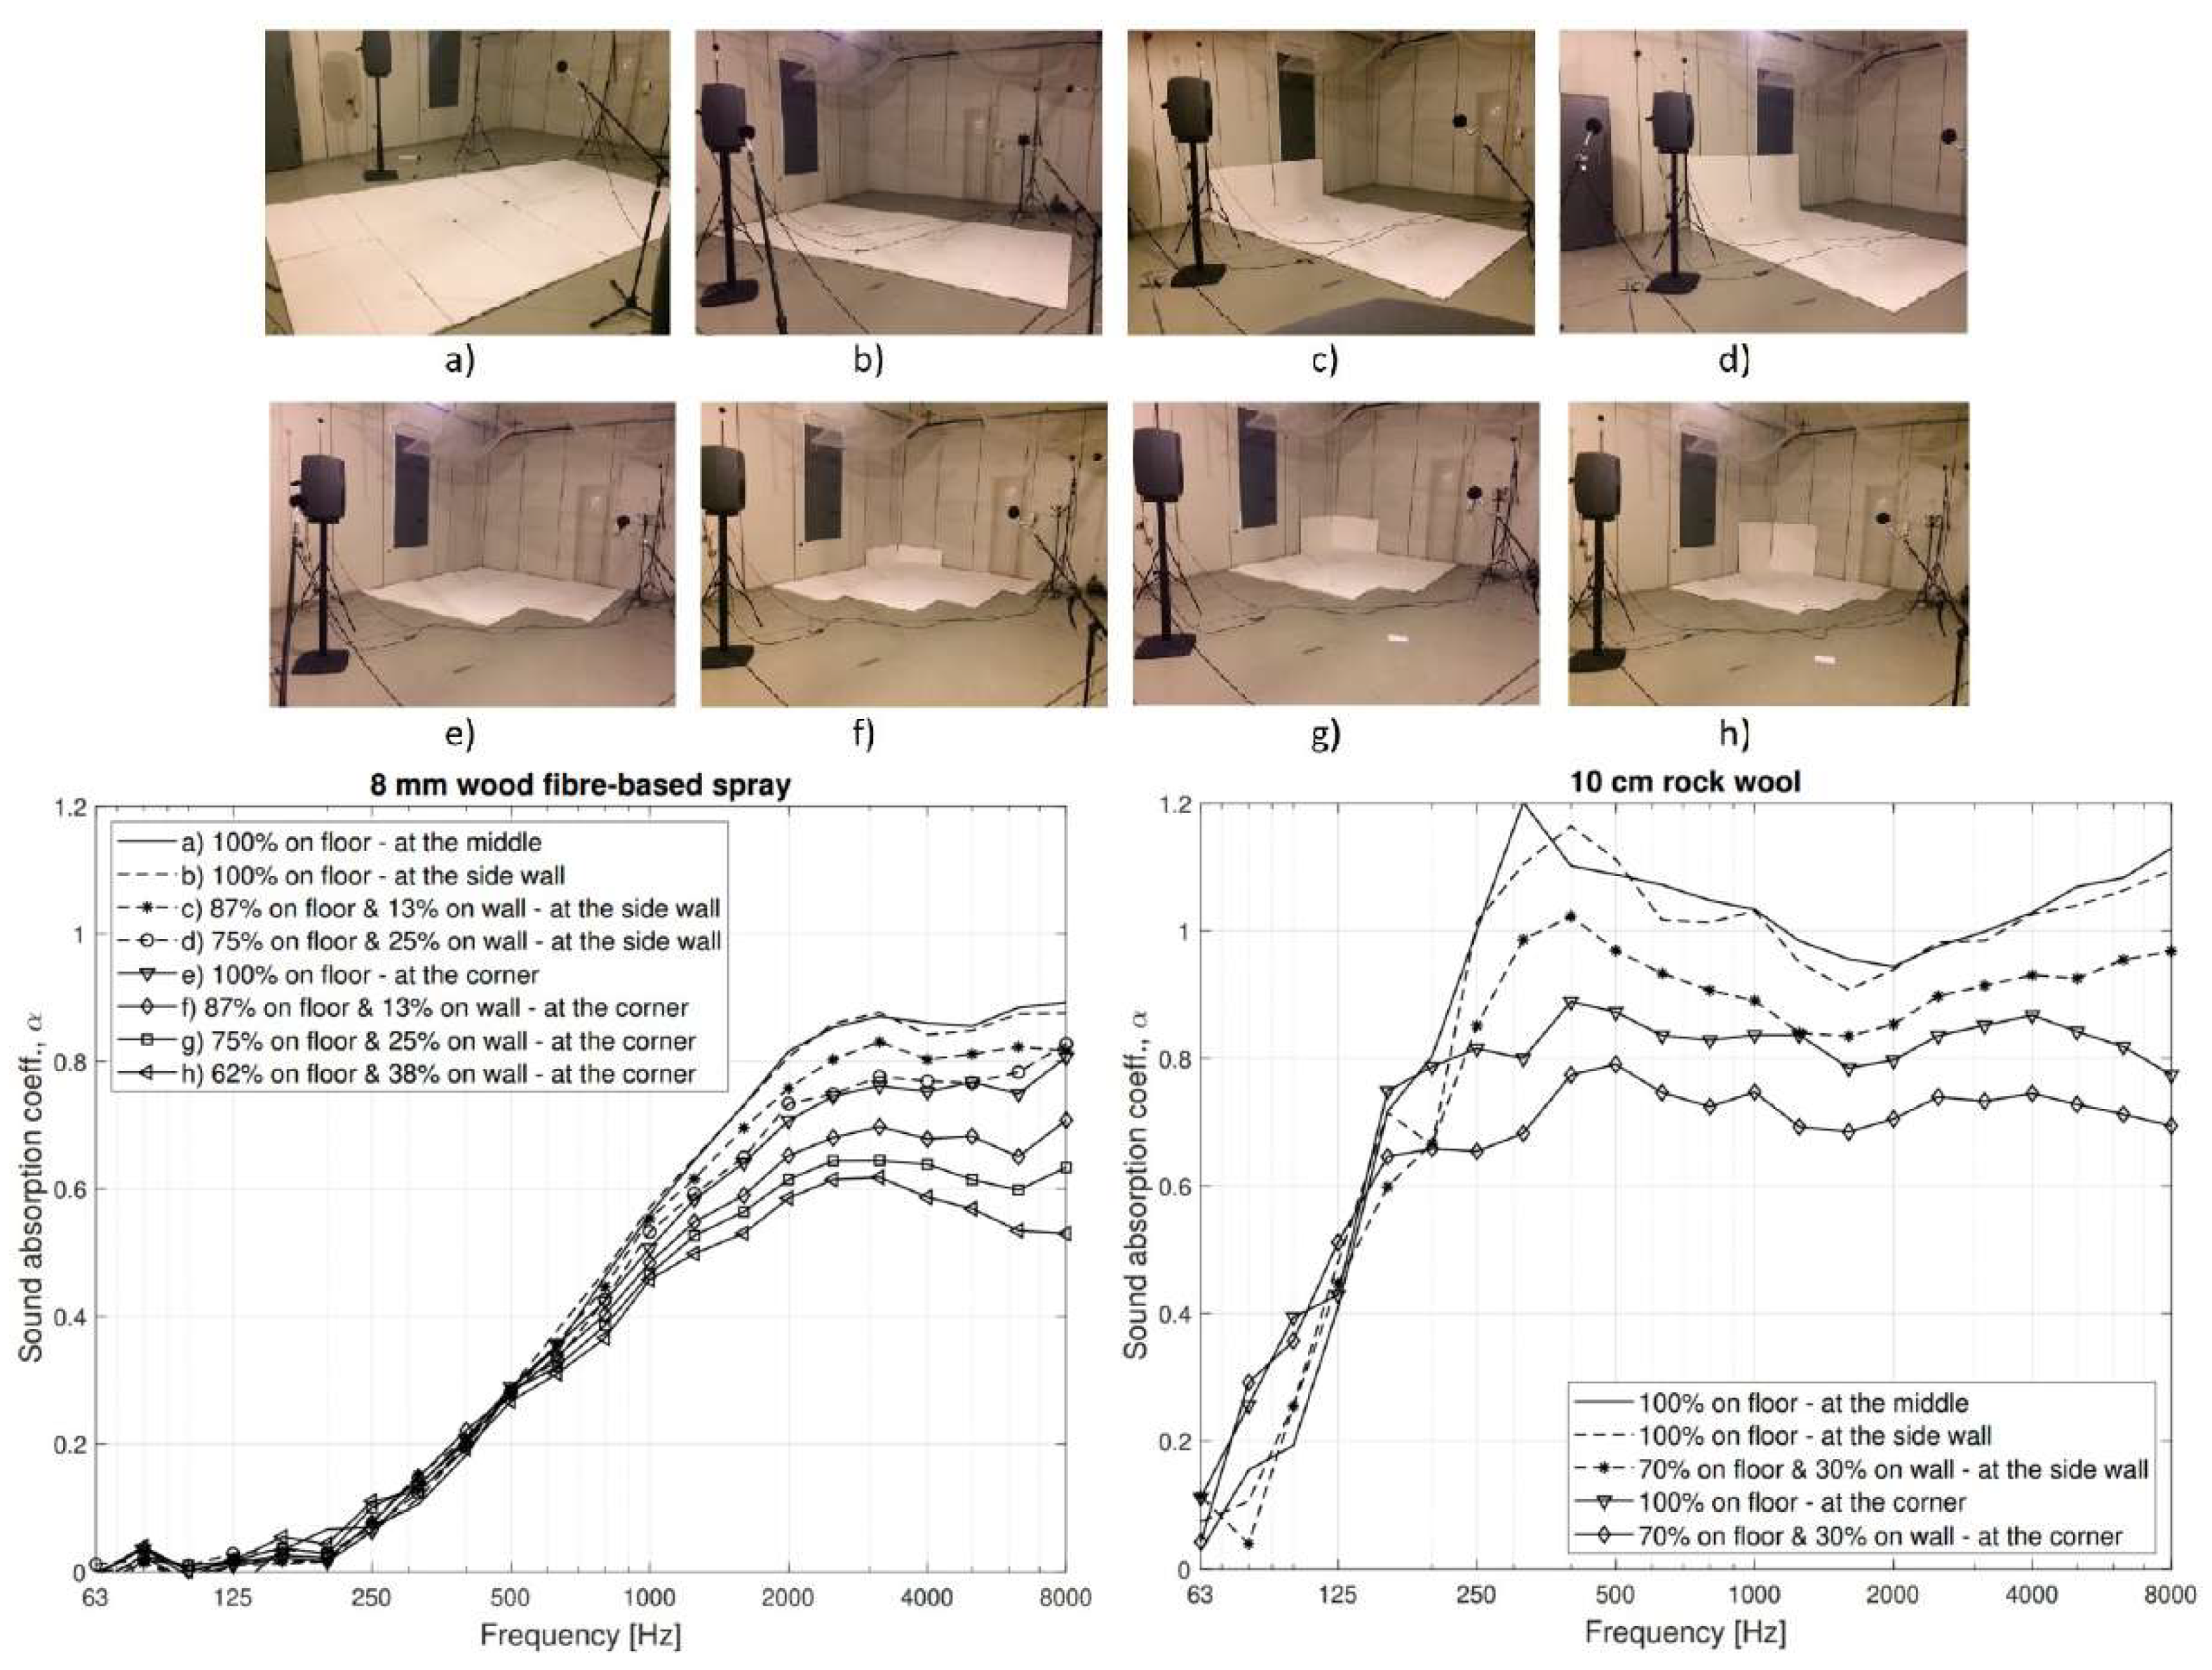
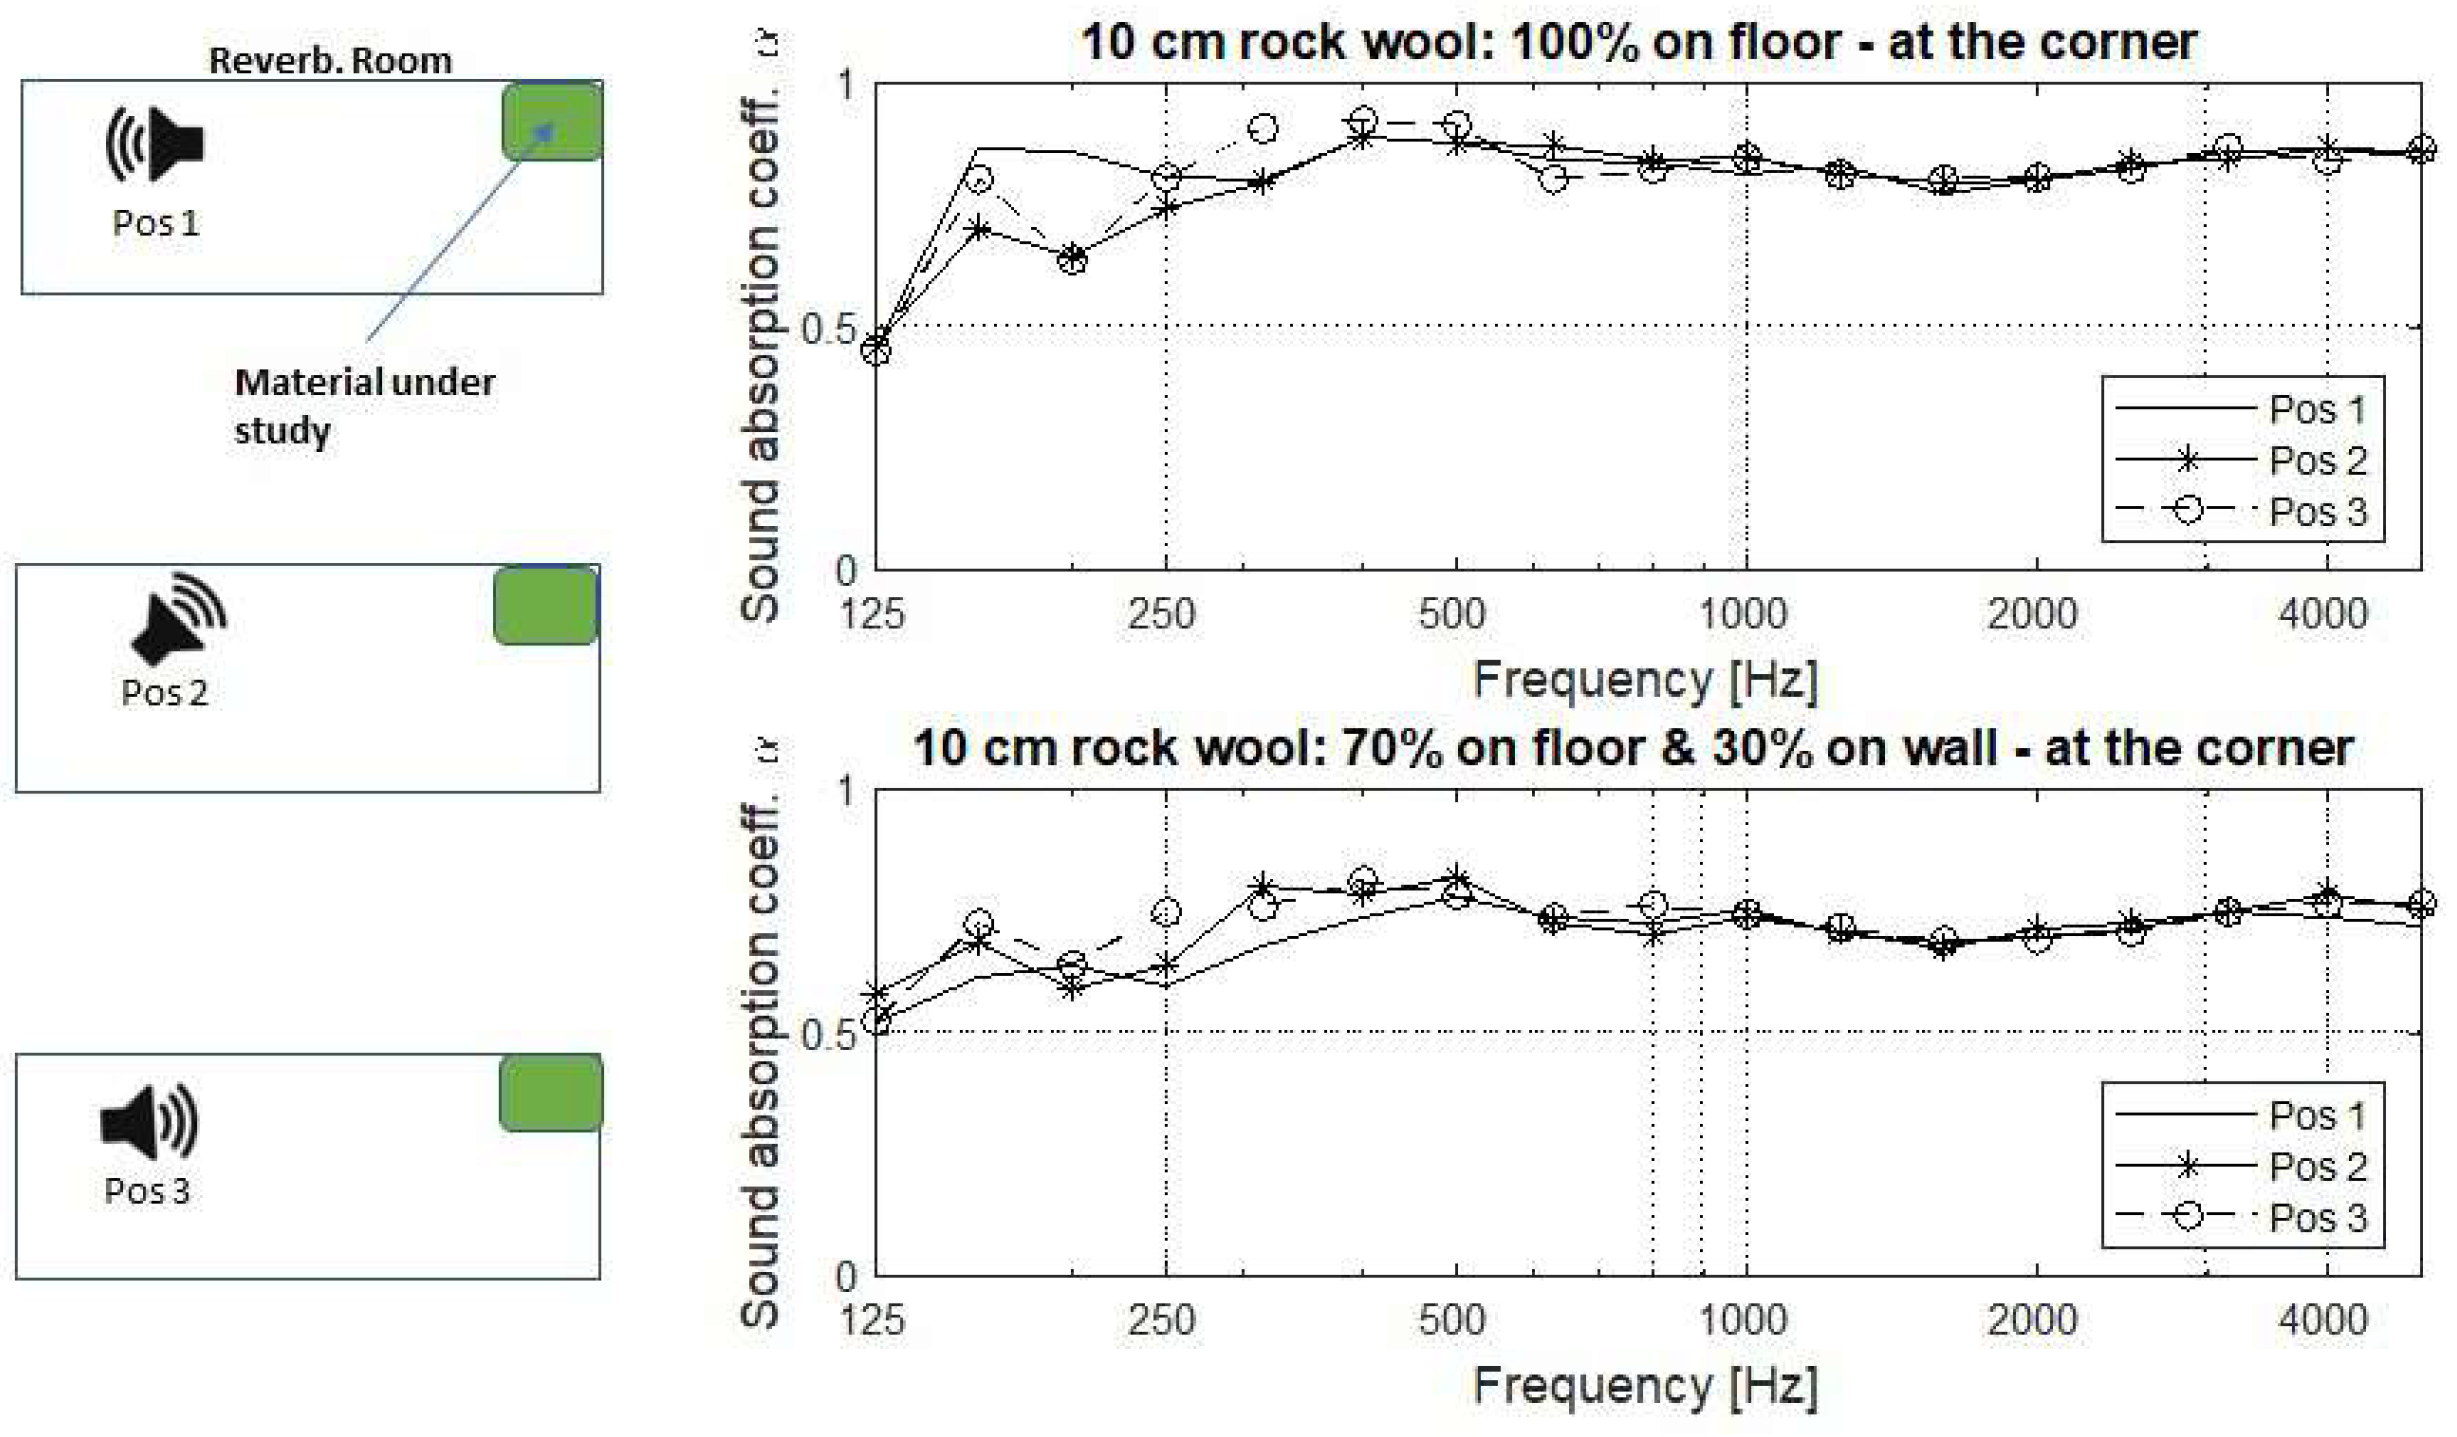
3.1. Reverberation Room

Measurements of sound absorption coefficients were conducted through the reverberation room method defined in ISO-354 [36]. The absorption coefficients measured by this method are referred to as Sabine absorption coefficients as the method assumes perfect diffuse sound field in the reverberation room. However, perfect diffuse sound field conditions are practically impossible to achieve, particularly at lower frequencies where the density of modes is low [37]. Low modal density leads to peaks and valleys in the low end of the frequency response of the room. Furthermore, the diffuse sound field in reverberation rooms is further deteriorated immediately after the sound-absorbing material is inserted in the room, especially in cases where highly absorptive samples are being measured [38]. Despite the limited reproducibility between laboratories, mainly caused by the variability in diffuseness between rooms [34,38,39], the reverberation room is used for the determination of many other relevant acoustic quantities in the field of room and building acoustics, including scattering coefficients of materials [40] and sound power levels of noise sources [41]. Another concern regarding the absorption coefficient measurements in reverberation chambers is the overestimation absorption coefficient obtained at low frequencies. This effect has been attributed to the finite size of the test specimen which leads to diffraction caused at its free edges [42].
The reverberation room used at the Acoustics Laboratory at Aalto University was used in this study. The dimensions of the room were 8.7 m × 6.2 m × 3.6 m, with a volume of 194 m 3 . Following the recommendations given in the ISO standard 354, 8 diffusers were hung around the room to enhance diffuseness. The software ARTA [43], version 1.9.1, was used to measure impulse responses using the inverse sweep-sine technique [44]. A total of 12 reverberation time measurements were obtained, six receiver and two source positions. The sources were Genelec 8040 (Genelec, Finland) loudspeakers and the microphones were omnidirectional 1/2-inch measurement microphones, model 46AF. As opposed to standardized measurements, the loudspeakers were not omnidirectional. However, it has been shown that the use of sound sources with directional patterns differing from omnidirectional has insignificant influence on reverberation time measurements if the measured room is large and reverberant, and the sound field in the room is diffuse [45]. Moreover, to further compensate the use of non-omnidirectional sound sources, the loudspeakers were directed towards boundary diffusers.
The Schroeder frequency [46], is the frequency above which the diffuse field assumption is fulfilled, was calculated to be 275 Hz for this reverberation room. This value agrees with observations made on reverberation time measurements measured at different microphone positions. Below 275 Hz, room modes dominate the sound field and therefore, reverberation time measurements strongly depend on the position of the microphones. At higher frequencies there was much less variation between measurements and in further analysis, the average of all 12 reverberation time values were used.
The purpose of measurements was to detect variations of the Sabine absorption coefficients as the sample is displaced from the middle of the reverberation room to a side wall and to a corner. Measurements were conducted for two types of materials, 0.8 cm wood fiber-based spray and 10 cm rock wool, manufactured by Lumir Oy (Vantaa, Finland) and Rockwool Finland Oy (Vantaa), respectively. The area of each sample was 12 m 2 . When measuring rock wool, borders and empty spaces at the boundaries of walls and floor were covered with reflecting materials to prevent them from absorbing sound. Consequently, the exact same amount of material was always exposed to the sound field. Such treatment of edges was not necessary for the wood fiber sample due to its small thickness, only 8 mm. Temperature and relative humidity were controlled during the measurements to counteract the variability in sound absorption caused by air at different atmospheric conditions.

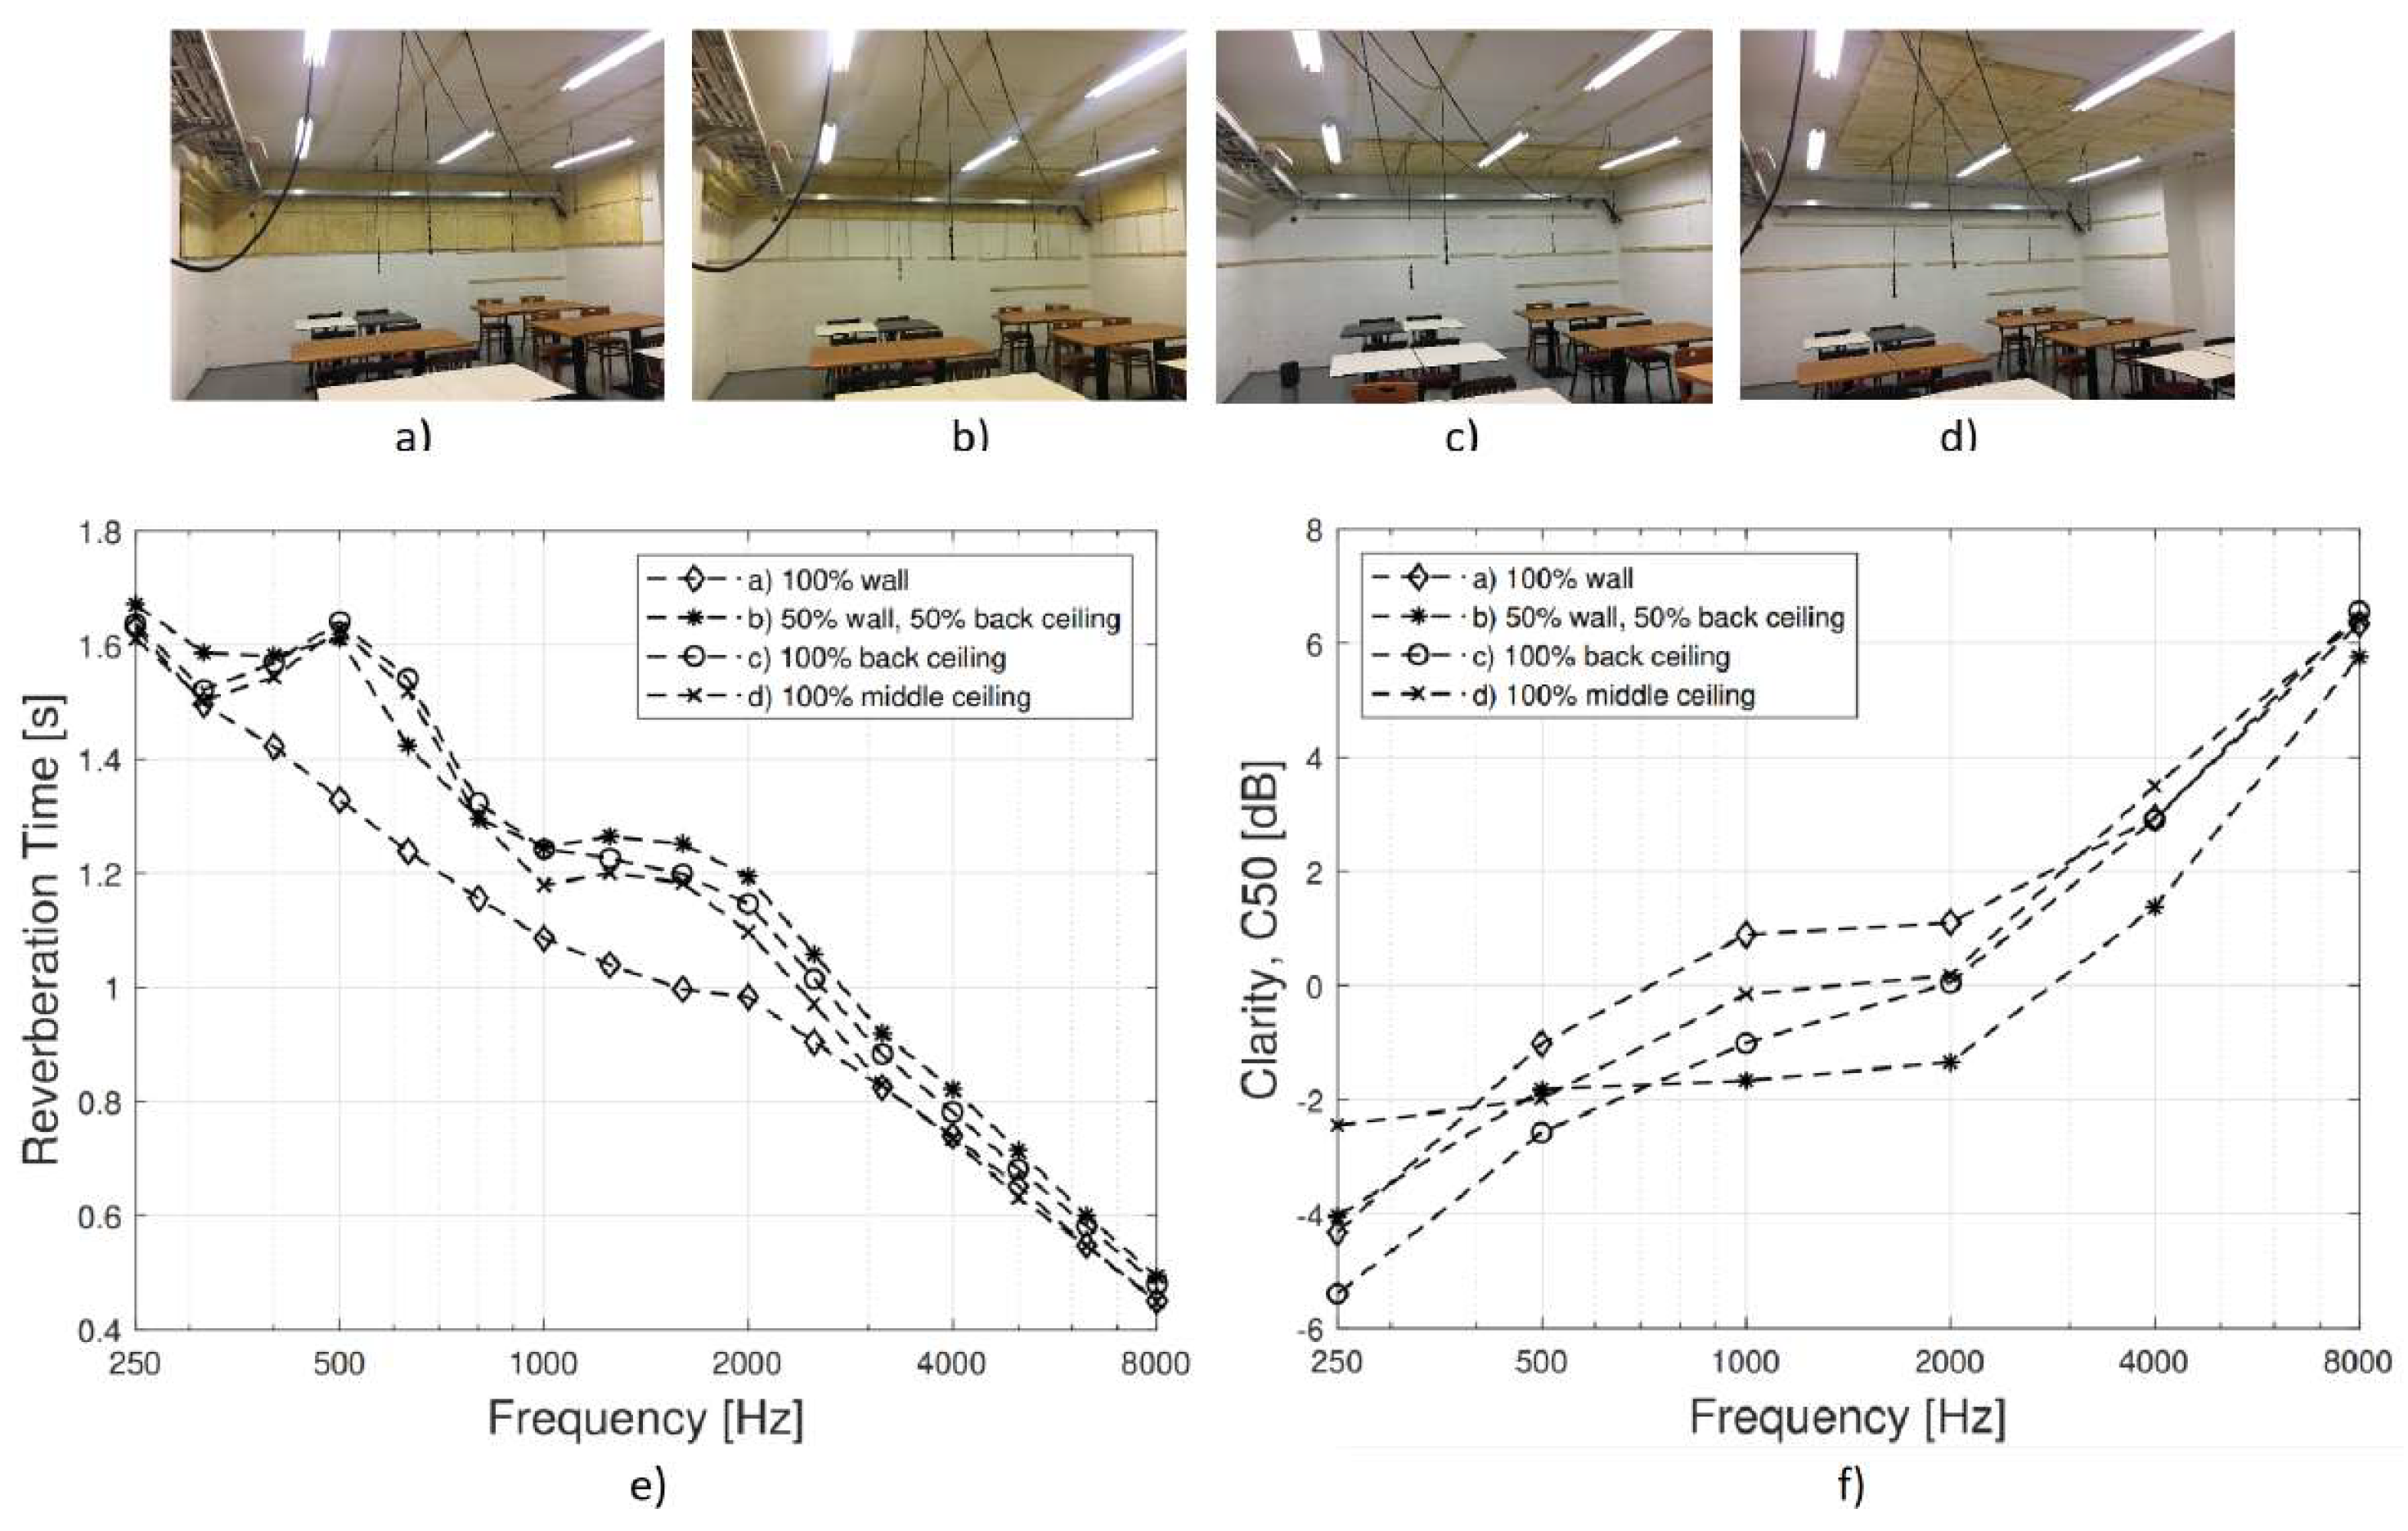
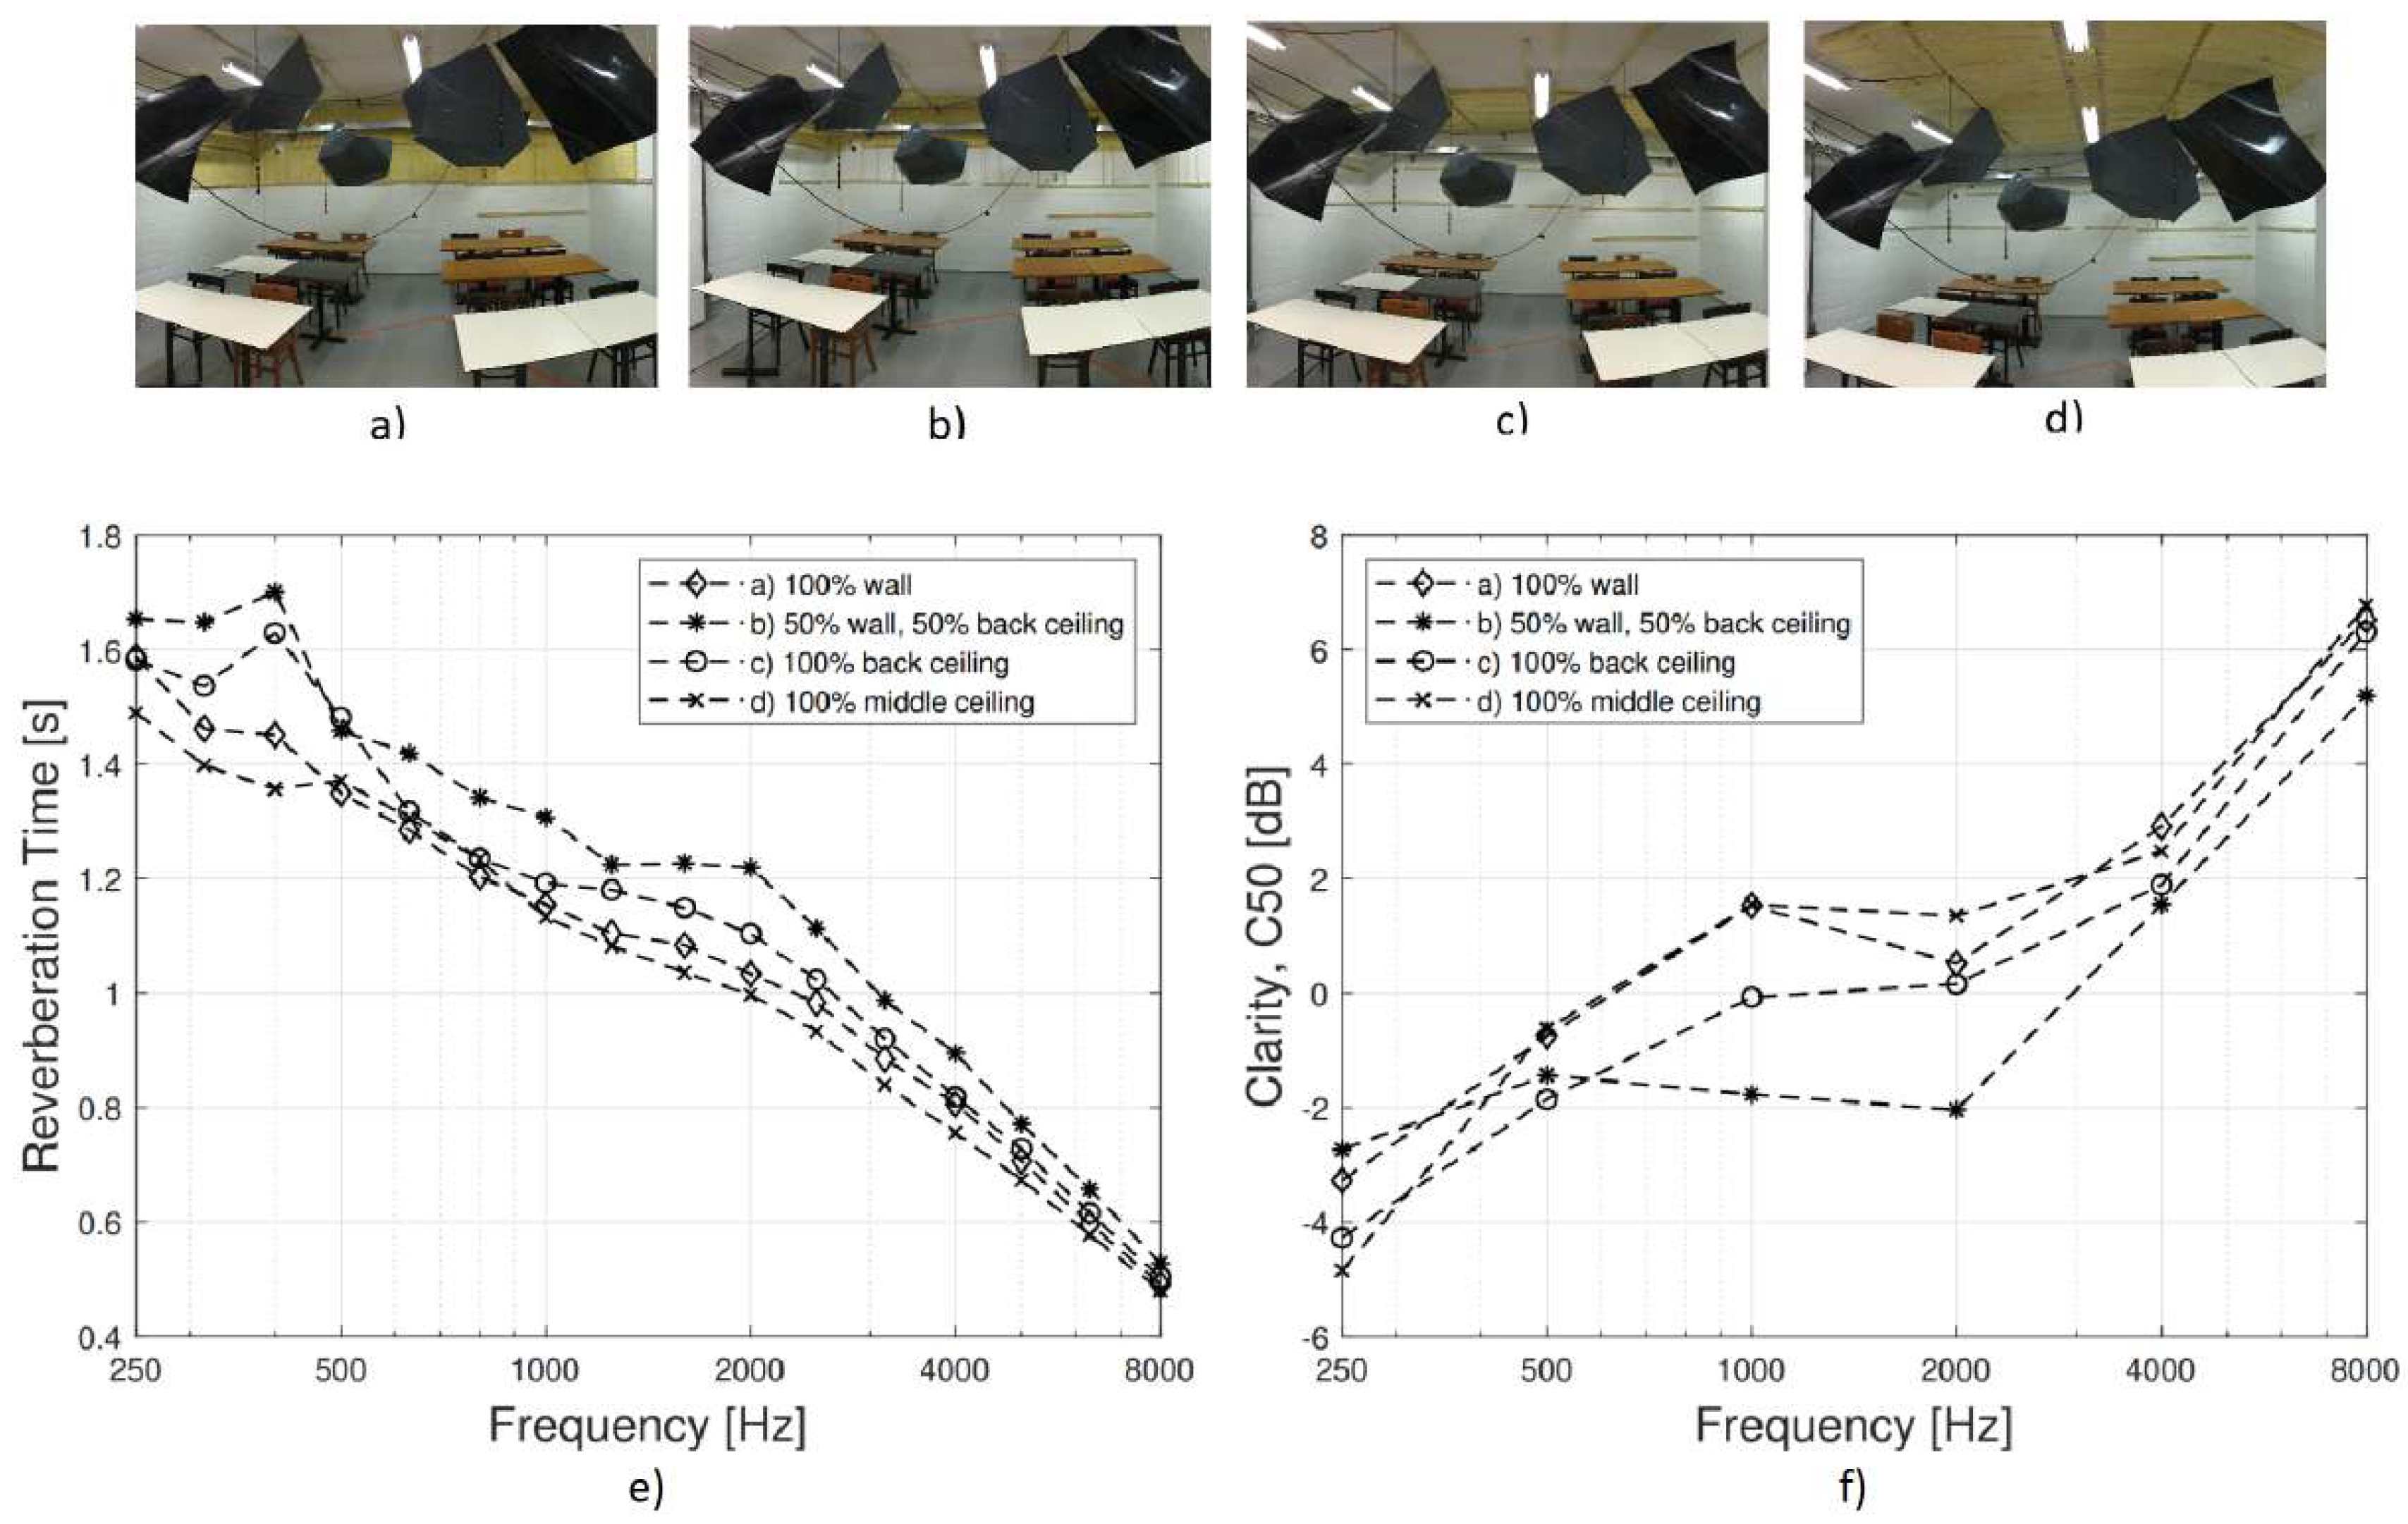
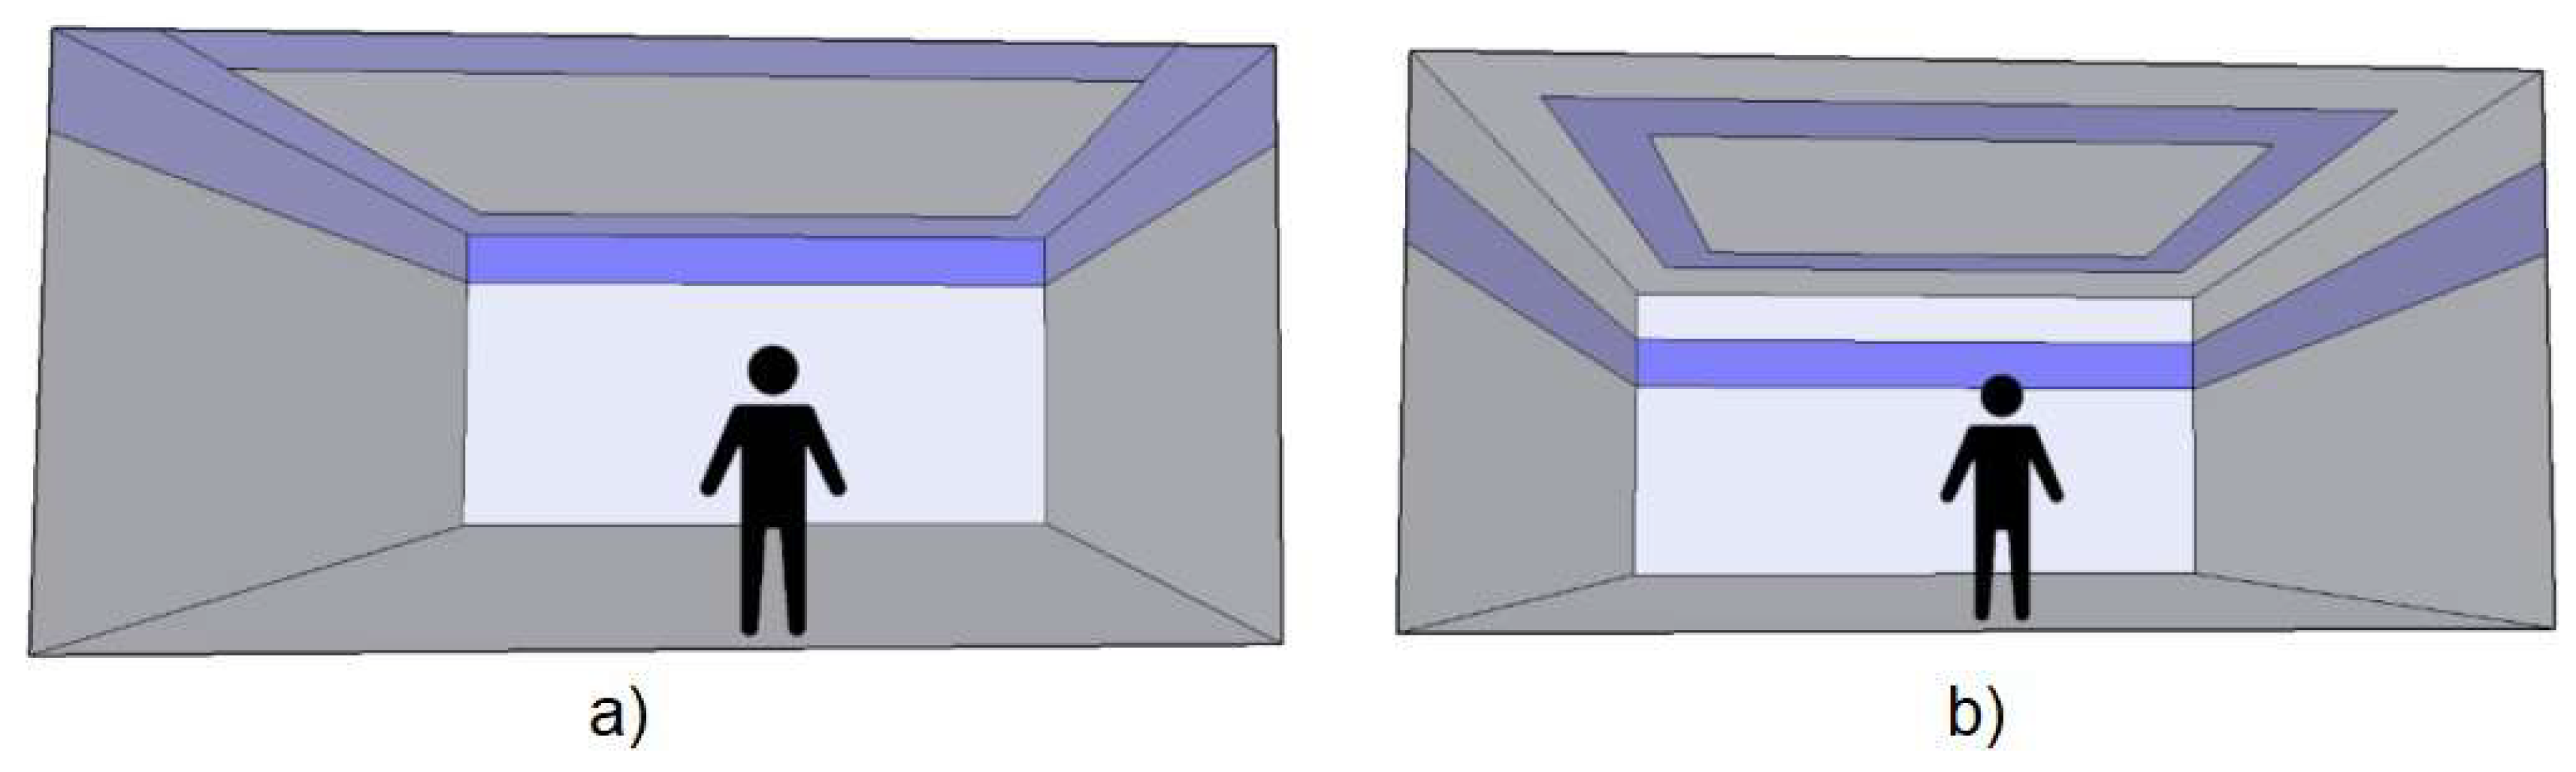
3.2. Mockup Classroom

The layout and dimensions of the mockup classroom are shown in Figure 1. The volume of the room was 125 m 3 and it was furnished with 13 tables and 13 chairs, items that are always present in the classrooms and have a significant effect on the diffusion of sound fields [30,33]. Unoccupied conditions have been considered.
To evaluate the acoustics of the classroom for each material arrangement, measurements of T 20 , C 50 and STI were determined from the measured impulse responses according to ISO 3382-1:2009 [47] and IEC 60268-16:2011 [48]. Measurements were taken at four microphone positions. The software ARTA was used to obtain impulse responses using the inverse sweep-sine technique [44]. A Matlab script was created to compute STI. The sound source was a Genelec 8030B (Genelec, Finland) and the microphones were omnidirectional 1/4-inch measurement microphones, model Superlux ECM-999. The directivity of the Genelec 8030B approximates the directional properties of a human speaker, and thus it was considered to be an appropriate sound source to measure STI and C 50 . The sound source position 1 shown in Figure 1 was used for the measurements of STI and C 50 , whereas reverberation time was obtained as the average of 8 reverberation time values, four receiver and the two sound source positions shown in Figure 1.
The purpose of the measurements in the mockup classroom was to investigate variations on room acoustic parameters as sound-absorbing material is displaced from the middle of the ceiling to the boundaries/corners in a sound field closer to that found in real rooms than in reverberation rooms. Only 8% of the total surface area of walls and ceiling, corresponding to 10.6 m 2 , was covered with 50 mm glass wool, manufactured by Ecophon. A larger amount of material would have misled the main purpose of this research as there was not enough surface area in the ceiling to isolate measurements with absorbers placed only at corners/boundaries from measurements with absorbers placed only at the middle of the ceiling. The following four arrangements of sound-absorbing materials were tested.
(a)
100% at the upper part of the rear and back side walls.
(b)
50% at the upper part of the rear and back side walls and 50% at the back part of the ceiling.
(c)
100% at the back part of the ceiling.
(d)
100% at the middle of the ceiling.
Furthermore, a second set of measurements was carried out in the mockup classroom. The diffusion of the sound field in the classroom was enhanced by hanging a total of six diffusers (five of which were 1 m × 1 m and the other 1 m × 0.25 m). At low frequencies, diffusers were expected to scatter energy from modal paths. The scattered energy may couple to other room modes, thus exciting them further, or it may form new modal paths and thus resulting in higher modal density [49]. At mid and high frequencies, the diffusers abate flutter echoes by redirecting the sound energy bouncing back and forth between two surfaces to other directions [50]. Overall, diffusers reduce the excess energy at the modal frequencies and at the frequencies where flutter echoes occur which leads to a decay of sound energy in the room that is closer to a single exponential decay than to several decay times. This implies an improvement in the level of diffusion of the sound field which allows measurements of acoustic parameters less influenced by the undesired effects caused by room modes and flutter echoes. The diffuseness of the sound field in the mockup classroom is analyzed with and without sound-diffusing elements inserted in the room in Appendix B.

4. Results

4.1. Measurements of Absorption Coefficients
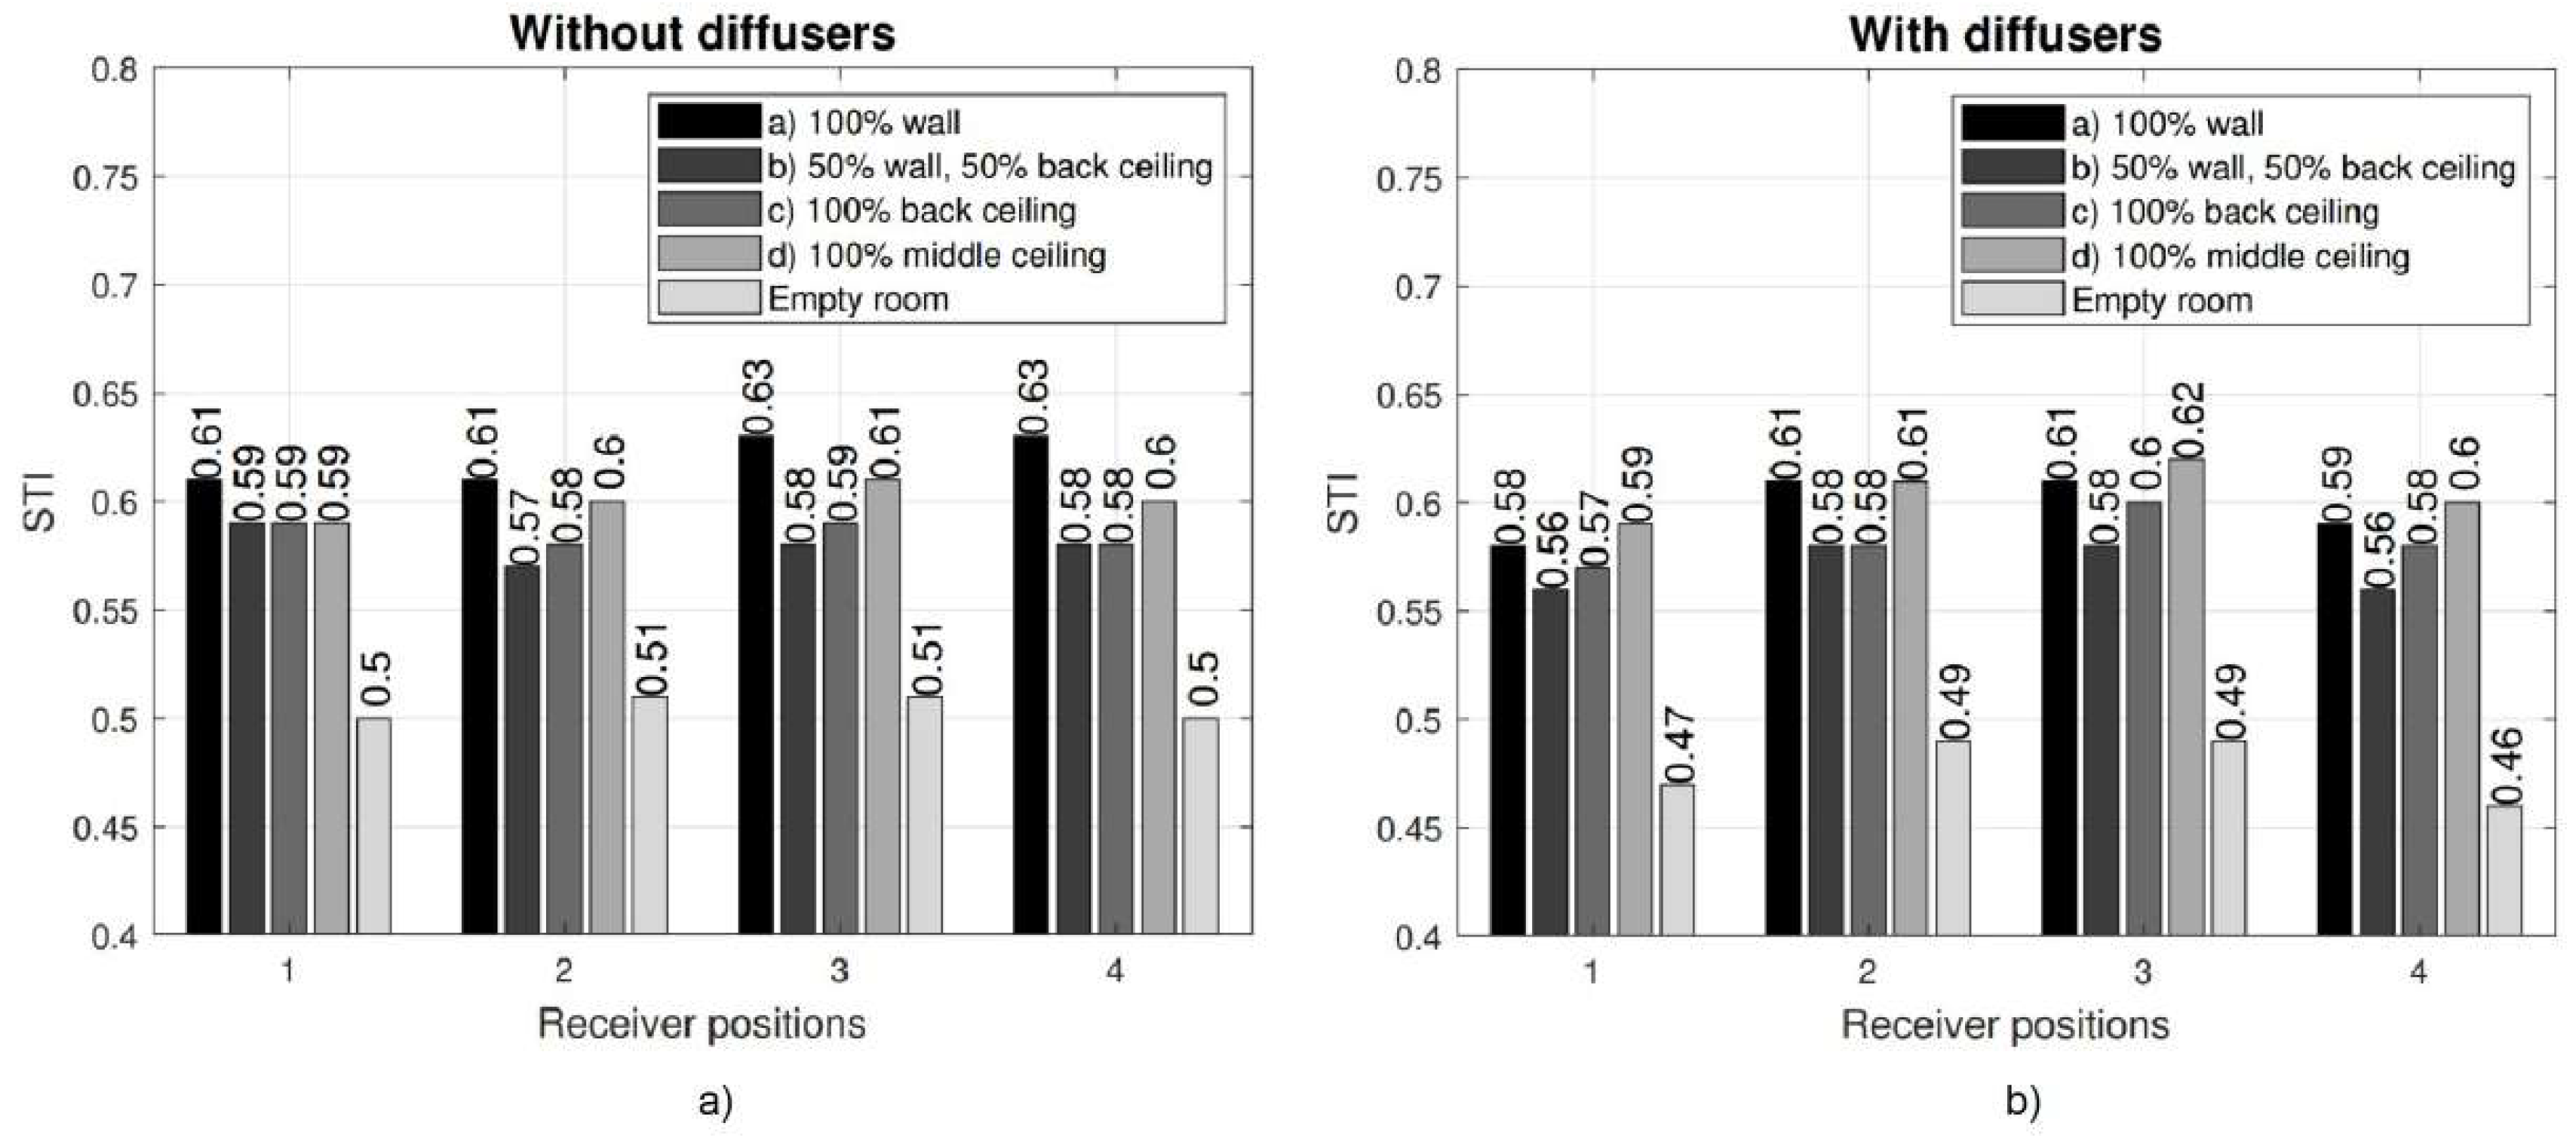
Figure 2 shows the Sabine absorption coefficients for a sample located at the middle of the reverberation room (Figure 2a) and the same sample placed at a side wall (Figure 2b–d) and at a corner (Figure 2e–h) with varying material distribution on the floor and wall. It can be observed that the Sabine sound absorption coefficients are significantly reduced at all frequencies as a larger amount of material is placed close to the corners. This effect would be extended to lower frequencies for materials with higher sound absorption at low frequencies, following the trend observed between the two measured materials. The efficiency of porous materials to dissipate sound energy is reduced over 20% when the material is moved from the middle of the room to a corner. As a consequence, placing porous sound absorbers at boundaries of walls and ceiling, particularly at corners, may lead to the use of larger amount of sound-absorbing material to achieve a specific reverberation time.
In the first interpretation of the results, the phenomenon was attributed to the directivity of the loudspeaker employed in the measurements. In order to dismiss this first hypothesis, measurements of sound absorption coefficients were conducted in the reverberation room with the loudspeaker pointing at three different directions. The results are shown in Appendix A. It can be observed from Figure A1 that the directivity of the loudspeaker has no influence on the sound absorption coefficients as the results agree in all three measurements. Moreover, in [45] the authors reported that the use of sound sources with directional patterns differing from omnidirectional has insignificant influence on reverberation time measurements if the measured room is large and reverberant, and the sound field in the room is diffuse. The results of this experiment together with the findings reported in [45] corroborate that the directivity of the loudspeaker is not the cause of the results obtained in the reverberation room.

4.2. Measurements of T 20 , C 50 and STI

Figure 3 presents the results of the measurements of T 20 and C 50 for the four material arrangements installed in the mockup classroom. The most efficient material arrangement, in terms of reverberation time and clarity, is given by the acoustic treatment where 100% of the material is placed at the upper part of the walls. Such result is not in agreement with the measurements performed in the reverberation room, where the lowest reverberation time was measured when 100% of the material was placed in the middle of the chamber. The other three arrangements provide similar reverberation times. However, it can be seen that at higher frequencies, where the sound field is more diffuse, measured reverberation times are slightly higher as a larger amount of material is accumulated around the corner and the edge of the wall and ceiling. Measurements of C 50 show a similar tendency towards higher values as greater amount of material is placed away from the corners and boundaries of the walls and ceiling. Thus, although presenting small variations between measurements, these results, at higher frequencies, match the results measured in the reverberation room.
At frequencies below 3 kHz, these measurements are highly influenced by the low diffusion of the sound field in this room. Two of the dimensions, length (6.5 m) and width at the middle of the room (6.4 m), are almost equal (see Figure 1). In addition, the width at the rear of the room (5.8 m) is twice the height (2.85 m). Such proportions cause the modes to cluster together which results in low modal density and longer sound energy decays at the modal frequencies [49,51]. Additionally, a flutter echo is detected at around 1–2 kHz. Figure 4 presents the spectrograms of the impulse responses measured in the mockup classroom for three scenarios: (a) without any sound absorbers installed on the surfaces; (b) with the absorbers installed at the middle of the ceiling; (c) and with the absorbers placed at the rear wall. It is shown that placing the absorbers on the rear wall abates the energy of the strong modes and flutter echo found at around 500 and 1–2 kHz, respectively. The abatement of such artefacts leads to the lowest measured reverberation time, as can be seen from Figure 3. This demonstrates that under poor diffuse field conditions the most effective placement for the sound-absorbing material is found on the surfaces that contribute to the formation of strong modes and flutter echoes. Placing sound absorbers on those surfaces ensures the reduction of sound energy trapped in a particular cyclic path, which results in a faster decay of sound energy.
Figure 5 shows measurements of T 20 and C 50 with the hanging diffusers installed in the mockup classroom. As can be seen from Figure A2, in Appendix B, the hanging diffusers have significantly remediated the problem caused by the flutter echo. They have also scattered some energy from modal frequencies; however, a larger diffusive area would have been needed to further reduce the effect of room modes. Nevertheless, at frequencies above 1000 Hz, the hanging elements installed in the room are sufficient to improve the level of diffusion to an extent that allows measurements of T 20 and C 50 to follow the tendency found in the measurements conducted in the reverberation room. Reverberation time measurements indicate that placing sound-absorbing materials at the junctions of walls and ceiling and particularly at the corners provide the less efficient material performance. A reduction of 0.1 to 0.2 s is observed in the frequency range from 1 to 5 kHz between the arrangement concentrating the largest amount of material at the edge wall/ceiling (50% wall–50% ceiling) with respect to the acoustic treatment where 100% of the material is placed at the middle of the ceiling. As expected, clarity is found to agree with reverberation time measurements at frequencies above 1 kHz. Below this frequency there is still significant influence of the natural modes on the measurements that impedes the generalization of the results.
Regarding the speech intelligibility, Figure 6 presents the calculated STI values for each of the material arrangements with and without diffusers inside the classroom. In the scenario where there are no hanging diffusers in the room, the calculated STI values range from 0.57 to 0.63 (not considering STI values of the empty room case), corresponding to fair, and good speech quality respectively, according to the classification given in [48]. The results are consistent with the measured reverberation times and clarity. The highest STI values are obtained for the arrangement where 100% of the material is placed at the back wall, whereas the lowest STI values are seen for the acoustic treatment that concentrates 50% of the material at the back wall and 50% on the ceiling, together with the acoustic treatment with 100% of the material in the back part of the ceiling.
The STI values calculated for the scenario where diffusers are hanging in the room confirms that under more diffusive sound field conditions, poorer speech intelligibility is accomplished when sound absorbers are placed at the boundaries/corners. The lowest STI values were obtained for the material arrangement where 50% of the material was placed on the ceiling and 50% on the upper wall. The highest STI values were given by the acoustic treatment where absorbers are in the middle of the room. A comparison between the lowest and highest STI values shows differences in STI ranging from 0.03 to 0.04 at all measurement positions. Such differences are above the just noticeable difference (JND) in STI values reported in [52], where the authors found a JND in STI values of 0.03, and 1.1 dB in C 50 values, from speech experiments with non-expert listeners. However, the authors in the same study claimed that differences of 0.03 in STI values are complicated to detect even in controlled situations. A difference of 0.1 in STI values, 3 dB in C 50 values, was proposed as a more realistic estimate to perceive obvious improvements in the acoustical properties of rooms for speech. Calculated STI values in this study agree with the theoretical description on speech intelligibility dependence on reverberation time under high SNR conditions given in [53].
STI values were computed from impulse responses measured under unoccupied conditions. The measured A-weighted ambient noise levels are reported in Table 1. STI values were computed without the contribution of SNR and thus reverberation time is the only acoustic parameter considered in the computation of STI. In occupied conditions, the STI values are assumed to be lower as occupants, most likely, would increase noise levels. Furthermore, as SNR decreases, the effect of reverberation time on STI is less noticeable because SNR is the dominant parameter on the determination of speech intelligibility [12].

5. Conclusions

The influence of placement of sound-absorbing materials in a room was investigated by conducting measurements in a reverberation room to determine the Sabine absorption coefficients with the same amount of material placed at different locations. The results demonstrated that corners, followed by any edge between two surfaces of the room, are the less efficient placements in terms of reduction of reverberation time. When materials were placed at the corners the Sabine absorption coefficients were over 20% lower at all frequencies. Furthermore, the highest Sabine absorption coefficients were obtained for the sample placed at the middle of the floor, which involves maximum distance from all corners of the room.
Measurements in the reverberation room were followed by acoustical measurements of reverberation time, speech clarity and speech transmission index in a mockup classroom with the same amount of material placed at four different locations. The results showed that the influence of placement of sound-absorbing materials is determined by the degree of diffusion of the sound field and strength of the modes. It was shown that when modes dominate the sound field the most efficient placement for the sound-absorbing material is found at one of the surfaces causing the modes. When the sound field was made more diffuse with hanging reflectors, placing sound-absorbing materials at the edges of walls and ceiling and especially at the corners, resulted in the less efficient acoustic treatment. The highest reverberation time and lowest values of speech clarity and STI were measured when the material was placed at the corners.
The area of the mockup classroom treated with absorbing material (8% of the total walls and ceiling surface area) was not sufficient to achieve the recommended reverberation time of 0.5 s. The material arrangement in which the sound-absorbing material was placed in the middle of the room provided the best acoustic conditions for speech. This was true at frequencies where the sound field reached a sufficient level of diffusion, which means here a sound field with the absence of undesirable artefacts such as strong modes, flutter echoes, echoes, or sound focusing effects. For this condition, a C50 value of 1.8 dB and reverberation time of 1.1 s were measured at 1 kHz. The average STI value was 0.6.
Acoustics designs with sound-absorbing materials placed at the boundaries of walls and ceiling are not unusual. Such acoustic design is for example suggested as the primary acoustic treatment for classrooms in the Finnish Standard SFS 5907 [54]. In this acoustic design, depicted in Figure 7a, material is placed on the upper part of the side and back walls and on the ceiling, avoiding the area on the middle of the ceiling. The idea is to reinforce direct sound with early reflections arriving from the middle of the ceiling. However, this placement of acoustic material has been shown here to reduce less the reverberation time. Absorbers should be separated from the corners and edges, where it seems that there is less sound energy that could be absorbed.
The findings concerning the worst placement of sound absorbers at the edges, and specially at the corners, is generalized here for any room. However, further research is needed to determine the impact of these results in a classroom with a larger amount of surface area covered with absorbing material to achieve the recommended reverberation time of 0.5 s. For example, for future research is the study of the recommended placement given in the Finnish Standard SFS 5907 but with the absorbing materials displaced away from edges and corners, as depicted in Figure 7b. It would interesting to determine the difference in amount of material needed to achieve the same acoustic conditions for speech.

Author Contributions

J.C. conducted the acoustical measurements in the reverberation room and mockup classroom, implemented the Matlab script for STI calculations and wrote the paper. T.H. and T.L. participated in the analysis of the measured acoustical parameters and writing the paper.

Funding

This research received no external funding.

Acknowledgments

J.C. gratefully acknowledges support from Lumir Oy (Finland), and cooperation of Lumir personnel Marko Makkonen, Hannes Hynninen, Jonna Rajaharju, Toni Haapasaari, and Jarko Makkonen.

Conflicts of Interest

The authors declare no conflict of interest.

Appendix A. Effect of the Directivity of the Loudspeaker on Sound Absorption Coefficient Measurements

Sound absorption measurements were conducted with the loudspeaker pointing at three different directions to study the influence of the non-omnidirectionallity of the loudspeaker on the measurements. The three scenarios are shown in Figure A1. It can be observed that the Sabine absorption coefficients at the three scenarios show insignificant differences above 500 Hz. Below 500 Hz there are some differences, but they are not consistent at all low frequencies, therefore these differences can be attributed to the effect of the modes rather than to the directivity of the loudspeaker.
Figure A1. Influence of the orientation of the loudspeaker on sound absorption coefficient measurements. On the left, loudspeaker position with respect to the location of the sample. On the right, the top figure presents the Sabine absorption coefficients obtained for 10 cm thick rock wool placed on the floor at the corner, for the three different positions of the loudspeaker; the bottom figure shows the same measurements with the material distribute on wall and floor, at the corner.
Acoustics 01 00038 g0a1

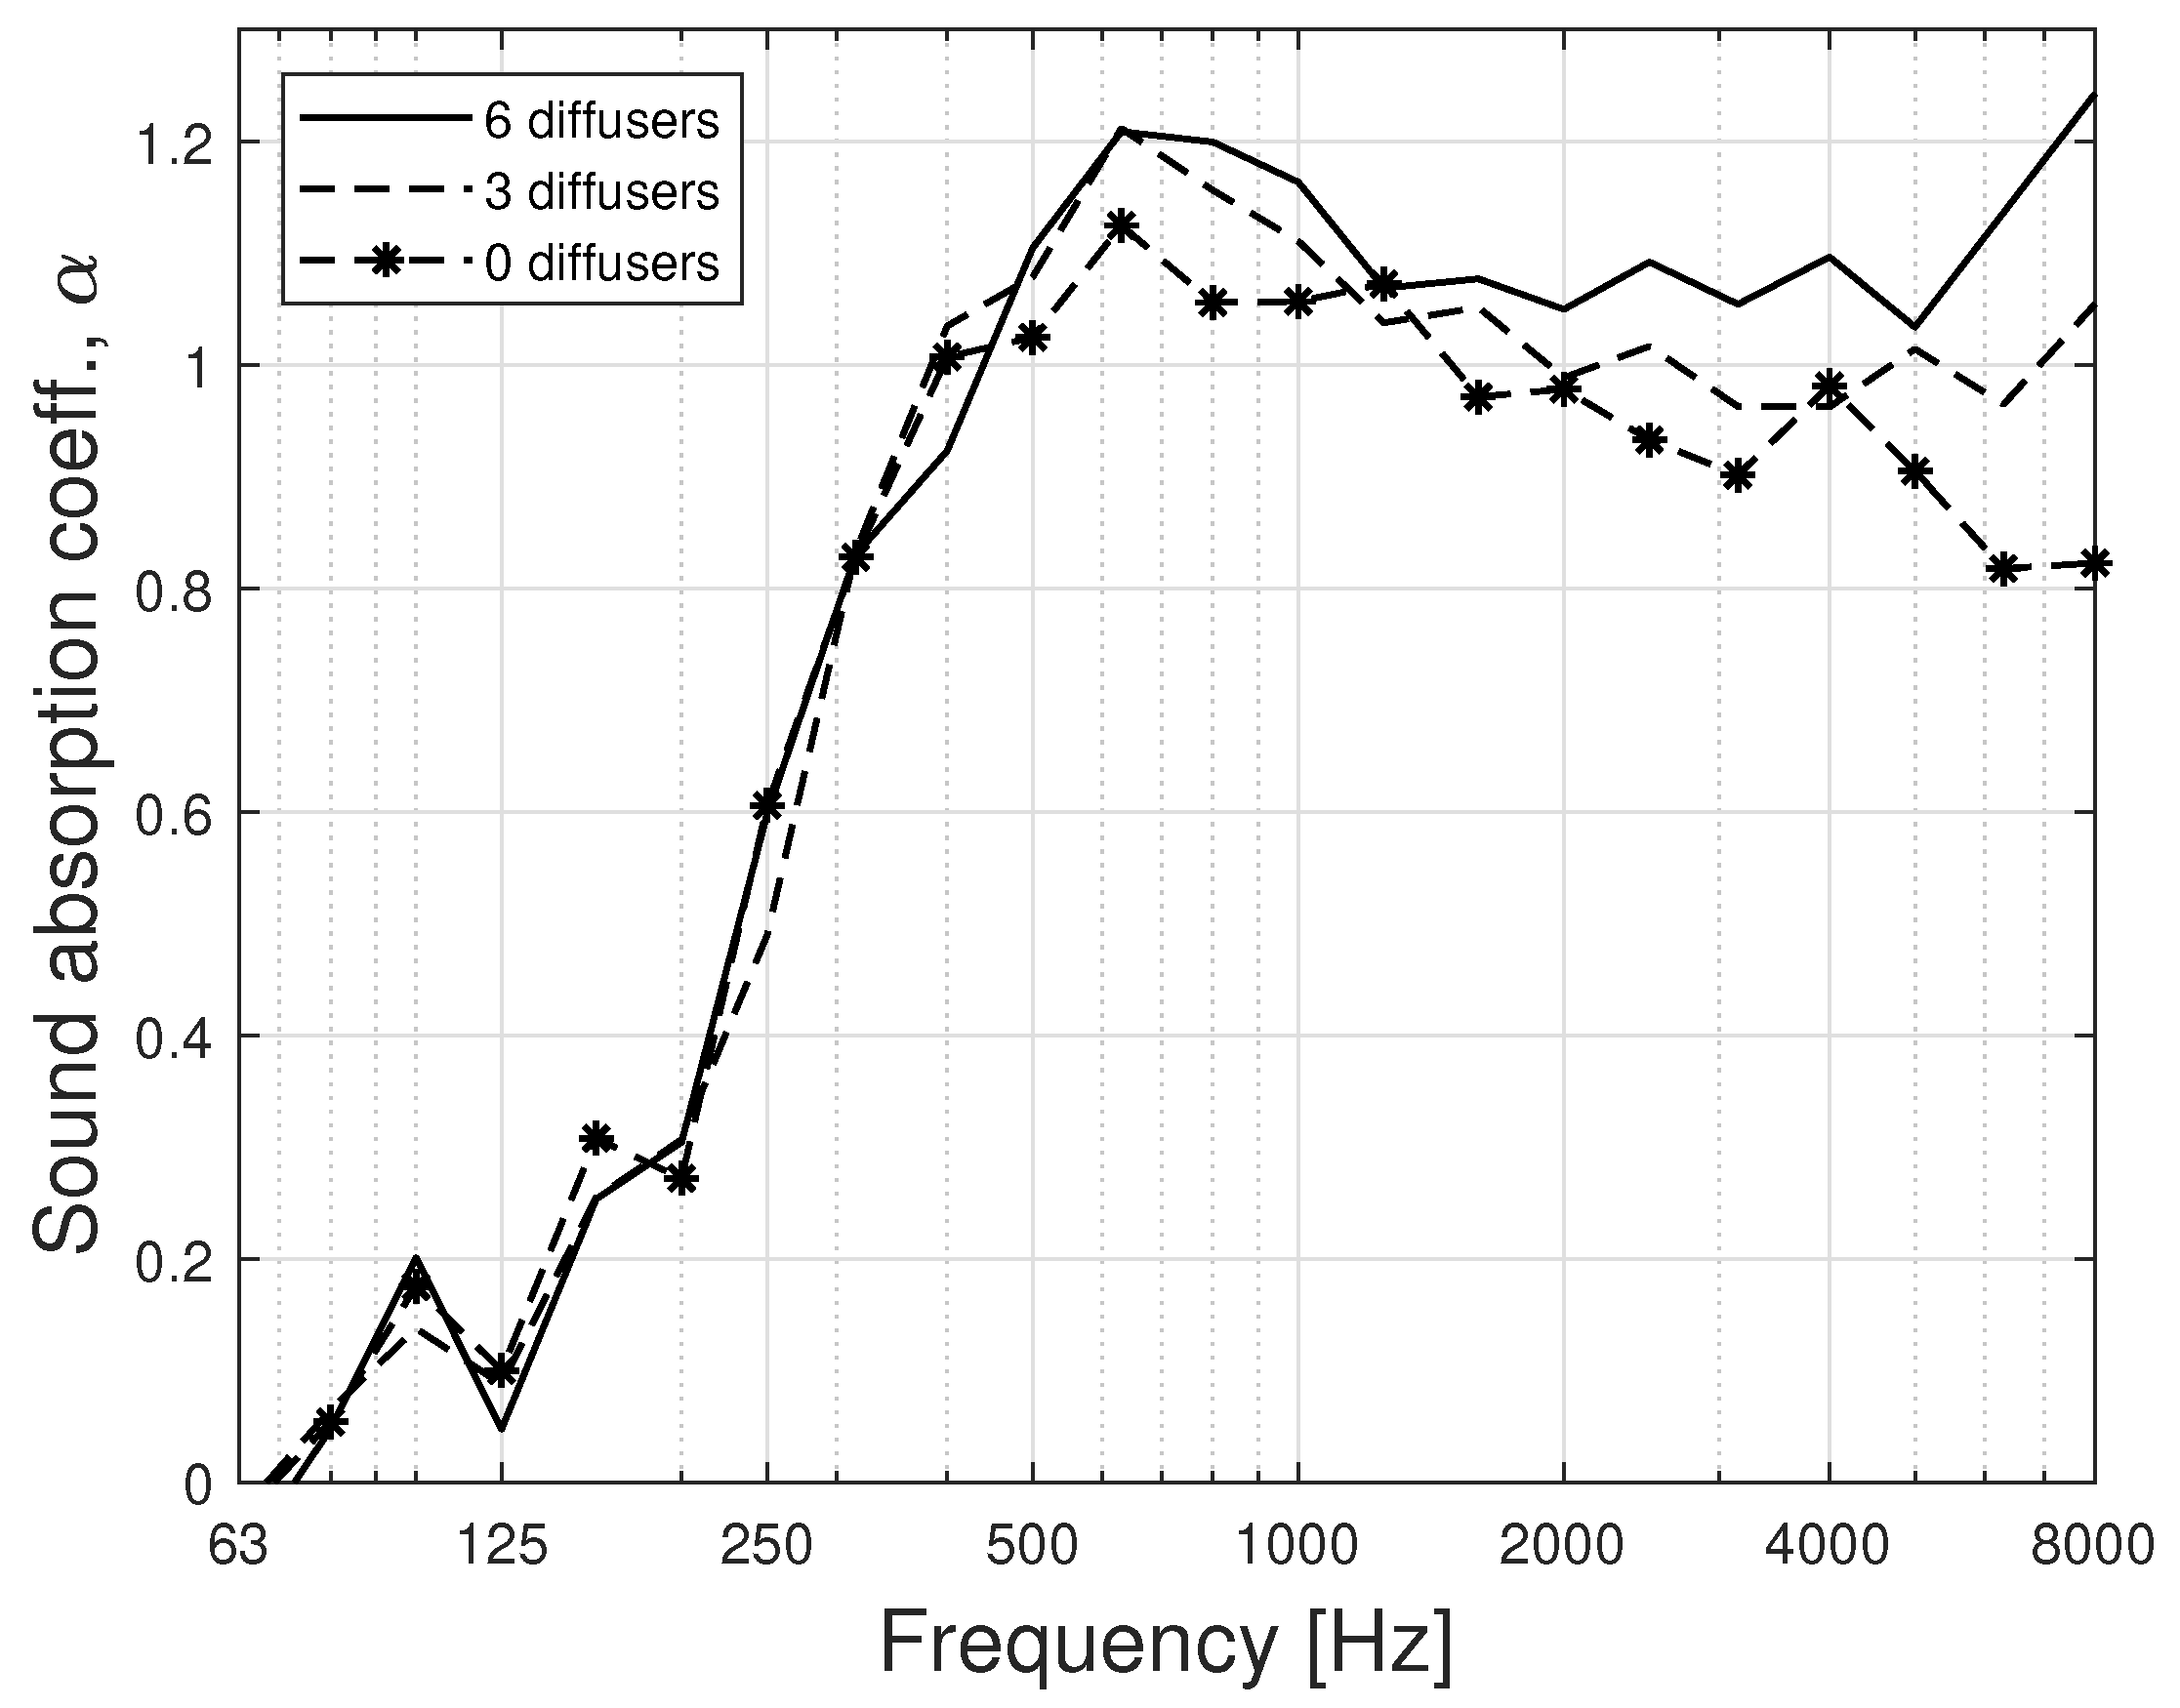
Appendix B. Effect of Hanging Diffusive Elements on Room Modes and Diffuseness

The effect of the hanging sound-diffusing panels inserted in the mockup classroom is analyzed in this section. Figure A2 shows the spectrograms of the impulse responses extracted from the mockup classroom with and without diffusing elements hanging from the ceiling, corresponding to the scenarios in Figure 3 and Figure 5, respectively. No sound-absorbing material was placed on surfaces. It can be observed that the diffusers significantly reduced the strength of the flutter echo located between 1 and 2 kHz at all microphone positions. Higher diffusing area would have been needed to improve the modal behavior of this room.
Figure A2. Spectrograms of the impulse responses extracted in the mockup classroom. Measurements were conducted at 4 microphone positions with and without 6 hanging diffusers inserted in the room.
Acoustics 01 00038 g0a2
The degree of diffuseness in the mockup classroom has been studied by determining the Sabine absorption coefficients of a 5 cm glass wool layer placed on the middle of the floor. According to [36], enhancing the level of diffusion of the sound field in a reverberation room by introducing sound-diffusing elements results in an increase of the Sabine absorption coefficients. Figure A3 presents the Sabine absorption coefficients without diffusers, and with 3 and 6 hanging diffusers inserted in the room. The results show that at frequencies above 1 kHz, where room modes are less dominant, the Sabine absorption coefficients increase as higher amount of hanging sound-diffusing elements is introduced in the classroom.
Figure A3. Effect of diffusing panels on the diffusion of the sound field in the mockup classroom. The Sabine absorption coefficients of a 5 cm glass wool sample were determined without diffusers, and with 3 and 6 hanging diffusers inserted in the room. A total of 8 measurements were conducted for each scenario (4 microphone and 2 loudspeaker positions).
Acoustics 01 00038 g0a3

References

  1. Shield, B.M.; Dockrell, J.E. The effects of noise on children at school: A review. Build. Acoust. 2003, 10, 97–116. [Google Scholar] [CrossRef]
  2. Lubman, D.; Sutherland, L.C. Classroom acoustics for the 21st century. In Proceedings of the 19th International Congress on Acoustics, Madrid, Spain, 2–7 September 2007. [Google Scholar]
  3. Bradley, J.S.; Sato, H. The intelligibility of speech in elementary school classrooms. J. Acoust. Soc. Am. 2008, 123, 2078–2086. [Google Scholar] [CrossRef] [PubMed]
  4. Shield, B.; Conetta, R.; Dockrell, J.; Connolly, D.; Cox, T.; Mydlarz, C. A survey of acoustic conditions and noise levels in secondary school classrooms in England. J. Acoust. Soc. Am. 2015, 137, 177–188. [Google Scholar] [CrossRef] [PubMed]
  5. Tiesler, G.; Machner, R.; Brokmann, H. Classroom acoustics and impact on health and social behaviour. Energy Procedia 2015, 78, 3108–3113. [Google Scholar] [CrossRef]
  6. Campbell, C.; Svensson, C.; Nilsson, E. Classroom acoustic research on speech behaviour of teachers and students. In Proceedings of the 42nd International Congress and Exposition on Noise Control Engineering (Internoise), Innsbruck, Austria, 15–18 September 2013. [Google Scholar]
  7. Rossing, T. Springer Handbook of Acoustics; Springer Science & Business Media: Berlin/Heidelberg, Germany, 2007. [Google Scholar]
  8. Shtrepi, L.; Astolfi, A.; D’Antonio, G.; Guski, M. Objective and perceptual evaluation of distance-dependent scattered sound effects in a small variable-acoustics hall. J. Acoust. Soc. Am. 2016, 140, 3651–3662. [Google Scholar] [CrossRef] [PubMed]
  9. Ryu, J.K.; Jeon, J.Y. Subjective and objective evaluations of a scattered sound field in a scale model opera house. J. Acoust. Soc. Am. 2008, 124, 1538–1549. [Google Scholar] [CrossRef] [PubMed]
  10. Bradley, J.S.; Sato, H.; Picard, M. On the importance of early reflections for speech in rooms. J. Acoust. Soc. Am. 2003, 113, 3233–3244. [Google Scholar] [CrossRef] [PubMed]
  11. Campbell, C.; Nilsson, E.; Svensson, C. The same reverberation time in two identical rooms does not necessarily mean the same levels of speech clarity and sound levels when we look at impact of different ceiling and wall absorbers. Energy Procedia 2015, 78, 1635–1640. [Google Scholar] [CrossRef]
  12. Bradley, J.; Reich, R.; Norcross, S. On the combined effects of signal-to-noise ratio and room acoustics on speech intelligibility. J. Acoust. Soc. Am. 1999, 106, 1820–1828. [Google Scholar] [CrossRef]
  13. Smirnowa, J.; Ossowski, A. A method for optimising absorptive configurations in classrooms. Acta Acust. United Acust. 2005, 91, 103–109. [Google Scholar]
  14. Nijs, L.; Rychtáriková, M. Calculating the optimum reverberation time and absorption coefficient for good speech intelligibility in classroom design using U50. Acta Acust. United Acust. 2011, 97, 93–102. [Google Scholar] [CrossRef]
  15. Choi, Y.J. Effects of periodic type diffusers on classroom acoustics. Appl. Acoust. 2013, 74, 694–707. [Google Scholar] [CrossRef]
  16. Picard, M.; Bradley, J.S. Revisiting Speech Interference in Classrooms: Revisando la interferencia en el habla dentro del salón de clases. Audiology 2001, 40, 221–244. [Google Scholar] [CrossRef] [PubMed]
  17. Hodgson, M.; Nosal, E.M. Effect of noise and occupancy on optimal reverberation times for speech intelligibility in classrooms. J. Acoust. Soc. Am. 2002, 111, 931–939. [Google Scholar] [CrossRef] [PubMed]
  18. Pelegrín-García, D.; Smits, B.; Brunskog, J.; Jeong, C.H. Vocal effort with changing talker-to-listener distance in different acoustic environments. J. Acoust. Soc. Am. 2011, 129, 1981–1990. [Google Scholar] [CrossRef] [PubMed]
  19. Sala, E.; Viljanen, V. Improvement of acoustic conditions for speech communication in classrooms. Appl. Acoust. 1995, 45, 81–91. [Google Scholar] [CrossRef]
  20. Bistafa, S.R.; Bradley, J.S. Predicting reverberation times in a simulated classroom. J. Acoust. Soc. Am. 2000, 108, 1721–1731. [Google Scholar] [CrossRef]
  21. Sabine, W. Reverberation. The American Architect and the Engineering Record; Sabine WC Prefaced by Beranek LL (1992) Collected Papers on Acoustics. Peninsula Publishing: Los Altos, CA, USA, 1900; Chapter 1. [Google Scholar]
  22. Eyring, C.F. Reverberation time in “dead” rooms. J. Acoust. Soc. Am. 1930, 1, 217–241. [Google Scholar] [CrossRef]
  23. Millington, G. A modified formula for reverberation. J. Acoust. Soc. Am. 1932, 4, 69–82. [Google Scholar] [CrossRef]
  24. Cremer, L.; Müller, H.A. Principles and applications of room acoustics. Appl. Sci. 1982, 2, 434. [Google Scholar] [CrossRef]
  25. Kuttruff, H. Sound decay in enclosures with non-diffuse sound field. In Proceedings of the Wallace Clement Sabine Centennial Symposium, Cambridge, MA, USA, 5–7 June 1994; pp. 5–7. [Google Scholar]
  26. Fitzroy, D. Reverberation formula which seems to be more accurate with nonuniform distribution of absorption. J. Acoust. Soc. Am. 1959, 31, 893–897. [Google Scholar] [CrossRef]
  27. Arau-Puchades, H. An improved reverberation formula. Acta Acust. United Acust 1988, 65, 163–180. [Google Scholar]
  28. Kuttruff, H. A simple iteration scheme for the computation of decay constants in enclosures with diffusely reflecting boundaries. J. Acoust. Soc. Am. 1995, 98, 288–293. [Google Scholar] [CrossRef]
  29. Schroeder, M.; Gerlach, R. Diffusion, room shape and absorber location-influence on reverberation time. J. Acoust. Soc. Am. 1974, 56, 1300. [Google Scholar] [CrossRef]
  30. Schultz, T. Diffusion in reverberation rooms. J. Sound Vib. 1971, 16, 17–28. [Google Scholar] [CrossRef]
  31. Hodgson, M. When is diffuse-field theory applicable? Appl. Acoust. 1996, 49, 197–207. [Google Scholar] [CrossRef]
  32. Abdou, A.; Guy, R. A review of objective descriptors for sound diffuseness. Can. Acoust. 1994, 22, 43–44. [Google Scholar]
  33. Vér, I.L.; Beranek, L.L. Noise and Vibration Control Engineering-Principles and Applications; John Wiley & Sons, Inc.: Hoboken, NJ, USA, 2006. [Google Scholar]
  34. Jeong, C.H.; Nolan, M.; Balint, J. Difficulties in comparing diffuse sound field measures and data/code sharing for future collaboration. In Proceedings of the 11th European Congress and Exposition on Noise Control Engineering (Euronoise), Crete, Greece, 27 May 2018. [Google Scholar]
  35. Epain, N.; Jin, C.T.; Epain, N.; Jin, C.T.; Epain, N.; Jin, C.T. Spherical harmonic signal covariance and sound field diffuseness. IEEE/ACM Trans. Audio Speech Lang. Process. 2016, 24, 1796–1807. [Google Scholar] [CrossRef]
  36. ISO. 354 Acoustics—Measurement of Sound Absorption in a Reverberation Room; ISO: Geneva, Switzerland, 2003. [Google Scholar]
  37. Schroeder, M.R.; Kuttruff, K. On frequency response curves in rooms. Comparison of experimental, theoretical, and Monte Carlo results for the average frequency spacing between maxima. J. Acoust. Soc. Am. 1962, 34, 76–80. [Google Scholar] [CrossRef]
  38. Vercammen, M. Improving the accuracy of sound absorption measurement according to ISO 354. In Proceedings of the International Symposium on Room Acoustics (ISRA) 2010, Melbourne, Australia, 29–31 August 2010. [Google Scholar]
  39. Pompoli, F.; Bonfiglio, P.; Horoshenkov, K.V.; Khan, A.; Jaouen, L.; Bécot, F.X.; Sgard, F.; Asdrubali, F.; D’Alessandro, F.; Hübelt, J.; et al. How reproducible is the acoustical characterization of porous media? J. Acoust. Soc. Am. 2017, 141, 945–955. [Google Scholar] [CrossRef] [Green Version]
  40. ISO 17497-1. Acoustics—Sound-Scattering Properties of Surfaces—Part 1: Measurement of the Random-Incidence Scattering Coefficient in a Reverberation Room; ISO: Geneva, Switzerland, 2004. [Google Scholar]
  41. ISO 3741. Acoustics-Determination of Sound Power Levels and Sound Energy Levels of Noise Sources Using Sound Pressure-Precision Methods for Reverberation Test Rooms; ISO: Geneva, Switzerland, 2010. [Google Scholar]
  42. De Bruijn, A. A mathematical analysis concerning the edge effect of sound absorbing materials. Acta Acust. United Acust. 1973, 28, 33–44. [Google Scholar]
  43. ARTA Software. Available online: www.artalabs.hr/ (accessed on 29 June 2019).
  44. Farina, A. Simultaneous Measurement of impulse response and distortion with a swept-sine technique. In Proceedings of the 108th Audio Engineering Society (AES) Convention, Paris, France, 19–22 February 2000. [Google Scholar]
  45. Jambrosic, K.; Horvat, M.; Domitrovic, H. Reverberation time measuring methods. In Proceedings of the Acoustics’08, ASA, EAA and SFA, Paris, France, 29 June–4 July 2008. [Google Scholar]
  46. Schroeder, M.R. The “Schroeder frequency” revisited. J. Acoust. Soc. Am. 1996, 99, 3240–3241. [Google Scholar] [CrossRef]
  47. ISO 3382-1. Acoustics. Measurement of Room Acoustic Parameters—Part 1: Performance Spaces; ISO: Geneva, Switzerland, 2009. [Google Scholar]
  48. IEC 60268-16. Sound System Equipment—Part 16: Objective Rating of Speech Intelligibility by Speech Transmission Index; ISO: Geneva, Switzerland, 2011. [Google Scholar]
  49. Angus, J.A. The effect of diffusers on frequency dependent room mode decay. In Proceedings of the 107th Convention of the Audio Engineering Society, York, UK, 1 September 1999. [Google Scholar]
  50. Halmrast, T. Flutter echoes; timbre and possible use as sound effect. In Proceedings of the 18th International Conference on Digital Audio Effects (DAFx-15), Trondheim, Norway, 30 November–3 December 2015. [Google Scholar]
  51. Bolt, R.H. Note on normal frequency statistics for rectangular rooms. J. Acoust. Soc. Am. 1946, 18, 130–133. [Google Scholar] [CrossRef]
  52. Bradley, J.S.; Reich, R.; Norcross, S. A just noticeable difference in C50 for speech. Appl. Acoust. 1999, 58, 99–108. [Google Scholar] [CrossRef]
  53. Hongisto, V.; Keränen, J.; Larm, P. Simple model for the acoustical design of open-plan offices. Acta Acust. United Acust. 2004, 90, 481–495. [Google Scholar]
  54. SFS 5907. Acoustic Classification of Spaces in Buildings; Finnish Standard Association (FSA): Helsinki, Finland, 2004. [Google Scholar]
Figure 1. Layout of the mockup classroom. The black circles represent the 4 receiver positions, and the loudspeaker icons the positions of the sound sources.
Acoustics 01 00038 g001
Figure 2. Sabine absorption coefficients of 8 mm wood fiber-based material (on the left), and 10 cm thick rock wool (on the right) measured in the middle of the room (a), at the side wall (bd), and at the corner (eh) with varying material distribution on floor and wall. The wood fiber-based sample is shown in figures (ah).
Acoustics 01 00038 g002
Figure 3. Reverberation time (e) and speech clarity (f) measurements measured in the mockup classroom with 5 cm glass wool panels distributed at the upper part of the back and side walls (a), at the upper part of side and back walls, and back part of ceiling (b), at the back part of the ceiling (c), and at the middle of the ceiling (d).
Acoustics 01 00038 g003
Figure 4. Impulse response spectrograms measured in the mockup classroom for the following three scenarios: (a) without any sound-absorbing material installed on the surfaces; (b) with the sound-absorbing material placed at the middle of the ceiling (corresponding to Figure 3d); (c) with the sound-absorbing material placed at the upper part of the rear and side walls (corresponding to Figure 3a). Measurements were conducted without hanging diffusers installed in the room
Acoustics 01 00038 g004
Figure 5. Reverberation time (e) and speech clarity (f) measurements measured in the mockup classroom with 5 cm glass wool panels distributed at the upper part of the back and side walls (a), at the upper part of side and back walls, and back part of ceiling (b), at the back part of the ceiling (c), and at the middle of the ceiling (d). Hanging sound-diffusing panels in the room increased the degree of diffusion of the sound field with respect to the conditions in Figure 3.
Acoustics 01 00038 g005
Figure 6. STI values calculated from a modulation transfer function (MTF) derived from a measured impulse response with male weighting applied. STI calculated in four microphone positions in the classroom for four arrangements of sound-absorbing material and for the empty room (no absorbing material inside the room). (a) No diffusers inside the classroom; (b) Diffusers inserted in the classroom.
Acoustics 01 00038 g006
Figure 7. On the left (a), a representation of the acoustic treatment proposed in the Finnish Standard SFS 5907; on the right (b), the proposed material configuration in this study.
Acoustics 01 00038 g007
Table 1. A-weighted background noise levels measured in the classroom.
Frequency (Hz)1252505001000200040008000
L n A (dB)40.630.430.727.52012.312.5

