Abstract
The application of open-porous materials is a possible method to effectively reduce the aerodynamic noise of an airfoil. However, the porous consistency may have a negative effect on the aerodynamic performance of the airfoil, since very often the lift is decreased while the drag increases. In a recent investigation, the generation of trailing edge noise of a set of airfoil models made from different porous materials was examined experimentally. The materials were characterized mainly by their airflow resistivity. Besides the material, the chordwise extent of the porous material was varied, which was done by covering the front part of the porous airfoil with a thin, impermeable adhesive foil. Acoustic measurements were performed in an open jet wind tunnel using microphone array technology, while the aerodynamic performance was measured simultaneously using a six-component balance. In general, both the airflow resistivity and the extent of the porous material have an influence on the trailing edge noise. However, if a suitable material is chosen, the results show that a noticeable reduction of trailing edge noise is possible even with only a small chordwise extent of the porous material.
1. Introduction
Airfoil trailing edge noise is a dominant source of noise in several applications, including wind turbine noise, fan noise and airframe noise. There are different methods to reduce this noise by modifying the blade, which includes the use of flow permeable materials. Several studies on this passive modification exist, including experimental studies on brush-like or slitted trailing edge extensions [1,2,3], on fully porous airfoils [4,5] and on airfoils with trailing edges modified by metal mesh sheets [6] or porous foams [7,8,9]. In addition, the availability of 3D printing technologies enables the use of porous trailing edges manufactured via rapid prototyping [10]. There are also approaches to combine the successful concept of serrated trailing edges with a porous modification [11]. In addition, there are a variety of analytical [12] and numerical studies [13,14,15,16] on porous trailing edges for noise reduction available.
The present paper is a continuation of an investigation of so-called partially porous airfoils described in a previous study by the authors [17], where the front part of the airfoil is non-porous and only the trailing edge is permeable to the flow. The aim of this design is to combine the aerodynamic advantages of a conventional, non-porous airfoil with the acoustic advantages of a fully porous airfoil.
2. Materials and Methods
All experiments were performed in the small aeroacoustic wind tunnel at the Brandenburg University of Technology in Cottbus using microphone array technique and a wind tunnel balance.
2.1. Airfoils
The airfoils of the present study had an SD7003 shape [18] with a chord length b of 235 mm and a span width w of 400 mm and were completely made of porous materials without any internal barriers. These porous materials are mainly characterized by their static airflow resistivity
which was determined in the present study according to ISO 9053 [19] for cylindrical samples of the material with a diameter of 100 mm and thickness h. In this procedure, a steady unidirectional airflow is passed through the flow permeable specimen, and the resulting pressure difference across the specimen is measured. In Equation (1), A is the resulting cross sectional area of the specimen, is the pressure difference across the specimen and q is the volume rate of the flow through the material.
Another parameter that is assumed to have an influence is the porosity of the materials. It describes the ratio of the pore volume to the total volume of the porous material and can be calculated according to
where is the density of the skeletal material (without the pores) and is the total density of the absorber (including the pores). The porosity of the materials was either taken from the datasheets or was estimated based on the densities according to Equation (2).
Although there exist additional parameters to describe the properties of homogeneous porous materials [20], such as the tortuosity , the viscous characteristic length or the thermal characteristic length , it is believed that the airflow resistivity is one of the most important regarding the potential noise reduction ability. The porosity, although probably less significant than the airflow resistivity, will also be an important factor.
It was found, as a result of a previous study on porous trailing edges [17], that materials with medium to high airflow resistivity are especially promising regarding a potential flow noise reduction. Therefore, new porous materials were acquired in addition to the ones previously used. This includes two airfoils made from a mixture of polyurethane (PU) foam and rubber granulates with medium airflow resistivities (Damtec estra, r = 86,100 Pa·s/m2 and Damtec SBM K 20, r = 12,900 Pa·s/m2) as well as an airfoil made of a metal foam with a high airflow resistivity (Siperm R200, r = 150,000 Pa·s/m2). An overview of all airfoils of the present study is given in Table 1, while Figure 1 shows samples of the porous materials.

Table 1.
Materials used for the manufacturing of the airfoils, given are the airflow resistivity r (measured according to ISO 9053 [19]) and the porosity (taken from the data sheet or estimated according to Equation (2)).

Figure 1.
Photograph of the porous materials used for the present study (from left to right: Porex, Siperm R200, Damtec estra, Damtec SBM K 20, Recemat Ni-4753, M-Pore Al 45 ppi).
The airfoils were assembled from spanwise slices of porous material, which were cut from plates or mats of the porous materials using water jet cutting, since other technologies like laser cutting or milling would most likely close the open pores on the surface. However, it was found that for one of the porous materials even the water cutting affected the pores on the surface. This would lead to a different permeability through the airfoil compared to that of a homogeneous porous material. The change of the surface of the porous airfoil made of the new material Siperm R200, a stainless steel foam with a nominal porosity of 49%–54% and a pore size of 65 m, is shown in Figure 2. It seems that the porosity on the surface is reduced, which would lead to a notably reduced permeability.
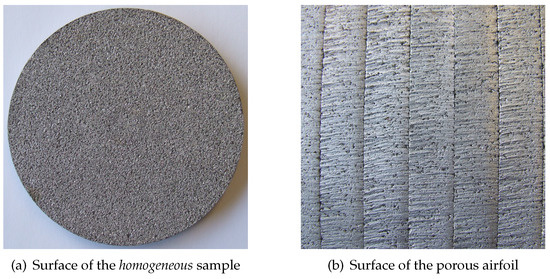
Figure 2.
Modification of the surface of the airfoil made of Siperm R200 due to the water jet cutting.
Thus, in order to examine the possible influence of the water jet cutting and to obtain a characteristic value for the permeability of the airfoils, the airflow resistance [19]
was measured for all of the airfoils from Table 1. In Equation (3), is the positive air pressure and is the ambient air pressure. The measurements were performed in situ using a special measuring head that was pressed against the upper surface of the airfoils (see schematic in Figure 3a). In order to prevent air leakage between the measurement head and the airfoil surface, a soft polyurethane foam, covered by an impermeable thin plastic film, was used as sealing. In total, the airflow resistance R was measured at three chordwise stations of = 20%, 50% and 70%. At each station, ten single measurements were performed along the span and the data were averaged. The results are shown as a function of r in Figure 3b. It is visible that the airfoil made of Damtec estra (r = 86,100 Pa·s/m2) has an unexpectedly low airflow resistance, which might be due to small slits between adjacent slices of the material. As expected, it seems that the airflow resistance of the airfoil made of Siperm R200 might be higher than expected based on the airflow resistivity r of the material. Still, in the remainder of this paper the airflow resistivity r will be used to characterize the porous airfoils.
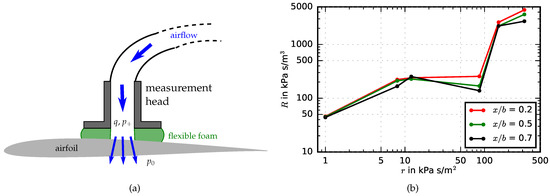
Figure 3.
Airflow resistance R of the porous airfoils. (a) Schematic of the setup used for the airflow resistance measurements (not to scale); (b) Relation between airflow resistance R at different chordwise positions and airflow resistivity r.
It is known that flow permeable airfoils can lead to a noticeable noise reduction compared to a non-porous reference airfoil, while at the same time the aerodynamic performance will be reduced [4,5], leading to a reduction in aerodynamic lift and an increase in drag due to the surface roughness associated with a permeable surface. One very simple approach to improve the aerodynamics, that was also used in [17], is to cover a large part of the porous airfoil surface with a thin, impermeable, adhesive foil and leave only the trailing edge porous (see schematic in Figure 4). This method was also employed in the current study, using the foils Oracal Banner Cal 451, Oracal Exhibition Cal 631 and Oracal Intermediate Cal 651 to cover the surface of the porous airfoils. Thus, different chordwise extents of the porous media of 5%, 10%, 20%, 30%, 50% and 100% (fully porous) were realized. In addition, a non-porous airfoil of the same geometry and dimensions was used as a reference. The partially porous airfoils and the reference airfoil were tripped at 10% of the chord using Anti-slip tape with a height of approximately 0.8 mm and a width of 2 mm. No tripping tape was applied to the fully porous airfoils since their relatively coarse surface ensured the existence of a turbulent boundary layer.

Figure 4.
Schematic of a partially porous airfoil (gray: porous airfoil, red: flexible, impermeable foil used to cover the pores at the front part of the airfoil, s: chordwise extent of the porous material).
2.2. Wind Tunnel
The aeroacoustic wind tunnel [21] at the Brandenburg University of Technology is an open jet wind tunnel, driven by a radial fan with a shaft power of 18.5 kW. The circular nozzle used in this study has a contraction ratio of 16 and an exit diameter D of 0.2 m. It enables a maximum flow speed U in the order of 90 m/s, which corresponds to a Mach number of about 0.26 (c is the speed of sound). The airfoils were mounted with their leading edge 0.05 m downstream from the nozzle exit area. During acoustic measurements, the test section in front of the nozzle is surrounded on three sides (side walls and floor) by absorbing walls, which are covered by 0.24 m thick absorber plates made of Basotect that lead to quasi anechoic measurement conditions at frequencies above 125 Hz. The planar microphone array builds the ceiling, while the wall opposite of the nozzle is open. Figure 5 shows a photograph of the measurement setup, while Figure 6 shows a corresponding schematic.
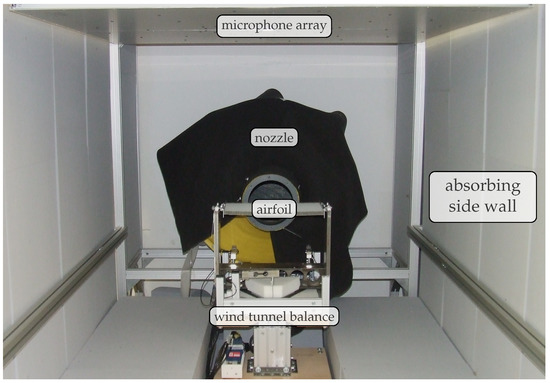
Figure 5.
Experimental setup in the aeroacoustic wind tunnel (photograph taken from downstream).
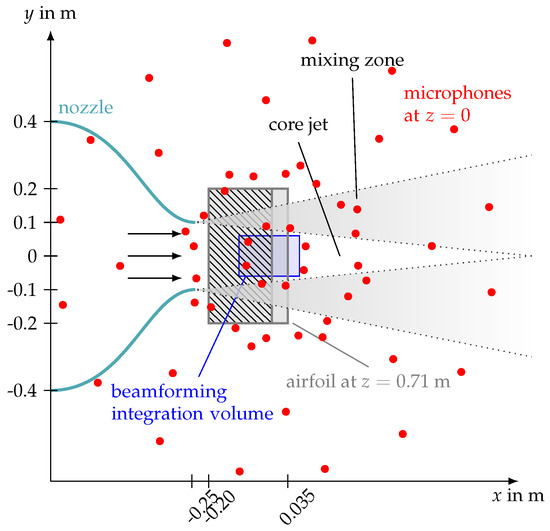
Figure 6.
Schematic of the measurement setup (top view), the hatched area symbolizes the part of the airfoil covered by the thin, impermeable foil.
2.3. Microphone Array and Data Processing
All acoustic measurements were performed using a planar microphone array, consisting of 56 1/4th inch electret microphone capsules flush-mounted in a 1.5 m × 1.5 m large aluminum plate. The array was positioned 0.71 m above the airfoil and out of the flow (see Figure 5 and Figure 6). The array has an aperture of 1.3 m and the microphones are arranged in five circles with 16 or 8 microphones each (the single microphone positions are included in the schematic shown in Figure 6). Additional information on the microphone array characteristics, such as the directivity pattern and the 3 dB width of the main lobe, can be found in [22].
For each measurement, 40 s of data were recorded with a sampling frequency of 51.2 kHz using a 24 Bit National Instruments multichannel measurement system and stored on a RAID server. In post-processing, the time data were first transferred to the frequency domain using a Fast Fourier Transformation. This was done on 50% overlapping Hanning-windowed blocks of 4096 samples each. The resulting microphone auto spectra and cross spectra were then averaged to obtain the final cross spectral matrix. In order to separate the different noise sources, a variety of advanced beamforming algorithms are available especially for aeroacoustic measurements [23]. It was finally decided to use the CLEAN-SC deconvolution beamforming algorithm [24], which was applied to the cross spectral matrizes. This was done on a fully three-dimensional focus grid with a steering vector according to formulation IV in [25]. In addition, the refraction of sound at the shear layer of the open jet was taken into account using a fast ray tracing approach [26].
Finally, the noise contributions within a three-dimensional volume that contains only that part of the trailing edge that interacts with the turbulent boundary layer were integrated and converted to third octave band sound pressure level spectra. The size of the integration volume is 0.18 m in streamwise direction, 0.12 m in spanwise direction and 0.12 m in vertical direction (see also Figure 6). The noise from other, unwanted noise sources, such as the interaction of the open jet shear layer with the leading edge and trailing edge of the airfoil, was excluded from the integration. As an example, Figure 7 shows a map of the different noise source contributions, which includes the chosen integration volume.
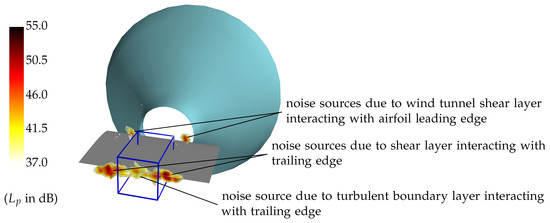
Figure 7.
Sample sound map obtained for the non-porous reference airfoil for a third octave band with a center frequency of 5 kHz (U = 81.5 m/s, M = 0.238, = 1,266,000), including the chosen prismatic integration volume (blue) used to derive spectra of the noise contributions generated by the noise source of interest (shown are translucently rendered iso surfaces colored according to the measured sound pressure level ).
2.4. Aerodynamic Measurements
In order to be able to take the aerodynamic performance of the partially porous airfoils into account, the lift force and the drag force of the airfoils were measured simultaneously to the acoustic measurements. This was done using a six component balance (see Figure 5) and in-house software. From these forces, the lift and drag coefficients and were calculated according to
respectively. Therein, is the density of air and S is the trapezoidal “wetted” area of the airfoils, which was estimated using a length of the wind tunnel core jet of 5D [27]. It has to be kept in mind that this is a simplification, and effects like a contribution of the shear layer of the open jet to the lift and drag were not taken into account. In addition, it should be noted that due to the open jet setup with the three-dimensional core jet, the adjusted geometric angles of attack cannot be converted to effective angles of attack (as is often done in wind tunnel studies using closed test sections [28]). Therefore, only the geometric angles of attack are given in the remainder of this paper.
3. Results and Discussion
The majority of measurements was performed at a fixed geometric angle of attack of 4 at flow speeds U between approximately 18 m/s and 86 m/s, corresponding to chord based Reynolds numbers (with being the kinematic viscosity of air) between 2.83 × and 1.34 × . In order to enable conclusions on the influence of the angle of attack, additional measurements have been done at other angles, but for only a single flow speed of 57.6 m/s ( = 901,000).
3.1. Aerodynamic Results
In order to obtain a first understanding of the aerodynamic effect of the porous trailing edges, Figure 8 shows Lilienthal type polar diagrams of the lift and drag coefficients for selected airfoils at geometrical angles of attack between −12 and 24, calculated according to Equation (4). As expected, it is visible that at any angle the reference airfoil generates the highest lift coefficient and the lowest drag coefficient . The basic trend that can be observed for the partially porous airfoils is that the lift coefficient increases with increasing airflow resistivity r and decreasing extent s of the porous materials. For the drag coefficient , the opposite trend is found, it increases with decreasing r and increasing s.
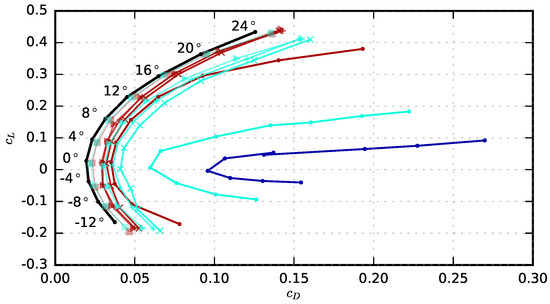
Figure 8.
Overview of the aerodynamic performance of the partially porous airfoils as a function of angle of attack for a constant flow speed of 57.6 m/s (M = 0.168, = 901,000, cyan: Recemat, r = 8200 Pa·s/m2, brown: Porex, r = 316,500 Pa·s/m2, blue: M-Pore Al, r = 1000 Pa·s/m2, black: non-porous reference airfoil, r = ∞).
The sole effect of the porous materials on the aerodynamic coefficients can be seen from Figure 9 for the fully porous airfoils ( = 1). Basically, the same conclusions can be drawn regarding the influence of r as from the previous Figure 8: When the airflow resistivity increases, the lift coefficient increases while the drag coefficient decreases. However, a close observation reveals an interesting detail regarding the airfoil made of Siperm R200. While technically it is the porous material with the second highest airflow resistivity of r = 150,000 Pa·s/m2 (second to Porex with r = 315,500 Pa·s/m2), it achieves the highest lift and the lowest drag of the porous airfoils. This can be assumed to be due to the change of the surface as a result of the water cutting, as described in Section 2.1. It seems that the water cutting, although not resulting in a much higher airflow resistance R (see Figure 3b), does improve the aerodynamic properties, maybe by making the surface smoother. In addition, as expected Figure 9 shows that the airfoil made of Damtec estra, which has a nominal airflow resistivity of 86,100 Pa·s/m2, generates less lift and more drag than the other porous airfoil made of a rubber granulate, Damtec SBM K 20 with r = 12,900 Pa·s/m2. This is due to the differences in the airflow resistance R, as shown in Figure 3b.
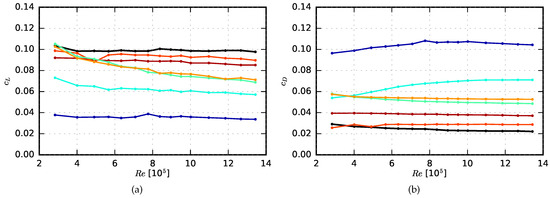
Figure 9.
Influence of the material of the fully porous airfoils on the aerodynamic performance at 4 angle of attack (  non-porous reference airfoil, r = ∞,
  Porex, r = 316,500 Pa·s/m2,
  Siperm, r = 150,000 Pa·s/m2,
  Damtec estra, r = 86,100 Pa·s/m2,
  Damtec SMB K 20, r = 12,900 Pa·s/m2,
  Recemat, r = 8200 Pa·s/m2,
  M-Pore Al 45, r = 1000 Pa·s/m2). (a) Lift coefficient as a function of chord based Reynolds number; (b) Drag coefficient as a function of chord based Reynolds number.
 non-porous reference airfoil, r = ∞,
  Porex, r = 316,500 Pa·s/m2,
  Siperm, r = 150,000 Pa·s/m2,
  Damtec estra, r = 86,100 Pa·s/m2,
  Damtec SMB K 20, r = 12,900 Pa·s/m2,
  Recemat, r = 8200 Pa·s/m2,
  M-Pore Al 45, r = 1000 Pa·s/m2). (a) Lift coefficient as a function of chord based Reynolds number; (b) Drag coefficient as a function of chord based Reynolds number.
The isolated effect of the extent s of the porous material on the aerodynamic performance is then shown exemplarily in Figure 10 for the airfoil made of Recemat (r = 8200 Pa·s/m2). As would be expected, the lift coefficient increases with decreasing extent of the porous material, while the drag coefficient decreases with decreasing s. When the porous extent is only 5% of the total chord length, a lift coefficient of about 85% to 95% of the value for the non-porous reference value can be reached, while the increase in drag is about 3% to 22%.
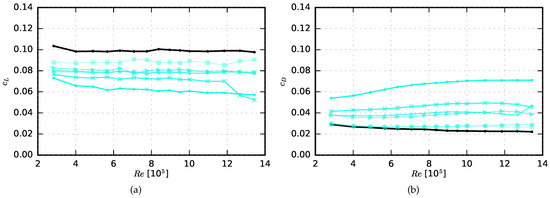
Figure 10.
Influence of the streamwise extent s of the porous trailing edge on the aerodynamic performance at 4 angle of attack (black: non-porous reference airfoil, r = ∞, cyan: Recemat, r = 8200 Pa·s/m2, porous extent: ◼ = 0.05, ⬟ = 0.1, ▶ = 0.2, 🞣 = 0.3, 🞪 = 0.5, ● = 1). (a) Lift coefficient as a function of chord based Reynolds number; (b) Drag coefficient as a function of chord based Reynolds number.
3.2. Acoustic Results
Sample sound maps are shown for selected airfoils at an angle of attack of 4 and a single flow speed of 57.6 m/s in Figure 11. When examining these sound maps it has to be kept in mind that the noise source of interest is only the one positioned at the spanwise center of the trailing edge, between two stronger noise sources that are due to the interaction of the trailing edge with the wind tunnel shear layer (see Figure 7). Basically, a reduction of the strength of this noise source due to the porous material is visible for all porous extents. Then, the sound maps also reveal that there is a noise source at the aft end of the impermeable foil, at the transition between the non-porous front part of the surface and the porous aft part. With decreasing extent of the porous material (from = 50% in Figure 11b to 5% in Figure 11f), this source is visible as a spanwise line source moving downstream towards the trailing edge. Although the impermeable foil is very thin, it is possible that the noise at this location is due to the interaction of the wind tunnel shear layer with the resulting small backwards facing step. Another possibility is that part of the noise is due to a compensation of the pressure difference between the suction side and pressure side of the airfoil through the porous material at that location. In any way, the contribution from this noise source was also included in the following sound pressure level spectra by choosing a large enough streamwise extent of the integration volume. One idea to reduce the strength of this source in future investigations would be to use a foil with a serrated trailing edge, which is based on studies of airfoil self noise reduction by serrated trailing edges [29,30].

Figure 11.
Sound maps obtained for a set of airfoils at a flow speed of 57.6 m/s (M = 0.168, = 901,000) and a geometrical angle of attack of 4, 4 kHz octave band, CLEAN-SC beamforming (gray line indicates location of tripping, light blue line indicates boundary between non-porous front part and porous trailing edge).
Figure 12 shows third octave band sound pressure levels measured for a subset of the airfoils at geometric angles of attack from −20 to 24 at a Mach number of 0.168. They are presented as a function of third octave band center frequency . One major observation is that not all of the porous airfoils lead to a noise reduction. Some of the materials even lead to a noticeable noise increase. For example, this is true for the two new airfoils made from rubber granulate (Damtec estra, r = 86,100 Pa·s/m2, and Damtec SBM K 20, r = 12,900 Pa·s/m2). With the exception of a small range of low frequencies, those airfoils generate considerably more noise than the non-porous reference airfoil. This may be caused by the surface of the two materials, which seem to exhibit a higher roughness than that of the airfoils made of metal foams. Another possible reason is that these materials have a very low porosity, which was already found to be disadvantageous regarding a potential trailing edge noise reduction [22]. In addition, the airfoils are not rigid, which may lead to vibrations of the trailing edge and thus to additional noise. The airfoil made of Recemat (r = 8200 Pa·s/m2) leads to a strong noise increase compared to the non-porous reference airfoil at low to medium frequencies, while the spectra for the airfoil made of Porex (r = 315,500 Pa·s/m2) feature a noticeable hump around the 3 kHz third octave band. The reason for this increased noise is not fully clear yet. However, when compared with previous results [4,5] on fully porous airfoils it is reasonable to assume that the noise generated at the aft end of the impermeable foil at (as observed in the sound maps in Figure 11) is an important contribution. As mentioned above, noise from this source could be avoided by adding serrations to the trailing edges of the foil. However, many of the porous materials lead to a visible noise reduction compared to the non-porous reference airfoil at a large range of geometric angles of attack. Basically, judging by the data shown in Figure 12 for only a subset of the airfoils, no clear trend can be derived for the dependence of the noise reduction on the angle of attack.
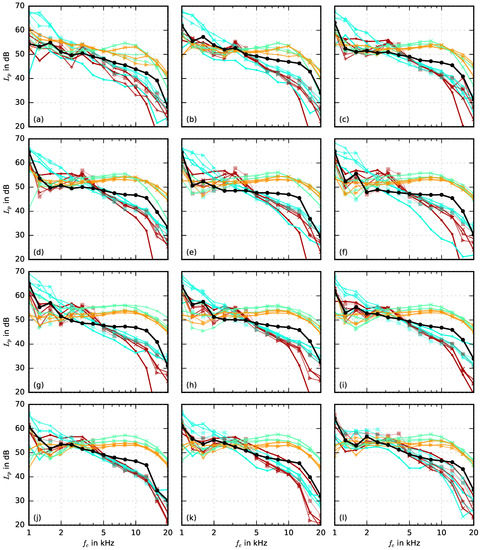
Figure 12.
Third octave band sound pressure level spectra of a subset of the airfoils at different geometric angles of attack , U = 57.6 m/s (M = 0.168, = 901,000); colors and symbols match those from Figure 8. (a) = −20; (b) = −16; (c) = −12; (d) = −8; (e) = −4; (f) = 0; (g) = 4; (h) = 8; (i) = 12; (j) = 16; (k) = 20; (l) = −24.
A total comparison of the sound pressure levels of all airfoils of the present study at a geometrical angle of attack of 4 and all flow speeds is given in Figure 13. Thereby, the sound pressure level is scaled with the fifth power of the Mach number, following common trailing edge noise theory [31], and displayed as a function of the chord based Strouhal number . Basically, it can be seen that some airfoils lead to a noise reduction especially at low and medium Strouhal numbers, while several airfoils also lead to a noise increase at high Strouhal numbers, which is due to a contribution of surface roughness noise [4,5,22]. However, it is not easy to properly analyze the results due to the large number and the scatter of the data. Therefore, Figure 14 shows the scaled sound pressure levels sorted by the porous extent s of the airfoils. In addition, the data were smoothed using a LOWESS filter (locally weighted scatterplot smoothing [32,33]). This algorithm fits a nonparametric regression curve to a scatterplot and thus leads to plots that are much easier to analyze. Figure 15 then shows the corresponding sound pressure level difference
which was again smoothed using a LOWESS algorithm. The sound pressure level difference takes a positive value when the porous airfoils lead to a noise reduction compared to the reference airfoil and a negative value if they lead to a noise increase. From both Figure 14 and Figure 15, several conclusions can be drawn: Firstly, it can be seen that a high noise reduction of roughly 5–10 dB at low and medium Strouhal numbers can already be achieved with a very small extent of porous material (e.g., = 0.05 or = 0.10), which, in return, will lead to only a minimum aerodynamic penalty (see Figure 10). Secondly, as can be expected, the contribution of surface roughness noise at high Strouhal numbers increases when the extent of the porous materials increases. This, too, could be prevented when only a small (chordwise) fraction at the trailing edge of the airfoil is porous. In addition, it can again be observed that airfoils made of Porex (r = 315,500 Pa·s/m2) lead to a broad hump in the sound pressure level spectra in a range of Strouhal numbers between 10 and 20.
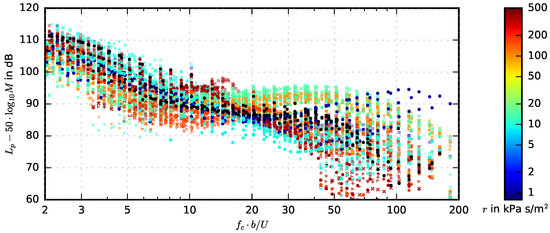
Figure 13.
Scaled sound pressure level of the reference airfoil (black) and the partially porous airfoils with varying porous extent at 4 angle of attack (markers for the different porous extents as in Figure 8).
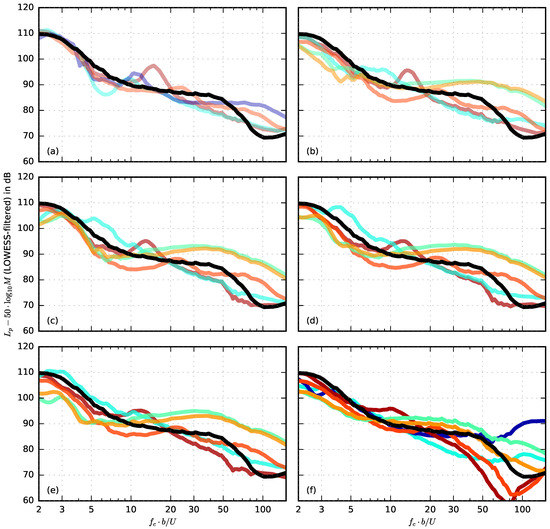
Figure 14.
Scaled sound pressure levels of the reference airfoil (black) and the partially porous airfoils with varying porous extent (porous materials color-coded as in Figure 9), filtered using a LOWESS algorithm [32,33]. (a) = 0.05; (b) = 0.1; (c) = 0.2; (d) = 0.3; (e) = 0.5; (f) = 1.
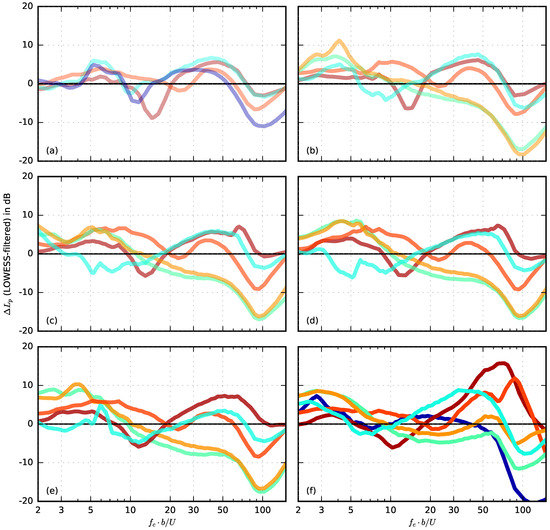
Figure 15.
Sound pressure level difference of the partially porous airfoils with varying porous extent compared to the reference airfoil at 4 angle of attack (porous materials color-coded as in Figure 9, positive value denotes noise reduction, negative noise increase), filtered using a LOWESS algorithm [32,33]. (a) = 0.05; (b) = 0.1; (c) = 0.2; (d) = 0.3; (e) = 0.5; (f) = 1.
Finally, the overall sound pressure level
was calculated from third octave band sound pressure levels with center frequencies from 800 Hz to 20 kHz. It is shown in Figure 16 as a function of the chord based Reynolds number. Basically, it can be observed that nearly all partially porous airfoils generate an overall sound pressure level that is below that of the non-porous reference airfoil. The porous airfoil made of Recemat (r = 8200 Pa·s/m2) generates a higher overall sound pressure level than the reference airfoil especially for porous extents of = 0.3 and = 0.5 and at high Reynolds numbers. This is due to the increased noise generation of these airfoils at low and medium frequencies, which was already observed in Figure 12. In general, it can be seen from Figure 16 that materials with medium to high airflow resistivities result in the highest reduction of the overall sound pressure level, which is in good agreement with the results from previous studies on fully porous airfoils [4,5,22]. Regarding the porous extent, it can be concluded that, on average, the reduction of the OSPL increases with increasing extent. However, it has to be kept in mind that a large porous extent s also leads to a notable aerodynamic penalty (see Figure 8 and Figure 10).
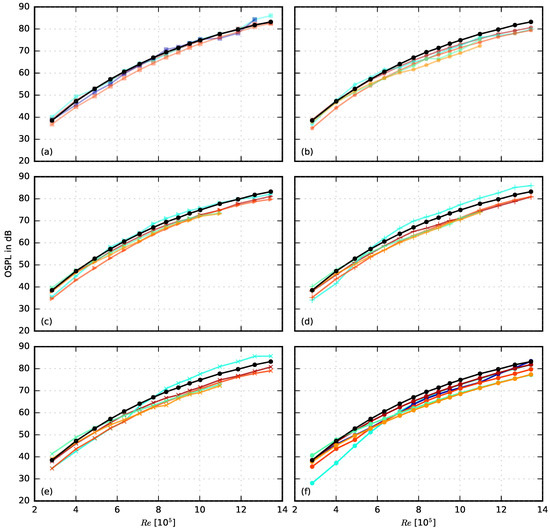
Figure 16.
Overall sound pressure level of the partially porous airfoils with varying porous extent compared to the reference airfoil at 4 angle of attack, calculated according to Equation (6) (black: non-porous reference airfoil, porous materials color-coded as in Figure 9) (a) = 0.05; (b) = 0.1; (c) = 0.2; (d) = 0.3; (e) = 0.5; (f) = 1.
4. Summary
The effect of flow permeable trailing edges on the flow noise reduction and the aerodynamic performance of airfoils was investigated experimentally in an aeroacoustic open jet wind tunnel. Both the porous materials, mainly characterized by their airflow resistivity, and the chordwise extent of the porous material at the trailing edge were varied. The latter was done by covering the leading edge and part of the airfoil surface using a thin, impermeable foil.
Both the airflow resistivity and the extent of the material have a strong influence on the lift and drag coefficients. The lift coefficient increases with an increasing airflow resistivity and a decreasing porous extent, while the drag coefficient increases with a decreasing airflow resistivity and an increasing extent. Regarding the possible noise reduction, the conclusions are less clear. Some of the porous materials are not suited and even lead to a noise increase compared to the non-porous reference airfoil, which is assumed to be due to an increased surface roughness, a very low porosity and possible vibrations of the trailing edge. In addition, new noise sources appear at the aft end of the impermeable foil. However, many of the porous materials, especially the metal foams, lead to a noticeable noise reduction even when the streamwise extent of the porous trailing edge is small. Thus, it is possible that a high flexural rigidity of the porous materials is also beneficial regarding the noise reduction ability.
Author Contributions
T.F.G. and E.S. conceived the original idea, T.F.G. designed and performed the experimental study, processed the data and wrote the manuscript, E.S. helped processing the data and supervised the study.
Funding
This research received no external funding.
Acknowledgments
The authors thank Yangyang Ji and Philipp Marcus for their help with the experiments and Gert Herold for his help with the visualization of the results.
Conflicts of Interest
The authors declare no conflict of interest.
Nomenclature
| A | [m2] | cross sectional area of porous sample |
| b | [m] | airfoil chord length |
| c | [m/s] | speed of sound |
| [-] | drag coefficient | |
| [-] | lift coefficient | |
| [Hz] | (third octave band) center frequency | |
| [N] | drag force | |
| [N] | lift force | |
| h | [m] | thickness of a porous sample |
| M | [-] | Mach number |
| [dB] | sound pressure level | |
| [Pa] | ambient pressure | |
| q | [m3/s] | volume flow rate |
| r | [Pa·s/m2] | airflow resistivity |
| R | [Pa·s/m3] | airflow resistance |
| [-] | chord based Reynolds number | |
| s | [m] | chordwise extent of porous material |
| S | [m2] | “wetted” area of the airfoil |
| [-] | chord based Strouhal number | |
| U | [m/s] | free stream velocity (flow speed) |
| w | [m] | airfoil span width |
| x, y, z | [m] | cartesian coordinates |
| [] | geometric angle of attack | |
| [Pa] | pressure difference across porous sample | |
| [dB] | sound pressure level difference | |
| [m] | viscous characteristic length | |
| [m] | thermal characteristic length | |
| [m2/s] | kinematic viscosity of air | |
| [kg/m3] | density of air | |
| [kg/m3] | density of skeletal material | |
| [kg/m3] | total density | |
| [-] | porosity | |
| [-] | tortuosity |
References
- Herr, M. Design criteria for low-noise trailing edges. In Proceedings of the 13th AIAA/CEAS Aeroacoustics Conference, Rome, Italy, 21–23 May 2007. [Google Scholar]
- Finez, A.; Jondeau, E.; Roger, M.; Jacob, M.C. Broadband noise reduction with trailing edge brushes. In Proceedings of the 16th AIAA/CEAS Aeroacoustics Conference, Stockholm, Sweden, 7–9 June 2010. [Google Scholar]
- Sudhakaran, R.; Mimani, A.; Porteous, R.; Doolan, C.J. An experimental investigation of the flow-induced noise generated by a porous trailing edge of a flat plate. In Proceedings of the Acoustics, Australian Acoustical Society, Hunter Valley, Australia, 15–18 November 2015. [Google Scholar]
- Geyer, T.F.; Sarradj, E.; Fritzsche, C. Measurement of the noise generation at the trailing edge of porous airfoils. Exp. Fluids 2010, 48, 291–308. [Google Scholar] [CrossRef]
- Geyer, T.F.; Sarradj, E.; Fritzsche, C. Porous airfoils: noise reduction and boundary layer effects. Int. J. Aeroacoust. 2010, 9, 787–820. [Google Scholar] [CrossRef]
- Herr, M.; Reichenberger, J. In search of airworthy trailing-edge noise reduction means. In Proceedings of the 17th AIAA/CEAS Aeroacoustics Conference, Portland, OR, USA, 5–8 June 2011. [Google Scholar]
- Herr, M.; Rossignol, K.S.; Delfs, J.; Lippitz, N.; Mößner, M. Specification of porous materials for low-noise trailing-edge applications. In Proceedings of the 20th AIAA/CEAS Aeroacoustics Conference, Atlanta, GA, USA, 16–20 June 2014. [Google Scholar]
- Carpio, A.R.; Martínez, R.M.; Avallone, F.; Ragni, D.; Snellen, M.; van der Zwaag, S. Experimental characterization of the turbulent boundary layer over a porous trailing edge for noise abatement. J. Sound Vib. 2019, 443, 537–558. [Google Scholar] [CrossRef]
- Ali, S.A.S.; Azarpeyvand, M.; da Silva, C.R.I. Trailing-edge flow and noise control using porous treatments. J. Fluid Mech. 2018, 850, 83–119. [Google Scholar]
- Jiang, C.; Moreau, D.J.; Yauwenas, Y.; Fischer, J.R.; Doolan, C.J.; Gao, J.; Kingan, M. Control of rotor trailing edge noise using porous additively manufactured blades. In Proceedings of the 25th AIAA/CEAS Aeroacoustics Conference, Vancouver, BC, Canada, 5–7 May 2018. [Google Scholar]
- Vathylakis, A.; Chong, T.P.; Joseph, P.F. Poro-serrated trailing-edge devices for airfoil self-noise reduction. AIAA J. 2015, 53, 3379–3394. [Google Scholar] [CrossRef]
- Kisil, A.; Ayton, L.J. Aerodynamic noise from rigid trailing edges with finite porous extentions. J. Fluid Mech. 2018, 836, 117–144. [Google Scholar] [CrossRef]
- Bae, Y.; Moon, Y.J. Effect of passive porous surface on the trailing-edge noise. Phys. Fluids 2011, 23, 126101. [Google Scholar] [CrossRef]
- Faßmann, B.W.; Rautmann, C.; Ewert, R.; Delfs, J.W. Prediction of porous trailing edge noise reduction via acoustic perturbation equations and volume averaging. In Proceedings of the 21st AIAA/CEAS Aeroacoustics Conference, Atlanta, GA, USA, 16–20 June 2015. [Google Scholar]
- Zhou, B.Y.; Gauger, N.R.; Koh, S.R.; Meinke, M.; Schröder, W. On the adjoint-based control of trailing-edge turbulence and noise minimization via porous material. In Proceedings of the 21st AIAA/CEAS Aeroacoustics Conference, Dallas, TX, USA, 22–26 June 2018. [Google Scholar]
- Koh, S.R.; Meinke, M.; Schröder, W. Numerical analysis of the impact of permeability on trailing-edge noise. J. Sound Vib. 2018, 421, 348–376. [Google Scholar] [CrossRef]
- Geyer, T.F.; Sarradj, E. Trailing edge noise of partially porous airfoils. In Proceedings of the 20th AIAA/CEAS Aeroacoustics Conference, Atlanta, GA, USA, 16–20 June 2014. [Google Scholar]
- Selig, M.S.; Donovan, J.F.; Fraser, D.B. Airfoils at Low Speeds; Stokely, H.A., Ed.; SoarTech Publications: Virginia Beach, VA, USA, 1989; Volume 121. [Google Scholar]
- ISO 9053. Acoustics—Materials for Acoustical Applications—Determination of Airflow Resistance; International Organization for Standardization: Geneva, Switzerland, 1993. [Google Scholar]
- Jaouen, L.; Chevillotte, F. The acoustic characterization of porous media and its standards. In Proceedings of the INTER-NOISE and NOISE-CON Congress and Conference Proceedings, Hamburg, Germany, 21–24 August 2016; Volume 253, pp. 725–730. [Google Scholar]
- Sarradj, E.; Fritzsche, C.; Geyer, T.F.; Giesler, J. Acoustic and aerodynamic design and characterization of a small-scale aeroacoustic wind tunnel. Appl. Acoust. 2009, 70, 1073–1080. [Google Scholar] [CrossRef]
- Geyer, T.F. Trailing edge noise generation of porous airfoils. Ph.D. Thesis, Brandenburg University of Technology, Cottbus, Germany, 2011. [Google Scholar]
- Merino-Martinez, R.; et al. A review of acoustic imaging methods using phased microphone arrays. CEAS Aeronautical J. 2019. [Google Scholar] [CrossRef]
- Sijtsma, P. CLEAN based on spatial source coherence. Int.J. Aeroacoust. 2007, 6, 357–374. [Google Scholar] [CrossRef]
- Sarradj, E. Three-dimensional acoustic source mapping with different beamforming steering vector formulations. Adv. Acoust. Vib. 2012. [Google Scholar] [CrossRef]
- Sarradj, E. A fast ray casting method for sound refraction at shear layers. Int. J. Aeroacoust. 2016, 16, 65–77. [Google Scholar] [CrossRef]
- Von Schulz-Hausmann, F.K. Wechselwirkung ebener Freistrahlen mit der Umgebung. VDI Fortschr. Strömungstech. 1985, 52, 56. [Google Scholar] [CrossRef]
- Brooks, T.F.; Pope, D.S.; Marcolini, M.A. Airfoil Self-Noise and Prediction; National Aeronautics and Space Administration, Office of Management, Scientific and Technical Information Division: Washington, DC, USA, 1989. [Google Scholar]
- Gruber, M.; Joseph, P.; Chong, T.P. Experimental investigation of airfoil self noise and turbulent wake reduction by the use of trailing edge serrations. In Proceedings of the 16th AIAA/CEAS Aeroacoustics Conference, Stockholm, Sweden, 7–9 June 2010. [Google Scholar]
- Moreau, D.J.; Doolan, C.J. Noise-reduction mechanism of a flat-plate serrated trailing edge. AIAA J. 2013, 51, 2513–2522. [Google Scholar] [CrossRef]
- Blake, W. Noncavitating lifting sections. In Mechanics of Flow-Induced Sound and Vibration, Volume II: Complex Flow-Structure Interactions; Academic Press, Inc.: Cambridge, MA, USA, 1986; pp. 718–836. [Google Scholar]
- Cleveland, W.S. Robust locally weighted regression and smoothing scatterplots. J. Am. Stat. Assoc. 1979, 74, 829–836. [Google Scholar] [CrossRef]
- Cleveland, W.S.; Devlin, S.J. Locally weighted regression: An approach to regression analysis by local fitting. J. Am. Stat. Assoc. 1988, 83, 596–610. [Google Scholar] [CrossRef]
© 2019 by the authors. Licensee MDPI, Basel, Switzerland. This article is an open access article distributed under the terms and conditions of the Creative Commons Attribution (CC BY) license (http://creativecommons.org/licenses/by/4.0/).