Article

Autoimmune, Inflammatory, Autonomic and Enteric Measurements in Patients with Symptoms of Gastroparesis

1
Department of Gastroenterology and Hepatology, University of Louisville, Louisville, KY 40202, USA
2
Department of Bioinformatics & Biostatistics, University of Louisville, Louisville, KY 40202, USA
*
Author to whom correspondence should be addressed.
Gastrointest. Disord. 2026, 8(3), 49; https://doi.org/10.3390/gidisord8030049
Submission received: 24 July 2026 / Revised: 17 August 2026 / Accepted: 19 August 2026 / Published: 26 August 2026

Abstract

Background/Objectives: Gastroparesis is a disorder in which individuals experience dysfunctional gastric motor symptoms, but the underlying etiology is unclear. This exploratory study investigates autoimmune, inflammatory, metabolic, autonomic, and enteric (AIMAE) abnormalities in patients with gastroparesis symptoms to provide new insights into pathophysiology. The aim of this study is to further elucidate the potential associations between the different AIMAE measurements. Methods: Twenty-one patients with gastroparesis symptoms underwent a series of testing including assays for measurement of autoimmune, inflammatory, and metabolic markers; measurement of the autonomic nervous system; electrogastrography recordings; and gastric emptying measurements. Associations were evaluated using Spearman’s rank correlation with pairwise-complete observations. Benjamini–Hochberg false-discovery-rate correction was applied separately within each prespecified statistical family, with q ≤ 0.05 defining statistical significance. Results: Across 3432 planned correlations in 10 prespecified families, four associations met the false-discovery-rate threshold. DFS-70 was positively associated with C-peptide (q= 0.000330). Low-resolution EGG S1 mean amplitude was positively associated with insulin (q = 0.000172). IL-6 was inversely associated with baseline sympathetic LFa modulation (q = 0.000172) and standing sympathetic LFa modulation (q = 0.000172). Conclusions: This prospective pilot study identified strong associations among autoimmune, inflammatory, metabolic, enteric, and autonomic measurements. The findings were robust to leave-one-out analyses and generally retained their direction and magnitude after excluding participants with diabetes or a gastric electrical stimulator. However, the results of this study should be interpreted as hypothesis-generating rather than causal due to its limitations including a small cohort and incomplete confounder information.

1. Introduction

Gastroparesis is a disorder in which individuals experience dysfunctional gastric motor symptoms, but the underlying etiologies are not clear. Autoimmune factors have long been suspected of playing a role in GI motility, patients’ symptoms and perhaps the pathophysiology of gastroparesis [1]. It is understood that the gastric mucosal immune system modulates many gastrointestinal processes, including regulating enteric nervous system and smooth muscle contractility [2]. Therefore, dysregulation of the mucosal immune system can possibly be a component of the etiology of gastroparesis symptoms. Furthermore, autoimmune diseases cause damage, resulting in metabolic dysfunction and often chronic inflammation [3]. For example, a chronic inflamed state can manifest in individuals as elevated C-reactive protein (CRP) and erythrocyte sedimentation rate (ESR). A previous study demonstrated that inflammatory markers including interleukin-17, interleukin-10, interferon-γ, interleukin-8, and interleukin-6 correlated with disease status in individuals with ulcerative colitis [4]. Possibly an inflamed state may drive the pathogenesis of gastroparesis similarly to other disorders like ulcerative colitis. It has also been noted that dysfunction in metabolism has been shown to affect immune cell function, indicating connections between autoimmune, inflammatory, as well as metabolic factors possibly being components of the pathophysiology of gastroparesis symptoms.
Inflammatory markers have connections to other systems including the enteric nervous system, and inflammation can result in functional and structural alterations in neurons and therefore resulting in dysfunction [5]. Inflammation is also known to impact the activity of the autonomic nervous system and perhaps may lead indirectly to gastrointestinal dysfunction. Therefore, there can be connections between inflammatory, autonomics, and enteric markers as well.
Overall, this exploratory study aimed to assess the relationships between autoimmune, inflammatory, and metabolic markers, as well as enteric measurements in relation to autonomic nervous system measures and electrogastrography (EGG) in a cohort of patients with gastroparetic symptoms. This study aimed to assess the gastric emptying test (GET) and several questionnaire scores in the context of autoimmune, inflammatory, metabolic, autonomics, and enteric measures.
We hypothesized that the measurements of antibodies and presence of autoimmune symptoms would potentially reveal existing relationships with inflammatory and metabolic markers. We hypothesized that measurements of inflammatory markers would yield insight and potentially have relationships with autonomic and enteric measurements.

2. Results

2.1. Patient Demographics

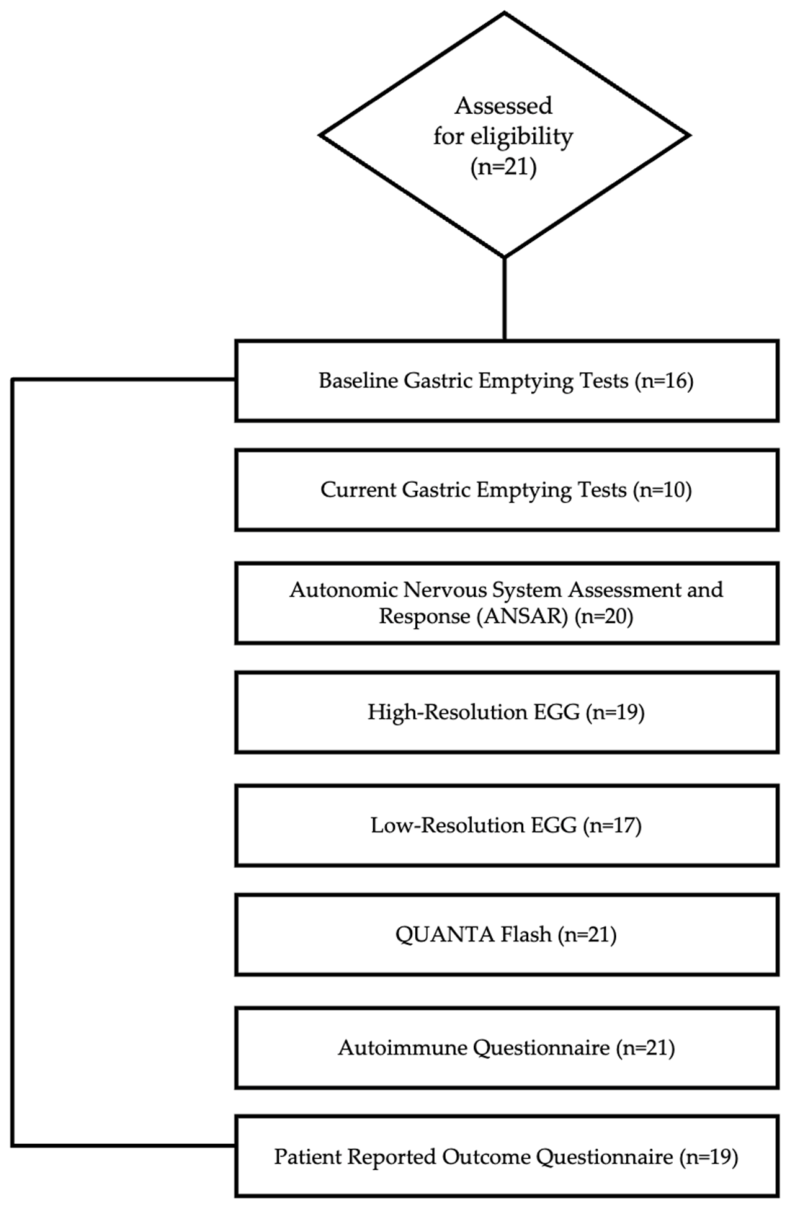
A total of 21 patients were prospectively enrolled and met the eligibility criteria for this study. Of these, 21 participants (one male, 20 females; mean age 45.67 years) completed baseline assessments. Ultimately, 21 participants (one male, 20 females; six diabetic gastroparesis, 14 idiopathic gastroparesis, one POTS) were included in the study. A participation flowchart is demonstrated in Figure 1. Of the 21 participants, 20 were clinically diagnosed with gastroparesis which was established by their electronic health record chart review and one patient was diagnosed with POTS who had gastroparesis-like symptoms. Six patients had a gastric electrical stimulator (GES) in place prior to study measurements. The patient demographics are summarized in Table 1.

2.2. Gastric Emptying Tests

Of the whole cohort, 16 patients underwent standardized solid and liquid gastric emptying studies (Table 2). Historical GET studies are listed as baseline, and studies near enrollment were listed as current. Per the American Gastroenterological Association (AGA), delayed gastric emptying is defined as ≥10% retention of solids, which is determined with gastric emptying scintigraphy. Based on baseline GET studies, 11 out of 16 participants had delayed gastric emptying. For current GET studies, seven out of 10 participants were noted to have delayed gastric emptying.

2.3. Autonomic Measures

Autonomic nervous system (ANS) function testing was performed using Physio PS system ANX 3.0 autonomic monitoring system (ANSAR Medical Technologies, Inc., Chicago, IL, USA). The Autonomic Nervous System Assessment and Response (ANSAR) measurements are summarized in Table 3.

2.4. Electrogastrogram Measures

Low resolution EGG (LR-EGG; Sandhill/Diversatek, Inc., Milwaukee, WI, USA) was performed with two channels with three electrodes each in bipolar configuration, and high-resolution EGG (HR-EGG; Laborie, Inc., Portsmouth, NH, USA) was recorded with an array of six electrodes. For both LR-EGG and HR-EGG, participants would fast for at least 8 h. Skin on abdomen is prepared by shaving and applying appropriate electrode cream. The first segment is a 30 min recording of the fasting period which is then followed by a standardized caloric challenge. The recording continues for the post-prandial period for approximately 60 min. LR-EGG was analyzed by both signals, averaging mean frequency and amplitudes. HR-EGG was analyzed by fast Fourier analysis for mean frequency and power. The HR-EGG and LR-EGG measurements are demonstrated in Table 4.

2.5. Correlation Analysis

A total of 3432 planned pairwise Spearman correlations were evaluated across 10 prespecified scientific families. Benjamini–Hochberg correction was applied separately within each family, with q ≤ 0.05 defining statistical significance. Four associations met this threshold. These significant associations are demonstrated in Table 5. Complete results for all correlations, including nonsignificant and inestimable comparisons, are provided in Supplementary Table S1. Associations selected using the prespecified criteria of q ≤ 0.10 or raw p ≤ 0.01 with |rs| ≥ 0.60 received 5000-resample bootstrap confidence intervals and are provided in Supplementary Table S2.

2.6. Antibodies and Metabolic Markers

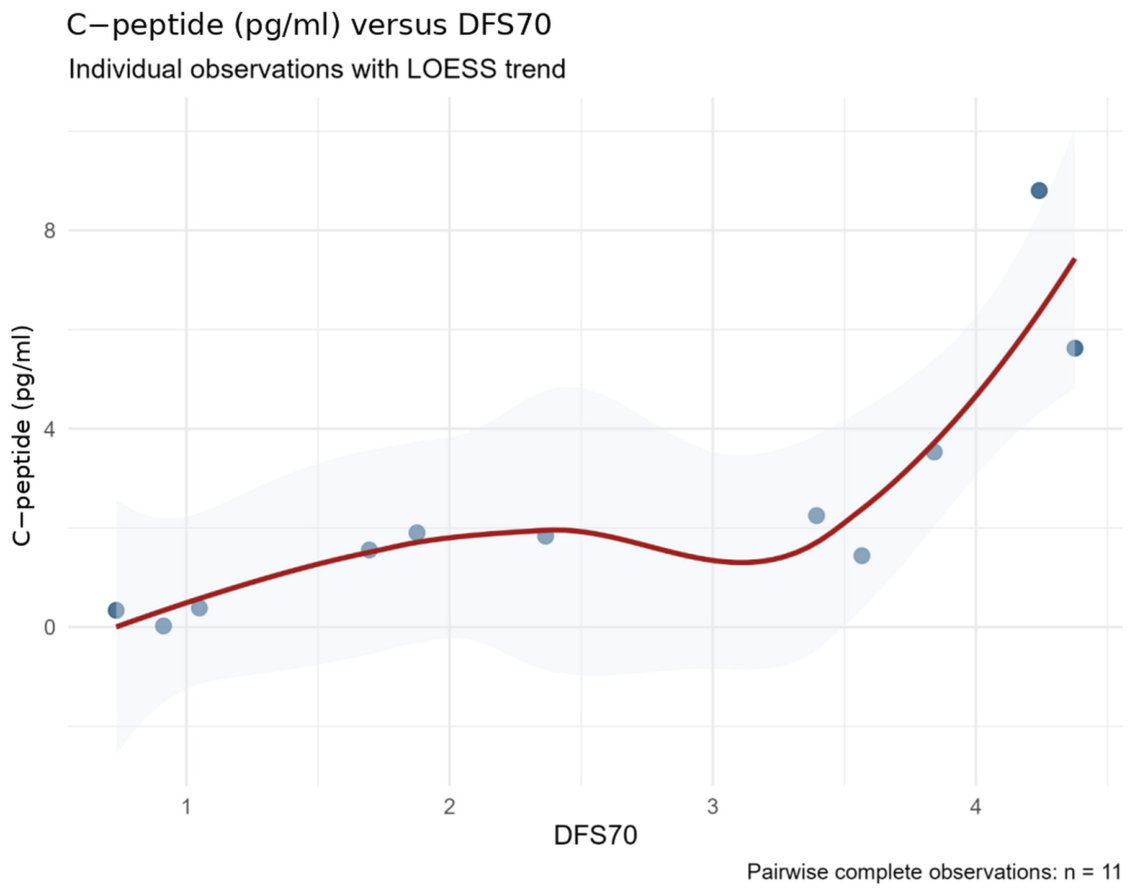
DFS-70 and C-peptide demonstrated a strong positive association (rs = 0.882; bootstrap 95% CI, 0.521–1.000; raw p < 0.001; q = 0.000330; n = 11).

2.7. Low-Resolution EGG Correlations with Inflammatory and Metabolic Markers

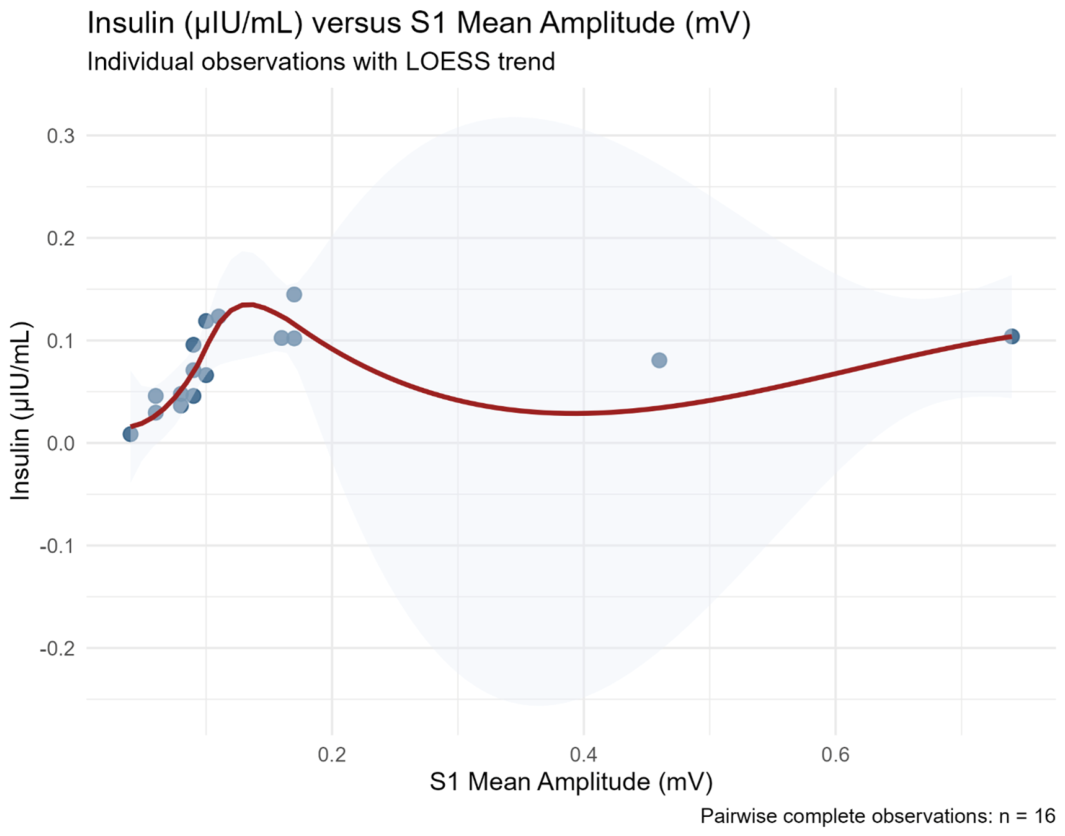
S1 mean amplitude was positively associated with insulin (rs = 0.815; bootstrap 95% CI, 0.504–0.941; q = 0.000172; n = 16).

2.8. Inflammatory Markers and Autonomic (ANSAR) Measurements

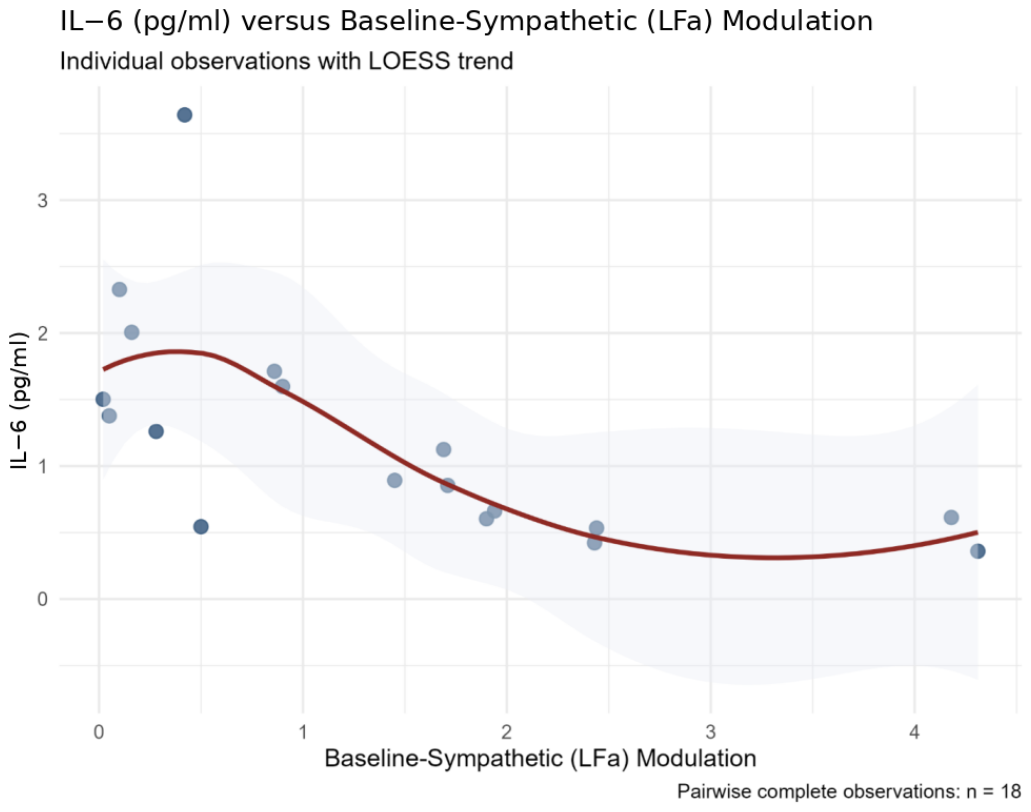
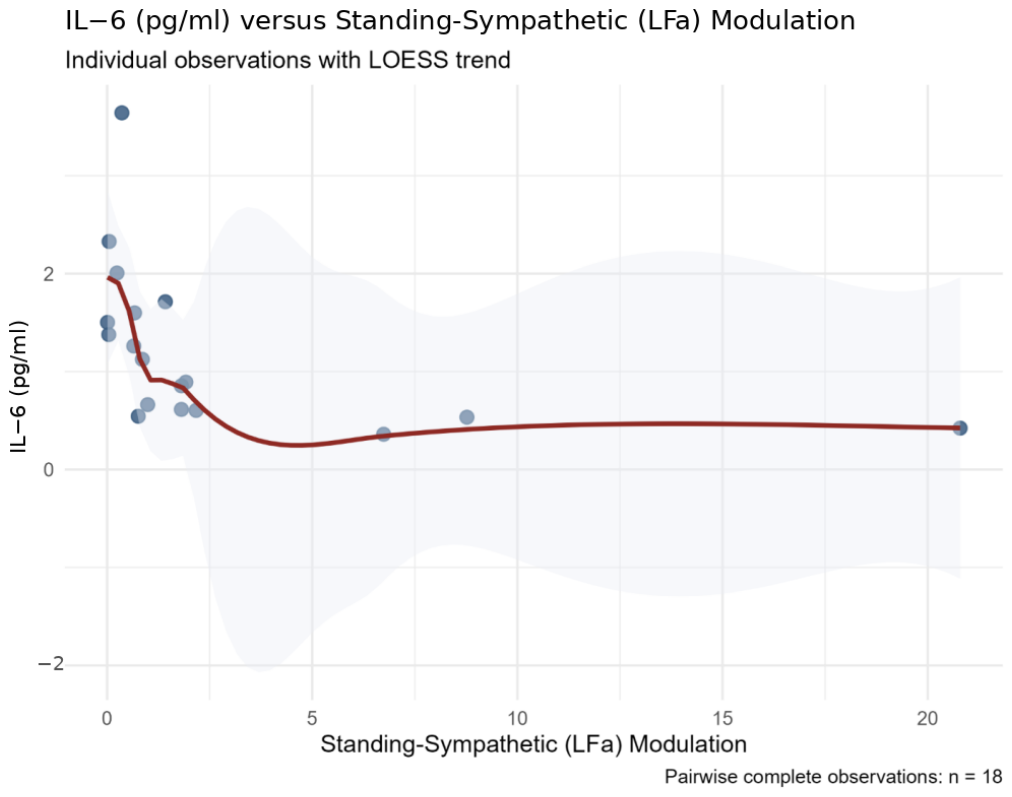
IL-6 was inversely associated with baseline sympathetic LFa modulation (rs = −0.781; bootstrap 95% CI, −0.937 to −0.483; q = 0.000172; n = 18) and standing sympathetic LFa modulation (rs = −0.790; bootstrap 95% CI, −0.928 to −0.482; q = 0.000172; n = 18).
Other correlation analyses investigated relationships between autoimmune markers and inflammatory markers; autoimmune markers and EGG measurements; EGG measurements and autonomic measurements; EGG and GET measurements; EGG measurements and symptom scores; symptom scores and inflammatory markers; symptom scores and metabolic markers; and metabolic markers and autonomic measurements. These correlational analyses are demonstrated in Supplementary Tables S1 and S2.

2.9. Sensitivity and Influence Analyses

Leave-one-out analyses showed that none of the four highlighted associations changed direction after the sequential exclusion of individual participants; the maximum absolute change in (rs) ranged from 0.055 to 0.082. Sensitivity analyses excluding participants with diabetes and, separately, participants with a gastric electrical stimulator preserved the direction and approximate magnitude of the highlighted correlations. Pairwise sample sizes in the restricted analyses ranged from 7 to 13. Given the small restricted-cohort sample sizes, these findings were interpreted as descriptive robustness checks. The leave-one-out analyses are shown in Table 6, and the sensitivity analyses are presented in Table 7.

3. Discussion

In this pilot study, there were several significant associations noted between different components of AIMAE. Of note, DFS-70 was positively associated with C-peptide. C-peptide is primarily associated with insulin production; C-peptide at low levels acts as an anti-inflammatory, but when excessively elevated, C-peptide can indicate inflammation. In addition, DFS-70 has been noted in previous studies to possibly be associated with organ-specific autoimmune diseases [6]. The association between DFS-70 antibody and C-peptide may indicate an interaction between metabolic regulation and chronic inflammation. Therefore, anti-DFS-70 antibody may identify an immunometabolic relationship that warrants further evaluation.
The analysis revealed that there were significant associations between LR-EGG measurements and inflammatory in addition to metabolic markers. S1 mean amplitude was positively associated with insulin. S1 mean amplitude refers to the pre-prandial amplitude of gastric myoelectrical activity which is often lower in individuals with Gp. Insulin resistance has been demonstrated to damage the interstitial cells of Cajal (ICC), which are pacemaker cells of the gastrointestinal muscles leading to gastric dysmotility [7]. Furthermore, hyperinsulinemia is associated with autonomic dysfunction, which is a part of the regulation of gastric motor activity. Therefore, impaired autonomic function would negatively affect gastric smooth muscle contractility, also resulting in irregular gastric motility. This association indicates a possible relationship between the enteric nervous system and biomarkers that requires further investigation.
Furthermore, there were also notable negative associations between ANSAR measurements and IL-6. ANSAR-baseline-sympathetic (LFa) modulation and ANSAR-standing-sympathetic (LFa) modulation specifically were noted to be negatively associated with IL-6. Sympathetic (LFa) modulation indicates the level of sympathetic activity. IL-6 is a cytokine that contributes to the immune response and leads to the release of acute phase reactions such as CRP. It has also been found that increased IL-6 levels delay gastric emptying [8]. Therefore, IL-6 was inversely associated with sympathetic modulation; however, causality cannot be determined from this data.
Gastroparesis is classically defined by delayed gastric emptying and symptom burden. Following this pilot study, the relationship between these two components and biomarkers remains uncertain. The study demonstrated no significant associations between the GET or symptom scores with antibodies, inflammatory and metabolic markers, EEG and autonomic measurements. The cumulative findings suggest that though these markers may provide insights into gastroparesis, their utility for reflecting delayed gastric emptying and patient-reported symptoms is limited. Given the small sample size of this study, these results should be carefully interpreted.
Overall, there were several associations between different components of AIMAE. However, larger prospective studies are needed to confirm and expand these findings to elucidate the pathophysiology of gastroparesis.
Gastroparesis is increasingly recognized as a disorder that involves multiple interacting physiologic systems rather than isolated gastric dysmotility. The present analyses identified associations among autoimmune, inflammatory, metabolic, autonomic, and electrogastrographic measurements, supporting this broader conceptual framework. Nevertheless, these observations should not be interpreted as evidence of causal mechanisms. Rather, they identify biologically plausible relationships that merit further investigation using larger, prospectively designed studies incorporating longitudinal follow-up and mechanistic experimentation.
In this study, the principal estimates were not materially altered by sequential removal of individual participants, and their directions were generally preserved after excluding participants with diabetes or a gastric electrical stimulator. These findings reduce concern that the associations were attributable solely to one influential observation, diabetes status, or stimulator status. However, the restricted analyses included only 8–13 pairwise-complete observations and therefore remain imprecise and descriptive.
This study has several important limitations. First, the cohort consisted of only 21 patients and was intended as an exploratory pilot study. Although bootstrap confidence intervals and false-discovery-rate correction were used to improve statistical robustness, the relatively small sample size limits statistical power and increases uncertainty around individual correlation estimates. Consequently, these findings should be interpreted as hypothesis-generating rather than confirmatory. Furthermore, it is also important to note that given the small sample size, these findings are not applicable to the broader public.
Additionally, the study lacked a healthy control group. Therefore, the observed associations cannot be assumed to be unique to patients with gastroparesis symptoms and may reflect broader physiologic relationships. Future studies that include healthy controls and disease-comparison cohorts will be necessary to determine disease specificity. In addition, because this prospective pilot study relied on clinically available data, not every patient underwent every laboratory or physiologic assessment, resulting in variable sample sizes across analyses. Sample sizes are therefore reported for every correlation to facilitate interpretation.
Also, the autoimmune questionnaire is an investigator-developed tool used in this study. However, it is worth noting that it does not have formal validation which may limit the interpretation of the reported findings from the autoimmune questionnaire.
Furthermore, diabetes and gastric electrical stimulator status were available for all participants and were examined in restricted-cohort sensitivity analyses. However, insulin therapy, GLP-1 receptor agonist therapy, fasting status, contemporaneous glucose and HbA1c, prokinetic use, opioid use, and immunomodulatory therapy, as well as specific timing of biomarker, autonomic, EGG, and GET measurements, were not available as variables in the analysis dataset. These factors may influence biomarker concentrations, gastric electrical activity, autonomic measures, or their observed associations. The small cohort also precluded stable simultaneous multivariable adjustment for several confounders. Residual confounding therefore remains likely, and future prospective studies should standardize fasting and glucose assessment and collect complete medication histories. Finally, because this study is observational and based entirely on correlation analyses, causal relationships cannot be inferred. The observed associations identify candidate biologic relationships that warrant investigation in larger prospective mechanistic studies.
Understanding the pathophysiology of Gp symptoms is important for diagnostic and therapeutic implications. All in all, this exploratory pilot study investigated many serologic and physiologic markers and revealed possible existing interactions between the separate components of AIMAE. The analysis demonstrated associations between antibodies and metabolic markers. It also revealed associations between LR-EGG measurements and metabolic as well as inflammatory markers. It also demonstrated relationships between inflammatory markers and ANSAR measurements of the autonomic nervous system. These cumulative findings support the hypothesis that interactions between different physiological systems may interact in Gp, but do not establish the causal mechanisms of Gp. Rather, this exploratory pilot study may help work toward building a foundation in understanding the underlying components of Gp symptoms and may be useful in directing larger and more expansive studies in the future investigation of Gp symptoms, whether with delayed or non-delayed GET.


4. Materials and Methods

4.1. Inclusion Criteria

  • Adult patients (≥18 years old) with drug-refractor Gp symptoms.
  • Patients with the ability and acceptance to provide written informed consent and study protocol.

4.2. Exclusion Criteria

  • Anatomic obstruction of the gastrointestinal tract.
  • Pregnant patients.
  • Non-compliance with the study protocol or any other active health problems that would render patients unable to complete the study.

4.3. Data Collection

The data collection process involved multiple components, including QUANTA Flash chemiluminescent technology immunoassays for inflammatory and metabolic biomarker measurements, EGG and GET measurements, autonomics assessment, and administration of questionnaires. The antibodies and inflammatory and metabolic markers were selected based on previous studies implicating them in gastrointestinal and autoimmune diseases in addition to the aim of capturing a broad array of markers.
  • Quantitative measurement of antibodies was performed using kits that were purchased from Werfen® using the QUANTA Flash® system (Inova Diagnostics, San Diego, CA, USA). The antibody measurements included QUANTA Flash total, Centromere, dense-fine speckled 70 kDa protein (DFS-70), double-stranded DNA (dsDNA), (anti-histidyl-tRNA synthetase antibody) Jo1, Ribosomal P protein (RiboP), ribonucleoprotein (RNP), Ro52, Ro60, scleroderma-70 (Scl70), Table 1 (Sm), Sjögren’s syndrome type B (SSB), total binary score, and weight score. The measurements were performed by the Werfen® (Inova Diagnostics, San Diego, CA, USA) and were reported in Chemiluminescent Units (CU).
  • Quantitative measurement of inflammatory and metabolic markers was performed using Meso Scale Discovery immunoassays that uses electrochemiluminescence technology. The metabolic markers that were measured included glucagon (pM), insulin (µIU/mL), leptin (pg/mL), pancreatic polypeptide (PP) (pg/mL), active glucagon-like peptide −1 (GLP-1) (pM), glucose-dependent insulinotropic peptide 1 (GIP-1) (pM), and C-peptide (pg/mL). The inflammatory markers measured included IL-1a, IL-1b, IL-2, IL-4, IL-5, IL-6, IL-7, IL-8, IL-10, IL-12, IL-12p70, IL-13, IL-15, IL-16, IL-17, IFN-y, TNFa, TNFb, VEGF, GM-CSF, IP-10, MIP-1a, MIP-1b, MDC, MCP-1, MCP-4, Eotaxin, Eotaxin-3, and TARC. Inflammatory marker measurements were reported in pg/mL.
  • Electrogastrography (EGG) and gastric emptying time (GET): EGG recordings were obtained from participants using standard protocols. Electrodes were placed on the abdomen to capture gastric electrical activity. Simultaneously, gastric emptying time was assessed using a standardized method such as scintigraphy. Both low- and high-resolution EGG variables were recorded. The low-resolution EGG measured frequency and amplitude and had two channels, S1 and S2. The high-resolution EGG measured only frequency, and a summary and average of the best quality channels was used. Both high-resolution and low-resolution EGG were used to get comprehensive readings of possible gastric electric abnormalities. These EGG recordings were performed prior to when Gastric Alimetry began being available for commercial use.
  • Autonomics: Measurements of autonomics include heart rate (HR), blood pressure (BP), and other related indicators. Baseline measurements were obtained, and participants’ responses to specific stimuli, deep breathing, and Valsalva maneuver were recorded. These measures provided insights into the autonomic functions associated with gastrointestinal activity.
  • Questionnaires: Participants completed questionnaires to assess symptoms, quality of life, and other relevant factors. Two types of scores were calculated: weighted scores and exact scores. These questionnaires aimed to capture comprehensive information about the participants’ gastrointestinal symptoms and their impact on daily life.

4.4. Autoimmune Questionnaires

All total 21 patients were screened for autoimmune symptoms using autoimmune questionnaires (Table 8). Autoimmune symptoms were weighted accordingly based on the severity of the symptoms, and symptoms were scored out of a maximal score of 37 in exact score and 67 in weighted score. The weight scores were compared with a corresponding exact score of 1 for each symptom. The autoimmune questionnaire is an investigatory-developed, non-validated exploratory tool from the University of Louisville to assess autoimmune symptoms and their severity. This questionnaire was approved by IRB (16.0770).

4.5. Statistical Analysis

The participants in this study were prospectively enrolled, and the analysis was conducted retrospectively. Spearman’s rank correlations were used to evaluate associations among autoimmune, inflammatory/metabolic, autonomic, electrogastrographic, gastric-emptying, and gastrointestinal symptom measures. The analysis comprised 3432 planned pairwise correlations organized into 10 prespecified scientific families according to the measurement domains being compared: EGG with gastrointestinal symptoms, autonomic measures, gastric emptying, and inflammatory/metabolic markers; autoimmune measures with gastrointestinal symptoms, EGG, gastric emptying, and inflammatory/metabolic markers; gastrointestinal symptoms with inflammatory/metabolic markers; and autonomic measures with inflammatory/metabolic markers. Each correlation used all participants with non-missing values for that variable pair (pairwise-complete analysis); values were not imputed, and the pairwise sample size was reported for every comparison. Benjamini–Hochberg false-discovery-rate adjustment was applied separately within each family, with q ≤ 0.05 defining statistical significance. All correlations were initially evaluated using rs, raw p-values, and family-specific q-values. For the four principal associations, uncertainty was quantified using percentile confidence intervals from 5000 participant-level bootstrap resamples. The stability of each association was further assessed by sequentially omitting one participant and recalculating Spearman’s rho. To assess the potential influence of diabetes and prior gastric electrical stimulation (GES), the principal correlations were repeated after excluding participants with diabetes and, separately, after excluding participants with a history of GES. The Benjamini–Hochberg procedure was used to control the false discovery rate across the broader set of exploratory correlations. Scatterplots with LOESS curves were used to visualize the data distribution and possible departures from linearity; these curves were considered descriptive and were not used as formal tests of nonlinear relationships (Figure 2, Figure 3, Figure 4 and Figure 5). Analyses were conducted in R version 4.4.3 (R Foundation for Statistical Computing, Vienna, Austria).

Supplementary Materials

The following supporting information can be downloaded at: https://www.mdpi.com/article/10.3390/gidisord8030049/s1, Table S1: Complete Spearman Correlation Results. Bootstrap 95% confidence intervals were calculated using 5000 resamples for prespecified significant or near-significant associations; Table S2: Significant and Near-Significant Correlations with 5000-Resample Bootstrap Confidence Intervals; Table S3: Principal Correlations - Leave one out analysis.

Author Contributions

Conceptualization, T.L.A.; methodology, T.L.A., A.G., P.M., F.A.H., C.B., L.Y.N., A.S. and M.C.; software, M.W.D.; validation, all authors; formal analysis, M.W.D., T.L.A., A.G., F.A.H. and C.B.; investigation, A.G., P.M., F.A.H., C.B., L.Y.N., A.S., M.C. and T.L.A.; resources, T.L.A.; data curation, M.W.D.; writing—original draft preparation, T.L.A., M.W.D. and A.G.; writing—review and editing, all authors; visualization, M.W.D.; supervision, T.L.A.; project administration, T.L.A.; funding acquisition, T.L.A. All authors have read and agreed to the published version of the manuscript.

Funding

This research received no external funding.

Institutional Review Board Statement

The study was conducted in accordance with the Declaration of Helsinki and approved by the Institutional Review Board of University of Louisville (protocol 18.0928 and approved 25 October 2018) for studies involving humans.

Informed Consent Statement

Informed consent was obtained from all subjects involved in the study.

Data Availability Statement

The data presented in this study are available on request from the corresponding author due to IRB coverage.

Acknowledgments

The authors would like to thank the staff of Jewish Hospital, the GI Motility Clinic and the University of Louisville CTR/Liver Research Unit. The authors would like to thank Abbie Watson for assisting with manuscript preparation.

Conflicts of Interest

T. Abell—Main funding: NIH GpCRC, NIH DiaComp, NIH Gastric Dysrhythmias, NIH HEAL; Investigator: Vanda; Consultant: Nuvaira, Enterra Medical, Vanda, Novo Nordisk; Reviewer: UpToDate; GES editor: Neuromodulation, Wikistim; ADEPT-GI: Holds IP for autonomic/enteric and bioelectric diagnosis and therapies. A. Stocker—Investigator: Vanda, Enterra Medical.

Abbreviations

CRPC-reactive Protein
ESRErythrocyte Sedimentation Rate
EGGElectrogastrography
GETGastric Emptying Test
GpGastroparesis
DFSDense Fine Speckled
dsDNADouble-stranded DNA
RiboPRibosomal P Protein
RNPRibonucleoprotein
SclScleroderma
SSBSjögren’s Syndrome Type B
GLP-1Glucagon-like Peptide-1
GIP-1Glucose-dependent Insulinotropic Peptide 1
POTSPostural Orthostatic Tachycardia Syndrome
GESGastric Electrical Stimulator
ANSAutonomic Nervous System
ANSARAutonomic Nervous System Assessment and Response
LR-EGGLow Resolution EGG
HR-EGGHigh Resolution EGG
FDRFalse Discovery Rate
MCP-1Monocyte Chemoattractant Protein-1
IL-6Interleukin-6
LFaLow Frequency Area
RFaRespiratory Frequency Area
ICCInterstitial Cells of Cajal

References

  1. Simons, M.; Loesch, J.; Hamza, E.; Brown, J.T.; Lembo, A.; Cline, M. Clinical Characteristics of Autoimmune Gastroparesis and Response to Immunomodulation. J. Clin. Gastroenterol. 2025. ahead of print. [Google Scholar] [CrossRef] [Scilit]
  2. Gottfried-Blackmore, A.; Namkoong, H.; Adler, E.; Martin, B.; Gubatan, J.; Fernandez-Becker, N.; Clarke, J.O.; Idoyaga, J.; Nguyen, L.; Habtezion, A. Gastric Mucosal Immune Profiling and Dysregulation in Idiopathic Gastroparesis. Clin. Transl. Gastroenterol. 2021, 12, e00349. [Google Scholar] [CrossRef] [Scilit]
  3. Chen, Y.; Lin, Q.; Cheng, H.; Xiang, Q.; Zhou, W.; Wu, J.; Wang, X. Immunometabolic shifts in autoimmune disease: Mechanisms and pathophysiological implications. Autoimmun. Rev. 2025, 24, 103738. [Google Scholar] [CrossRef] [Scilit]
  4. Mogilevski, T.; Hardy, M.Y.; Takahashi, K.; Smith, R.; Nguyen, A.L.; Farmer, A.; Lindsay, J.O.; Tye-Din, J.A.; Aziz, Q.; Gibson, P.R. Effects of Stress, Vagal Nerve Stimulation and Disease Activity on Circulating Cytokines, Quantified by an Ultrasensitive Technique, in Ulcerative Colitis: A Pilot Study. JGH Open 2025, 9, e70206. [Google Scholar] [CrossRef] [Scilit]
  5. Magalhães, H.I.R.; Castelucci, P. Enteric nervous system and inflammatory bowel diseases: Correlated impacts and therapeutic approaches through the P2X7 receptor. World J. Gastroenterol. 2021, 27, 7909–7924. [Google Scholar] [CrossRef] [Scilit]
  6. Duran, A.C.; Cuzdan, N.; Atik, T.K. The clinical significance of anti-DFS70 autoantibodies and its correlation with Vitamin D levels. North. Clin. Istanb. 2022, 9, 581–589. [Google Scholar] [CrossRef] [Scilit]
  7. Horváth, V.J.; Vittal, H.; ÖrDög, T. Reduced Insulin and IGF-I Signaling, not Hyperglycemia, Underlies the Diabetes-Associated Depletion of Interstitial Cells of Cajal in the Murine Stomach. Diabetes 2005, 54, 1528–1533. [Google Scholar] [CrossRef] [Scilit]
  8. Lang Lehrskov, L.; Lyngbaek, M.P.; Soederlund, L.; Legaard, G.E.; Ehses, J.A.; Heywood, S.E.; Albrechtsen, N.J.W.; Holst, J.J.; Karstoft, K.; Pedersen, B.K.; et al. Interleukin-6 Delays Gastric Emptying in Humans with Direct Effects on Glycemic Control. Cell Metab. 2018, 27, 1201–1211.e3. [Google Scholar] [CrossRef] [Scilit]
Figure 1. Participation flowchart.
Gastrointestdisord 08 00049 g001
Figure 2. Scatterplot of individual observations with LOESS trend of C-peptide (pg/mL) versus DFS-70. Dots represent individual observations, the solid line represents the LOESS trend, and the shaded area represents the 95% confidence interval.
Gastrointestdisord 08 00049 g002
Figure 3. Scatterplot of individual observations with LOESS trend of insulin (µIU/mL) versus S1 Mean Amplitude (mV). Dots represent individual observations, the solid line represents the LOESS trend, and the shaded area represents the 95% confidence interval.
Gastrointestdisord 08 00049 g003
Figure 4. Scatterplot of individual observations with LOESS trend of IL-6 (pg/mL) versus Baseline-Sympathetic (LFa) Modulation. Dots represent individual observations, the solid line represents the LOESS trend, and the shaded area represents the 95% confidence interval.
Gastrointestdisord 08 00049 g004
Figure 5. Scatterplot of individual observations with LOESS trend of IL-6 (pg/mL) versus Standing-Sympathetic (LFa) Modulation. Dots represent individual observations, the solid line represents the LOESS trend, and the shaded area represents the 95% confidence interval.
Gastrointestdisord 08 00049 g005
Table 1. Patient demographics.
CharacteristicsOverall
Number of patients21
Age (years, IQR a)48.0 [34.0, 57.0]
Male (n, %)1 (4.8%)
White15 (71.4%)
Non-Hispanic20 (95.2%)
Body Mass Index 29.1 [19.6, 32.3]
Idiopathic gastroparesis (n, %)14 (66.7%)
Presence of diabetes (n, %)6 (28.6%)
Postural Orthostatic Tachycardia Syndrome (n, %)1 (4.8%)
Presence of gastric electrical stimulators (n, %)6 (27.3%)
IQR; Interquartile Range a.
Table 2. Summary of gastric emptying test baseline vs. current measurements.
GET aBaseline (%)Current (%)
Liquid 1 h47.8 [31.2, 62.2]44.0 [35.9, 52.0]
Liquid 2 h25.0 [14.3, 42.0]26.5 [19.0, 31.0]
Liquid 4 h8.5 [4.9, 15.5]6.5 [6.0, 16.0]
Solid 1 h67.1 [59.0, 87.0]76.5 [68.7, 84.0]
Solid 2 h42.0 [28.3, 61.0]51.5 [43.0, 66.0]
Solid 4 h11.5 [4.5, 19.9]12.0 [9.0, 26.0]
SymptomsBaselineCurrent
Vomiting 2.0 [1.0, 2.8]1.0 [0.0, 2.4]
Nausea 3.2 [2.0, 4.0]3.0 [2.0, 4.0]
Anorexia 3.2 [2.5, 4.0]3.2 [2.0, 4.0]
Bloating 3.0 [3.0, 4.0]3.0 [2.1, 4.0]
Abdominal Pain 3.0 [2.0, 4.0]3.0 [1.0, 4.0]
Reflux 3.0 [2.5, 4.0]2.5 [1.0, 3.5]
Constipation 1.5 [0.0, 2.9]2.0 [0.1, 3.0]
Diarrhea 1.0 [0.0, 2.0]1.0 [0.0, 2.0]
Frequent Urination 2.0 [0.1, 3.0]1.2 [0.0, 2.8]
Infrequent Urination 0.0 [0.0, 1.0]1.0 [0.0, 2.0]
Upper TSS b22.0 [16.5, 25.5]23.0 [12.8, 27.2]
Lower TSS b4.5 [2.5, 8.0]6.0 [3.1, 7.9]
GET, gastric emptying test a; TSS, total symptom score b.
Table 3. Summary of Autonomic Nervous System Assessment and Response (ANSAR) measurements.
AutonomicsBaselineDeep BreathingValsalvaStanding
Heart Rate Average72.5 [63.0, 85.5]NA aNA80.0 [70.2, 90.0]
Heart Rate Range 13.5 [7.8, 24.5]14.5 [11.8, 25.2]NA25.5 [16.5, 34.2]
Sympathetic (LFa b) modulation 1.4 [0.3, 1.9]NA18.9 [10.8, 32.9]1.2 [0.3, 2.0]
Parasympathetic (RFa c) modulation 0.6 [0.2, 2.0]14.1 [5.6, 19.1]1.2 [0.5, 6.6]0.4 [0.1, 3.0]
Sympathovagal balance: LFA/RFA d 1.3 [0.7, 2.4]NANANA
Systolic Blood Pressure123.0 [113.2, 144.8]122.5 [109.5, 144.2]133.5 [109.0, 149.5]127.5 [108.8, 140.5]
Diastolic Blood Pressure74.0 [67.2, 77.0]69.5 [64.0, 75.0]72.0 [67.0, 84.5]72.5 [66.0, 79.2]
NA, not available a; LFa, low frequency area b; RFa, respiratory frequency area c; LFA/RFA, low frequency area/respiratory frequency area d.
Table 4. Summary of HR-EGG and LR-EGG measurements.
EGG (High Resolution)
Channels14.0 [11.2, 15.8]
Mean Frequency2.9 [2.6, 3.0]
Mean Frequency S.D.0.5 [0.4, 0.5]
Mean Power1648 [527, 5530]
Mean Power S.D818 [279, 4101]
EGG (Low Resolution)
S1 Frequency3.9 [3.2, 4.3]
S1 Frequency S.D. (CPM a)1.4 [0.9, 1.8]
S1 Amplitude0.1 [0.1, 0.2]
S1 Amplitude S.D. (mV)0.0 [0.0, 0.1]
S2 Frequency4.2 [2.9, 4.5]
S2 Frequency S.D. (CPM a)1.6 [1.5, 2.0]
S2 Amplitude0.1 [0.1, 0.2]
S2 Amplitude S.D. (mV)0.0 [0.0, 0.1]
CPM, cycles per minute a.
Table 5. FDR-significant AIMAE associations. Spearman’s rank correlation coefficients are shown with percentile 95% confidence intervals from 5000 nonparametric bootstrap resamples. Benjamini–Hochberg adjustment was applied separately within each prespecified statistical family; q ≤ 0.05 defined statistical significance.
AntibodyMetabolic Markerrs aLower 95% CI Upper 95% CIUnadj. pqn
DFS70 bC-peptide0.8820.5211.000<0.0010.0003311
Low Resolution—EGGMetabolic Marker
S1 Mean Amplitude (mV) Insulin0.8150.4860.939<0.0010.0001216
Inflammatory MarkerANSAR
IL-6Baseline—Sympathetic (LFa c) modulation−0.781−0.937−0.483<0.0010.0001318
IL-6Standing—Sympathetic (LFa c) modulation−0.790−0.928−0.481<0.0010.000009618
Spearman’s correlation coefficients, rs a; DFS-70, dense fine speckled protein of 70 kDa b; LFa, low frequency area c.
Table 6. Principal correlations with bootstrap confidence intervals and leave-one-out influence diagnostics.
AssociationSpearman ρ95% CIRaw pPairwise nValid Bootstrap SamplesLeave-One-Out RangeMost Influential ParticipantMaximum Absolute Change
DFS-70 and C-peptide0.8820.521 to 1.000<0.0011150000.842 to 0.96430.082
S1 mean amplitude and insulin0.8150.504 to 0.941<0.0011650000.775 to 0.87080.055
IL-6 and baseline sympathetic LFa−0.781−0.937 to −0.483<0.001185000−0.848 to −0.740130.067
IL-6 and standing sympathetic LFa−0.79−0.928 to −0.482<0.001185000−0.849 to −0.75530.059
Table 7. Sensitivity analyses of principal correlations. Principal associations after excluding participants with diabetes or prior gastric electrical stimulation.
PopulationSpearman ρ95% Bootstrap CIRaw pPairwise n
DFS-70 and C-peptide
Full cohort0.8820.495 to 1.000<0.00111
No diabetes0.8670.402 to 1.0000.0029
No gastric electrical stimulator0.9290.412 to 1.0000.0037
IL-6 and baseline sympathetic LFa
Full cohort−0.781−0.935 to −0.489<0.00118
No diabetes−0.742−0.977 to −0.2650.00413
No gastric electrical stimulator−0.867−1.000 to −0.533<0.00112
IL-6 and standing sympathetic LFa
Full cohort−0.790−0.930 to −0.485<0.00118
No diabetes−0.781−0.973 to −0.3150.00213
No gastric electrical stimulator−0.860−0.979 to −0.543<0.00112
S1 mean amplitude and insulin
Full cohort0.8150.486 to 0.942<0.00116
No diabetes0.8070.451 to 0.9510.00212
No gastric electrical stimulator0.8830.608 to 0.993<0.00111
Note. Sensitivity analyses are descriptive. Spearman correlation estimates, participant-level 5000-resample bootstrap 95% confidence intervals, raw p values, and pairwise-complete sample sizes are reported. Multiplicity-adjusted q-values are not presented.
Table 8. Autoimmune questionnaire.
Fever/Body TemperatureRecurrent fever, high body temperature (3)
Night sweats (1)
HairAlopecia (loss of hair on the front and top of the head) (1)
Loss of hair in outer eyebrow (4)
SkinHyperpigmentation, or dark tanning in skin (3)
Skin that bruises easily (1)
Acne (1)
Skin rashes of unknown cause (4)
Sun sensitivity (2)
Skin ulcers on the fingers and/or toes (2)
EyesDry eyes (2)
Eye discomfort or pain (1)
Throat, Neck, Voice, and MouthDry mouth (1)
Hoarseness, husky, or gravelly voice (1)
Difficulty swallowing (1)
Mouth/nose sores (1)
Fatigue and SleepLack of energy (1)
Exhausted after minimal effort or exercise (1)
Muscles, Joints, and TendonsPain and tenderness throughout the body (3)
Loss of muscle control (4)
Muscle weakness (1)
Joint stiffness (1)
Bone, joint, and muscle aches, inflammation, and pain (4)
Backaches, unexplained rib and spinal column fractures (1)
Carpal tunnel syndrome/tendonitis (1)
Hands and FeetRaynaud’s phenomenon (extreme sensitivity to cold in the hands and feet) (4)
Swelling in hands and feet (1)
Digestion/GastrointestinalRecurring abdominal bloating and pain (1)
Pale, foul-smelling stool (1)
Constipation (1)
Mood and ThinkingIrritability, anxiety, and depression (1)
“Brain fog”, difficulty concentrating, forgetfulness (1)
Balance, Coordination
and Neurological Symptoms
Dizziness (1)
Vertigo (the room spins) (2)
Loss of balance (4)
Blood ChangesUnexplained anemia (low count of red blood cells) (3)
High cholesterol levels (1)
Autoimmune symptoms weighted based on severity of symptoms indicated by the number associated with each respective symptom and compared with a corresponding exact score of 1 for each symptom.
Disclaimer/Publisher’s Note: The statements, opinions and data contained in all publications are solely those of the individual author(s) and contributor(s) and not of MDPI and/or the editor(s). MDPI and/or the editor(s) disclaim responsibility for any injury to people or property resulting from any ideas, methods, instructions or products referred to in the content.