1. Introduction
Metabolic health is a cornerstone of overall well-being and is intricately linked to the risk of developing chronic diseases such as diabetes, cardiovascular disorders, and obesity [
1]. The growing prevalence of metabolic dysfunction worldwide has brought this area of health into sharp focus, emphasizing the need for comprehensive research to understand its underlying mechanisms and contributing factors [
2]. Metabolic health encompasses multiple facets, including glucose metabolism, lipid profiles, and body composition, all of which are influenced by complex interactions between genetic, environmental, and lifestyle factors [
3].
Among the environmental and behavioral influences, lifestyle choices such as smoking, diet, and living environment play pivotal roles in shaping metabolic outcomes. Smoking, for instance, is known to exert adverse effects on insulin sensitivity, lipid metabolism, and systemic inflammation, all of which are critical determinants of metabolic health [
4]. On the other hand, diet is one of the most modifiable factors affecting metabolism. Nutritional patterns rich in fruits, vegetables, and whole grains are associated with a reduced risk of metabolic syndrome, while high intakes of processed foods and sugar-sweetened beverages have the opposite effect [
5]. The living environment—whether urban or rural—further adds complexity, as it determines access to resources such as fresh food, opportunities for physical activity, and exposure to pollution. These factors collectively interact with the gut microbiota, which acts as a crucial mediator between external influences and internal metabolic processes [
6].
The gut microbiota has emerged as a focal point in metabolic health research. This complex community of microorganisms residing in the human gastrointestinal tract plays a key role in regulating energy balance, glucose homeostasis, and lipid metabolism. Disturbances in the microbiota, often referred to as dysbiosis, have been implicated in the development of obesity and diabetes [
7].
Figure 1 below presents a schematic representation of the intricate relationship between gut microbiota and metabolic regulation.
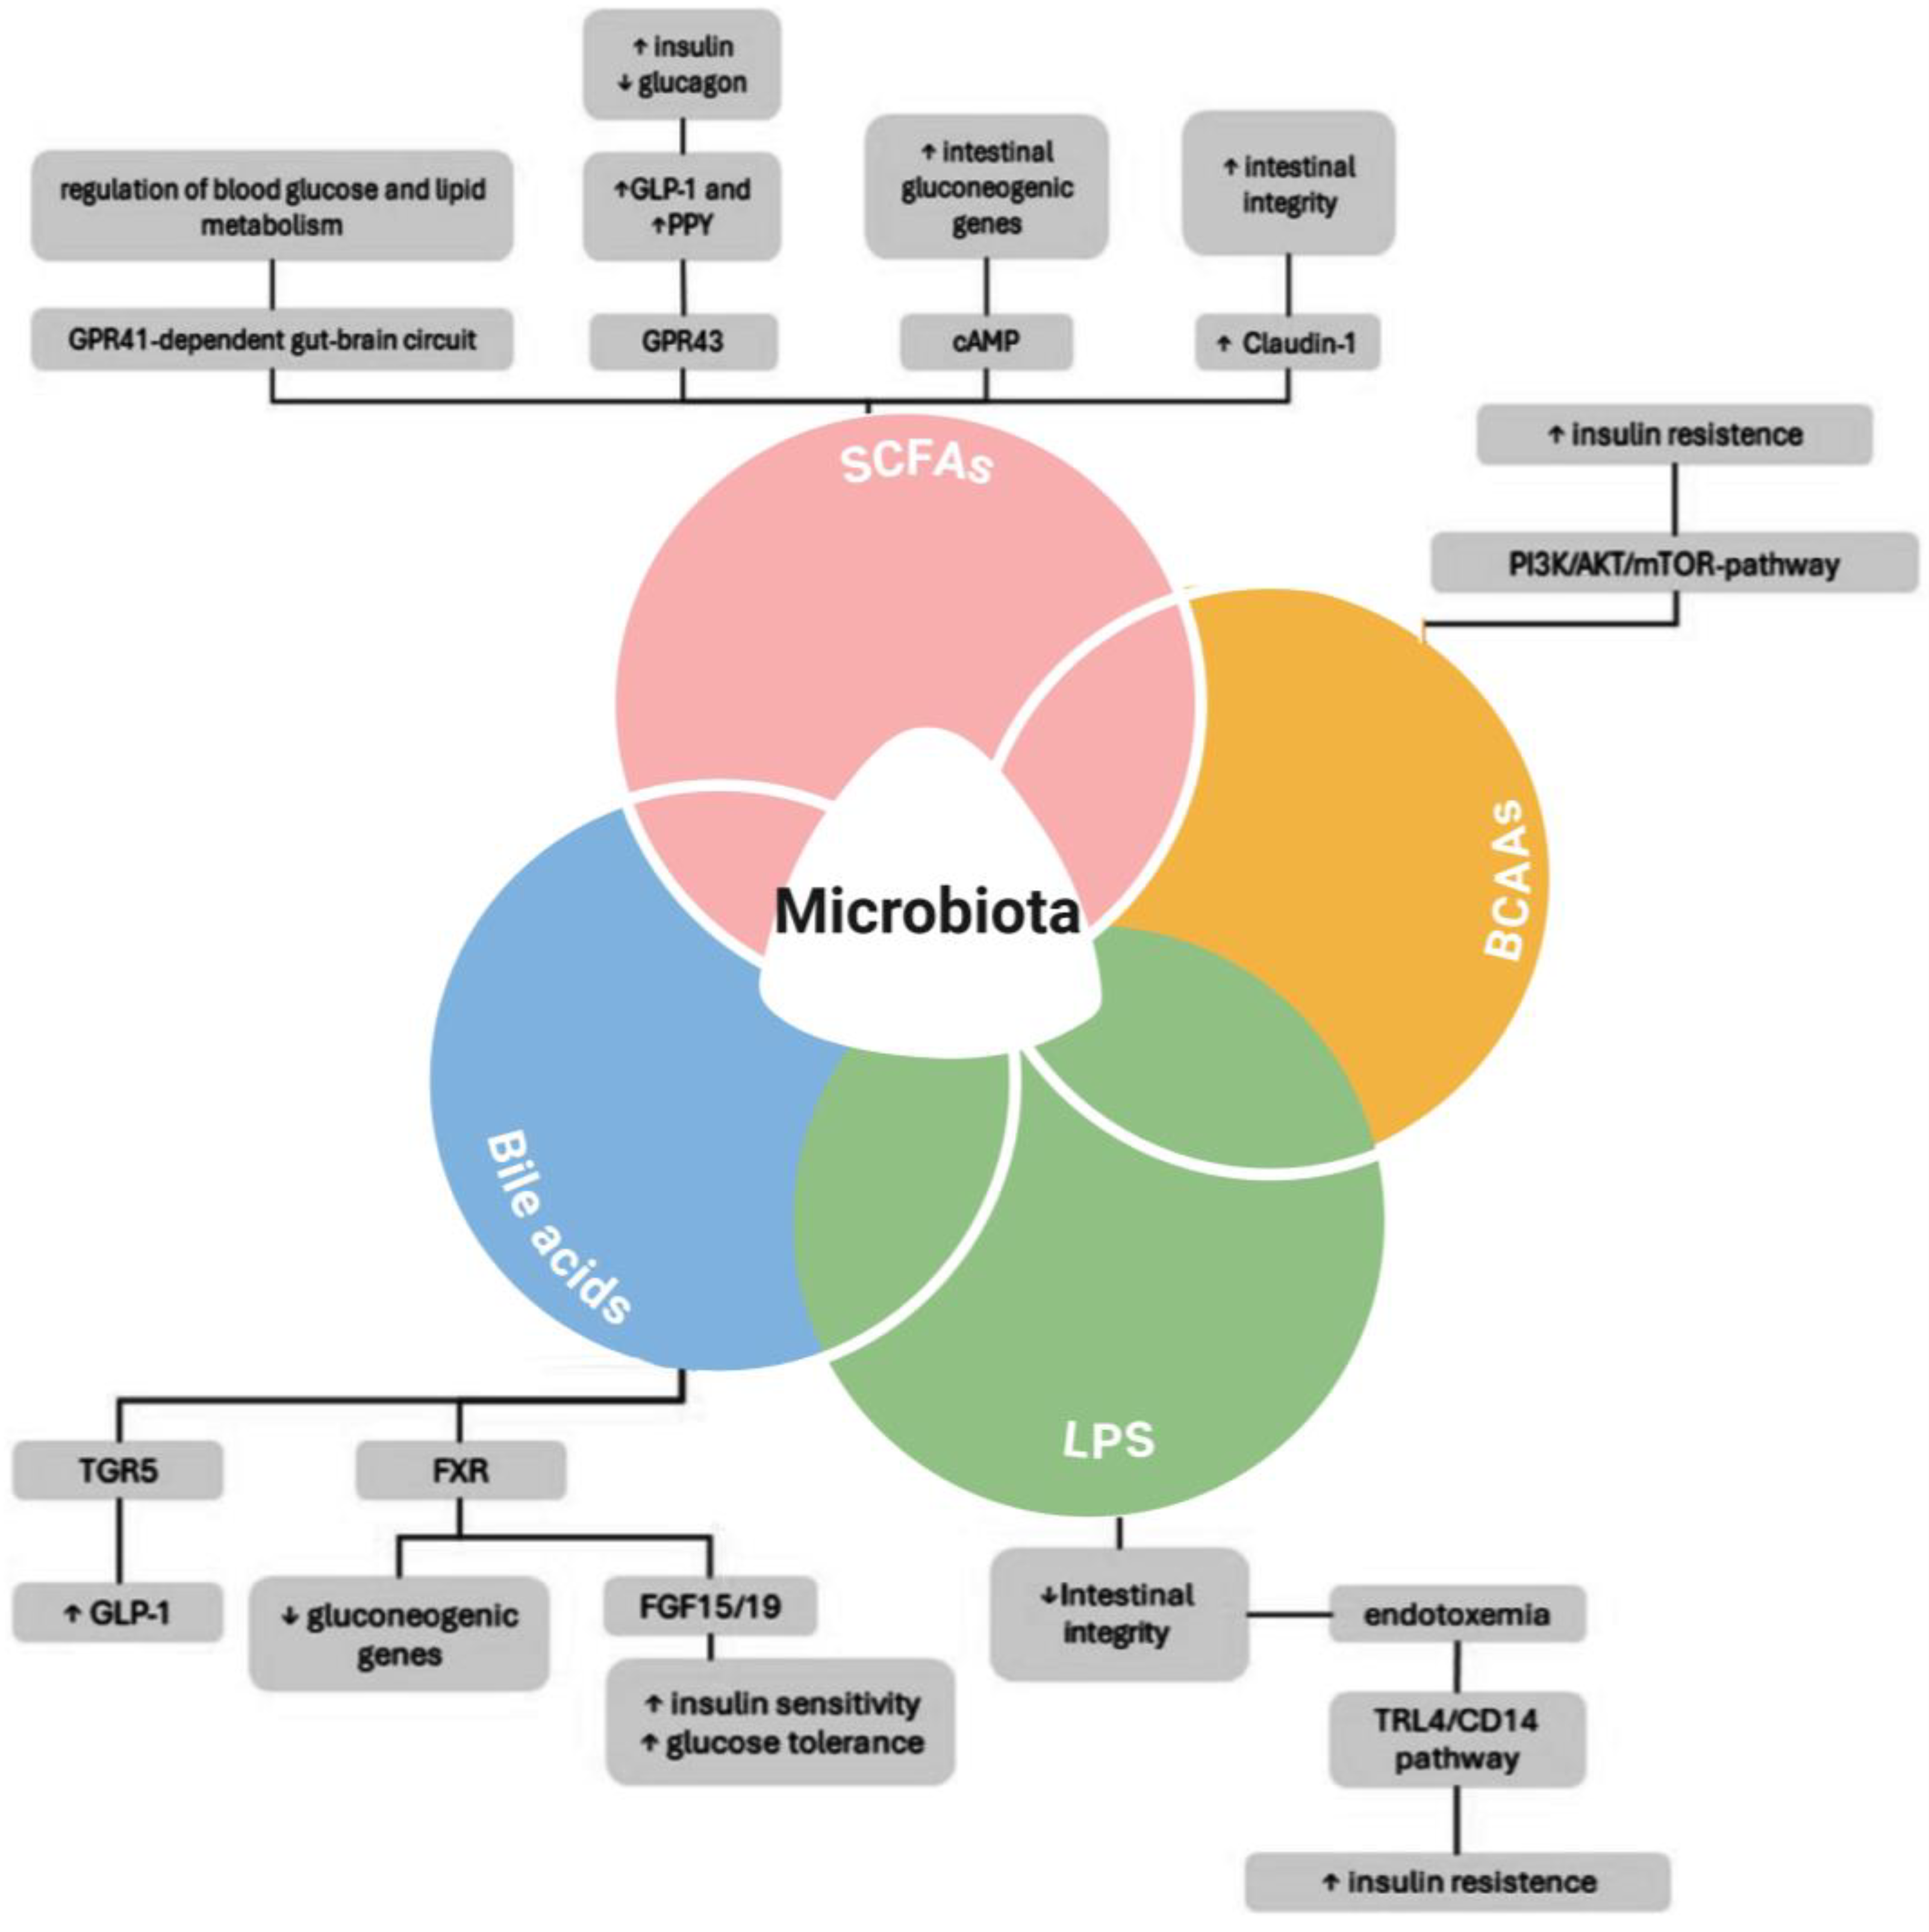
The gut microbiota influences metabolic health through various mechanisms, including the production of short-chain fatty acids (SCFAs), branched-chain amino acids (BCAAs), bile acids, and lipopolysaccharides (LPS) [
9]. SCFAs contribute to improved metabolic outcomes by modulating intestinal gluconeogenic genes, enhancing Glucagon-like peptide-1 (GLP-1) and Peptide YY (PYY) secretion, and maintaining intestinal integrity via Claudin-1 [
10,
11]. Additionally, bile acids interact with receptors such as TGR5 and FXR, promoting GLP-1 secretion, reducing gluconeogenic gene expression, and improving insulin sensitivity and glucose tolerance [
12,
13]. Conversely, the presence of BCAAs and LPS has been linked to insulin resistance, with LPS-mediated intestinal permeability loss and endotoxemia triggering inflammatory pathways (Toll-like receptor 4-TRL4/CD14), further exacerbating insulin resistance [
14]. The PI3K/AKT/mTOR pathway, activated by BCAAs, also contributes to insulin resistance, reinforcing the metabolic impact of gut microbiota imbalances [
15,
16]. Targeting these microbial pathways through diet, probiotics, or pharmacological interventions may offer novel therapeutic strategies for improving metabolic health and glycemic control.
In this study, we aimed to address the interplay between gut microbiota and metabolic health in the context of modifiable lifestyle factors, seeking to unravel the associations between smoking, dietary habits, living environments, and metabolic outcomes. Specifically, our research focuses on exploring the influence of these factors on body composition, metabolic markers, and gut microbiota profiles, contributing to a more holistic understanding of the mechanisms driving metabolic health disparities.
The objectives of this study were threefold. First, it planned to characterize the cohort in terms of age, gender, smoking status, dietary patterns, and urban versus rural living environments, thereby providing a comprehensive demographic and behavioral profile. Second, it elucidated the associations between these lifestyle factors and key metabolic health indicators, including body composition and glucose metabolism. Lastly, we aim to contribute to the growing body of evidence on the role of gut microbiota in the context of diabetes and metabolic health. Another objective was to clarify the possible role of metformin in microbiota composition and its consequences for gastrointestinal health.
By addressing these objectives, we aimed to generate actionable insights for public health strategies and to point out the importance of a multidimensional approach to understanding and managing metabolic health, bridging the gap between microbiota research and practical applications in clinical and public health settings.
2. Results
2.1. Population Characteristics
Table 1 presents a comprehensive summary of the cohort’s demographic, anthropometric, metabolic, and biochemical characteristics, providing key insights into the population studied. The dataset includes 30 individuals with a mean age of 62.4 years (±10.68), reflecting an older demographic. The male-to-female ratio is approximately 56.7% male, with most participants residing in urban areas (83.3%). Lifestyle factors such as smoking status indicate that 30% of participants are smokers. Anthropometric measurements reveal an average height of 169.03 cm and a mean weight of 82 kg, with BMI distribution highlighting that the majority fall into the overweight or obese categories. Abdominal circumference, an important marker of central adiposity, averages 102.83 cm.
Metabolic and biochemical parameters provide further insights into the cohort’s health status. Markers of glucose metabolism show a mean HbA1c of 6.58% and a mean fasting blood glucose of 135.77 mg/dL, values that indicate relatively well-balanced glucose profiles for this population of type 2 diabetes patients. Lipid profile analysis demonstrates a total cholesterol level of 177.2 mg/dL, with an average HDL of 50.07 mg/dL and LDL of 107.14 mg/dL. Triglyceride levels exhibit a broad range, with a mean of 166.62 mg/dL, suggesting variations in lipid metabolism.
Inflammatory and liver function markers, including hs-CRP (2.52 mg/L), IL-6 (3.46 pg/mL), and liver enzymes (AST, ALT, GGT), provide insights into systemic inflammation and hepatic status. Kidney function, assessed through creatinine (0.775 mg/dL) and eGFR (93.92 mL/min/1.73 m2), indicates preserved renal function in most participants. Additionally, microbiome-related factors such as gut pH (6.57), total body water (47.43%), and visceral fat (10.1) further contribute to understanding metabolic health. These findings collectively offer a detailed snapshot of the cohort’s metabolic profile and serve as a foundation for further analysis regarding microbiota and diabetes interactions.
The cohort analysis highlights a strong association between obesity-related parameters and metabolic dysfunction. Individuals classified as overweight or obese (BMI > 25 kg/m2) exhibited higher levels of fasting blood glucose (mean 135.77 mg/dL) and HbA1c (mean 6.58%), indicating a higher prevalence of glucose dysregulation and potential insulin resistance. Furthermore, lipid profile abnormalities were evident, with increased LDL cholesterol (107.14 mg/dL) and triglycerides (166.62 mg/dL) in participants with an elevated BMI and abdominal circumference, suggesting a link between obesity and dyslipidemia.
Inflammatory markers also showed notable trends. Higher hs-CRP (mean 2.52 mg/L) and IL-6 (mean 3.46 pg/mL) levels were observed in individuals with greater visceral fat accumulation, supporting the role of chronic low-grade inflammation in metabolic syndrome. Additionally, liver function markers, including ALT and GGT, demonstrated mild elevations in those with obesity, indicating potential hepatic steatosis or metabolic liver dysfunction.
These correlations reinforce the well-established interplay between excess adiposity, systemic inflammation, and metabolic disturbances. The findings suggest that obesity-driven metabolic changes contribute to increased cardiovascular and diabetes risk, highlighting the need for targeted lifestyle interventions to mitigate these effects. Future analyses integrating gut microbiota composition may further elucidate the mechanistic pathways linking obesity, inflammation, and metabolic disease.
2.2. Microbiota Composition
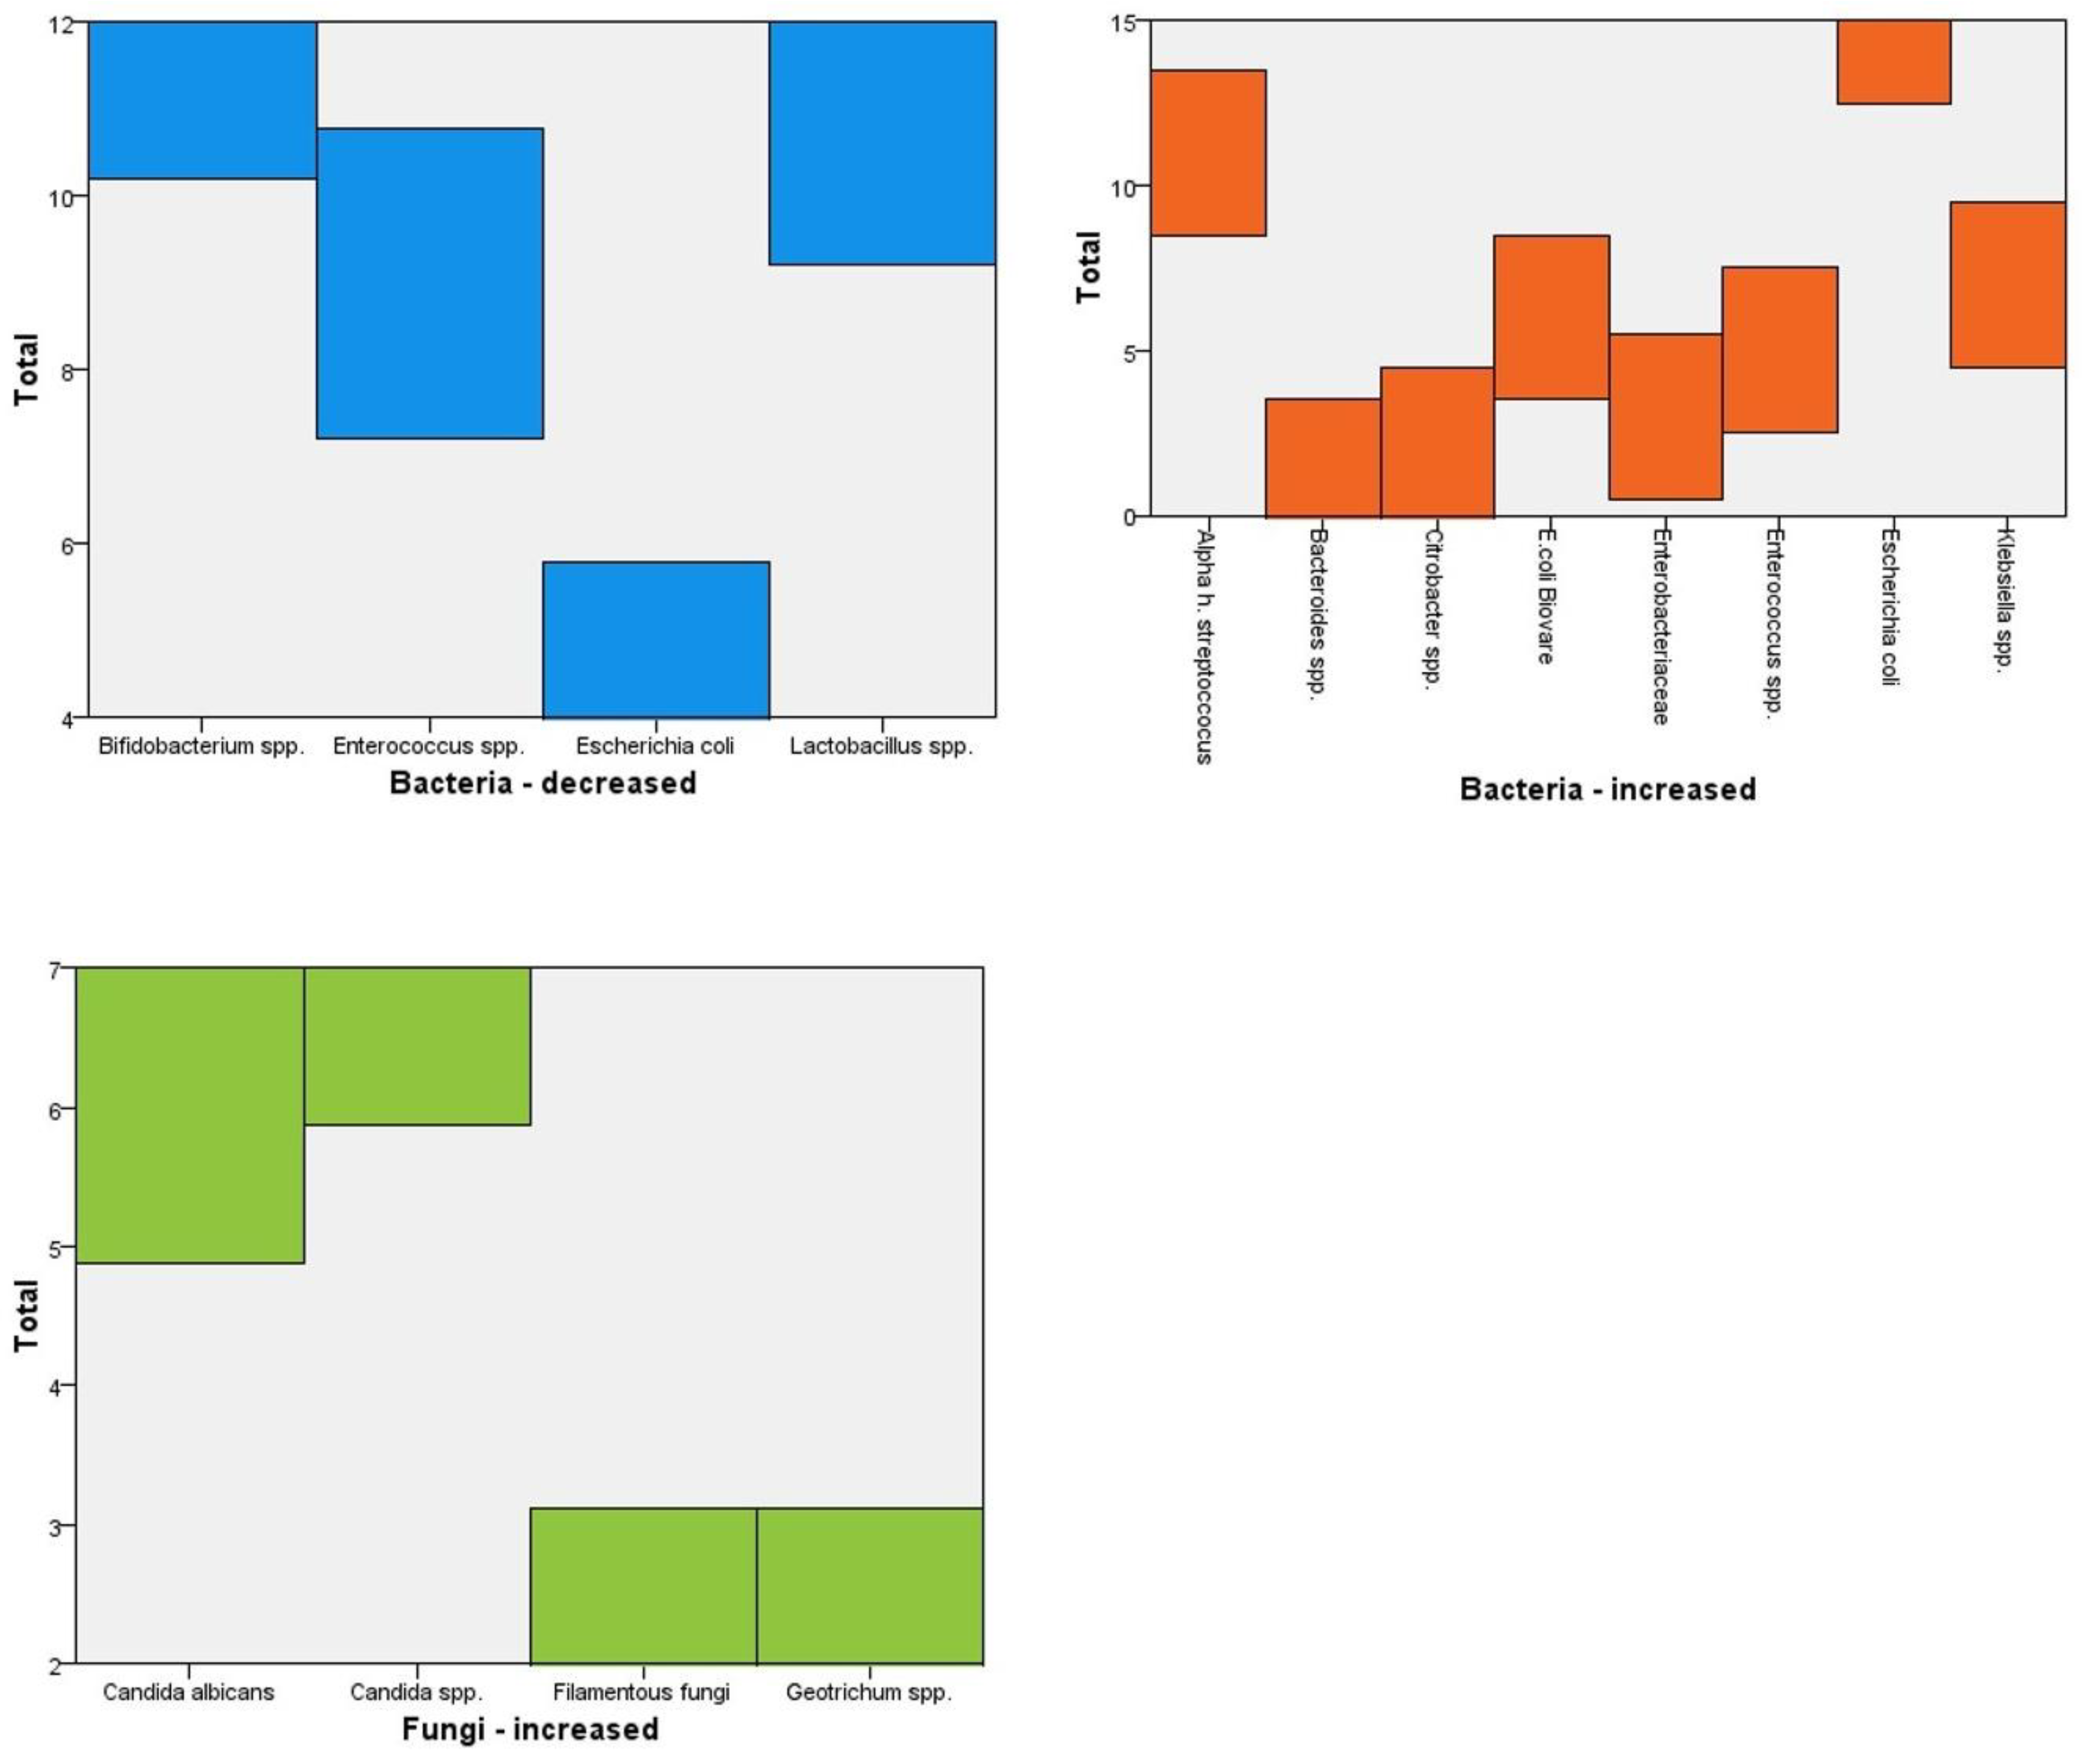
Table 2 below presents an analysis of gut microbiota composition in the study population and reveals significant variations in bacterial and fungal species, highlighting potential dysbiosis patterns. The increase or decrease in bacterial taxa was determined relative to the cohort’s median abundance and in comparison to reference datasets of healthy individuals from the published literature.
Among the bacteria with reduced presence, Bifidobacterium spp. (12 cases) and Lactobacillus spp. (11 cases) were the most frequently diminished, both of which play crucial roles in gut health, metabolic regulation, and immune modulation. The decreased presence of these beneficial bacteria suggests potential disruptions in gut homeostasis, which may contribute to metabolic dysfunction, inflammation, and increased susceptibility to gastrointestinal disorders. Enterococcus spp. and Escherichia coli were also reduced in nine and four cases, respectively, indicating imbalances that could affect gut barrier integrity and microbial diversity.
Conversely, several bacterial species exhibited increased prevalence, notably Escherichia coli (fifteen cases), Alpha-hemolytic Streptococcus (eleven cases), and Klebsiella spp. (seven cases). The overgrowth of E. coli and Klebsiella spp. is concerning, as both are known opportunistic pathogens associated with gut inflammation and metabolic disturbances. Additionally, Enterobacteriaceae (three cases) and Beta-hemolytic Streptococcus (two cases) were found in higher numbers, further indicating a shift toward a more inflammatory microbial environment.
As it can be seen in
Figure 2, fungal overgrowth was also observed, with
Candida spp. (seven cases) and
Candida albicans (six cases) being the most prevalent. These fungi, particularly
C. albicans, are commonly linked to gut dysbiosis, metabolic stress, and immune dysregulation. The presence of
Geotrichum spp. and
Filamentous fungi (2 cases each) suggests additional alterations in fungal composition, which could impact host metabolism and contribute to systemic inflammation. These microbial imbalances, characterized by reduced beneficial bacteria and increased opportunistic pathogens and fungi, may play a key role in metabolic disorders [
17]. Further investigations are needed to explore the associations between gut dysbiosis, obesity, and diabetes, as well as the potential implications for therapeutic interventions targeting microbiota restoration [
18].
The top-left graph illustrates the decreased prevalence of beneficial bacteria, with
Bifidobacterium spp. (12 cases) and
Lactobacillus spp. (11 cases) showing significant reductions. These bacteria play a crucial role in gut health, metabolic regulation, and immune homeostasis, and their depletion may contribute to metabolic disorders and systemic inflammation. The top-right graph showcases the increased abundance of potentially pathogenic bacteria, including
Escherichia coli (fifteen cases),
Klebsiella spp. (seven cases), and
Enterobacteriaceae (three cases). The overgrowth of these bacteria is often linked to gut dysbiosis, inflammation, and metabolic disturbances, particularly in conditions such as obesity and diabetes. The bottom graph highlights fungal overrepresentation, with
Candida spp. (seven cases) and
Candida albicans (six cases) being the most prevalent. These fungi are commonly associated with gut microbiota imbalances and have been implicated in inflammatory and metabolic dysfunctions [
19]. Collectively, the data indicate a dysbiotic gut environment characterized by reduced beneficial bacteria, increased opportunistic pathogens, and fungal overgrowth, which may contribute to metabolic syndrome, insulin resistance, and systemic inflammation [
20].
2.3. Dietary Patterns
Table 3 shows the various food intake patterns of the participants of this study.
Fruits and vegetables are consumed daily by the majority of participants (24 out of 30), indicating a strong adherence to plant-based nutrition, which is beneficial for metabolic health and gut microbiota diversity. Animal products such as meat are also a frequent component of the diet, with 20 participants consuming them daily and an additional 10 individuals consuming them 3–4 times per week, suggesting a relatively high intake of protein-rich foods. Fish and seafood, on the other hand, are rarely consumed, with 11 participants almost never consuming them and 19 reporting intake only 1–2 times per week, potentially limiting the benefits of omega-3 fatty acids for cardiovascular and metabolic health. Eggs and dairy products show a balanced distribution, with twenty participants consuming them 3–4 times per week and eight consuming them daily, reflecting their role as a staple protein source. These dietary patterns may have implications for metabolic outcomes, particularly in relation to lipid metabolism, inflammation, and microbiota composition. The low consumption of fish may indicate a reduced intake of anti-inflammatory nutrients, while the high intake of animal products could contribute to metabolic imbalances, especially in individuals with existing metabolic dysfunctions [
21]. Further analysis is needed to assess how these dietary habits correlate with microbiota composition and metabolic health markers in the studied population [
22].
Figure 3 highlights that the majority of participants consume fruits and vegetables daily, reinforcing a strong adherence to plant-based nutrition.
Animal products are also a significant component of the diet, with most individuals consuming them either daily or 3–4 times per week, suggesting a preference for high-protein sources. However, fish and seafood consumption is relatively low, with most participants consuming them only 1–2 times per week or almost never, indicating a potential deficiency in omega-3 fatty acids, which are essential for cardiovascular and metabolic health.
Eggs and dairy show a more balanced distribution, with participants incorporating them into their diet 3–4 times per week or daily. These dietary patterns may influence metabolic outcomes, particularly lipid profiles and inflammation levels, as a high intake of animal products alongside low fish consumption could contribute to an unfavorable fatty acid balance [
23]. This distribution underscores the importance of dietary diversity in maintaining gut microbiota stability and optimizing metabolic health [
24].
2.4. Microbiome and HbA1C Levels
Table 4 shows the increase or decrease in specific bacterial taxa, which was determined in relation to the median abundance within subgroups stratified by HbA1c levels.
Individuals with HbA1C < 6% (well-controlled glucose levels) exhibit a mean FBG of 120.8 mg/dL and a microbiome pH of 6.5, indicating a relatively stable gut environment. In this group, there is a decrease in beneficial bacteria such as Enterococcus spp. and Bifidobacterium spp., while potentially pathogenic bacteria, including Enterobacteriaceae, Klebsiella spp., and Streptococcus species, are increased. Furthermore, fungal overgrowth is evident, with Candida spp., Candida albicans, and Filamentous fungi being present, suggesting a possible link between fungal proliferation and metabolic health.
As HbA1C levels increase, metabolic disturbances become more pronounced. Individuals in the 6.1–6.5% HbA1C range show a higher mean FBG (132.07 mg/dL) and a slightly more alkaline microbiome pH (6.76). This group experiences a more extensive loss of beneficial bacteria, including
Lactobacillus spp., in addition to those already decreased in the lower HbA1C group. Notably, an increased presence of
Proteus spp. is observed, along with a wider spectrum of fungal species, including
Geotrichum spp. Individuals with HbA1C > 6.6% demonstrate the highest FBG levels (146 mg/dL) and a more acidic microbiome (pH 6.37), potentially reflecting dysbiosis and metabolic dysfunction. The pattern of microbial imbalance remains consistent, with a further decline in beneficial bacteria, while opportunistic bacteria and fungal overgrowth persist, reinforcing the hypothesis that gut dysbiosis plays a crucial role in glycemic control [
25].
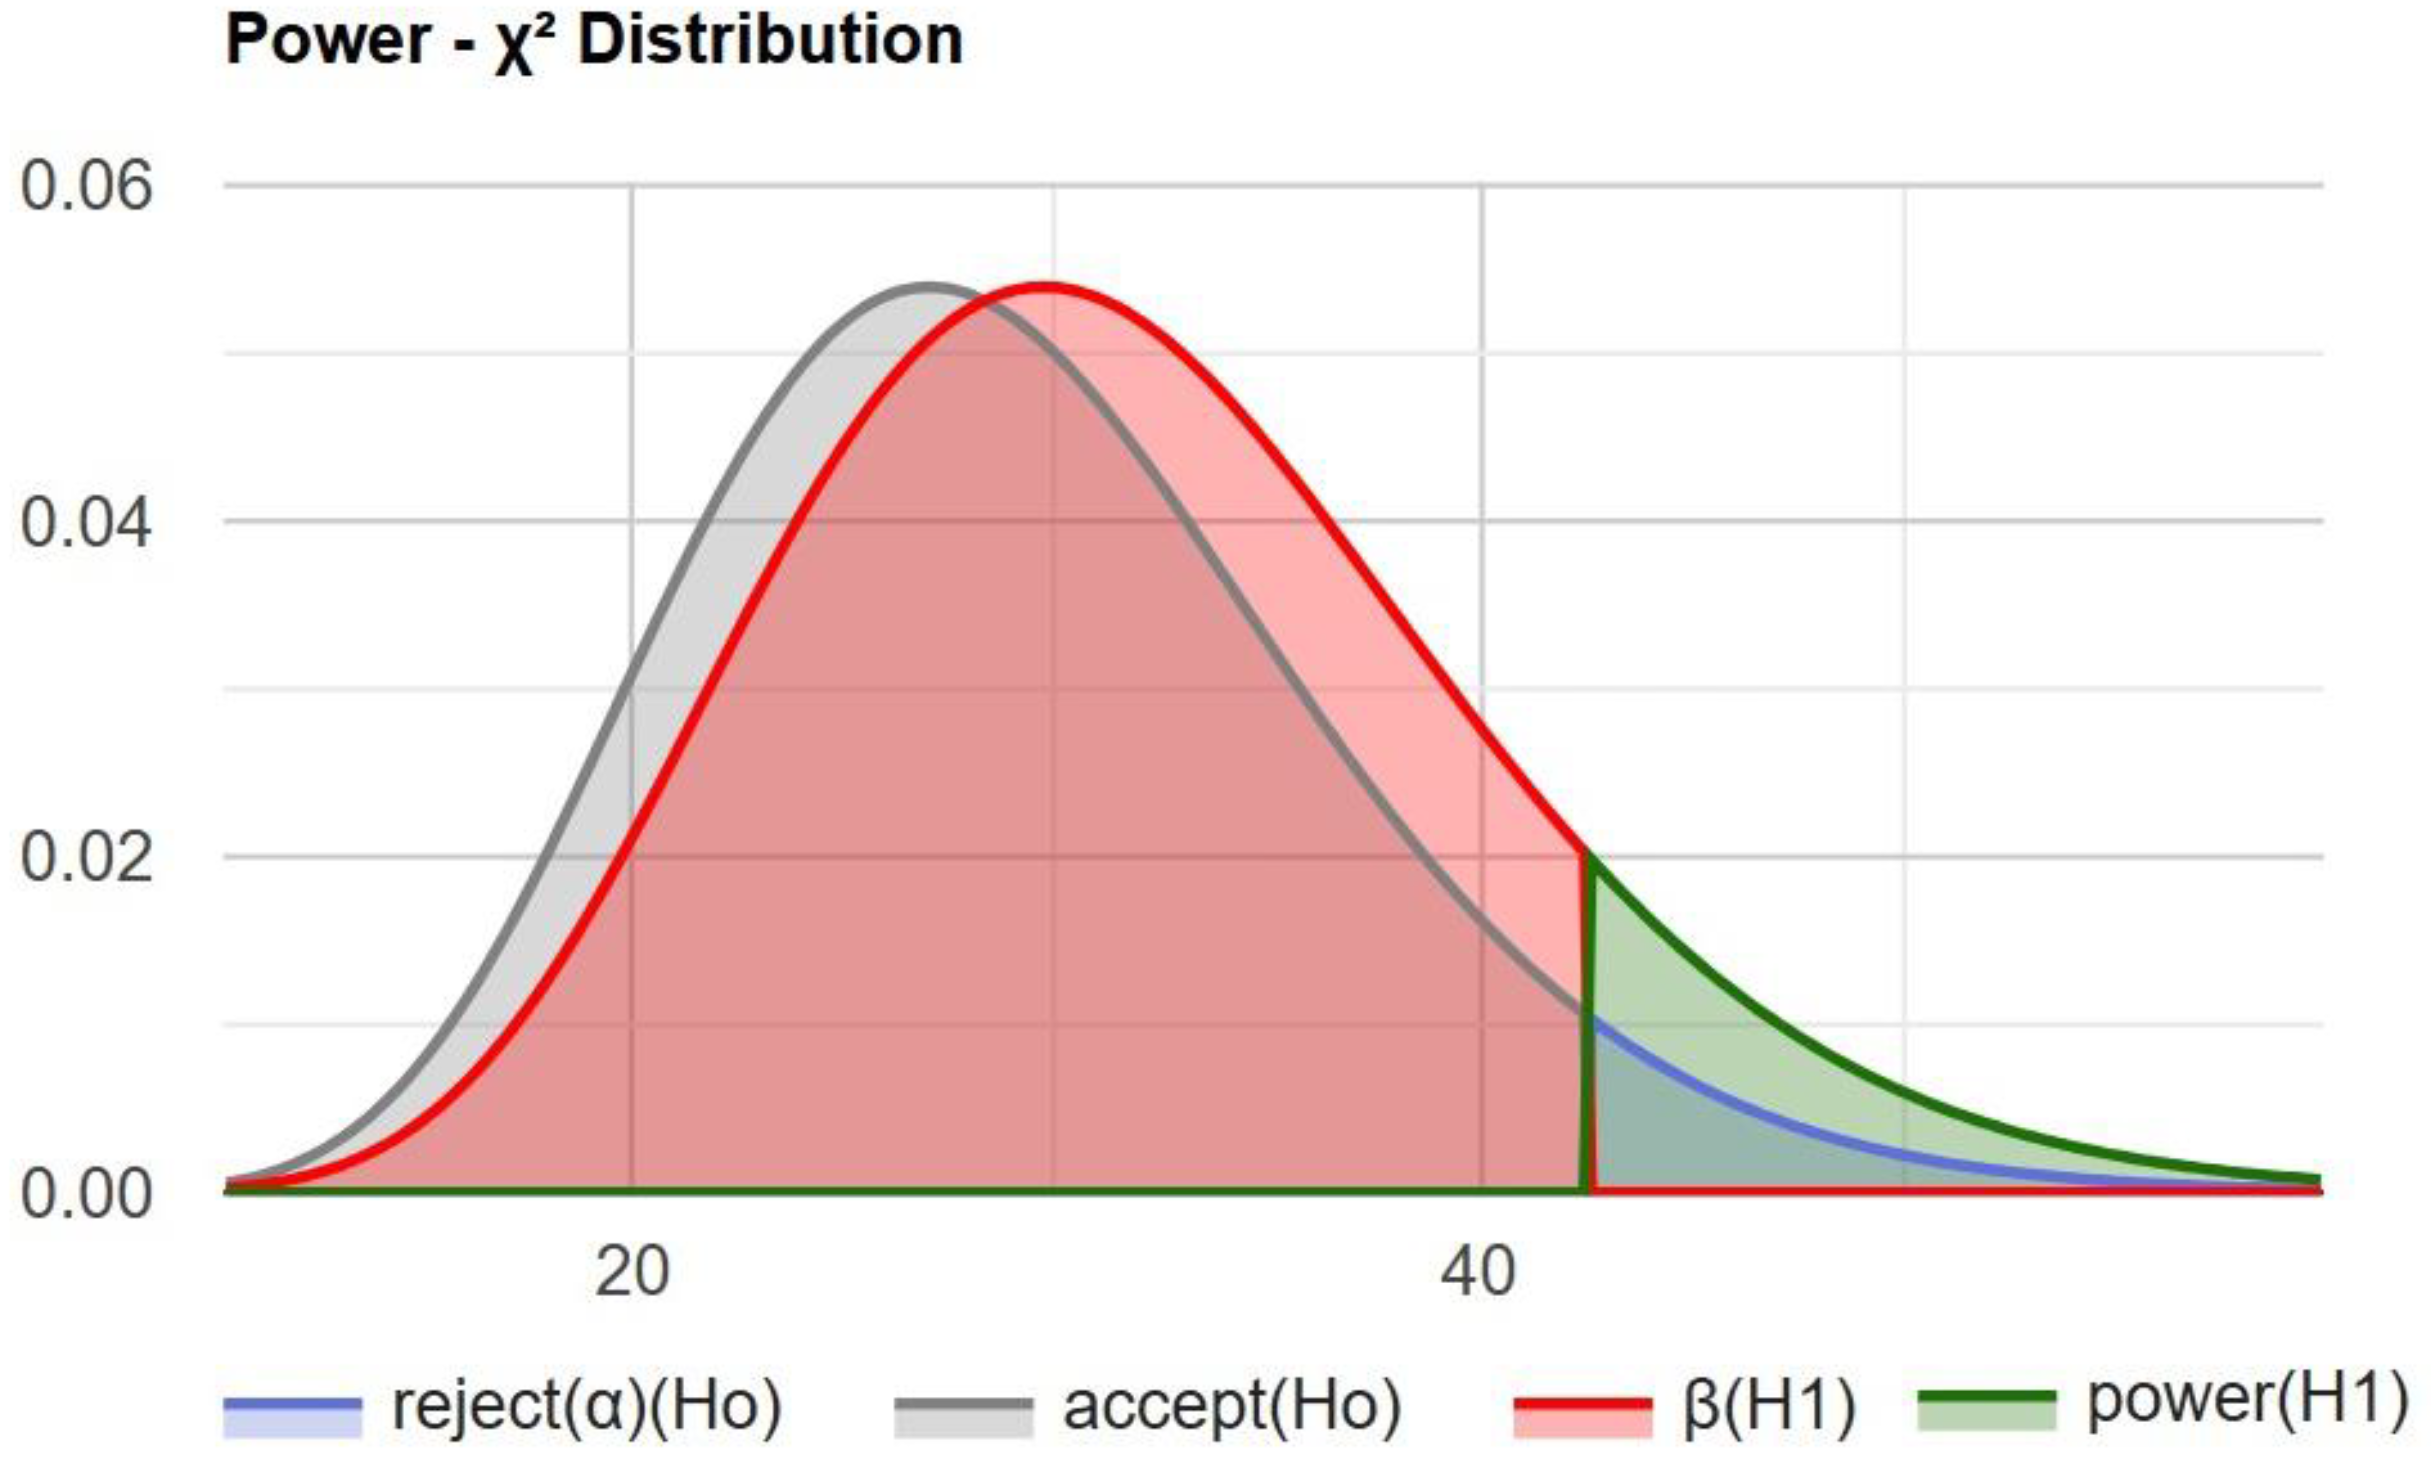
Using a chi-squared statistical power calculator, we determined the statistical power of this study (
Figure 4).
The test power of 0.107781 (approximately 10.8%) indicates a low probability of correctly rejecting the null hypothesis when the alternative hypothesis is true.
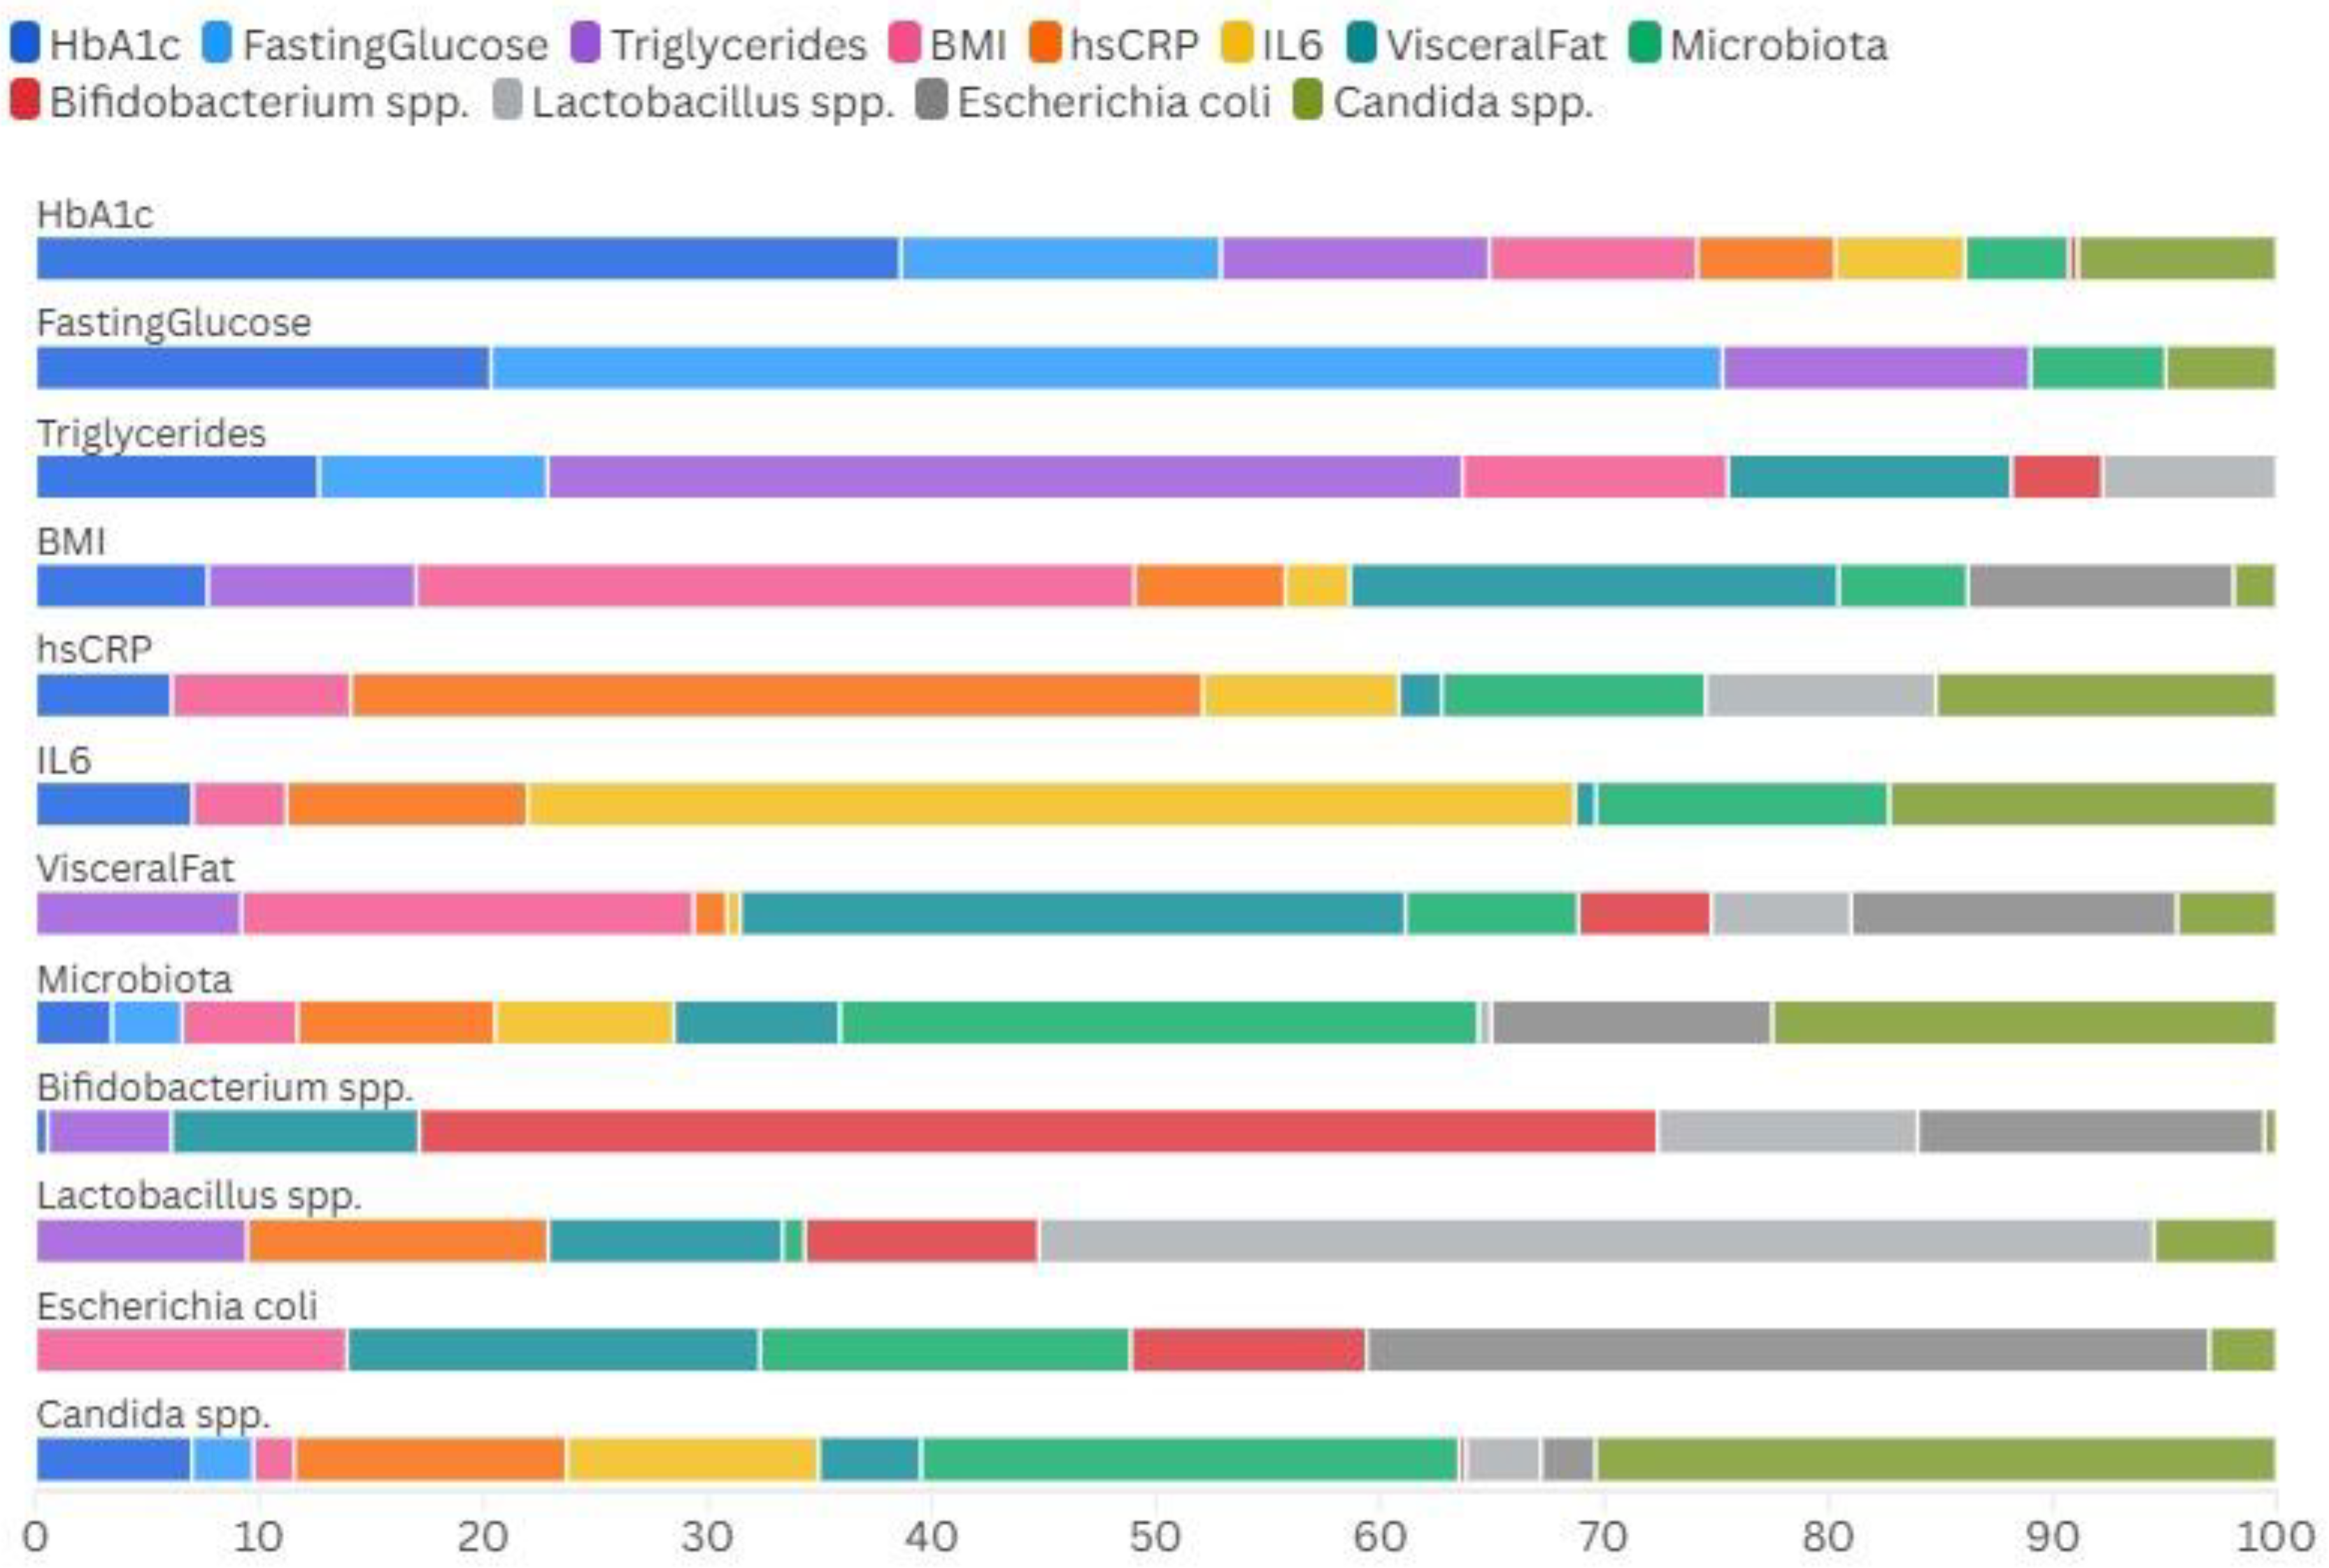
Table 5 shows the Spearman correlations between the gut mictobiota and inflammatory markers.
The Spearman correlation analysis incorporating individual microbial species reveals distinct associations with metabolic parameters in patients with T2DM. Escherichia coli demonstrates a moderate negative correlation with fasting glucose (ρ = −0.32), but a positive correlation with BMI (ρ = 0.37), suggesting its involvement in metabolic dysregulation. Candida spp. shows a moderate positive correlation with hs-CRP (ρ = 0.40), reinforcing its potential role in promoting systemic inflammation. Lactobacillus spp. displays a weak inverse relationship with fasting glucose (ρ = −0.24), which may reflect a protective effect on glycemic control, while Bifidobacterium spp. exhibits minimal correlations with the investigated parameters.
In
Figure 5 we show the relative proportions and interactions among the various metabolic parameters and microbial species across our cohort of patients.
It can be seen that pro-inflammatory species like Candida spp. and Escherichia coli are more prevalent in association with markers of inflammation (hs-CRP, IL-6) and metabolic dysfunction (BMI, triglycerides), while beneficial bacteria such as Bifidobacterium spp. and Lactobacillus spp. appear more aligned with balanced microbiota profiles and potentially protective metabolic states.
3. Materials and Methods
3.1. Study Cohort
This single-center study was conducted to investigate the relationship between gut microbiota, lifestyle factors, and metabolic health. The dataset comprised clinical and demographic information collected from patients attending a specialized metabolic health center. Key variables included age, gender, smoking status, dietary patterns, living environment (urban or rural), body composition metrics, and metabolic markers such as glucose levels, HbA1c and lipid profiles. Additionally, microbiota profiles were assessed through stool sample analyses.
3.2. Inclusion and Exclusion Criteria
Inclusion criteria: We designed this to capture a representative sample of adults aged 18 to 75 years who consented to participate in the study. Participants were required to have no prior history of severe gastrointestinal diseases, malignancies, or recent antibiotic use, as these could significantly alter microbiota composition. All the patients included in this study were diagnosed with type 2 diabetes (T2D) in the last 10 years and treated with metformin in different dosages (500–2000 mg/day).
Exclusion criteria: We excluded participants based on the presence of chronic inflammatory conditions unrelated to metabolic health, recent hospitalization, pregnancy, or ongoing use of immunosuppressive drugs. Individuals with incomplete datasets or poor-quality microbiota samples were also excluded to ensure analytical accuracy.
3.3. Microbiota Analysis and Statistics
Biochemical analysis: Blood samples were collected after an overnight fast and analyzed using an automated biochemistry analyzer, Cobas Integra 400 Plus (manufactured by Roche Diagnostics, Rotkreuz, Switzerland), to measure fasting blood glucose, HbA1c, lipid profiles (total cholesterol, HDL, LDL, and triglycerides), renal function markers (urea and creatinine), and inflammatory markers (hs-CRP and IL-6). Liver enzymes (AST, ALT, and GGT) were also assessed.
Body composition and resting metabolic rate (RMR): Body composition, including total body water, visceral fat, muscle mass, and metabolic age, was measured using bioelectrical impedance analysis (BIA) with the ANITA MC-780MA-N analyzer, and the basal metabolic rate (BMR), an indicator of resting metabolic rate (RMR), was automatically calculated through the device’s software. The basal metabolic rate (BMR), an indicator of resting metabolic rate (RMR), was automatically calculated with the device based on body composition parameters. Participants were instructed to fast and avoid physical activity for at least 12 h before the measurement to ensure accuracy.
Microbiota assessment: Stool samples were collected in sterile containers and immediately stored at −80 °C until analysis. Microbiota composition was evaluated using 16S rRNA gene sequencing. DNA extraction was performed using the QIAamp DNA Stool Mini Kit (Qiagen, Hilden, Germany), followed by PCR amplification and sequencing using the Illumina MiSeq platform (
https://www.illumina.com/systems/sequencing-platforms/miseq.html, accessed on 11 December 2024). The analysis was conducted at IMD LABOR Berlin (
https://www.imd-berlin.de/, accessed on 7 January 2025), an accredited laboratory in Germany, using a simplified quantitative or PCR-based approach. The resulting data were processed with the QIIME2 pipeline (
https://qiime2.org/, accessed on 7 January 2025) to identify bacterial species. Taxonomic assignment in the QIIME2 pipeline was performed using the SILVA database (
https://www.arb-silva.de/, accessed on 12 January 2025) for bacterial 16S rRNA and the UNITE database (
https://unite.ut.ee/, accessed on 14 January 2025) for fungal ITS sequences, as follows:
- -
Immunomodulatory bacteria: Enterococcus spp. and Escherichia coli.
- -
Carbohydrate-metabolizing bacteria: Bacteroides spp., Bifidobacterium spp., and Lactobacillus spp.
- -
Protein-metabolizing bacteria: Enterobacter spp., E. coli biovars, Citrobacter spp., Klebsiella spp., Serratia spp., Proteus spp., and Pseudomonas spp.
- -
Other intestinal bacteria: Alpha-hemolytic streptococci and Beta-hemolytic streptococci.
- -
Fungal species (mycology culture): Candida spp., Candida albicans, Geotrichum spp., and filamentous fungi (molds).
The laboratory provided reference values indicating upper limits for potentially pathogenic bacteria and lower limits for beneficial bacteria (Bifidobacterium spp. and Lactobacillus spp.). Microbiome analysis and interpretation were conducted based on these reference thresholds.
Additionally, stool pH was assessed as part of the microbiome evaluation.
Statistical analyses were performed using SPSS version 29. Descriptive statistics were used to summarize demographic and clinical characteristics. The relationships between categorical variables, such as smoking status and dietary patterns, and continuous outcomes like body composition and metabolic markers, were analyzed using chi-square tests and t-tests.
Null Hypothesis (H0):
There is no significant association between gut microbiota composition and metabolic outcomes (HbA1c, fasting blood glucose, lipid profiles, inflammatory markers, and body composition) in patients with T2D.
Alternative Hypothesis (H1):
There is a significant association between gut microbiota composition and metabolic outcomes in patients with T2D, suggesting that microbiota diversity and specific bacterial/fungal populations influence metabolic health.
Correlation analysis was conducted to evaluate associations between microbiota diversity and metabolic parameters. Multivariable regression models were employed to adjust for potential confounders, including age, gender, and living environment.
4. Discussions
This study provides compelling evidence of the intricate relationship between gut microbiota composition, metabolic markers, and diabetes status. Our findings indicate that individuals with higher HbA1C and FBG levels exhibit notable gut dysbiosis, characterized by a decrease in beneficial bacteria such as
Bifidobacterium spp. and
Lactobacillus spp., alongside an increase in potentially pathogenic bacteria like
Escherichia coli,
Klebsiella spp., and
Enterobacteriaceae. Additionally, fungal overgrowth, particularly
Candida spp., was more pronounced in individuals with poor glycemic control. These observations align with previous studies, suggesting that gut microbiota alterations contribute to metabolic dysfunction and insulin resistance [
26,
27]. The association between microbial imbalance and glycemic dysregulation underscores the potential role of the gut microbiota as both a biomarker and a therapeutic target for diabetes management [
28,
29,
30].
The findings of this study align with previous research on gut microbiota and metabolic disorders. Barrientos-Duran et al. conducted a landmark study showing that patients with type 2 diabetes have a distinct gut microbiota composition, with a reduction in butyrate-producing bacteria and an increase in opportunistic pathogens [
31]. Similarly, Dinan et al. reported that microbial dysbiosis in diabetes is characterized by an overgrowth of Gram-negative bacteria, which can trigger systemic inflammation and insulin resistance via lipopolysaccharide-induced endotoxemia [
32]. Our study further supports these findings, demonstrating that patients with higher HbA1C levels have increased
E. coli and
Klebsiella spp., bacteria known for their pro-inflammatory properties [
33,
34,
35]. Furthermore, Martin-Gallausiaux et al. highlighted that dietary interventions targeting gut microbiota can lead to improvements in metabolic parameters, reinforcing the role of diet in modulating microbiota composition [
36]. This is consistent with our observation that dietary patterns, particularly low fish intake and high animal product consumption, may contribute to gut microbiota shifts that influence metabolic health [
37,
38,
39,
40,
41].
From a public health perspective, the implications of these findings are significant. The high prevalence of gut dysbiosis in individuals with impaired glucose metabolism suggests that microbiota-targeted interventions, such as probiotics, prebiotics, and dietary modifications, could serve as preventive or adjunctive therapies for diabetes management [
42]. Recent clinical trials, such as those conducted by Vaure et al., have shown that increasing dietary fiber intake can reshape gut microbiota and improve glycemic control in diabetic patients [
43]. Additionally, studies on fecal microbiota transplantation (FMT) suggest that transferring a healthy microbiota profile to individuals with metabolic syndrome may enhance insulin sensitivity and reduce inflammation [
44,
45,
46]. These interventions emphasize the need for personalized microbiome-based therapies to combat metabolic disorders [
47].
Future research should focus on longitudinal studies to establish causal relationships between microbiota composition and diabetes progression [
48]. Additionally, interventional studies investigating the efficacy of dietary modifications, probiotics, and microbiome-targeted therapies in improving glycemic control are warranted [
49,
50,
51]. Given the observed associations between fungal overgrowth and metabolic disturbances, future work should also explore the role of microbiota in diabetes pathogenesis, an area that remains largely underexplored [
52].
In conclusion, our findings reinforce the critical role of gut microbiota in metabolic health and highlight potential avenues for microbiome-based interventions in diabetes prevention and management. Integrating microbiome assessments into routine clinical practice may enable early identification of at-risk individuals and facilitate personalized therapeutic strategies aimed at restoring microbial balance and improving metabolic outcomes.
5. Limitations
Despite the significant findings of this study, several limitations must be acknowledged. First, the study is a single-center investigation, which may limit the generalizability of the results to broader populations. The cohort size is relatively small (n = 30), and while the statistical analyses provide valuable insights, larger multi-center studies are needed to confirm these findings and improve external validity.
Second, the cross-sectional design of this study prevents the establishment of causality. While associations between gut microbiota composition, metabolic markers, and diabetes risk were identified, it remains unclear whether microbiota alterations contribute directly to glycemic dysregulation or if they result from existing metabolic disturbances. Longitudinal studies are required to clarify these relationships and determine whether modifying gut microbiota can lead to sustained metabolic improvements.
We will also add dietary assessment and lifestyle factors as shortcomings. Although dietary intake was considered in the analysis, detailed food frequency questionnaires and precise nutrient quantification were not included, which could have provided a more comprehensive understanding of how diet influences microbiota and metabolic health. Similarly, physical activity levels and medication use were not extensively analyzed, both of which can significantly impact metabolic outcomes and gut microbiota composition.
Moreover, another limitation of this study is the potential confounding effect of diabetes oral medications, particularly metformin, on microbiota composition. Previous research has demonstrated that metformin treatment can alter the gut microbiota by increasing populations of beneficial bacteria, such as Bifidobacterium and Akkermansia, while also promoting the growth of potentially harmful bacteria like Escherichia coli and certain Firmicutes. These medication-induced changes may obscure the direct associations between microbiota composition and the primary variables under investigation, potentially influencing the interpretation of our results.
Additionally, microbiota analysis focused on bacterial and fungal species but did not include functional metagenomics or short-chain fatty acid profiling, which would have provided deeper insights into the metabolic activity of the microbiota and its role in glucose homeostasis. Advanced sequencing techniques, such as shotgun metagenomics, could further elucidate microbial functional pathways involved in metabolic regulation.
Lastly, potential confounding factors, such as antibiotic use, probiotics, and undiagnosed gastrointestinal conditions, were not fully controlled, which may have influenced microbiota composition. Future research should incorporate more controlled study designs to address these limitations and refine the understanding of the gut–metabolism relationship.
6. Conclusions
This study highlights the significant interplay between gut microbiota composition, metabolic markers, and diabetes risk. The results indicate that individuals with higher HbA1C and fasting blood glucose levels exhibit notable gut dysbiosis, characterized by a reduction in beneficial bacteria (Bifidobacterium spp. and Lactobacillus spp.) and an overgrowth of opportunistic pathogens (Escherichia coli, Klebsiella spp., and Enterobacteriaceae). Additionally, fungal overgrowth, particularly Candida spp. and Candida albicans, was more pronounced in individuals with poor glycemic control. These findings suggest that gut microbiota imbalances may play a crucial role in metabolic dysfunction and insulin resistance.
The relationship between microbiota composition and metabolic markers further underscores the importance of diet and lifestyle factors. The study identified that individuals with a diet high in animal products and low in fish consumption exhibited more pronounced gut dysbiosis, potentially contributing to an inflammatory metabolic environment. Additionally, differences in microbiome pH suggest that alterations in gut acidity may correlate with microbial shifts and glucose regulation.
From a clinical perspective, these findings reinforce the potential role of microbiota-targeted interventions in diabetes prevention and management. Strategies such as probiotic and prebiotic supplementation, dietary modifications, and gut microbiome assessments may offer new avenues for improving glycemic control. Moreover, the association between fungal overgrowth and metabolic disturbances highlights the need for further exploration of the gut mycobiome in diabetes research.
Future studies should focus on longitudinal investigations and interventional trials to determine whether modifying microbiota composition can lead to sustained metabolic improvements.
Author Contributions
Conceptualization, N.M.M., V.J. and A.P.S.; methodology, N.M.M., A.N.T. and A.P.S.; software, N.M.M., C.G., R.E.D.M., V.J., S.I., A.C., A.N.T. and A.P.S.; validation, N.M.M., C.G., V.J., S.I., A.C., A.N.T. and A.P.S.; formal analysis S.I., A.C. and A.N.T.; investigation, N.M.M., S.I., A.C. and A.N.T.; resources, N.M.M., C.G. and V.J.; data curation, S.I. and A.C.; writing—original draft preparation, N.M.M., C.G., R.E.D.M., V.J., S.I., A.C., A.N.T. and A.P.S.; writing—review and editing, N.M.M., C.G., V.J., S.I., A.C., R.E.D.M., A.N.T. and A.P.S.; visualization, V.J., S.I., R.E.D.M., A.C. and A.N.T.; supervision, N.M.M.; project administration, N.M.M., C.G. and V.J. All authors have read and agreed to the published version of the manuscript.
Funding
This research received no external funding.
Institutional Review Board Statement
The study was conducted according to the guidelines of the Declaration of Helsinki and approved by the Institutional Review Board of “Carol Davila” University of Medicine and Pharmacy, Bucharest, protocol code 139/13.07.2023.
Informed Consent Statement
Informed consent was obtained from all subjects involved in the study.
Data Availability Statement
The raw data supporting the conclusions of this article will be made available by the authors on request.
Conflicts of Interest
The authors declare no conflicts of interest.
References
- Beydag-Tasöz, B.S.; Yennek, S.; Grapin-Botton, A. Towards a Better Understanding of Diabetes Mellitus Using Organoid Models. Nat. Rev. Endocrinol. 2023, 19, 232–248. [Google Scholar] [CrossRef] [PubMed]
- American Diabetes Association. Diagnosis and Classification of Diabetes Mellitus. Diabetes Care 2011, 34, S62–S69. [Google Scholar] [CrossRef] [PubMed]
- Crasto, W.; Patel, V.; Davies, M.J.; Khunti, K. Prevention of Microvascular Complications of Diabetes. Endocrinol. Metab. Clin. N. Am. 2021, 50, 431–455. [Google Scholar] [CrossRef]
- Fayfman, M.; Pasquel, F.J.; Umpierrez, G.E. Management of Hyperglycemic Crises. Med. Clin. N. Am. 2017, 101, 587–606. [Google Scholar] [CrossRef]
- The Emerging Risk Factors Collaboration. Diabetes Mellitus, Fasting Blood Glucose Concentration, and Risk of Vascular Disease: A Collaborative Meta-Analysis of 102 Prospective Studies. Lancet 2010, 375, 2215–2222. [Google Scholar] [CrossRef]
- Chong, K.; Chang, J.K.; Chuang, L. Recent Advances in the Treatment of Type 2 Diabetes Mellitus Using New Drug Therapies. Kaohsiung J. Med. Sci. 2024, 40, 212–220. [Google Scholar] [CrossRef]
- Gajewska, A.; Wasiak, J.; Sapeda, N.; Młynarska, E.; Rysz, J.; Franczyk, B. SGLT2 Inhibitors in Kidney Diseases—A Narrative Review. Int. J. Mol. Sci. 2024, 25, 4959. [Google Scholar] [CrossRef]
- Scientific Image and Illustration Software|BioRender. Available online: https://www.biorender.com/ (accessed on 30 December 2024).
- Wu, Y.; Ding, Y.; Tanaka, Y.; Zhang, W. Risk Factors Contributing to Type 2 Diabetes and Recent Advances in the Treatment and Prevention. Int. J. Med. Sci. 2014, 11, 1185–1200. [Google Scholar] [CrossRef]
- Zhao, L.; Lou, H.; Peng, Y.; Chen, S.; Zhang, Y.; Li, X. Comprehensive Relationships between Gut Microbiome and Faecal Metabolome in Individuals with Type 2 Diabetes and Its Complications. Endocrine 2019, 66, 526–537. [Google Scholar] [CrossRef]
- Al Bander, Z.; Nitert, M.D.; Mousa, A.; Naderpoor, N. The Gut Microbiota and Inflammation: An Overview. Int. J. Environ. Res. Public Health 2020, 17, 7618. [Google Scholar] [CrossRef]
- Zmora, N.; Suez, J.; Elinav, E. You Are What You Eat: Diet, Health and the Gut Microbiota. Nat. Rev. Gastroenterol. Hepatol. 2019, 16, 35–56. [Google Scholar] [CrossRef] [PubMed]
- Pantazi, A.C.; Balasa, A.L.; Mihai, C.M.; Chisnoiu, T.; Lupu, V.V.; Kassim, M.A.K.; Mihai, L.; Frecus, C.E.; Chirila, S.I.; Lupu, A.; et al. Development of Gut Microbiota in the First 1000 Days after Birth and Potential Interventions. Nutrients 2023, 15, 3647. [Google Scholar] [CrossRef] [PubMed]
- Li, Z.; Chen, Y.; Ke, H. Investigating the Causal Relationship between Gut Microbiota and Crohn’s Disease: A Mendelian Randomization Study. Gastroenterology 2024, 166, 354–355. [Google Scholar] [CrossRef]
- Rahman, M.M.; Islam, F.; Or-Rashid, M.H.; Mamun, A.A.; Rahaman, M.S.; Islam, M.M.; Meem, A.F.K.; Sutradhar, P.R.; Mitra, S.; Mimi, A.A.; et al. The Gut Microbiota (Microbiome) in Cardiovascular Disease and Its Therapeutic Regulation. Front. Cell. Infect. Microbiol. 2022, 12, 903570. [Google Scholar] [CrossRef]
- Yang, T.; Richards, E.M.; Pepine, C.J.; Raizada, M.K. The Gut Microbiota and the Brain–Gut–Kidney Axis in Hypertension and Chronic Kidney Disease. Nat. Rev. Nephrol. 2018, 14, 442–456. [Google Scholar] [CrossRef]
- Wasiak, J.; Gawlik-Kotelnicka, O. Intestinal Permeability and Its Significance in Psychiatric Disorders—A Narrative Review and Future Perspectives. Behav. Brain Res. 2023, 448, 114459. [Google Scholar] [CrossRef]
- Rinninella, E.; Raoul, P.; Cintoni, M.; Franceschi, F.; Miggiano, G.; Gasbarrini, A.; Mele, M. What Is the Healthy Gut Microbiota Composition? A Changing Ecosystem across Age, Environment, Diet, and Diseases. Microorganisms 2019, 7, 14. [Google Scholar] [CrossRef]
- Qin, J.; Li, R.; Raes, J.; Arumugam, M.; Burgdorf, K.S.; Manichanh, C.; Nielsen, T.; Pons, N.; Levenez, F.; Yamada, T.; et al. A Human Gut Microbial Gene Catalogue Established by Metagenomic Sequencing. Nature 2010, 464, 59–65. [Google Scholar] [CrossRef]
- Riedl, R.A.; Atkinson, S.N.; Burnett, C.M.L.; Grobe, J.L.; Kirby, J.R. The Gut Microbiome, Energy Homeostasis, and Implications for Hypertension. Curr. Hypertens. Rep. 2017, 19, 27. [Google Scholar] [CrossRef]
- Beam, A.; Clinger, E.; Hao, L. Effect of Diet and Dietary Components on the Composition of the Gut Microbiota. Nutrients 2021, 13, 2795. [Google Scholar] [CrossRef] [PubMed]
- McCallum, G.; Tropini, C. The Gut Microbiota and Its Biogeography. Nat. Rev. Microbiol. 2024, 22, 105–118. [Google Scholar] [CrossRef] [PubMed]
- El-Sayed, A.; Aleya, L.; Kamel, M. Microbiota’s Role in Health and Diseases. Environ. Sci. Pollut. Res. 2021, 28, 36967–36983. [Google Scholar] [CrossRef] [PubMed]
- Czarnik, W.; Fularski, P.; Gajewska, A.; Jakubowska, P.; Uszok, Z.; Młynarska, E.; Rysz, J.; Franczyk, B. The Role of Intestinal Microbiota and Diet as Modulating Factors in the Course of Alzheimer’s and Parkinson’s Diseases. Nutrients 2024, 16, 308. [Google Scholar] [CrossRef] [PubMed]
- Margolis, K.G.; Cryan, J.F.; Mayer, E.A. The Microbiota-Gut-Brain Axis: From Motility to Mood. Gastroenterology 2021, 160, 1486–1501. [Google Scholar] [CrossRef]
- Srikantha, P.; Mohajeri, M.H. The Possible Role of the Microbiota-Gut-Brain-Axis in Autism Spectrum Disorder. Int. J. Mol. Sci. 2019, 20, 2115. [Google Scholar] [CrossRef]
- Naik, S.S.; Ramphall, S.; Rijal, S.; Prakash, V.; Ekladios, H.; Mulayamkuzhiyil Saju, J.; Mandal, N.; Kham, N.I.; Shahid, R.; Venugopal, S. Association of Gut Microbial Dysbiosis and Hypertension: A Systematic Review. Cureus 2022, 14, e29927. [Google Scholar] [CrossRef]
- Leeming, E.R.; Johnson, A.J.; Spector, T.D.; Le Roy, C.I. Effect of Diet on the Gut Microbiota: Rethinking Intervention Duration. Nutrients 2019, 11, 2862. [Google Scholar] [CrossRef]
- Campaniello, D.; Corbo, M.R.; Sinigaglia, M.; Speranza, B.; Racioppo, A.; Altieri, C.; Bevilacqua, A. How Diet and Physical Activity Modulate Gut Microbiota: Evidence, and Perspectives. Nutrients 2022, 14, 2456. [Google Scholar] [CrossRef]
- Wu, G.D.; Chen, J.; Hoffmann, C.; Bittinger, K.; Chen, Y.-Y.; Keilbaugh, S.A.; Bewtra, M.; Knights, D.; Walters, W.A.; Knight, R.; et al. Linking Long-Term Dietary Patterns with Gut Microbial Enterotypes. Science 2011, 334, 105–108. [Google Scholar] [CrossRef]
- Barrientos-Durán, A.; Fuentes-López, A.; de Salazar, A.; Plaza-Díaz, J.; García, F. Reviewing the Composition of Vaginal Microbiota: Inclusion of Nutrition and Probiotic Factors in the Maintenance of Eubiosis. Nutrients 2020, 12, 419. [Google Scholar] [CrossRef]
- Dinan, T.G.; Cryan, J.F. The Impact of Gut Microbiota on Brain and Behaviour. Curr. Opin. Clin. Nutr. Metab. Care 2015, 18, 552–558. [Google Scholar] [CrossRef] [PubMed]
- McNeil, N.I. The Contribution of the Large Intestine to Energy Supplies in Man. Am. J. Clin. Nutr. 1984, 39, 338–342. [Google Scholar] [PubMed]
- Furness, J.B. The Enteric Nervous System and Neurogastroenterology. Nat. Rev. Gastroenterol. Hepatol. 2012, 9, 286–294. [Google Scholar] [CrossRef]
- Cavin, J.-B.; Cuddihey, H.; MacNaughton, W.K.; Sharkey, K.A. Acute Regulation of Intestinal Ion Transport and Permeability in Response to Luminal Nutrients: The Role of the Enteric Nervous System. Am. J. Physiol.-Gastrointest. Liver Physiol. 2020, 318, G254–G264. [Google Scholar] [CrossRef] [PubMed]
- Martin-Gallausiaux, C.; Marinelli, L.; Blottière, H.M.; Larraufie, P.; Lapaque, N. SCFA: Mechanisms and Functional Importance in the Gut. Proc. Nutr. Soc. 2021, 80, 37–49. [Google Scholar] [CrossRef]
- Dalile, B.; Van Oudenhove, L.; Vervliet, B.; Verbeke, K. The Role of Short-Chain Fatty Acids in Microbiota–Gut–Brain Communication. Nat. Rev. Gastroenterol. Hepatol. 2019, 16, 461–478. [Google Scholar] [CrossRef]
- Dicks, L.M.T. Gut Bacteria and Neurotransmitters. Microorganisms 2022, 10, 1838. [Google Scholar] [CrossRef]
- Rudzki, L.; Maes, M. The Microbiota-Gut-Immune-Glia (MGIG) Axis in Major Depression. Mol. Neurobiol. 2020, 57, 4269–4295. [Google Scholar] [CrossRef]
- Weiss, G.A.; Hennet, T. Mechanisms and Consequences of Intestinal Dysbiosis. Cell. Mol. Life Sci. 2017, 74, 2959–2977. [Google Scholar] [CrossRef]
- Bischoff, S.C.; Barbara, G.; Buurman, W.; Ockhuizen, T.; Schulzke, J.-D.; Serino, M.; Tilg, H.; Watson, A.; Wells, J.M. Intestinal Permeability—A New Target for Disease Prevention and Therapy. BMC Gastroenterol. 2014, 14, 189. [Google Scholar] [CrossRef]
- Kinashi, Y.; Hase, K. Partners in Leaky Gut Syndrome: Intestinal Dysbiosis and Autoimmunity. Front. Immunol. 2021, 12, 673708. [Google Scholar] [CrossRef] [PubMed]
- Vaure, C.; Liu, Y. A Comparative Review of Toll-Like Receptor 4 Expression and Functionality in Different Animal Species. Front. Immunol. 2014, 5, 96623. [Google Scholar] [CrossRef]
- Berkes, J. Intestinal Epithelial Responses to Enteric Pathogens: Effects on the Tight Junction Barrier, Ion Transport, and Inflammation. Gut 2003, 52, 439–451. [Google Scholar] [CrossRef]
- Mu, Q.; Kirby, J.; Reilly, C.M.; Luo, X.M. Leaky Gut as a Danger Signal for Autoimmune Diseases. Front. Immunol. 2017, 8, 269575. [Google Scholar] [CrossRef]
- Misiak, B.; Łoniewski, I.; Marlicz, W.; Frydecka, D.; Szulc, A.; Rudzki, L.; Samochowiec, J. The HPA Axis Dysregulation in Severe Mental Illness: Can We Shift the Blame to Gut Microbiota? Prog. Neuropsychopharmacol. Biol. Psychiatry 2020, 102, 109951. [Google Scholar] [CrossRef]
- Sharma, V.K.; Singh, T.G. Chronic Stress and Diabetes Mellitus: Interwoven Pathologies. Curr. Diabetes Rev. 2020, 16, 546–556. [Google Scholar]
- Daneman, R.; Prat, A. The Blood–Brain Barrier. Cold Spring Harb. Perspect. Biol. 2015, 7, a020412. [Google Scholar] [CrossRef]
- Kealy, J.; Greene, C.; Campbell, M. Blood-Brain Barrier Regulation in Psychiatric Disorders. Neurosci. Lett. 2020, 726, 133664. [Google Scholar] [CrossRef]
- Sandiego, C.M.; Gallezot, J.-D.; Pittman, B.; Nabulsi, N.; Lim, K.; Lin, S.-F.; Matuskey, D.; Lee, J.-Y.; O’Connor, K.C.; Huang, Y.; et al. Imaging Robust Microglial Activation after Lipopolysaccharide Administration in Humans with PET. Proc. Natl. Acad. Sci. USA 2015, 112, 12468–12473. [Google Scholar] [CrossRef]
- Rummel, N.G.; Butterfield, D.A. Altered Metabolism in Alzheimer Disease Brain: Role of Oxidative Stress. Antioxid. Redox Signal 2022, 36, 1289–1305. [Google Scholar] [CrossRef]
- Maes, M.; Kubera, M.; Leunis, J.-C. The Gut-Brain Barrier in Major Depression: Intestinal Mucosal Dysfunction with an Increased Translocation of LPS from Gram Negative Enterobacteria (Leaky Gut) Plays a Role in the Inflammatory Pathophysiology of Depression. Neuro Endocrinol. Lett. 2008, 29, 117–124. [Google Scholar] [PubMed]
Figure 1.
Key pathways involved in glucose metabolism, insulin sensitivity, and intestinal integrity. Schematic representation of key microbial pathways involved in glucose metabolism, insulin sensitivity, and intestinal barrier integrity: the impact of short-chain fatty acids, bile acids, branched-chain amino acids, and lipopolysaccharides on host metabolic responses, including inflammatory signaling and insulin resistance. SCFAs promote beneficial effects by enhancing GLP-1 and PYY secretion and maintaining epithelial barrier function (via Claudin-1). Bile acids modulate metabolism via FXR and TGR5 receptor signaling. In contrast, BCAAs and LPS contribute to insulin resistance by activating inflammatory cascades (e.g., TLR4/CD14 pathway) and disrupting gut barrier integrity. Created with BioRender 2025 [
8].
Figure 2.
Bacterial and fungal imbalances in the cohort. The blue bar graph displays the frequency of decreased beneficial bacteria such as Bifidobacterium spp. and Lactobacillus spp., which are important for metabolic regulation and gut homeostasis. The red graph highlights increased levels of opportunistic or potentially pathogenic bacteria, including Escherichia coli, Klebsiella spp., and Enterobacteriaceae. The green graph illustrates the overrepresentation of fungal species, primarily Candida spp. and Candida albicans. These imbalances collectively suggest a dysbiotic gut environment potentially contributing to inflammation, insulin resistance, and metabolic dysfunction in patients with type 2 diabetes.
Figure 3.
Frequency of dietary intake across four the major food groups (almost never, 1–2 times/week, 3–4 times/week, daily). Most participants report daily intake of fruits/vegetables and regular consumption of animal products. However, fish intake is notably low, suggesting limited dietary omega-3 intake.
Figure 4.
The calculated power of the statistical test used to detect an association between gut microbiota and metabolic markers. The resulting power of 0.108 (10.8%) reflects a low probability of detecting a true effect due to the small sample size (n = 30), emphasizing the need for larger studies to validate observed trends.
Figure 5.
Heatmap displaying the Spearman correlations between individual microbial species and key metabolic markers. Red squares indicate positive correlations, blue squares represent negative correlations, with greater color intensity signifying stronger relationships. Notable findings include positive associations between Candida spp. and hs-CRP/IL-6 (inflammatory markers), and negative associations between Lactobacillus spp. and fasting glucose levels.
Table 1.
Population characteristics: age, sex, lifestyle factors, body composition indices, and key metabolic and inflammatory markers. The data highlight a predominance of overweight/obese individuals, a high prevalence of urban residency, and moderately controlled diabetes.
Table 1.
Population characteristics: age, sex, lifestyle factors, body composition indices, and key metabolic and inflammatory markers. The data highlight a predominance of overweight/obese individuals, a high prevalence of urban residency, and moderately controlled diabetes.
| Variable | No. | Mean or % | Std. Deviation * | Variance * |
|---|
| Age | 30 | 62.4 | 10.6 | 114.040 |
| Male | 30 | 43.3% | N/A | N/A |
| Urban/Rural Environment | 30 | 83.3% | N/A | N/A |
| Non-smoker | 30 | 73.3% | N/A | N/A |
| Height (cm) | 30 | 169.033 | 8.961 | 80.299 |
| Weight (kg) | 30 | 82.000 | 14.281 | 203.940 |
| Abdominal Circumference (cm) | 30 | 102.833 | 8.851 | 78.339 |
| BMI | 30 | 28.933 | 3.361 | 11.298 |
| Normal weight | 2 | 24.2 | 0.4 | 0.16 |
| Overweight | 19 | 27.39 | 1.236 | 1527 |
| Class I | 6 | 31.7 | 1.216 | 1.48 |
| Class II | 3 | 36.3 | 0.852 | 0.726 |
| Hemoglobin (Hb) (g/dL) | 30 | 14.233 | 1.221 | 1.492 |
| Leukocytes (103/µL) | 30 | 7.545 | 1.328 | 1.764 |
| Platelets (103/µL) | 30 | 267.900 | 83.364 | 6949.557 |
| HbA1C (%) | 30 | 6.583 | 0.596 | 0.355 |
| Blood Glucose (mg/dL) | 30 | 135.767 | 26.627 | 708.979 |
| Urea (mg/dL) | 30 | 30.100 | 6.273 | 39.357 |
| Creatinine (mg/dL) | 30 | 0.775 | 0.167 | 0.028 |
| Uric Acid (mg/dL) | 30 | 5.097 | 1.044 | 1.090 |
| Total Cholesterol (mg/dL) | 28 | 177.200 | 45.736 | 2091.811 |
| HDL (mg/dL) | 28 | 50.071 | 13.280 | 176.350 |
| LDL (mg/dL) | 29 | 107.138 | 43.276 | 1872.783 |
| Triglycerides (mg/dL) | 28 | 166.625 | 94.171 | 8868.190 |
| AST (TGO) (U/L) | 30 | 21.433 | 5.536 | 30.646 |
| ALT (TGP) (U/L) | 30 | 27.833 | 11.719 | 137.339 |
| GGT (U/L) | 29 | 25.241 | 12.724 | 161.907 |
| FT4 (pmol/L) | 29 | 16.783 | 2.574 | 6.626 |
| TSH (µIU/mL) | 28 | 2.287 | 1.090 | 1.188 |
| CRP (mg/L) | 29 | 2.857 | 3.416 | 11.667 |
| hs-CRP (mg/L) | 30 | 2.525 | 3.084 | 9.508 |
| IL-6 (pg/mL) | 30 | 3.459 | 2.174 | 4.728 |
| UACR | 30 | 928.157 | 2084.693 | 4,345,944.302 |
| eGFR (mL/min/1.73 m2) | 30 | 93.924 | 13.981 | 195.466 |
| Microbiome pH | 30 | 6.567 | 0.642 | 0.412 |
| Total Body Water (%) | 30 | 47.430 | 5.350 | 28.619 |
| Visceral Fat Level | 30 | 10.100 | 3.969 | 15.757 |
| Basal Metabolic Rate (kcal) | 30 | 1708.700 | 310.164 | 96,202.010 |
| Metabolic Age (years) | 30 | 57.267 | 12.331 | 152.062 |
| Muscle Mass (kg) | 30 | 55.113 | 10.076 | 101.519 |
| Muscle Mass Percentage (%) | 30 | 66.067 | 6.502 | 42.278 |
Table 2.
Microbiota composition and fungal presence in the cohort.
Table 2.
Microbiota composition and fungal presence in the cohort.
| Bacteria | | Fungi |
|---|
| Decreased | No. | Increased | No. | Increased | No. |
|---|
| Enterococcus spp. | 9 | Enterococcus spp. | 5 | Candida spp. | 7 |
| Escherichia coli | 4 | Escherichia coli | 15 | Candida albicans | 6 |
| Bifidobacterium spp. | 12 | Bacteroides spp. | 1 | Geotrichum spp. | 2 |
| Lactobacillus spp. | 11 | Enterobacteriaceae | 3 | Filamentous fungi | 2 |
| | | Citrobacter spp. | 2 | | |
| | | E. coli Biovare | 6 | | |
| | | Klebsiella spp. | 7 | | |
| | | Alpha h. streptoccocus | 11 | | |
| | | Beta h. streptococcus | 2 | | |
Table 3.
Frequency of dietary intake across different food groups within the cohort.
Table 3.
Frequency of dietary intake across different food groups within the cohort.
| Frequency | Fruits and Vegetables
(n=) | Animal Products
(n=) | Fish and Seafood
(n=) | Eggs and Diary
(n=) |
|---|
| almost never | 0 | 0 | 11 | 0 |
| 1–2 times a week | 1 | 0 | 19 | 2 |
| 3–4 times a week | 5 | 10 | 0 | 20 |
| every day | 24 | 20 | 0 | 8 |
Table 4.
HbA1C levels in relation to fasting blood glucose (FBG), microbiome pH, and specific bacterial and fungal species.
Table 4.
HbA1C levels in relation to fasting blood glucose (FBG), microbiome pH, and specific bacterial and fungal species.
HbA1C
(%) | No. | FBG
(Mean ± SD) | pH Microbiome
(Mean ± SD) | Decreased Bacteria | Increased Bacteria | Increased Fungi |
|---|
| <6 | 5 | 120.8 ±21.28 | 6.5 ± 0.54 | Enterococcus spp.
Escherichia coli Bifidobacterium spp. | Enterococcus spp.
Escherichia coli
Bacteroides spp.
Enterobacteriaceae
E. coli Biovare
Klebsiella spp.
Alpha h. streptoccocus Beta h. streptococcus | Candida spp.
Candida albicans
Filamentous fungi |
| 6.1–6.5 | 13 | 132.07 ± 21.22 | 6.76 ± 0.57 | Enterococcus spp. Escherichia coli Bifidobacterium spp. Lactobacillus spp. | Enterococcus spp.
Escherichia coli
Enterobacteriaceae Citrobacter spp.
E. coli Biovare
Klebsiella spp.
Proteus spp.
Alpha h. streptoccocus | Candida spp.
Candida albicans
Geotrichum spp.
Filamentous fungi |
| >6.6 | 12 | 146 ± 29.71 | 6.37 ± 0.68 | Enterococcus spp. Escherichia coli Bifidobacterium spp. Lactobacillus spp. | Enterococcus spp.
Escherichia coli
Enterobacteriaceae
E. coli Biovare
Klebsiella spp.
Alpha h. streptoccocus Beta h. streptococcus | Candida spp.
Candida albicans |
Table 5.
Spearman correlation matrix: positive and negative associations between gut microbes and clinical parameters such as HbA1c, BMI, triglycerides, and inflammatory markers (hs-CRP, IL-6). Notable correlations include Candida spp. with hs-CRP (ρ = 0.40) and Escherichia coli with BMI (ρ = 0.37), underscoring the metabolic relevance of specific microbiota profiles.
| | HbA1c | Fastin Glucose | Triglycerides | BMI | hs-CRP | IL-6 | Visceral Fat | Bifidobacterium spp. | Lactobacillus spp. | Escherichia coli | Candida spp. |
|---|
| HbA1c | 1 | 0.37 | 0.31 | 0.24 | 0.16 | 0.15 | −0.03 | 0.01 | −0.09 | −0.11 | 0.23 |
| Fasting Glucose | 0.37 | 1 | 0.25 | −0.05 | −0.09 | −0.1 | −0.18 | −0.15 | −0.24 | −0.32 | 0.09 |
| Triglycerides | 0.31 | 0.25 | 1 | 0.29 | −0.08 | −0.34 | 0.31 | 0.1 | 0.19 | −0.21 | −0.13 |
| BMI | 0.24 | −0.05 | 0.29 | 1 | 0.21 | 0.09 | 0.68 | −0.09 | −0.04 | 0.37 | 0.06 |
| hs-CRP | 0.16 | −0.09 | −0.08 | 0.21 | 1 | 0.23 | 0.05 | −0.14 | 0.27 | −0.08 | 0.4 |
| IL-6 | 0.15 | −0.1 | −0.34 | 0.09 | 0.23 | 1 | 0.02 | −0.31 | −0.15 | −0.07 | 0.37 |
| Visceral Fat | −0.03 | −0.18 | 0.31 | 0.68 | 0.05 | 0.02 | 1 | 0.2 | 0.21 | 0.49 | 0.15 |
| Bifidobacterium spp. | 0.01 | −0.15 | 0.1 | −0.09 | −0.14 | −0.31 | 0.2 | 1 | 0.21 | 0.28 | 0.01 |
| Lactobacillus spp. | −0.09 | −0.24 | 0.19 | −0.04 | 0.27 | −0.15 | 0.21 | 0.21 | 1 | −0.12 | 0.11 |
| Escherichia coli | −0.11 | −0.32 | −0.21 | 0.37 | −0.08 | −0.07 | 0.49 | 0.28 | −0.12 | 1 | 0.08 |
| Candida spp. | 0.23 | 0.09 | −0.13 | 0.06 | 0.4 | 0.37 | 0.15 | 0.01 | 0.11 | 0.08 | 1 |
| Disclaimer/Publisher’s Note: The statements, opinions and data contained in all publications are solely those of the individual author(s) and contributor(s) and not of MDPI and/or the editor(s). MDPI and/or the editor(s) disclaim responsibility for any injury to people or property resulting from any ideas, methods, instructions or products referred to in the content. |
© 2025 by the authors. Licensee MDPI, Basel, Switzerland. This article is an open access article distributed under the terms and conditions of the Creative Commons Attribution (CC BY) license (https://creativecommons.org/licenses/by/4.0/).


 ,
, 


