Abstract
Ulcerative colitis (UC) is a relapsing and remitting disease that causes chronic inflammation and ulceration of colonic tissue, especially in the rectum region. Although sugars are rapidly digested and absorbed and can be efficiently utilized as energy in the body, they are also known to promote inflammation. Herein, we aimed to examine the effects of special diets containing excess glucose (Glu) or fructose (Fru) on the pathogenesis of dextran sulfate sodium (DSS)-induced UC in Wistar rats. The model rats (termed UC rats or UCR) were divided into three groups: DSS group, UCR fed a regular diet; DSS + Glu group, UCR fed a special diet mixed with glucose at 63% calories; DSS + Fru group, UCR fed a special diet mixed with fructose at 63% calories. The DSS + Glu and DSS + Fru groups exhibited a lower weight and colon length than the DSS group. The DSS + Fru group had a lower diet and DSS intake than the other two groups. The microscopic findings revealed that the DSS + Glu and DSS + Fru groups tended to have higher severity scores than the DSS group. The DSS + Fru group tended to have higher serum and colonic tissue concentrations of inflammatory cytokines than the DSS + Glu group. Collectively, these findings suggest that excessive glucose and fructose intake can aggravate intestinal inflammation.
1. Introduction
Ulcerative colitis (UC) is a relapsing and remitting disease with patients experiencing chronic abdominal pain, diarrhea, and melena [1]. The number of patients with UC is increasing annually worldwide, particularly in the United States and Europe [2]. Environmental, genetic, and immunological factors have been found to contribute to the pathogenesis of UC [3], although their precise involvement remains unknown. Similarly, the onset and exacerbation of UC are commonly associated with disturbances in the colonic commensal flora [4]. In particular, a high-carbohydrate and high-lipid diet, typically consumed in Western countries, has been found to disrupt the distribution of intestinal bacteria [5]. Probiotics are well-known viable additives that can benefit host animals by improving the balance of intestinal microorganisms, and their capacity to effectively improve pathological conditions underlying UC has been reported [6,7]. Prebiotics have been reported to have beneficial effects on colon tissue in UC, including the promotion of lactobacillus growth and mineral absorption [8]. Additionally, eating fruits and vegetables rich in vitamins and minerals may improve the pathophysiology of UC [9,10]. The intake of adequate dietary fiber is also important for patients with UC, and a lack of fiber seems to increase the susceptibility of intestinal microbiota to pathogens and disrupt the colonic mucosal barrier [11,12]. Based on the above findings, a new dietary therapy restricting the intake of animal fat and protein was recently proposed, which successfully hastened the induction of remission in UC [13].
Fructose (Fru) and glucose (Glu), both predominant dietary sugars, are naturally found in fruits, vegetables, and confectionary items [14]. Excessive intake of dietary sugar has been strongly associated with the development of obesity, type 2 diabetes, metabolic syndrome, and cardiovascular disease [15]. In recent years, excessive consumption of sweetened beverages was found to be associated with the development and worsening of autoimmune diseases, such as rheumatoid arthritis [16]. High Fru intake has been shown to decrease the total number of lymphocytes, while high Glu intake promotes interleukin (IL)-6 activation and T helper 17 cell differentiation, exacerbating autoimmune diseases [17,18]. Considering that dietary sugars can impact these non-gastrointestinal diseases, their effects on the pathogenesis of UC could be substantial. The intake of high Glu levels was found to exacerbate the progression of inflammatory bowel disease (IBD) by altering the gut microbiota composition, mucosal association, and functional activity, thereby increasing the levels of inflammatory cytokines IL-6 and tumor necrosis factor-alpha (TNF-α) [19]. Similarly, dietary Fru was shown to induce gastrointestinal inflammation by enhancing the permeability of gut cells and promoting the growth of anaerobic bacteria [20].
Consequently, the effects of dietary sugar have been extensively explored in mouse models of IBD; however, studies using rats remain scarce. Furthermore, although many studies have focused on the relationship between dietary sugar, the pathology of colitis, and intestinal bacteria in animal models of experimental colitis, few have examined the nutritional status and health of other organs. In this current study, we investigated the effects of a high-sugar diet on the severity of experimental colitis in rats with dextran sulfate sodium (DSS)-induced UC (i.e., UC rats, henceforth referred to as UCR). In addition, we measured blood parameters typically assessed in patients with UC and examined the effect of excessive sugar intake on nutritional status and organs other than the large intestine. Based on the observed results, we aimed to clarify the adverse effects of sugar intake on the pathology of UC and overall health.
2. Results
2.1. Changes in Body Weight and DAI Scores
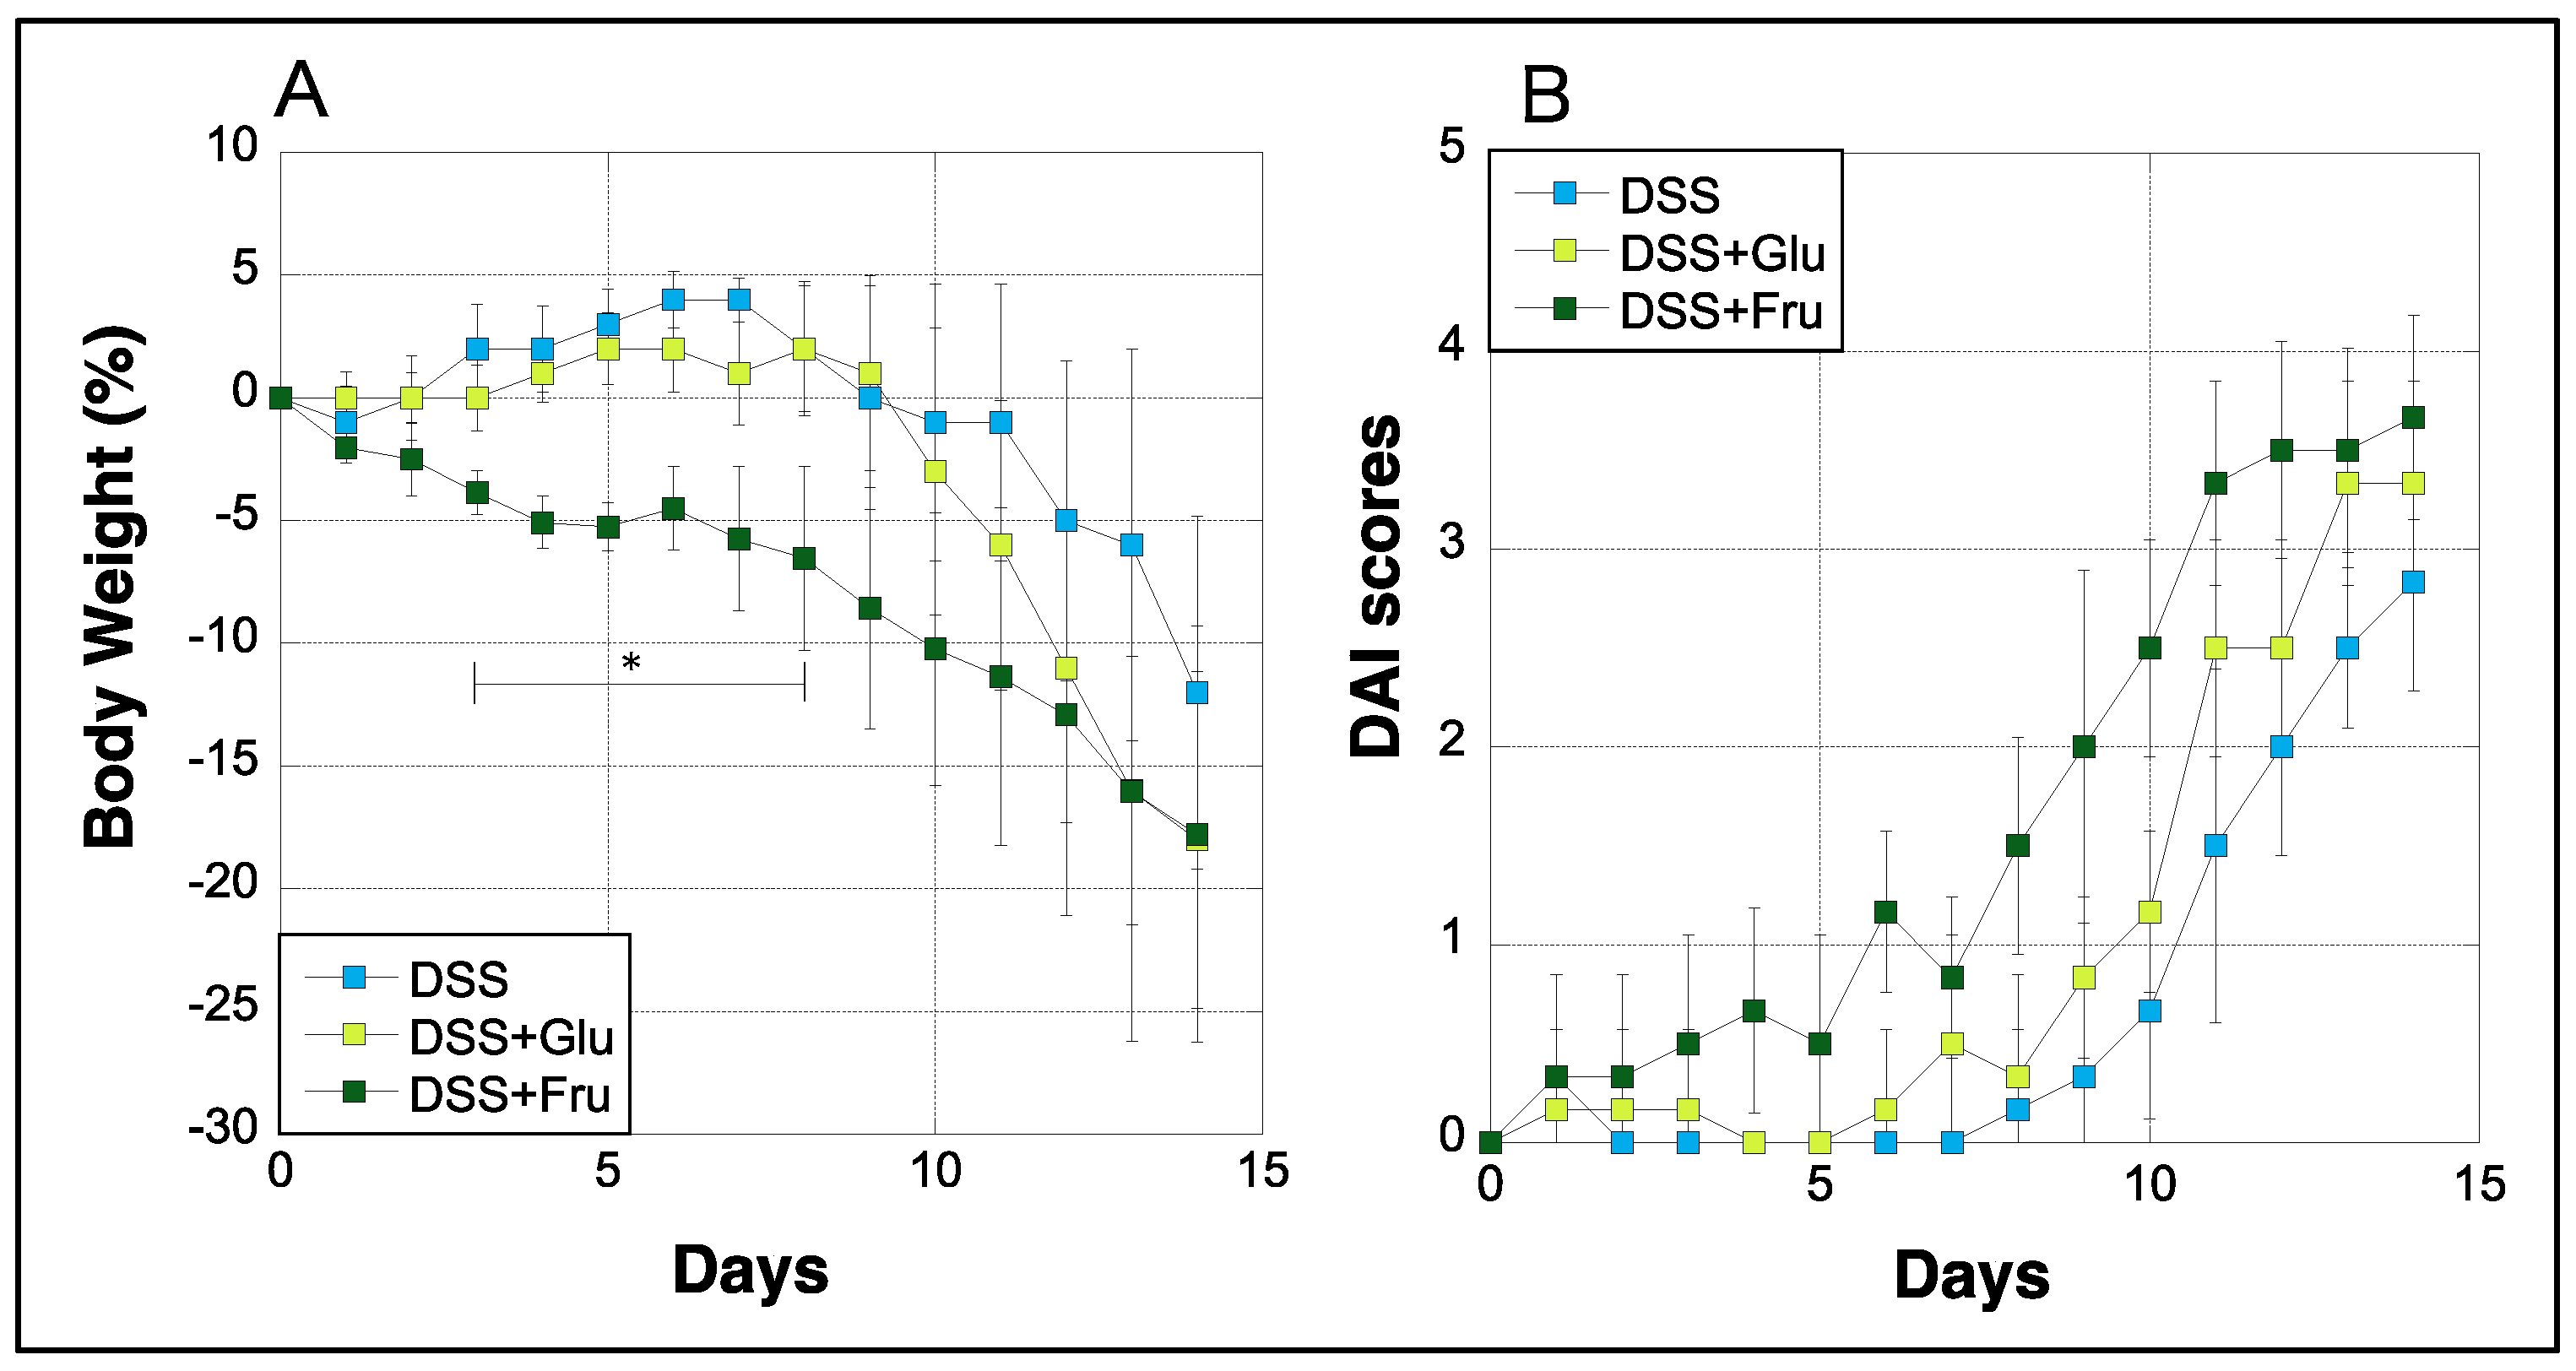
Body weight and DAI scores of rats were measured daily during the experimental period. The weight of rats in the DSS group gradually decreased after day 7, whereas rats in the DSS + Glu group experienced rapid weight loss after day 9 (Figure 1A). Rats in the DSS + Fru group exhibited greater weight loss than those in the DSS + Glu group between days 3–11 (Figure 1A). Moreover, we evaluated DAI scores based on the criteria listed in Table 1, as previously described [21]. In the DSS group, the DAI scores increased with gradually worsening physical symptoms, although scores in the DSS + Glu and DSS + Fru groups tended to be higher than those in the DSS group (Figure 1B).
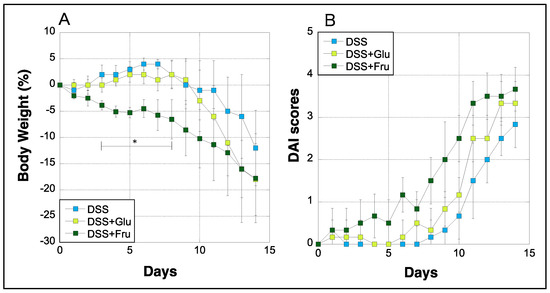
Figure 1.
Changes in the body weight and DAI scores of rats. (A), The y-axis represents the percentage fluctuation in the body weight of three rat groups. (B), DAI scores assessed based on established criteria [21] (Table 2); the y-axis represents the DAI scores. The x-axes represent the number of days after initiating the experiment. Data values are presented as the mean ± standard deviation (±SD). DSS group (light blue square), DSS + Glu group (light green square), DSS + Fru group (dark green square). DAI, disease activity index; DSS, dextran sulfate sodium; DSS group, DSS-induced experimental colitis rats fed AIN-93G; DSS + Glu group, DSS-induced experimental colitis rats fed a glucose-excessive diet; DSS + Fru group, DSS-induced experimental colitis rats fed a fructose-excessive diet. * p < 0.05 (DSS group vs. DSS + Fru group).

Table 1.
Clinical chemistry parameters in rat serum of each group.
2.2. Diet and 3% DSS Consumption
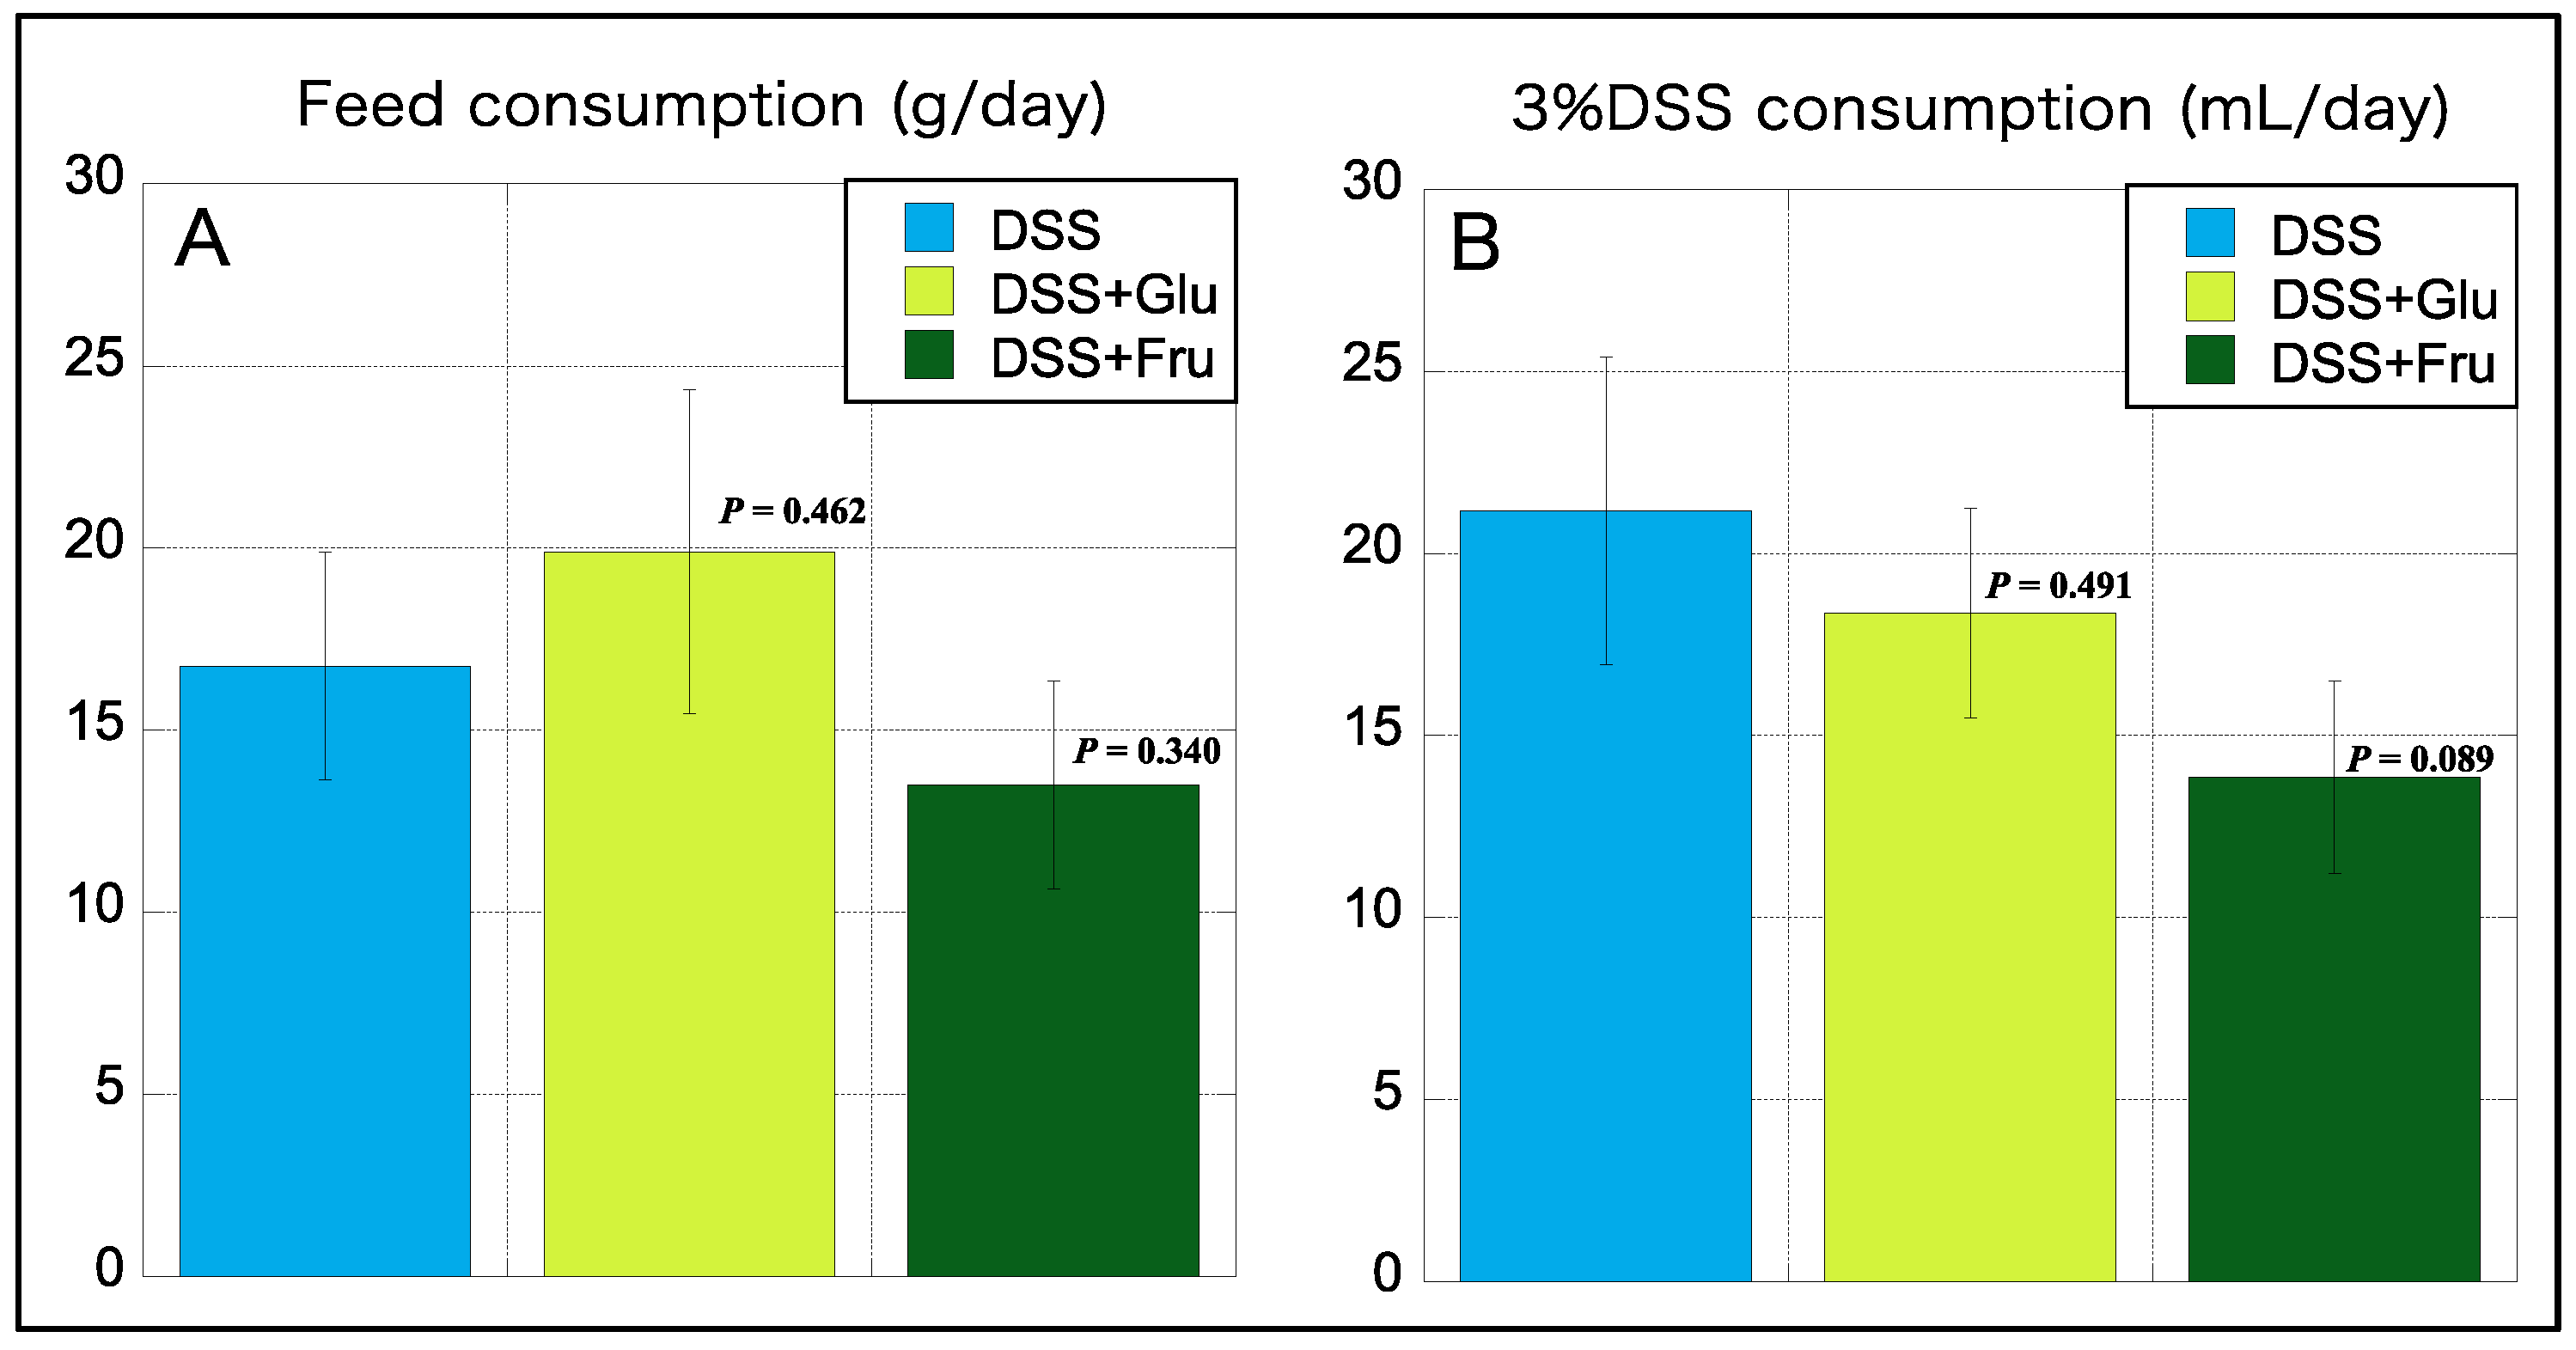
We also measured the daily consumption of diet and 3% DSS during the experimental period, which was subsequently averaged. Interestingly, the consumption of the high-Glu diet was higher than that of the normal diet AIN-93G, whereas that of the high-Fru diet was lower than the normal diet (Figure 2A). The consumption of 3% DSS was the highest in the DSS group, with reduced consumption noted in rats fed diets comprising excess sugar (Figure 2B).
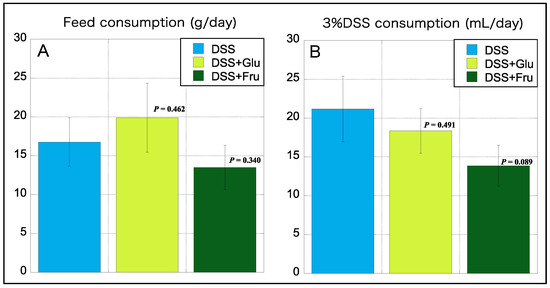
Figure 2.
Consumption of feed and 3% DSS. (A), The y-axis represents the daily feed consumption (in grams). (B), The y-axis represents daily consumption of 3% DSS consumption (mL). Data values are presented as the mean ± standard deviation (±SD). DSS group (light blue square), DSS + Glu group (light green square), and DSS + Fru group (dark green square). Each p-value in the figure: DSS group vs. other groups. DSS, dextran sulfate sodium; DSS group, DSS-induced experimental colitis rats fed AIN-93G; DSS + Glu group, DSS-induced experimental colitis rats fed a glucose-excessive diet; DSS + Fru group, DSS-induced experimental colitis rats fed a fructose-excessive diet.
2.3. Changes in Rat Colon Lengths
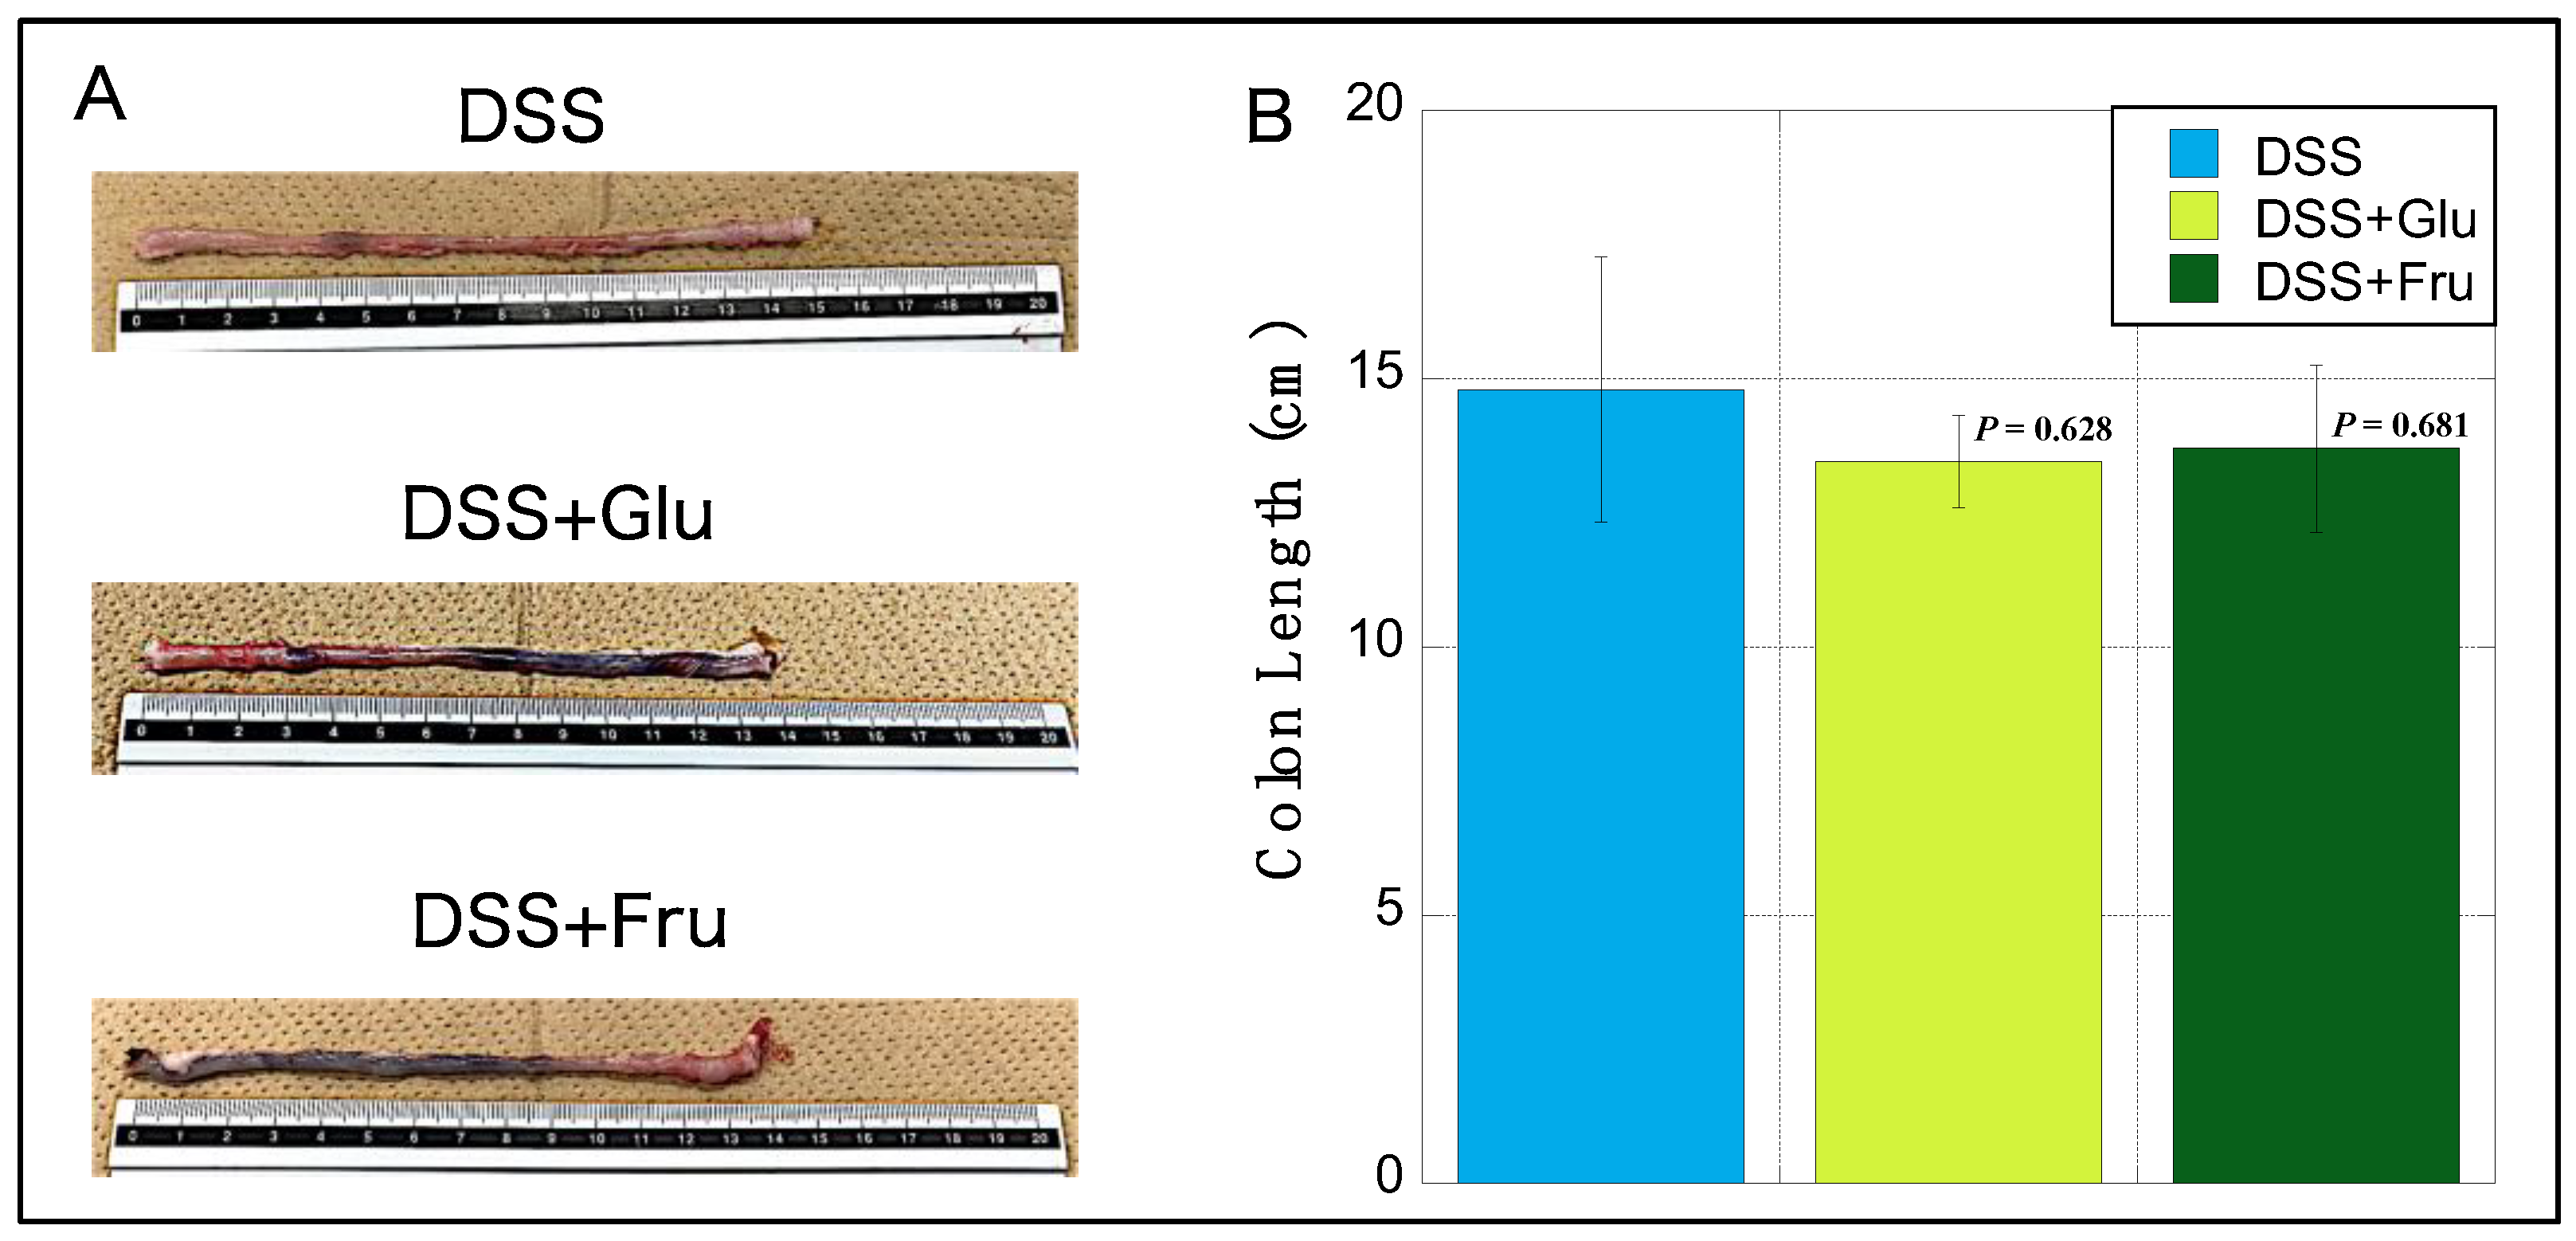
The colons of rats in the DSS + Glu and DSS + Fru gr groups were visually reduced compared with those of rats in the DSS gr group (Figure 3A). Among the three groups, the DSS group exhibited the longest mean colon length, with slight atrophy noted in the DSS + Glu and DSS + Fru groups (Figure 3B).
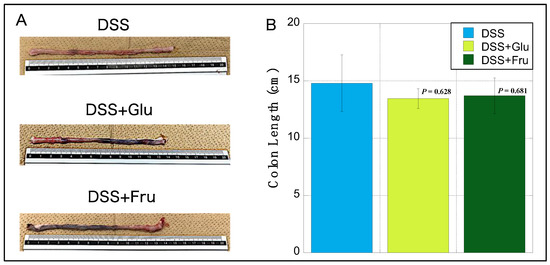
Figure 3.
Changes in the colon length of rats. (A), Representative images of colon tissues from the DSS, DSS + Glu, and DSS + Fru groups. (B), The y-axis represents the colon length (in cm) of rats in the DSS (light blue square), DSS + Glu (light green square), and DSS + Fru (dark green square) groups. Data values are presented as the mean ± standard. Each p-value in the figure: DSS group vs. other groups. DSS, dextran sulfate sodium; DSS group, DSS-induced experimental colitis rats fed AIN-93G; DSS + Glu group, DSS-induced experimental colitis rats fed a glucose-excessive diet; DSS + Fru group, DSS-induced experimental colitis rats fed a fructose-excessive diet.
2.4. Microscopic Observation and Evaluation of Colonic Inflammation
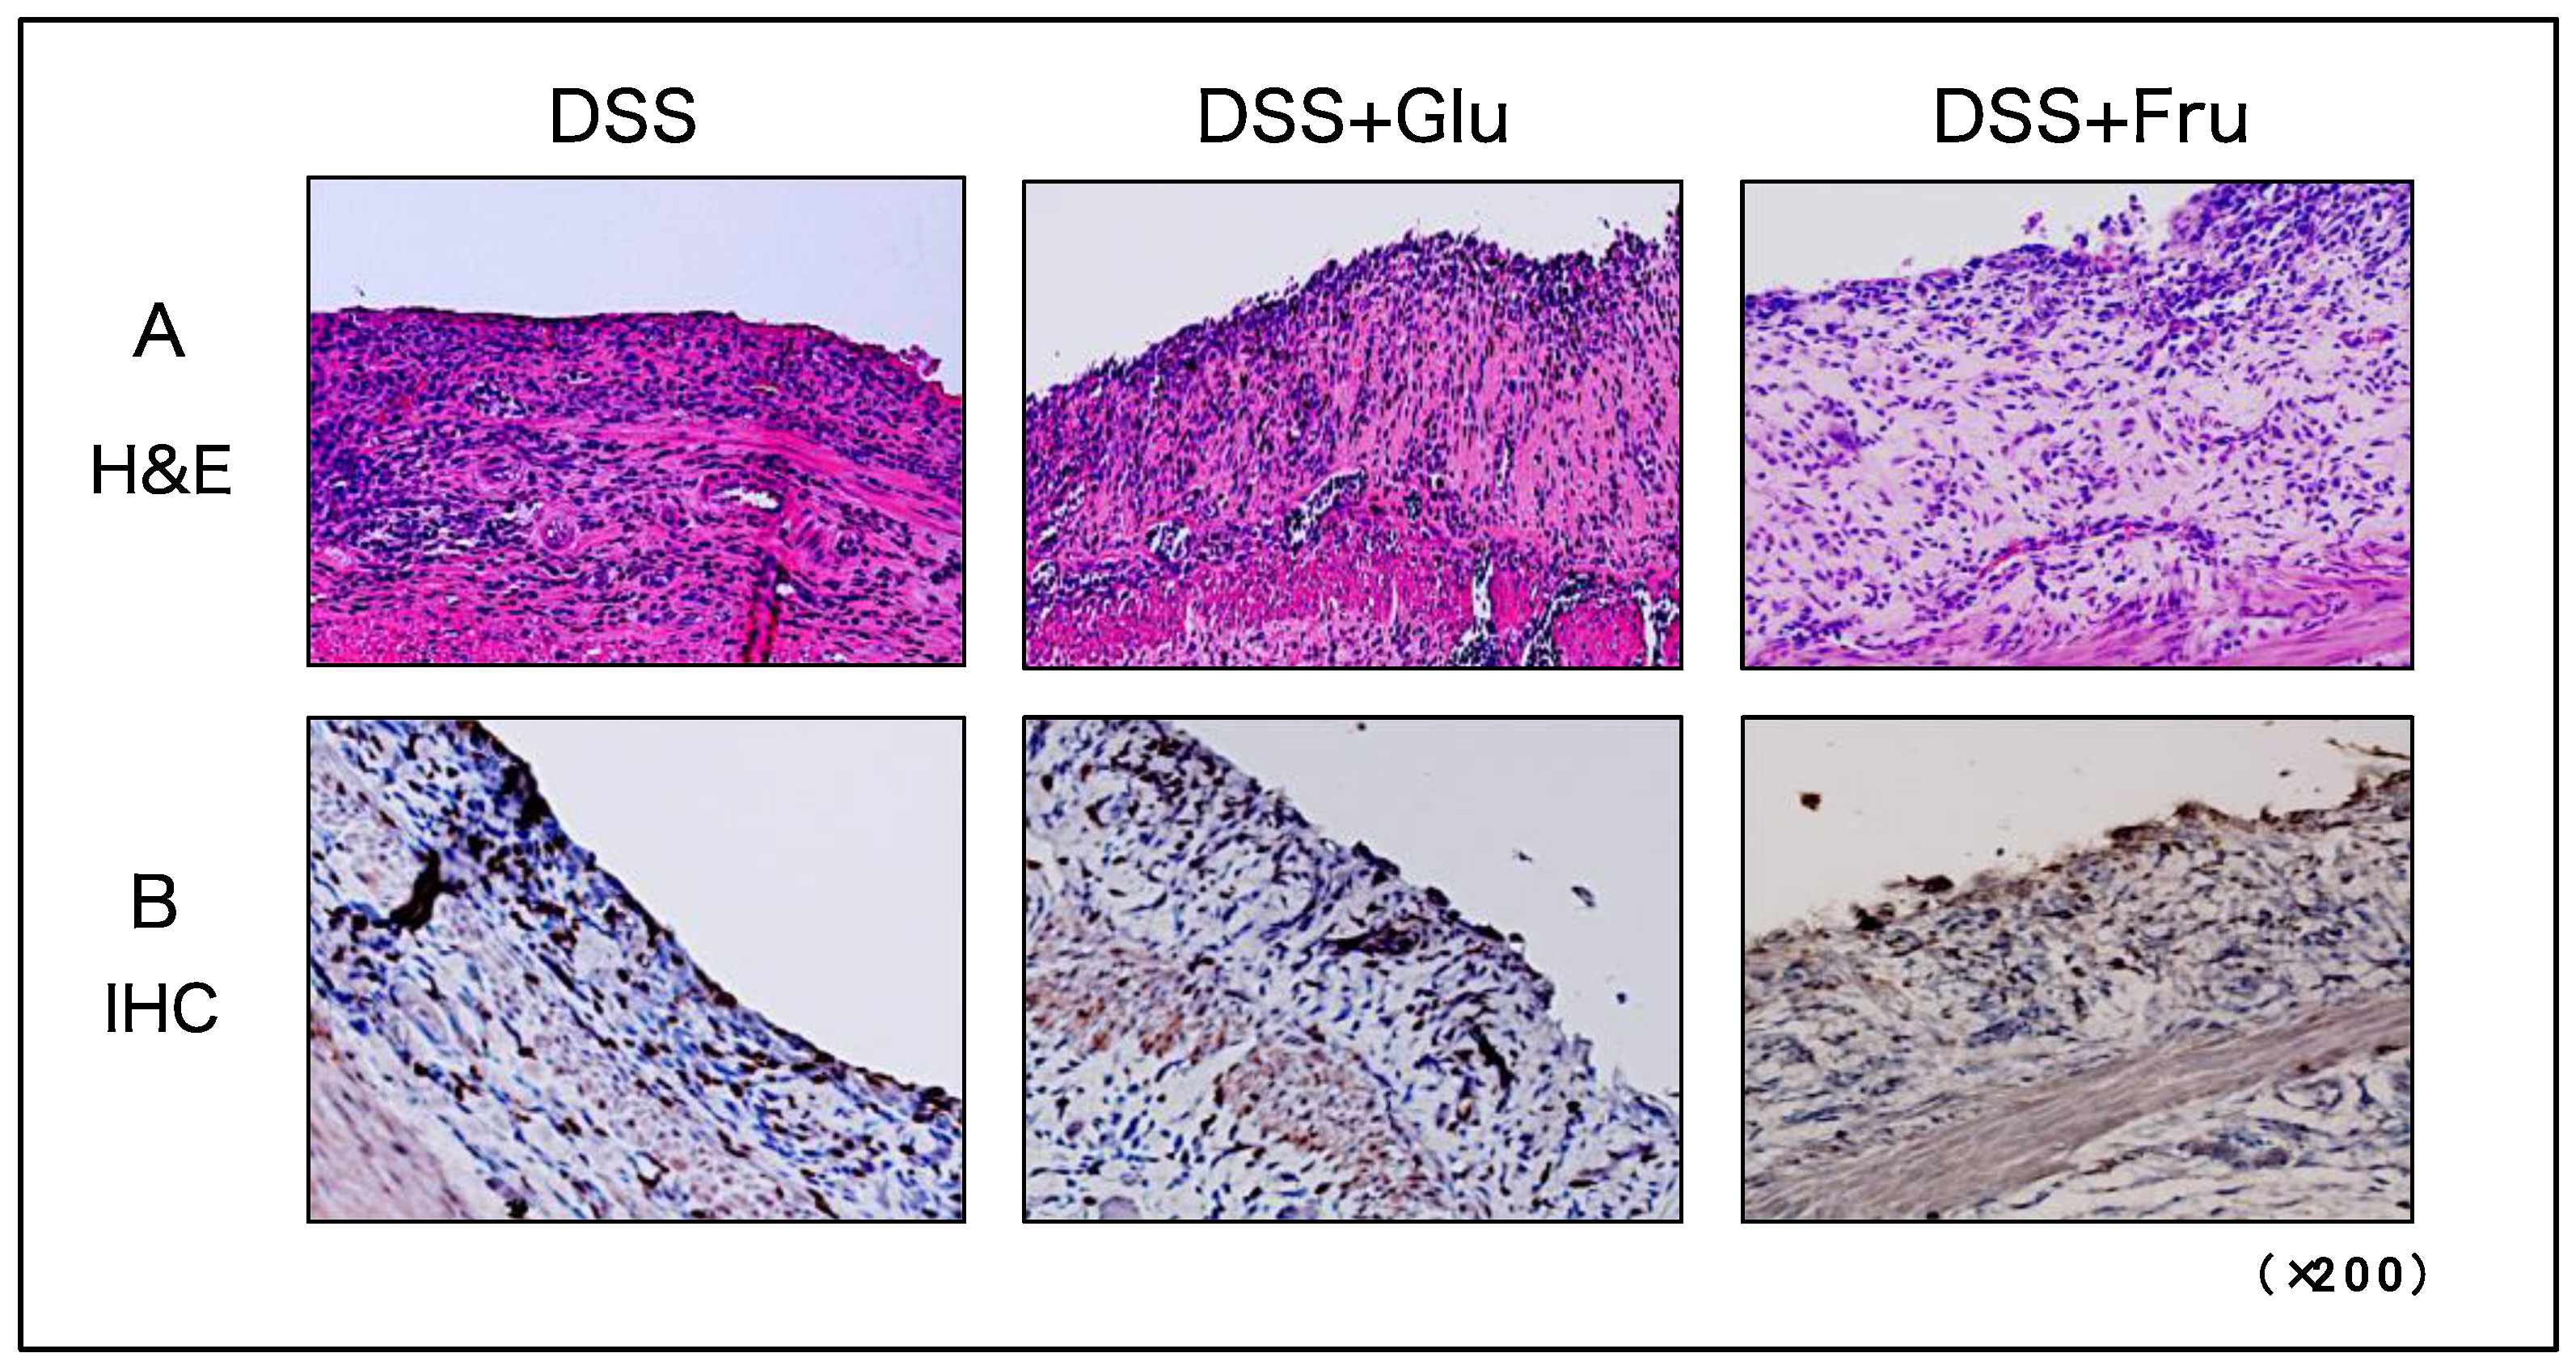
H&E and IHC staining were performed to visualize tissue damage and neutrophil infiltration in the large intestine. In all three experimental groups, the epithelial structures of the colon were damaged from numerous immune cells infiltrating the tissues (Figure 4A). Neutrophil infiltration was also comparable among the three groups, with no significant differences observed (Figure 4B).
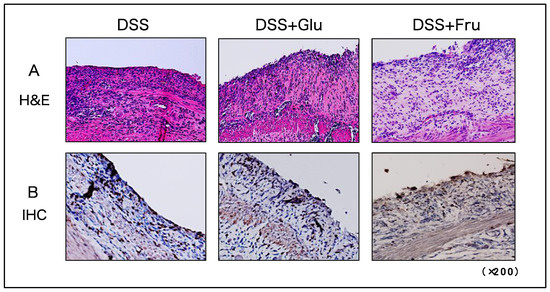
Figure 4.
Histological assessment of colonic tissues of rats. (A) Microscopic H&E-stained images of colon tissues. (B) Microscopic IHC-stained images for detecting neutrophils in colon tissues. The panels present representative images of DSS, DSS + Glu, and DSS + Fru groups from left to right. All microscopic images were observed using a BIOREVO BZ-9000 microscope (Keyence Co., Ltd., Osaka, Japan). High-power magnification was used for all panels (×200). H&E, hematoxylin and eosin; IHC, immunohistochemical; DSS, dextran sulfate sodium; DSS group, DSS-induced experimental colitis rats fed AIN-93G; DSS + Glu group, DSS-induced experimental colitis rats fed a glucose-excessive diet; DSS + Fru group, DSS-induced experimental colitis rats fed a fructose-excessive diet.
2.5. Evaluation of HIS and Serum Inflammatory Cytokines
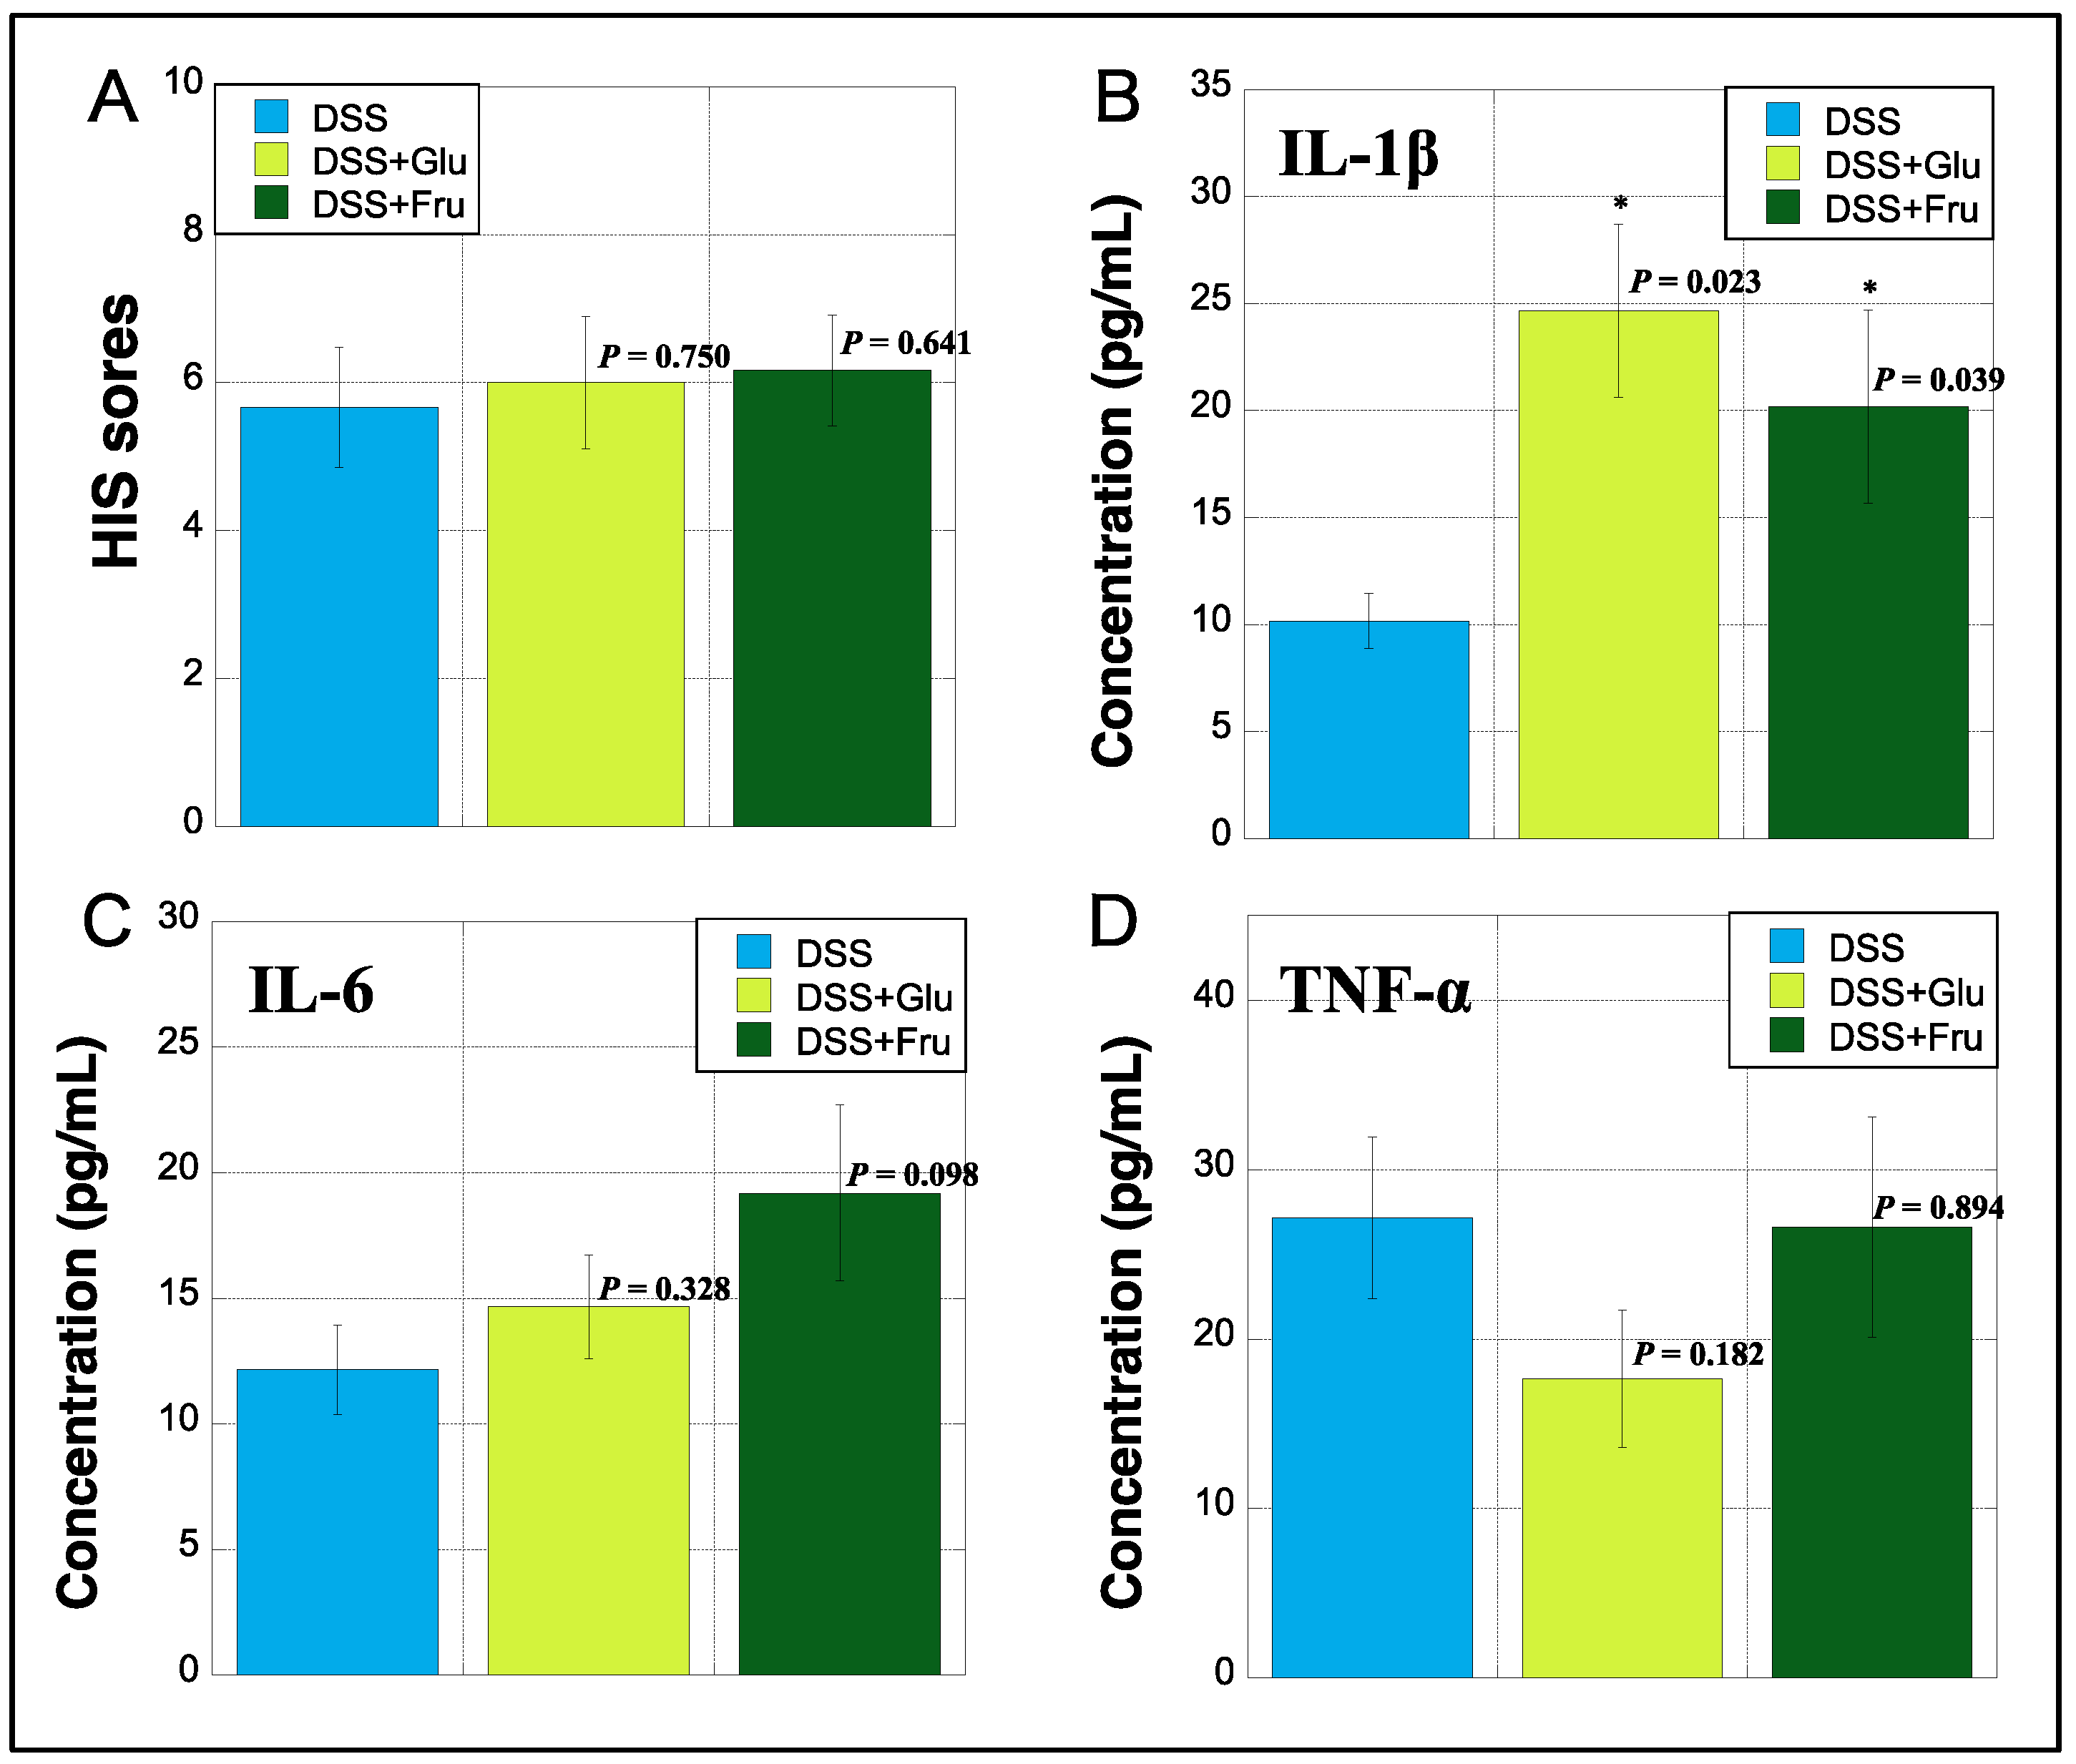
The HIS was assessed based on previously established criteria [22]. The HIS was slightly increased in the DSS + Fru group compared with that in the DSS and DSS + Glu groups (Figure 5A). The serum levels of IL-1β, IL-6, and TNF-α were measured using ELISA. The DSS + Glu and DSS + Fru groups had higher serum levels of IL-1β than the DSS group (Figure 5B). The serum levels of IL-6 were slightly higher in the DSS + Glu and DSS + Fru groups than those in the DSS group (Figure 5C). However, serum TNF-α levels tended to be lower in the DSS + Glu group than those in the other two groups (Figure 5D).
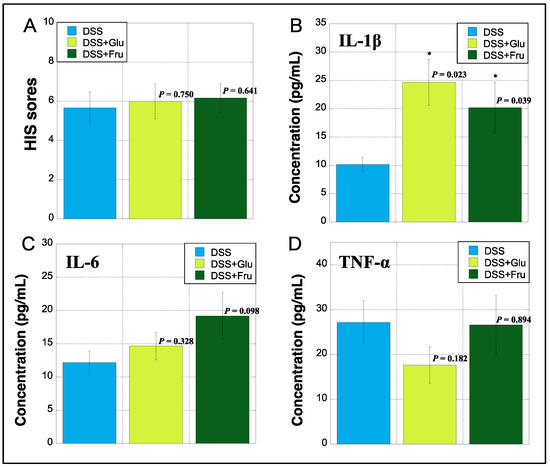
Figure 5.
Histopathologic index score (HIS) and serum inflammatory cytokines. (A), HIS scores on day 14 after initiating the experiment were assessed based on established criteria [22] (Table 3). The y-axis shows the HIS scores of rats in all groups. (B–D), The y-axis indicates the concentrations of interleukin (IL)-1β, IL-6, and tumor necrosis factor (TNF)-α (pg/mL) in sera of rats by measuring enzyme-linked immunosorbent assay (ELISA), respectively. Data values are presented as the mean ± standard deviation (±SD). DSS group (light blue square), DSS + Glu group (light green square), and DSS + Fru group (dark green square). Each p-value in the figure: DSS group vs. other groups. DSS, dextran sulfate sodium; DSS group, DSS-induced experimental colitis rats fed AIN-93G; DSS + Glu group, DSS-induced experimental colitis rats fed a glucose-excessive diet; DSS + Fru group, DSS-induced experimental colitis rats fed a fructose-excessive diet. * p < 0.05 (vs. DSS group).
2.6. Cytokine Concentration and mRNA Expression in Colon Tissues
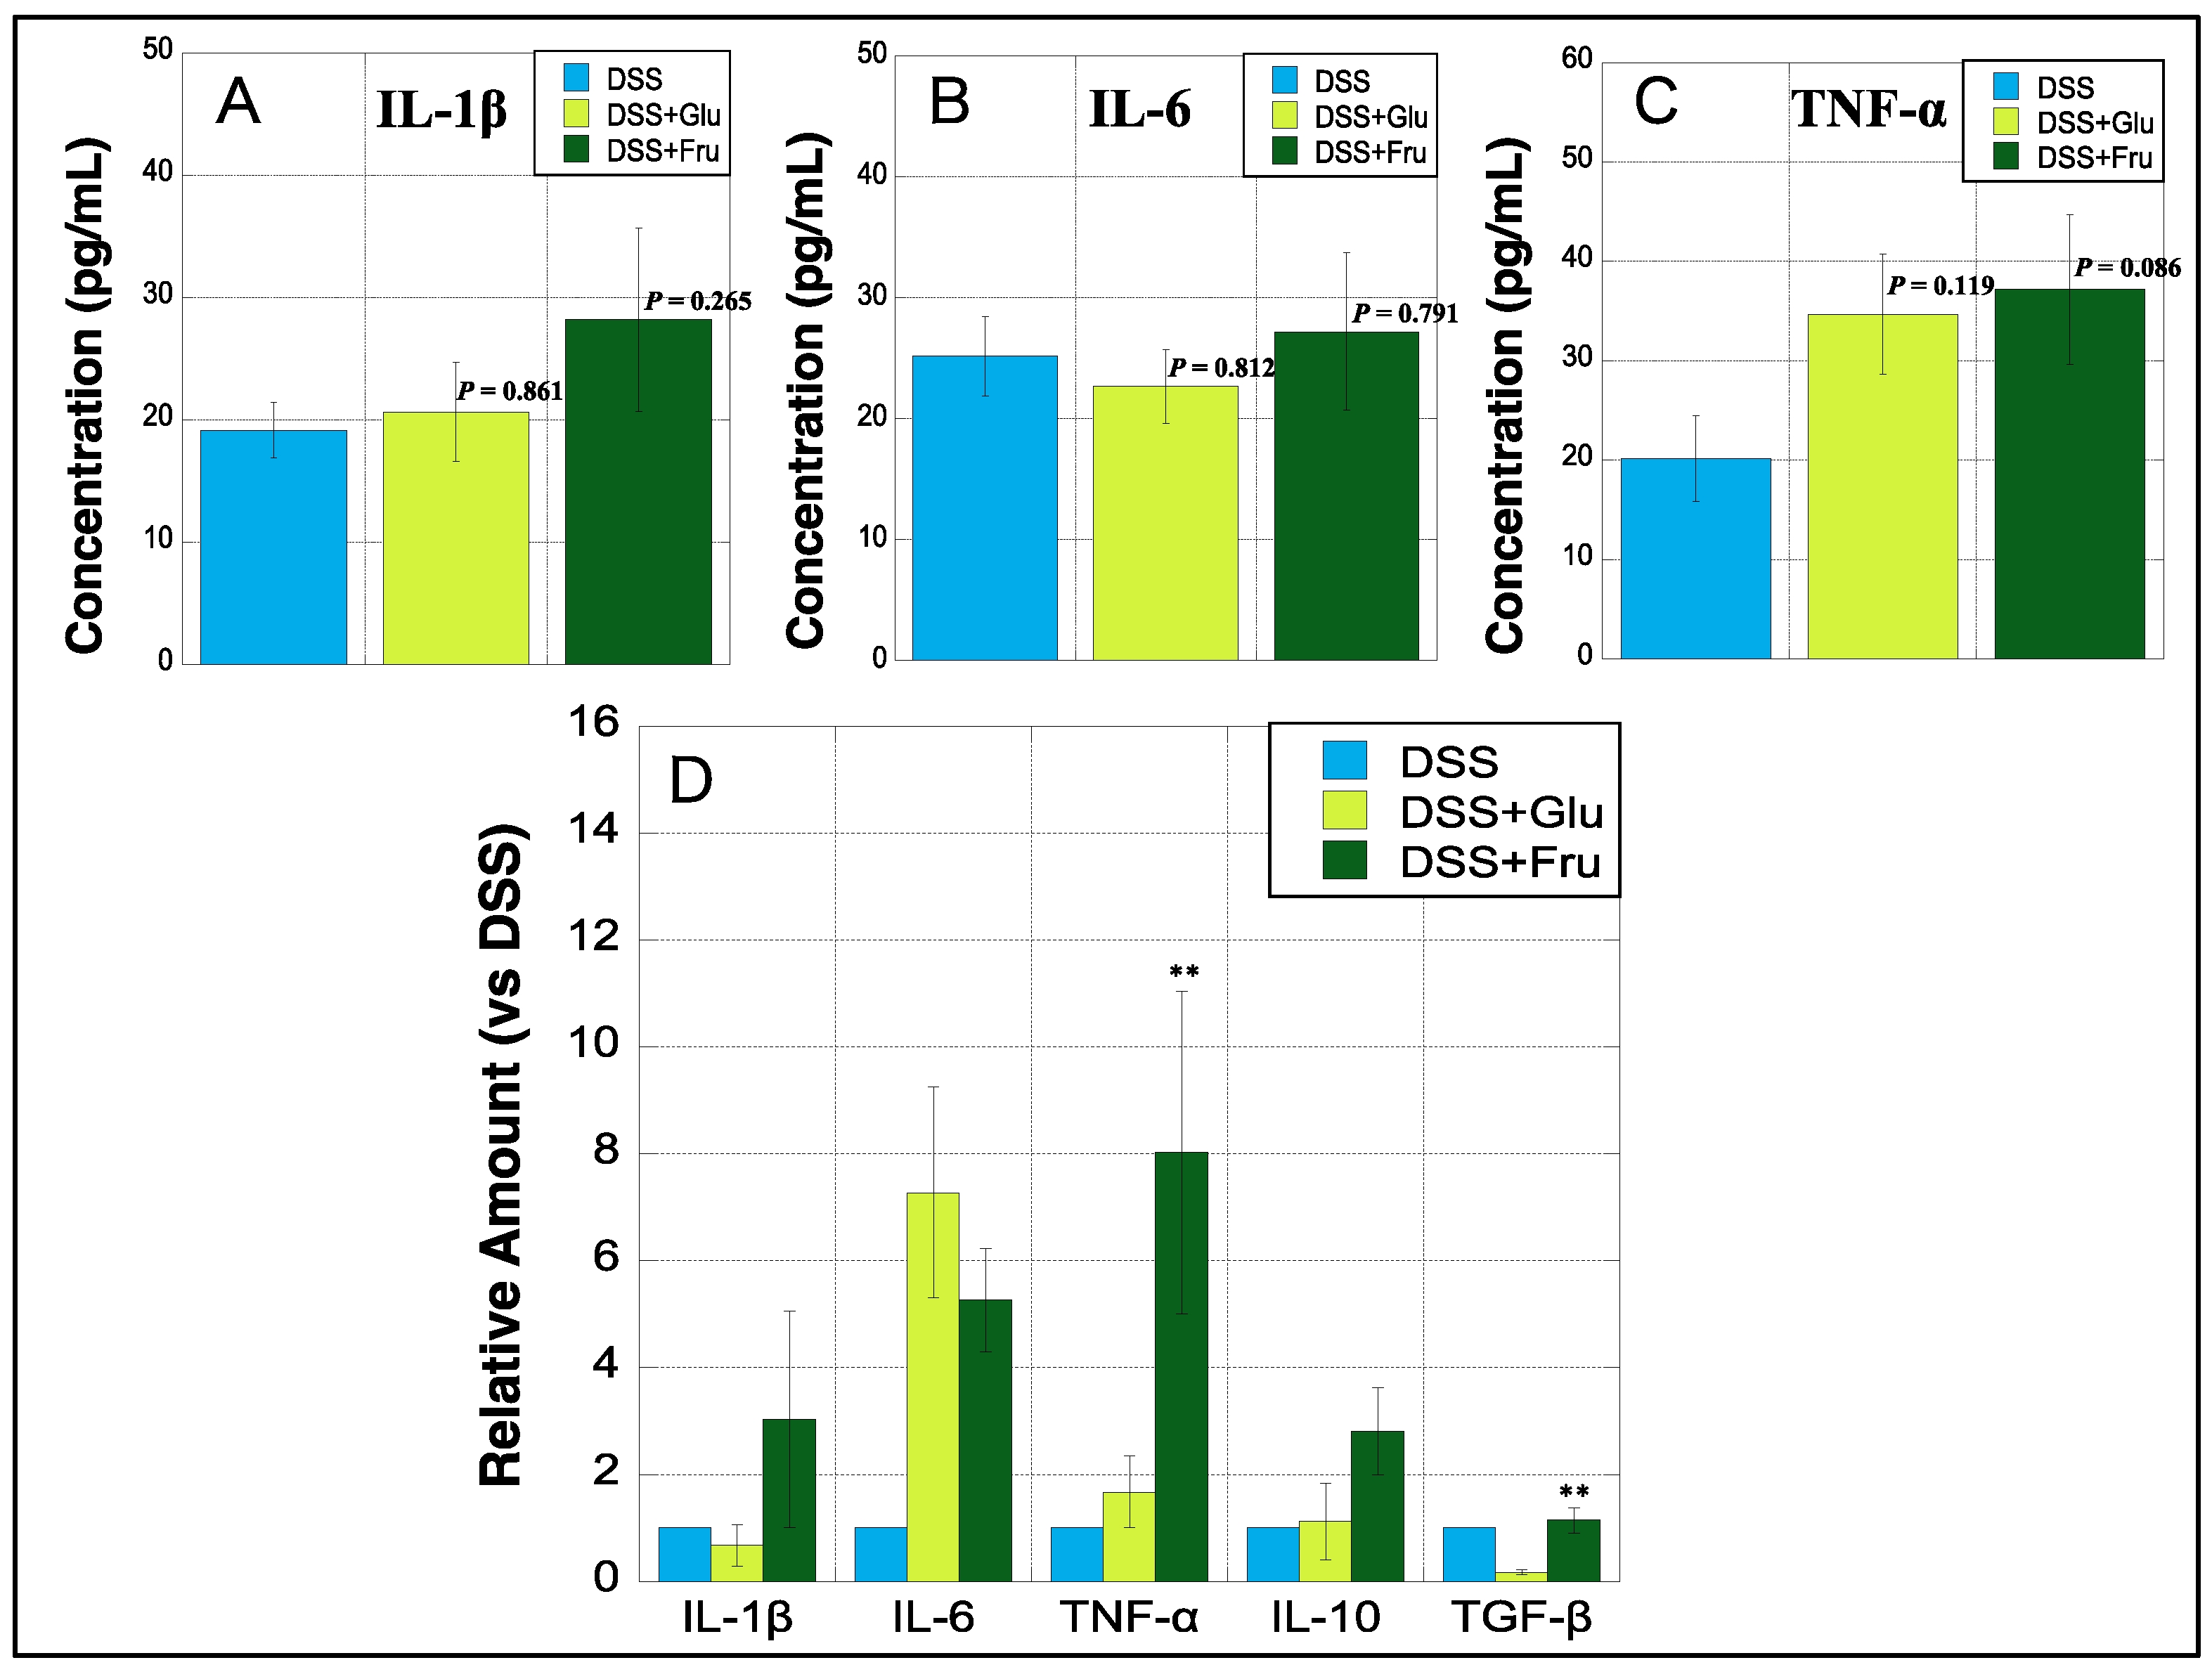
All three experimental groups were subjected to ELISA to determine colonic levels of three inflammatory cytokines. The levels of IL-1β were slightly upregulated in the DSS + Glu and DSS + Fru groups compared with those in the DSS group (Figure 6A). The colonic levels of IL-6 were marginally higher in the DSS + Fru group than those in the other two groups, whereas those of TNF-α tended to increase in the DSS + Glu and DSS + Fru groups (Figure 6B,C). In addition, real-time PCR was performed to quantify mRNA levels of five cytokines in the colon tissues of all groups. We observed that colonic mRNA levels of IL-1β, IL-6, and TNF-α were notably increased in the DSS + Fru group compared with those in the DSS group (Figure 6D). Additionally, the DSS + Glu group had higher levels of IL-6 and TNF-α mRNA than the DSS group (Figure 6D). The DSS + Fru group exhibited higher levels of two anti-inflammatory cytokines, i.e., IL-10 and TGF-β, than the other two groups (Figure 6D).
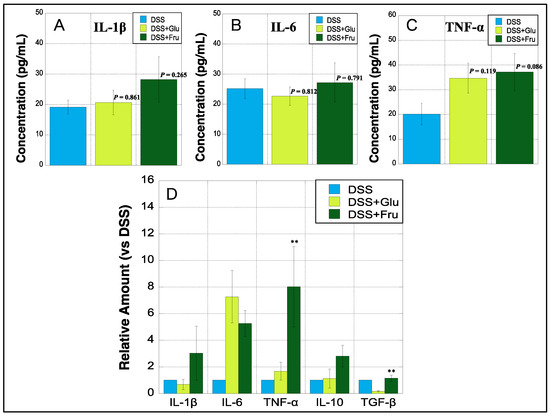
Figure 6.
Colonic expression of cytokines at protein and genetic levels. (A–C), The y-axis represents the concentrations of IL-1β, IL-6, and TNF-α (pg/mL) in the colon of rats estimated using ELISA, respectively. (D), The y-axis represents mRNA expression levels of interleukin (IL)-1β, IL-6, tumor necrosis factor (TNF)-α, IL-10, and transforming growth factor (TGF)-β in the colon tissues of DSS + Glu and DSS + Fru groups versus those of the DSS group, as determined using real-time PCR. Data values are presented as the mean ± standard deviation (±SD). DSS group (light blue square), DSS + Glu group (light green square), DSS + Fru group (dark green square). Each p-value in the figure: DSS group vs. other groups. DSS, dextran sulfate sodium; DSS group, DSS-induced experimental colitis rats fed AIN-93G; DSS + Glu group, DSS-induced experimental colitis rats fed a glucose-excessive diet; DSS + Fru group, DSS-induced experimental colitis rats fed a fructose-excessive diet. ** p < 0.05 (DSS + Glu group vs. DSS + Fru group).
2.7. Clinical Chemistry Parameter Measurement in Serum of Experimental Rats
Twenty clinical chemistry parameters were measured in the serum of experimental rats. Serum ALB and T-CHO, the indices of nutritional status, were slightly lower in DSS + Glu and DSS + Fru groups than those in the DSS group, whereas blood Glu levels were increased in DSS + Glu gr mice (Table 1). Interestingly, the indices of liver function (AST, ALT, ALP, and LDH) and renal function (BUN and CRE) were elevated in the DSS + Glu and DSS + Fru groups (Table 1).
3. Materials and Methods
3.1. Ethics Statement
All animal experiments complied with ARRIVE guidelines (Animal Research: Reporting of In Vivo Experiments) and were approved by the Animal Experiment Committee of Kyoto Tachibana University (permission number: 22-07).
3.2. Animals
Because this study requires a sufficient amount of serum and colon tissue samples for analysis, rats were employed as experimental animals. Wild-type Wistar rats (male, 9-week-old, 220–250 g/rat) were obtained from Shimizu Laboratory Supplies Co., Ltd. (Kyoto, Japan). All rats were adapted for approximately one week prior to experimentation with free access to regular diets (AIN-93G, Oriental Yeast Co., Ltd., Tokyo, Japan) and water. During the experiments, animals were housed in individual sawdust-lined plastic cages under controlled temperature (22 °C) and humidity (60%) conditions, with day–night cycles regulated with artificial light (12/12 h).
3.3. Reagents
DSS salt (molecular weight: 36,000–50,000) was obtained from Wako Pure Chemical Industries, Ltd. (Tokyo, Japan). The PRO-PREPTM Protein Extraction Solution (Cell/Tissue), Anti-neutrophil elastase (NE), IgG, and IL-6 PicoKineTM, IL-1β, and TNF-α enzyme-linked immunosorbent (ELISA) kits were obtained from Cosmo Bio Co., Ltd. (Tokyo, Japan). TRIzol™ reagent, SuperScript™ II Reverse Transcriptase, PowerUp SYBR Green Master Mix, and all primers were obtained from Thermo Fisher Scientific (Waltham, MA, USA). All other reagents were procured from Wakenyaku Co., Ltd. (Kyoto, Japan), Nacalai Tesque Co., Ltd. (Kyoto, Japan), and Bio-Rad Laboratories, Inc. (Hercules, CA, USA). Diets comprising excess Glu and Fru were purchased from Oriental Yeast Co., Ltd. The nutritional composition of these diets was based on previous reports [20], and the components are shown in Table 2.

Table 2.
Content and composition of experimental diets.
3.4. Protocol for Animal Experiments
To establish an experimental model of UC, Wistar rats were orally administered 3% DSS in distilled water for 14 days. UCR were divided into three groups (DSS, DSS + Glu, and DSS + Fru groups; N = 6 each) and fed the respective diets (AIN-93G, Glu diet, and Fru diet, respectively). During the experimental period, the body weight, remaining diet, and remaining 3%DSS were measured every morning for each rat, and disease activity index (DAI) scores were estimated based on criteria shown in Table 3 [21]. On day 14 of the experiment protocol, rats were anesthetized, and blood samples (3 mL/rat) were collected via intracardiac puncture. The large colon was quickly removed, and its length was measured. Subsequently, specimens were fixed in 10% formalin/0.1 M phosphate buffer (pH 7.4) for histological assessments and embedding in paraffin. Protein and mRNA in residual unfixed tissues were extracted and measured as described below.

Table 3.
Criteria used for disease activity index (DAI) scoring.
3.5. Microscopic Examination of Harvested Rectal Tissues
For UCR, rectal tissues exhibiting signs of severe inflammation were examined microscopically. Briefly, 3 µm thick tissue sections were prepared from the rectal tissues of all rats and stained with hematoxylin and eosin (H&E). Tissue damage was evaluated using the histopathologic index score (HIS) and assessed based on H&E staining; the extent of damage was scored based on established criteria on a scale of 0–7 (Table 4) [22]. Neutrophil NE expression was detected via immunohistochemical (IHC) staining with diaminobenzidine (DAB) using anti-NE IgG, as described previously [23]. Images were obtained using a BIOREVO BZ-9000 microscope (Keyence Co., Ltd., Osaka, Japan).

Table 4.
Criteria used for scoring the severity of damage.
3.6. Sample Preparation for the Protein Assay
The large intestines harvested from each experimental animal were weighed independently. Then, 300 mg of each sample was incubated in 0.5 mL PRO-PREPTM Protein Extraction Solution (Cell/Tissue) for 10 min, followed by centrifugation at 12,000 rpm for 10 min at 4 °C. The resultant supernatants were transferred into 1.5 mL polycarbonate tubes and stored at −80 °C until use.
3.7. Sample Preparation for the mRNA Assay
Briefly, 300 mg of each tissue was independently incubated in 1.0 mL TRIzol™ reagent for 10 min and then centrifuged at 12,000 rpm for 15 min at 4 °C. mRNA was extracted from each sample according to the manufacturer’s protocol and treated with 8 M LiCl to avoid the influence of DSS on RNA reverse transcription. cDNA was synthesized from mRNA using SuperScript II Reverse Transcriptase, according to the manufacturer’s instructions.
3.8. ELISA
IL-6, IL-1β, and TNF-α levels in each sample were measured using respective ELISA kits in accordance with the manufacturer’s instructions. The absorbance of the reaction was measured at 450 nm using a microplate reader (Bio-Rad Laboratories, Inc.). Cytokine levels in the large intestine were converted to concentrations per gram of tissue.
3.9. Real-Time PCR
Real-time PCR was performed using the StepOnePlus Real-Time PCR System (Thermo Fisher Scientific), as previously described [23]. The primers used were as follows: IL-1β forward, 5′-CACCTCTCAAGGAGAGCACAGA-3, L-1β reverse, 5′-CACCTCTCAAGGAGAGCACAGA-3′ (81 bp); IL-6 forward, 5′-ATATGTTCTCAGGGAGATCTTGGAA-3, IL-6 reverse, 5′-GTGCATCATCGCTGTTCATACA-3′ (80 bp); IL-10 forward, 5′-GCCAAGCCTTGTCAGAAATGA-3, IL-10 reverse, 5′-TTTCTGGGCCATGGTTCCTCT-3′ (75 bp); TNF-α forward, 5′-GTGATCGGTCCCAACAAGGA-3, TNF-α reverse, 5′-AGGGTCTGGGCCATGGAA-3′ (71 bp); transforming growth factor (TGF)-β forward, 5′-ACCTGCAAGACCATCGACATG-3, TGF-β reverse, 5′-CGAGCCTTAGTTTGGACAGGAT-3′ (85 bp); and β-act forward, 5′-TGTGTTGTCCCTGTATGCCTCTG-3, β-act reverse, 5′-ATAGATGGGCACATGGTGGGTG-3′ (85 bp).
3.10. Clinical Chemistry Parameters Examined in Rat Serum
Twenty clinical chemistry parameters were analyzed in rat serum by the Nagahama Life Science Laboratory of Oriental Yeast Co., Ltd. Equal amounts of serum from rats in each group (N = 6) were mixed, and individual differences among samples were averaged. Measurements were performed using an automated analyzer (JCA-BM6050; JEOL Ltd., Tokyo, Japan). The following serum parameters were measured: total protein (TP), albumin (ALB), blood Glu, urea nitrogen (BUN), creatinine (CRE), uric acid (UA), iron (Fe), aspartate aminotransferase (AST), alanine aminotransferase (ALT), alkaline phosphatase (ALP), and lactate dehydrogenase (LDH), amylase (AMY), creatine kinase (CK), γ-glutamyltranspeptidase (γ-GT), cholinesterase (ChE), lipase (Lip), total cholesterol (T-CHO), neutral fat (Triglycerides [TG]), low-density lipoprotein cholesterol (LDL-C), and high-density lipoprotein cholesterol (HDL-C).
3.11. Statistical Analysis
Pairwise comparisons with the control group were performed using non-parametric tests. The Mann–Whitney U test was performed to identify significant differences between groups. Data are presented as mean ± standard deviation (SD). A p-value of <0.05 was deemed statistically significant.
4. Discussion
In the present study, we examined the effects of diets containing excess Glu or Fru on the pathogenesis of experimental colitis in rodents. Colitis appeared somewhat more severe in rats fed these special diets than in those fed normal diets; however, there were no significant differences in DAI scores, colon length, or the microscopic examination of the colon between the DSS + Glu and DSS + Fru groups. Considering the daily feed and 3% DSS intake, the excess Fru diet tended to be consumed less than the other diets, and the intake of 3% DSS was also reduced. Typically, Fru appears to be sweeter than Glu, and its growing use in food products remains a growing concern [24]. Herein, the rats probably disliked the overly sweet taste of the excessive Fru diet. Conversely, the DSS-Glu rats preferred to feed on excess Glu, potentially suppressing their weight loss during the early period of the experiment. In fact, it has been reported that rats tend to dislike Fru because it is too sweet and prefers Glu rather than Fru [25,26]; hence, our results would be valid. However, the DSS-Glu and DSS-Fru group exhibited more severe colitis than the DSS group despite the lower 3% DSS intake. Overall, both Gru and Fru may be risk factors for UC, causing more severe colitis. Therefore, it would be desirable to reduce the intake of these monosaccharides when considering a dietary therapy to combat UC.
Reportedly, 10% of patients with IBD experience worsening symptoms, such as abdominal pain, after a meal containing excessive sugar [27]. Previously, Fru was found to be more detrimental in fundamental experiments when mouse colitis models were fed diets rich in Glu or Fru [19]. Statistically, a positive correlation has been noted between Fru intake and the risk of worsening IBD [27]; therefore, the type of sugar remains one of the most important factors. In particular, excessive Fru intake may destabilize the intestinal microbiota balance and consequently impair the intestinal barrier [20]. This function may lead to the activation and infiltration of neutrophils, which may further accelerate the induction of other immune cells by actively secreting pro-inflammatory cytokines. Our experimental results also revealed slightly elevated cytokine levels in the serum and colon tissues of the DSS + Fru group compared with those in the other two groups, suggesting that Fru may contribute more to cytokine production and secretion than other dietary components. A previous report said that the induction of Fru promoted proinflammatory cytokine production via reactive oxygen species-mediated nuclear factor-κB signaling in colonic macrophages [28]. Although Glu potentially exerts the same functions as Fru, their effects on the pathogenesis of colitis might be representative of slight differences in OH and CH2OH positions in their chemical structures.
Our research is rare worldwide in that we measured clinical chemistry parameters in rat serum and determined the effects of nutritional status and a diet containing excess Glu and Fru on organs other than the large intestine. Serum levels of ALB and T-CHO were reduced in the DSS + Glu and DSS + Fru groups, suggesting that the imbalance in the dietary composition was reflected in the nutritional status of the rats. This could be attributed to excessive sugar intake aggravating experimental enteritis and causing the malabsorption of nutrients owing to frequent diarrhea, a known symptom of the disease [29]. In addition, the findings of the present study indicated that excessive Glu and Fru intake may aggravate liver and kidney function. Generally, the liver uses Glu to synthesize and store glycogen. Therefore, in the presence of excessive Glu in the body, the synthesis and storage of glycogen becomes more active, overwhelming the liver substantially. Fru is metabolized in the liver via the glycolytic pathway. Excess Fru causes heavy stress on the liver, causing damage and may eventually lead to liver damage. Blood Glu is filtered through the glomeruli of the kidney, with almost all filtered Glu reabsorbed into the blood via the renal tubules. Accordingly, conditions that warrant the daily filtration of large amounts of Glu would burden the kidneys tremendously. Fru intake has been found to stimulate NHE3 activity in kidney proximal tubules and increase the reabsorption of sodium ions, thereby elevating blood pressure [30]. Therefore, in addition to the negative effects of excess Fru on the kidneys, its impact is likely to trigger the development of cardiovascular disease, which is accompanied by an increase in blood pressure. As described above, the daily intake of large amounts of Glu and Fru not only promotes the pathogenesis of colitis but also burdens almost all organs in the body, potentially impairing overall human health.
Our study revealed that excessive intake of Glu or Fru for at least two weeks worsened colitis. However, there was no marked difference in the pathogenesis of colitis among the three groups. Accordingly, altering the DSS concentration might yield more differentiated results. Given that the experimental protocol involving the administration of 3% DSS for two weeks, as in the present study, causes severe colitis, the intake of 1 or 2% DSS might be preferable. We designed a special diet containing a sugar-to-calorie ratio based on previous reports [20], which may have been extremely high. A diet comprising Glu or Fru content of 10–20% of calories would have resulted in a clear difference in disease status. By confirming the effects of special diets on colitis in the short term (within a week) and long term (more than a month) with strict adjustment of DSS concentration, it could determine the best types and amounts of sugars for establishing a dietary therapy for UC. In addition to sugars, the experimental methods for preparing special diets and examining the effects of dietary components on pathological conditions are extremely effective. Given that several gastrointestinal diseases, in addition to UC, warrant dietary restrictions, it is desirable to further explore and develop dietary therapies.
5. Conclusions
The intake of Fru or Glu was associated with worsening experimental colitis in rats. In addition to the induced colitis, excessive sugar intake could contribute to the deterioration of hepatic and renal functions. Although sugars are necessary components of dietary therapy for UC, appropriate types and amounts need to be established.
Author Contributions
K.O. contributed to project administration, funding acquisition, conceptualization, methodology, investigation, formal analysis, and writing of the original draft. K.M. contributed to formal analysis, investigation, visualization, writing, review, and editing. M.A., S.K., K.K., M.D., M.M., R.Y. and J.Y. contributed to formal analysis, investigation, review, and editing. All authors have read and agreed to the published version of the manuscript.
Funding
This study was supported by the Tanuma Green House Foundation (Tokyo, Japan) and the Sugar Industry Association (Tokyo, Japan).
Institutional Review Board Statement
Animal experiments complied with ARRIVE guidelines and were approved by the Animal Experiment Committee of Kyoto Tachibana University (permission number: 22-07).
Informed Consent Statement
Not applicable.
Data Availability Statement
The data presented in this study are available in this article.
Acknowledgments
We would like to thank Nagahama Life Science Laboratory in Oriental Yeast Co., Ltd. for measuring clinical chemistry parameters in the serum of rats.
Conflicts of Interest
The authors declare no conflict of interest.
References
- Marks, D.J.; Segal, A.W. Innate immunity in inflammatory bowel disease: A disease hypothesis. J. Pathol. 2008, 214, 260–266. [Google Scholar] [CrossRef] [PubMed]
- Molodecky, N.A.; Soon, I.S.; Rabi, D.M.; Ghali, W.A.; Ferris, M.; Chernoff, G.; Benchimol, E.I.; Panaccione, R.; Ghosh, S.; Barkema, H.W.; et al. Increasing incidence and prevalence of the inflammatory bowel diseases with time, based on systematic review. Gastroenterology 2012, 142, 46–54. [Google Scholar] [CrossRef]
- Sartor, R.B. Mechanisms of disease: Pathogenesis of Crohn’s disease and ulcerative colitis. Nat. Clin. Pract. Gastroenterol. Hepatol. 2006, 3, 390–407. [Google Scholar] [CrossRef]
- Berends, S.E.; Strik, A.S.; Löwenberg, M.; D’Haens, G.R.; Mathôt, R.A.A. Clinical pharmacokinetic and pharmacodynamic considerations in the treatment of ulcerative colitis. Clin. Pharmacokinet. 2019, 58, 15–37. [Google Scholar] [CrossRef]
- Bibbò, S.; Ianiro, G.; Giorgio, V.; Scaldaferri, F.; Masucci, L.; Gasbarrini, A.; Cammarota, G. The role of diet on gut microbiota composition. Eur. Rev. Med. Pharmacol. Sci. 2016, 20, 4742–4749. [Google Scholar]
- Shen, J.; Zuo, Z.X.; Mao, A.P. Effect of probiotics on inducing remission and maintaining therapy in ulcerative colitis, Crohn’s disease, and pouchitis: Meta-analysis of randomized controlled trials. Inflamm. Bowel Dis. 2014, 20, 21–35. [Google Scholar] [CrossRef] [PubMed]
- Kaur, L.; Gordon, M.; Baines, P.A.; Iheozor-Ejiofor, Z.; Sinopoulou, V.; Akobeng, A.K. Probiotics for induction of remission in ulcerative colitis. Cochrane Database Syst. Rev. 2020, 3, CD005573. [Google Scholar]
- Gravina, A.G.; Pellegrino, R.; Auletta, S.; Palladino, G.; Brandimarte, G.; D’Onofrio, R.; Arboretto, G.; Imperio, G.; Ventura, A.; Cipullo, M.; et al. Hericium erinaceus, a medicinal fungus with a centuries-old history: Evidence in gastrointestinal diseases. World J. Gastroenterol. 2023, 29, 3048–3065. [Google Scholar] [CrossRef]
- Chicco, F.; Magrì, S.; Cingolani, A.; Paduano, D.; Pesenti, M.; Zara, F.; Tumbarello, F.; Urru, E.; Melis, A.; Casula, L.; et al. Multidimensional Impact of Mediterranean Diet on IBD Patients. Inflamm. Bowel Dis. 2021, 27, 1–9. [Google Scholar] [CrossRef]
- Reddavide, R.; Rotolo, O.; Caruso, M.G.; Stasi, E.; Notarnicola, M.; Miraglia, C.; Nouvenne, A.; Meschi, T.; De’Angelis, G.L.; Di Mario, F.; et al. The role of diet in the prevention and treatment of Inflammatory Bowel Diseases. Acta Biomed. 2018, 89, 60–75. [Google Scholar]
- Rondanelli, M.; Lamburghini, S.; Faliva, M.A.; Peroni, G.; Riva, A.; Allegrini, P.; Spadaccini, D.; Gasparri, C.; Iannello, G.; Infantino, V.; et al. A food pyramid, based on a review of the emerging literature, for subjects with inflammatory bowel disease. Endocrinol. Diabetes. Nutr. 2021, 68, 17–46. [Google Scholar] [CrossRef]
- Desai, M.S.; Seekatz, A.M.; Koropatkin, N.M.; Kamada, N.; Hickey, C.A.; Wolter, M.; Pudlo, N.A.; Kitamoto, S.; Terrapon, N.; Muller, A.; et al. A Dietary Fiber-Deprived Gut Microbiota Degrades the Colonic Mucus Barrier and Enhances Pathogen Susceptibility. Cell 2016, 167, 1339–1353.e21. [Google Scholar] [CrossRef] [PubMed]
- Sarbagili-Shabat, C.; Albenberg, L.; Van Limbergen, J.; Pressman, N.; Otley, A.; Yaakov, M.; Wine, E.; Weiner, D.; Levine, A. A Novel UC Exclusion Diet and Antibiotics for Treatment of Mild to Moderate Pediatric Ulcerative Colitis: A Prospective Open-Label Pilot Study. Nutrients 2021, 13, 3736. [Google Scholar] [CrossRef] [PubMed]
- Basaranoglu, M.; Basaranoglu, G.; Bugianesi, E. Carbohydrate intake and nonalcoholic fatty liver disease: Fructose as a weapon of mass destruction. Hepatobiliary Surg. Nutr. 2015, 4, 109–116. [Google Scholar] [PubMed]
- Ma, X.; Nan, F.; Liang, H.; Shu, P.; Fan, X.; Song, X.; Hou, Y.; Zhang, D. Excessive intake of sugar: An accomplice of inflammation. Front. Immunol. 2022, 13, 988481. [Google Scholar] [CrossRef]
- Dey, M.; Cutolo, M.; Nikiphorou, E. Beverages in rheumatoid arthritis: What to prefer or to avoid. Nutrients 2020, 12, 3155. [Google Scholar] [CrossRef]
- Pasqualli, T.; Chaves, P.E.E.; Pereira, L.D.; Serpa, E.A.; de Oliveira, L.F.S.; Machado, M.M. The use of fructose as a sweetener. is it a safe alternative for our immune system? J. Food. Biochem. 2020, 44, e13496. [Google Scholar] [CrossRef]
- Zhang, D.F.; Jin, W.W.; Wu, R.Q.; Li, J.; Park, S.A.; Tu, E.; Zanvit, P.; Xu, J.; Liu, O.; Cain, A.; et al. High glucose intake exacerbates autoimmunity through reactive-Oxygen-Species-Mediated TGF-beta cytokine activation. Immunity 2019, 51, 671–681. [Google Scholar] [CrossRef]
- Khan, S.; Waliullah, S.; Godfrey, V.; Khan, M.A.W.; Ramachandran, R.A.; Cantarel, B.L.; Behrendt, C.; Peng, L.; Hooper, L.V.; Zaki, H. Dietary simple sugars alter microbial ecology in the gut and promote colitis in mice. Sci. Trans. Med. 2020, 12, eaay6218. [Google Scholar] [CrossRef]
- Montrose, D.C.; Nishiguchi, R.; Basu, S.; Staab, H.A.; Zhou, X.K.; Wang, H.; Meng, L.; Johncilla, M.; Cubillos-Ruiz, J.R.; Morales, D.K.; et al. Dietary Fructose Alters the Composition, Localization, and Metabolism of Gut Microbiota in Association with Worsening Colitis. Cell. Mol. Gastroenterol. Hepatol. 2021, 11, 525–550. [Google Scholar] [CrossRef] [PubMed]
- Cooper, H.S.; Murthy, S.N.; Shah, R.S.; Sedergran, D.J. Clinicopathologic study of dextran sulfate sodium experimental murine colitis. Lab. Invest. 1933, 69, 238–249. [Google Scholar]
- Feagan, B.G.; Greenberg, G.R.; Wild, G.; Fedorak, R.N.; Paré, P.; McDonald, J.W.; Dubé, R.; Cohen, A.; Steinhart, A.H.; Landau, S.; et al. Treatment of ulcerative colitis with a humanized antibody to the alpha4beta7 integrin. N. Engl. J. Med. 2005, 352, 2499–2507. [Google Scholar] [CrossRef]
- Okada, K.; Itoh, H.; Kamikubo, Y.; Adachi, S.; Ikemoto, M. Establishment of S100A8 Transgenic Rats to Understand Innate Property of S100A8 and Its Immunological Role. Inflammation 2018, 41, 59–72. [Google Scholar] [CrossRef] [PubMed]
- Rodriguez, L.A.; Madsen, K.A.; Cotterman, C.; Lustig, R.H. Added sugar intake and metabolic syndrome in US adolescents: Cross-sectional analysis of the national health and nutrition examination survey 2005–2012. Public Health Nutr. 2016, 19, 2424–2434. [Google Scholar] [CrossRef] [PubMed]
- Ramirez, I. Is Fructose Sweeter Than Glucose for Rats? Physiol. Behav. 1996, 60, 1299–1306. [Google Scholar] [CrossRef]
- Ackroff, K.; Sclafani, A. Flavor preferences conditioned by sugars: Rats learn to prefer glucose over fructose. Physiol. Behav. 1991, 50, 815–824. [Google Scholar] [CrossRef] [PubMed]
- Lustig, R.H.; Schmidt, L.A.; Brindis, C.D. The toxic truth about sugar. Nature 2012, 482, 27–29. [Google Scholar] [CrossRef]
- Wang, L.; Ji, T.; Yuan, Y.; Fu, H.; Wang, Y.; Tian, S.; Hu, J.; Wang, L.; Wang, Z. High-fructose corn syrup promotes proinflammatory Macrophage activation via ROS-mediated NF-κB signaling and exacerbates colitis in mice. Int. Immunopharmacol. 2022, 109, 108814. [Google Scholar] [CrossRef] [PubMed]
- Fitzpatrick, L.R.; Jenabzadeh, P. IBD and Bile Acid Absorption: Focus on Pre-clinical and Clinical Observations. Front. Physiol. 2020, 11, 564. [Google Scholar] [CrossRef]
- Queiroz-Leite, G.D.; Crajoinas, R.O.; Neri, E.A.; Bezerra, C.N.; Girardi, A.C.; Rebouças, N.A.; Malnic, G. Fructose acutely stimulates NHE3 activity in kidney proximal tubule. Kidney Blood Press. Res. 2012, 36, 320–334. [Google Scholar] [CrossRef] [PubMed]
Disclaimer/Publisher’s Note: The statements, opinions and data contained in all publications are solely those of the individual author(s) and contributor(s) and not of MDPI and/or the editor(s). MDPI and/or the editor(s) disclaim responsibility for any injury to people or property resulting from any ideas, methods, instructions or products referred to in the content. |
© 2023 by the authors. Licensee MDPI, Basel, Switzerland. This article is an open access article distributed under the terms and conditions of the Creative Commons Attribution (CC BY) license (https://creativecommons.org/licenses/by/4.0/).

