Article

Impact of the Gut-Brain Hormonal Axis and Enteric Peptides in the Development of Food Neophobia in Children with Genetically Determined Hypersensitivity to the Bitter Taste

1
Department of Gastroenterology, Hepatology, Nutritional Disorders and Pediatrics, The Children’s Memorial Health Institute, 04-730 Warsaw, Poland
2
Department of Biochemistry, Radioimmunology and Experimental Medicine, The Children’s Memorial Health Institute, 04-730 Warsaw, Poland
3
Department of Gastroenterology, Division of Neurogastroenterology and Motility, Great Ormond Street Hospital, London WC1N 3JH, UK
*
Author to whom correspondence should be addressed.
Gastrointest. Disord. 2022, 4(4), 237-248; https://doi.org/10.3390/gidisord4040023
Submission received: 22 August 2022 / Revised: 19 September 2022 / Accepted: 23 September 2022 / Published: 28 September 2022

Abstract: Objective

The aim of this prospective study was to determine the role of the gut-brain hormonal axis and the effect of the enteric peptides, as well as the role of genetically determined sensitivity to the bitter taste, on the development of child food neophobia (CFN). Methods: 114 children were enrolled in the study: 43 in food neophobia group (FNG), 21 In the control group (CG) and 50 in prospective group (PG). All patients were assessed with the child food neophobia scale (CFNS), underwent an oral 6-propylthiouracil (6-PROP) test, buccal swab for bitter-taste genotyping, anthropometric measurements, and were tested for serum levels of leptin, adiponectin, insulin-like growth factor-1(IGF-1), ghrelin, and neuropeptide Y (NPY), and complete blood count (CBC); measurements were taken from a blood sample after 4 h fasting. Results: Subjects from FNG were more often hypersensitive to bitter taste (6-PROP) than CG (p = 0.001). There was no correlation between the result of genetic analysis and CFNS (p = 0.197), nor the body mass index (BMI) at the age of 18–36 months (p = 0.946) found. Correlation between 6-PRO perception and genotype have not been confirmed (p = 0.064). The score of CFNS was positively related to the serum level of NPY (p = 0.03). BMI percentile was negatively related to serum level of NPY (p = 0.03), but positively related to leptin serum level (p = 0.027). Conclusions: Bitter taste sensitivity to 6-PROP plays an important role in the development of the CFN, but correlation between 6-PROP perception and genotype have not been confirmed. Children with food neophobia due to elevated serum NPY level should be constantly monitored in order to control the nutritional status at a later age.

1. Introduction

According to the literature, up to 40% of young children suffer from feeding disorders, most of them having behavioral factors, including food neophobia, as a dominant issue [1,2,3]. Food neophobia is defined as a reluctance to consume or an unwillingness to try unknown foods [4]. Every human organism displays, to a certain extent, the natural avoidance of new foods. This phenomenon is associated with adaptive evolutionary conditioning. Its role was to protect an organism from the possibility of intoxication with novel, unknown food. In the present times, where food seems to be safe due to our knowledge and technological processing, food neophobia has a negative impact on the variety of food choices, with special concern for meat, fruits, and vegetables [5,6] Consequently, the child’s diet can be unbalanced, lacking in nutrients, and too low or too high in energy.
The mechanism conditioning the onset of food neophobia has not been fully understood. Children’s eating behaviors are influenced by both intrinsic (genetics, age, gender) and environmental (family, peers, community, and society) factors [7]. According to the results of a recent systemic review conducted by Thamara de Oliveira Torres and co-workers, the main factors associated with food neophobia were: parental influence on children’s eating habits, children’s innate preference for sweet and savory flavors, influence of the sensory aspect of the food, parents’ exerting pressure on for the child to eat, parents’ lack of encouragement and/or affection at mealtime, childhood anxiety, and diets with low variety and low nutritional quality [4].
It is known that an infant is born with an innate preference for the sweet taste. Between three and four months of age, it develops a natural preference for the salty and umami tastes [8]. Bitter and sour tastes are difficult and demanding for infants and their acceptance is acquired with time and repeated exposures to the individual foods.
The bitter taste perception is genetically determined, and differs due to the haplotypes generated by three polymorphisms in the region of the gene encoding TAS2R83 receptor [9]. Differences in TAS2R38 bitter taste gene were associated with acceptance of the first complementary food in infants, suggesting a possible involvement in eating behavior at weaning [10]. TAS2R is a member of the bitter taste receptors family and is associated with the sensitivity to taste phenyltiocarbamide (PTC) and 6-propylthiouracil (6-PROP). On this basis, subjects can be divided into tasters (with the strong perception to bitter taste) and non-tasters (with weak or no reaction to PTC or 6-PROP). A 2003 report by Kim et al. shows that the two common haplotypes of the gene (the recessive AVI and the dominant PAV) account for about 85% of the bimodal taste response observed [11]. Composed of 1002 nucleotides, TAS2R38 contains three missense-coding single nucleotide polymorphisms (SNPs) at positions 145 (proline or alanine), 785 (alanine or valine), and 886 (valine or isoleucine). Despite the eight possible amino acid combinations, only six haplotypes have been observed with respect to taste sensitivity: PAV and AVI as the most common, AAI and AAV as rare, PAI and PVI as extremely rare. Typically, individuals with at least one copy of the dominant PAV haplotype have the ability to taste PTC/6-PROP, in contrast to AVI homozygotes which do not, and the rare haplotypes AAI and AAV have been both observed to confer an intermediate sensitivity [12]. Interestingly, people with a particular combination of haplotypes, i.e., AVI/PAV heterozygotes, are more likely to change sensitivity to bitterness 6-PROP over time (gradual decrease in bitterness sensitivity) [13].
Subjects with different taste sensitivities may present diverse responses to the nutrient stimulation, and therefore different metabolic hormone secretions. Increased sensitivity to 6-PROP has been associated with the lower acceptance of green vegetables in children and adults [14]. On contrary, vegetable intake in Japanese preschool children was associated with food neophobia (measured with the Child Food Neophobia Scale, CFNS), but not with 6-PROP sensitivity [15]. Taste sensitivity to 6-PROP was related to the higher BMI z-scores in six-year-old children [16].
The impact of good nutrition early in life can reach far into the future. Knowledge of risk factors for the development of food neophobia may facilitate both an understanding of the problem, and conducting therapy. According to the main finding of Myles S. Faith’s and co-workers’ study, genes play a substantial role in young children’s tendency to avoid new food, accounting for 72% of the variance in this trait. Thus, in the opinion of the authors, genes appear to influence a range of eating patterns that emerge during childhood [17]. To our knowledge, no study to date has explored the influence of genetically determined hypersensitivity to the bitter taste on food neophobia in early childhood. It is also unclear whether food neophobia is associated with poor nutritional status. Food neophobic children may tend to have insufficient calories intake, relative to their energy needs, due to their reluctance to try new food, however data on this topic is lacking. It is also the first study that has explored the correlation between the gut-brain hormonal axis, enteric peptides, and child food neophobia.
Therefore, the aim of our prospective study was to determine the role of the gut-brain hormonal axis and the effects of the enteric peptides, as well as the role of the genetically determined sensitivity to the bitter taste, on the development of child food neophobia and subsequently, its possible association with nutritional status.

2. Results

2.1. Patient Characteristics

Since January 2018 until March 2020 a total of 114 Caucasian children from Poland have been enrolled in the study, including 50 subjects aged 6–8 months (prospective group), 43 patients aged 18–36 months with food neophobia and 21 healthy children in control group aged 18–36 months.
Patients characteristic in terms of CFNS score, BMI (percentile), laboratory results (CBC, serum level of leptin, adiponectin, IGF-1, NPY, ghrelin) are presented in Table 1 and Table 2.
The most frequent diplotypes among all subjects (from both parts of the study) were heterozygous AVI (40.2%) and homozygous PAV (36.6%). Distribution of TAS2R38 diplotype in group of Polish children recruited to the study is presented in Figure 1.

2.2. Comparison of Food Neophobia Groups (FNG) vs. Control Group (CG)

CFNS score in neophobia group was statistically significantly higher than in control group p < 0.001. The Table 3 shows a detailed statistical analysis.
Subjects from the food neophobia group are more often hypersensitive to bitter taste (tasters) than subjects from the control group (Table 4).
No statistically significant differences were found in terms of genotype between the groups (p = 0.919). Detailed data are presented in Table 5.

2.3. Brain-Gut Interaction and the Development of Child Food Neophobia

The analysis of the enteral hormones (children from food neophobia and control groups) showed that food neophobia was positively related to the level of NPY (pg/mL). BMI was negatively correlated to NPY (pg/mL), but positively correlated to leptin (pg/mL) (Table 6).

2.4. Correlation Analysis in the Prospective Group

Kruskal–Wallis tests were performed to analyze the differences between the diplotypes of the subjects in terms of their gut-brain hormones and enteric peptides serum levels. The results of this analysis are statistically insignificant and are presented in Table 7.
The analysis of Pearson’s r correlation was performed between the severity of neophobia (based on CFNS score), BMI (percentile), the level of gut-brain hormones, and enteric peptides of the respondents in the prospective group. The results of these analyses were not statistically significant (Table 8).

2.5. Genotype—Phenotype Correlation

Finally, data of all recruited subjects (n = 114) were investigated. There were no gender (p = 0.353) or anthropometric (p = 0.384) differences in the prevalence of neophobia in children aged 18–36 months. Fisher’s exact test was performed and no correlation between the result of genetic analysis and CFNS score (p = 0.197) or BMI at the age of 18–36 months (p = 0.946) was found. Correlation between 6-PROP perception and genotype (p = 0.064) has not been confirmed. Detailed data are presented in Table 9.
No statistically significant differences were found between the groups PAV+ and PAV− (p = 0.3968) in bitter taste perception to a 6-PROP.

3. Discussion

Childhood is an exceptional period of life for health interventions, as health-related behaviors are being formed, including those correlated to the future prevention of obesity and diet-related diseases. Food neophobia may lead to impaired nutritional status, as well as to limited food preferences. To determine if childhood picky eating or food neophobia is associated with childhood weight status, or with becoming underweight, overweight, or obese later in childhood, Callie et al. conducted a systematic review [18]. No association existed between childhood weight status and food neophobia, and results were unclear for picky eating. The results of our analysis are consistent with those presented by Callie and co-workers. In our study the groups (neophobic vs control) did not differ statistically significantly from each other in terms of anthropometric parameters (p = 0.194). Mean BMI percentile in neophobia group was 38.67 (min. 0.40; max. 92.00) and in control group 47.95 (min. 4.00; max. 85.00).
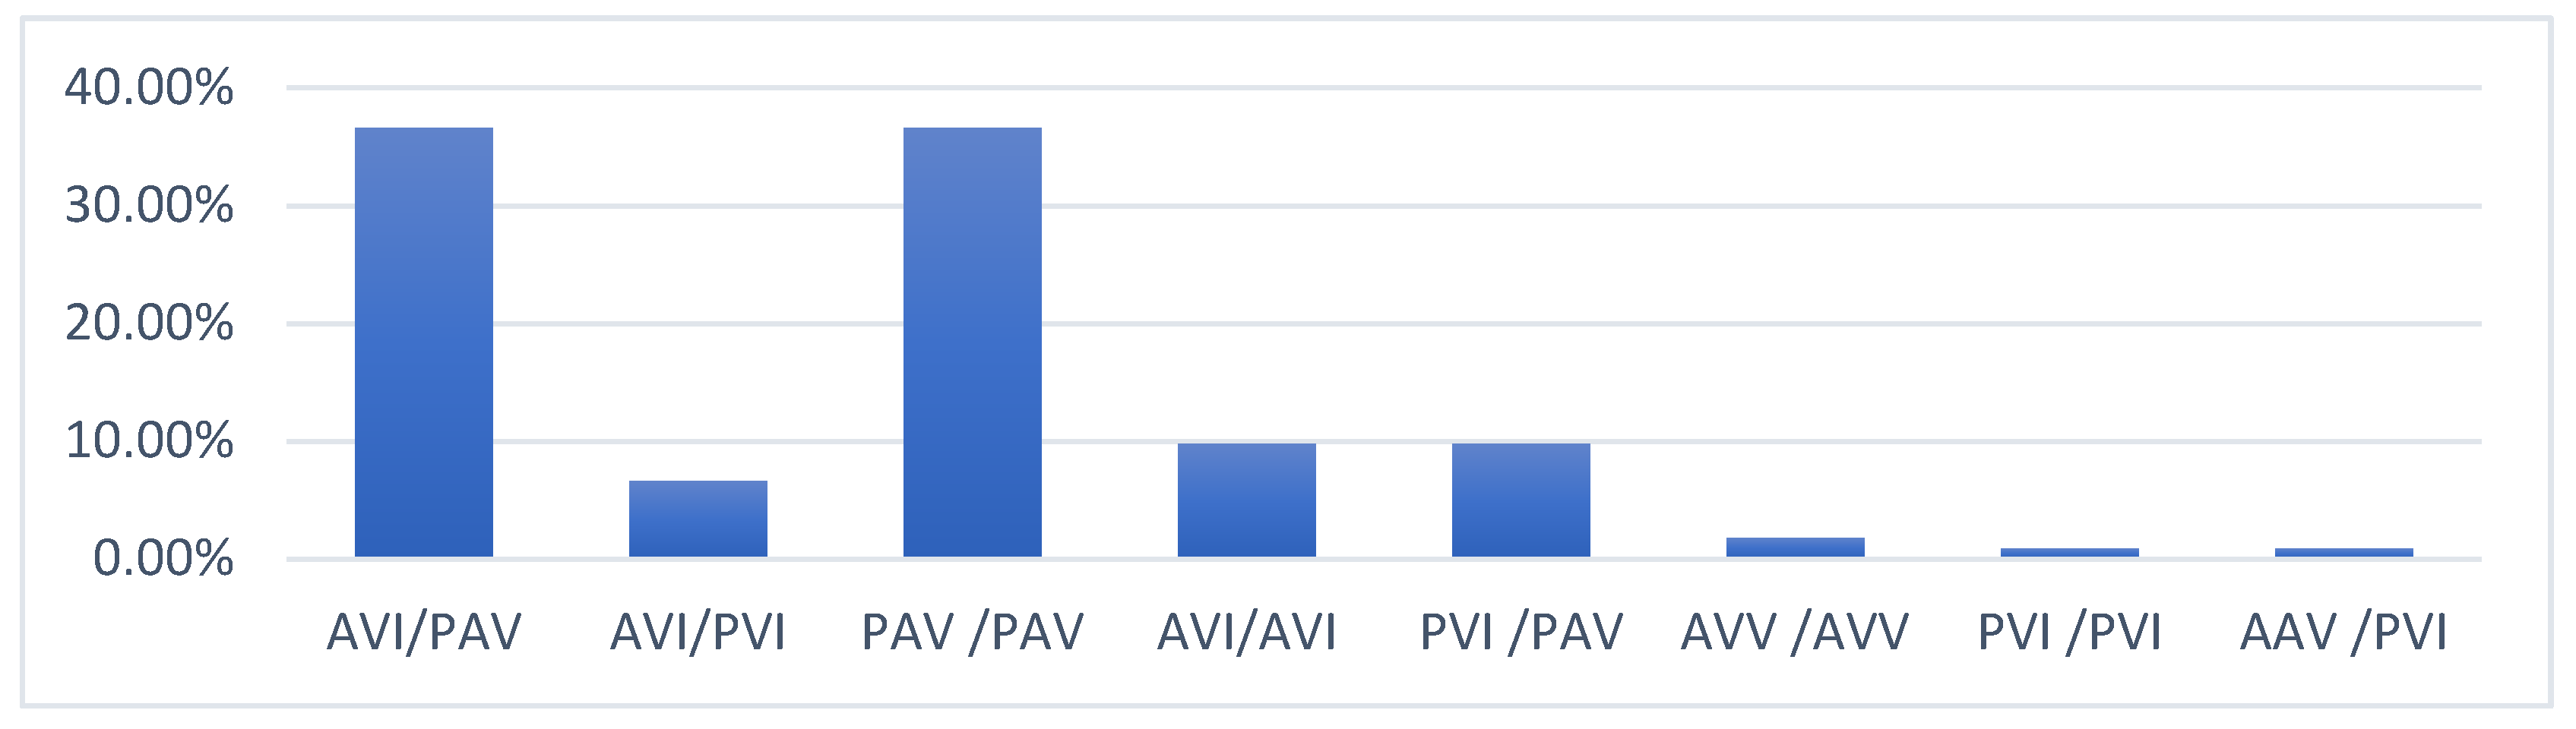
According to the results presented by Boxer et al., the prevalence of the PAV haplotype was 42.3%, AVI 53.1%, AAV 2.5%, AAI 1.2%, PAI 0.8%, and PVI 0.1%. The authors proved that bitter taste sensitivity to PROP exists as a broad range, and not exclusively as non-tasters or medium tasters. The most frequent diplotype among the investigated subjects in our research was heterozygous AVI (40.2%) and homozygous PAV (36.6%). Fewer participants (9.8%) had the AVI homozygous diplotype. The interesting finding of this study is that correlation between 6-PRO perception and genotype was not confirmed in our trial (p = 0.064). Our conclusions should be interpreted in light of study limitations and need to be replicated with a larger sample. The available literature suggests that some children may require additional strategies to accept and consume bitter-tasting fruits and vegetables and that genetic predisposition may be modified by repeated exposure [19].
The important known factors that may indirectly influence feeding difficulties and the course of food neophobia include the diet during pregnancy and lactation, or the mode of food exposure and its repetition [20]. Sensory characteristics have been singled out as one of the most influential determinants of eating behavior, and among these, textures are the main reason for food rejection or acceptance in children, while the sounds accompanying the disintegration of food in the oral cavity, which correlate to the textures, also play a part in acceptance or lack thereof [21]. According to the available data, increased sensitivity to 6-PROP was associated with the lower acceptance of green vegetables by children and adults [14]. Vegetable intake in preschool children was associated with food neophobia (measured with the CFNS), but not with 6-PROP sensitivity [15]. The results of our analysis confirm the role of hypersensitivity to bitter taste in the development of food neophobia. The present findings expand current knowledge about the additional factors associated with the child food neophobia.
It should be noted that bitter sensitivity changes over the lifespan and is affected by the person’s genotype for alleles with the bitter receptor TAS2R38. These developmental sensory changes are most marked for people who have a particular haplotype combination, i.e., AVI/PAV heterozygotes [13].
NPY plays a role in food consumption via various factors: fexample, it has orexigenic effect, triggered by the energy deficiency, resulting in corresponding signalling in the hypothalamus [22]. It stimulates food intake with a preferential effect on carbohydrate intake. In humans and animals, elevated plasma NPY levels were observed in several stress conditions, including exercise, hypoxia, cold exposure, tissue injury, ischemia, and hemorrhagic shock [23]. We found, unexpectedly, that the serum level of NPY in patients with food neophobia was significantly higher than in the control group (p = 0.03). The correlation between the serum level of the other gut-brain hormonal axis and enteric peptides with food neophobia has not been proven. Only a few studies have addressed the impact of gut-brain hormonal axis or enteric peptides on dietary habits. It was shown in previous studies that elevated serum leptin, particularly in obese adult individuals, should be taken as a warning sign of energy imbalance, poor diet, hyperinsulinemia, insulin resistance, or changes in other metabolic risk factors that are strongly associated with cardiovascular disease and type 2 diabetes. Obesity was also associated with increased serum leptin levels and insulin resistance, but the authors emphasize the necessity for further multi-centric studies to prove the possible relationship, which might help devise plans to manage obesity [24]. The function of leptin itself is well documented as a controller of the food intake, energy expenditure, and body weight [25,26]. Wang et al. have shown that leptin and IGF-1 levels are increased in tasters in comparison to non-tasters [27]. Researchers suggested that increased leptin levels may have an impact on the differences in the control of energy homeostasis between tasters and non-tasters.
A group of authors from Wilmington investigated plasma ghrelin and obestatin in children with failure to thrive (FTT) and obesity as compared with age-matched controls. Fasting ghrelin and obestatin levels did not differ significantly in children with FTT [28]. Adiponectin is the richest adipokine in human plasma, and it is mainly secreted from white adipose tissue. Adiponectin circulates in blood as high-molecular, middle-molecular, and low-molecular weight isoforms. Numerous studies have demonstrated its insulin-sensitizing, anti-atherogenic, and anti-inflammatory effects [29]. Lower adiponectin levels are observed in individuals with obesity and those at risk for cardiovascular disease [30]. Adiponectin concentrations were elevated in the infants with eating problems [31]. However, this was a cross-sectional association, therefore the causal relationship needs further investigation.
The cause of developing limited food preferences remains unknown. To our knowledge, this is the first study on the relationship between innate taste sensitivity and the brain-gut interaction and the development of child food neophobia. These data provide further evidence that bitter taste sensitivity to 6-PROP plays an important role in the development of child food neophobia. We have proved that genetic determinants are not enough for the development of food neophobia in children. Additional factors, such as parental influence, are very important [32].
Due to their selective diet, children with neophobia may be at risk of malnutrition. In the light of our research results, due to their elevated serum NPY levels, these groups of children should be checked regularly in order to monitor their nutritional status at an older age, but our results suggest that the food choices of children with food neophobia may be directed towards a higher carbohydrate intake, which may increase the risk of being overweight or obese in the future. Neuropeptide Y has functions that are closely related to appetite regulation and obesity formation [33]. Prospective studies should clarify whether food neophobia at the age of 18–36 months increases the risk of obesity later in life.
The correlation between the gut-brain hormonal axis, enteric peptides, and child food neophobia needs further research.

4. Materials and Methods

4.1. Study Design

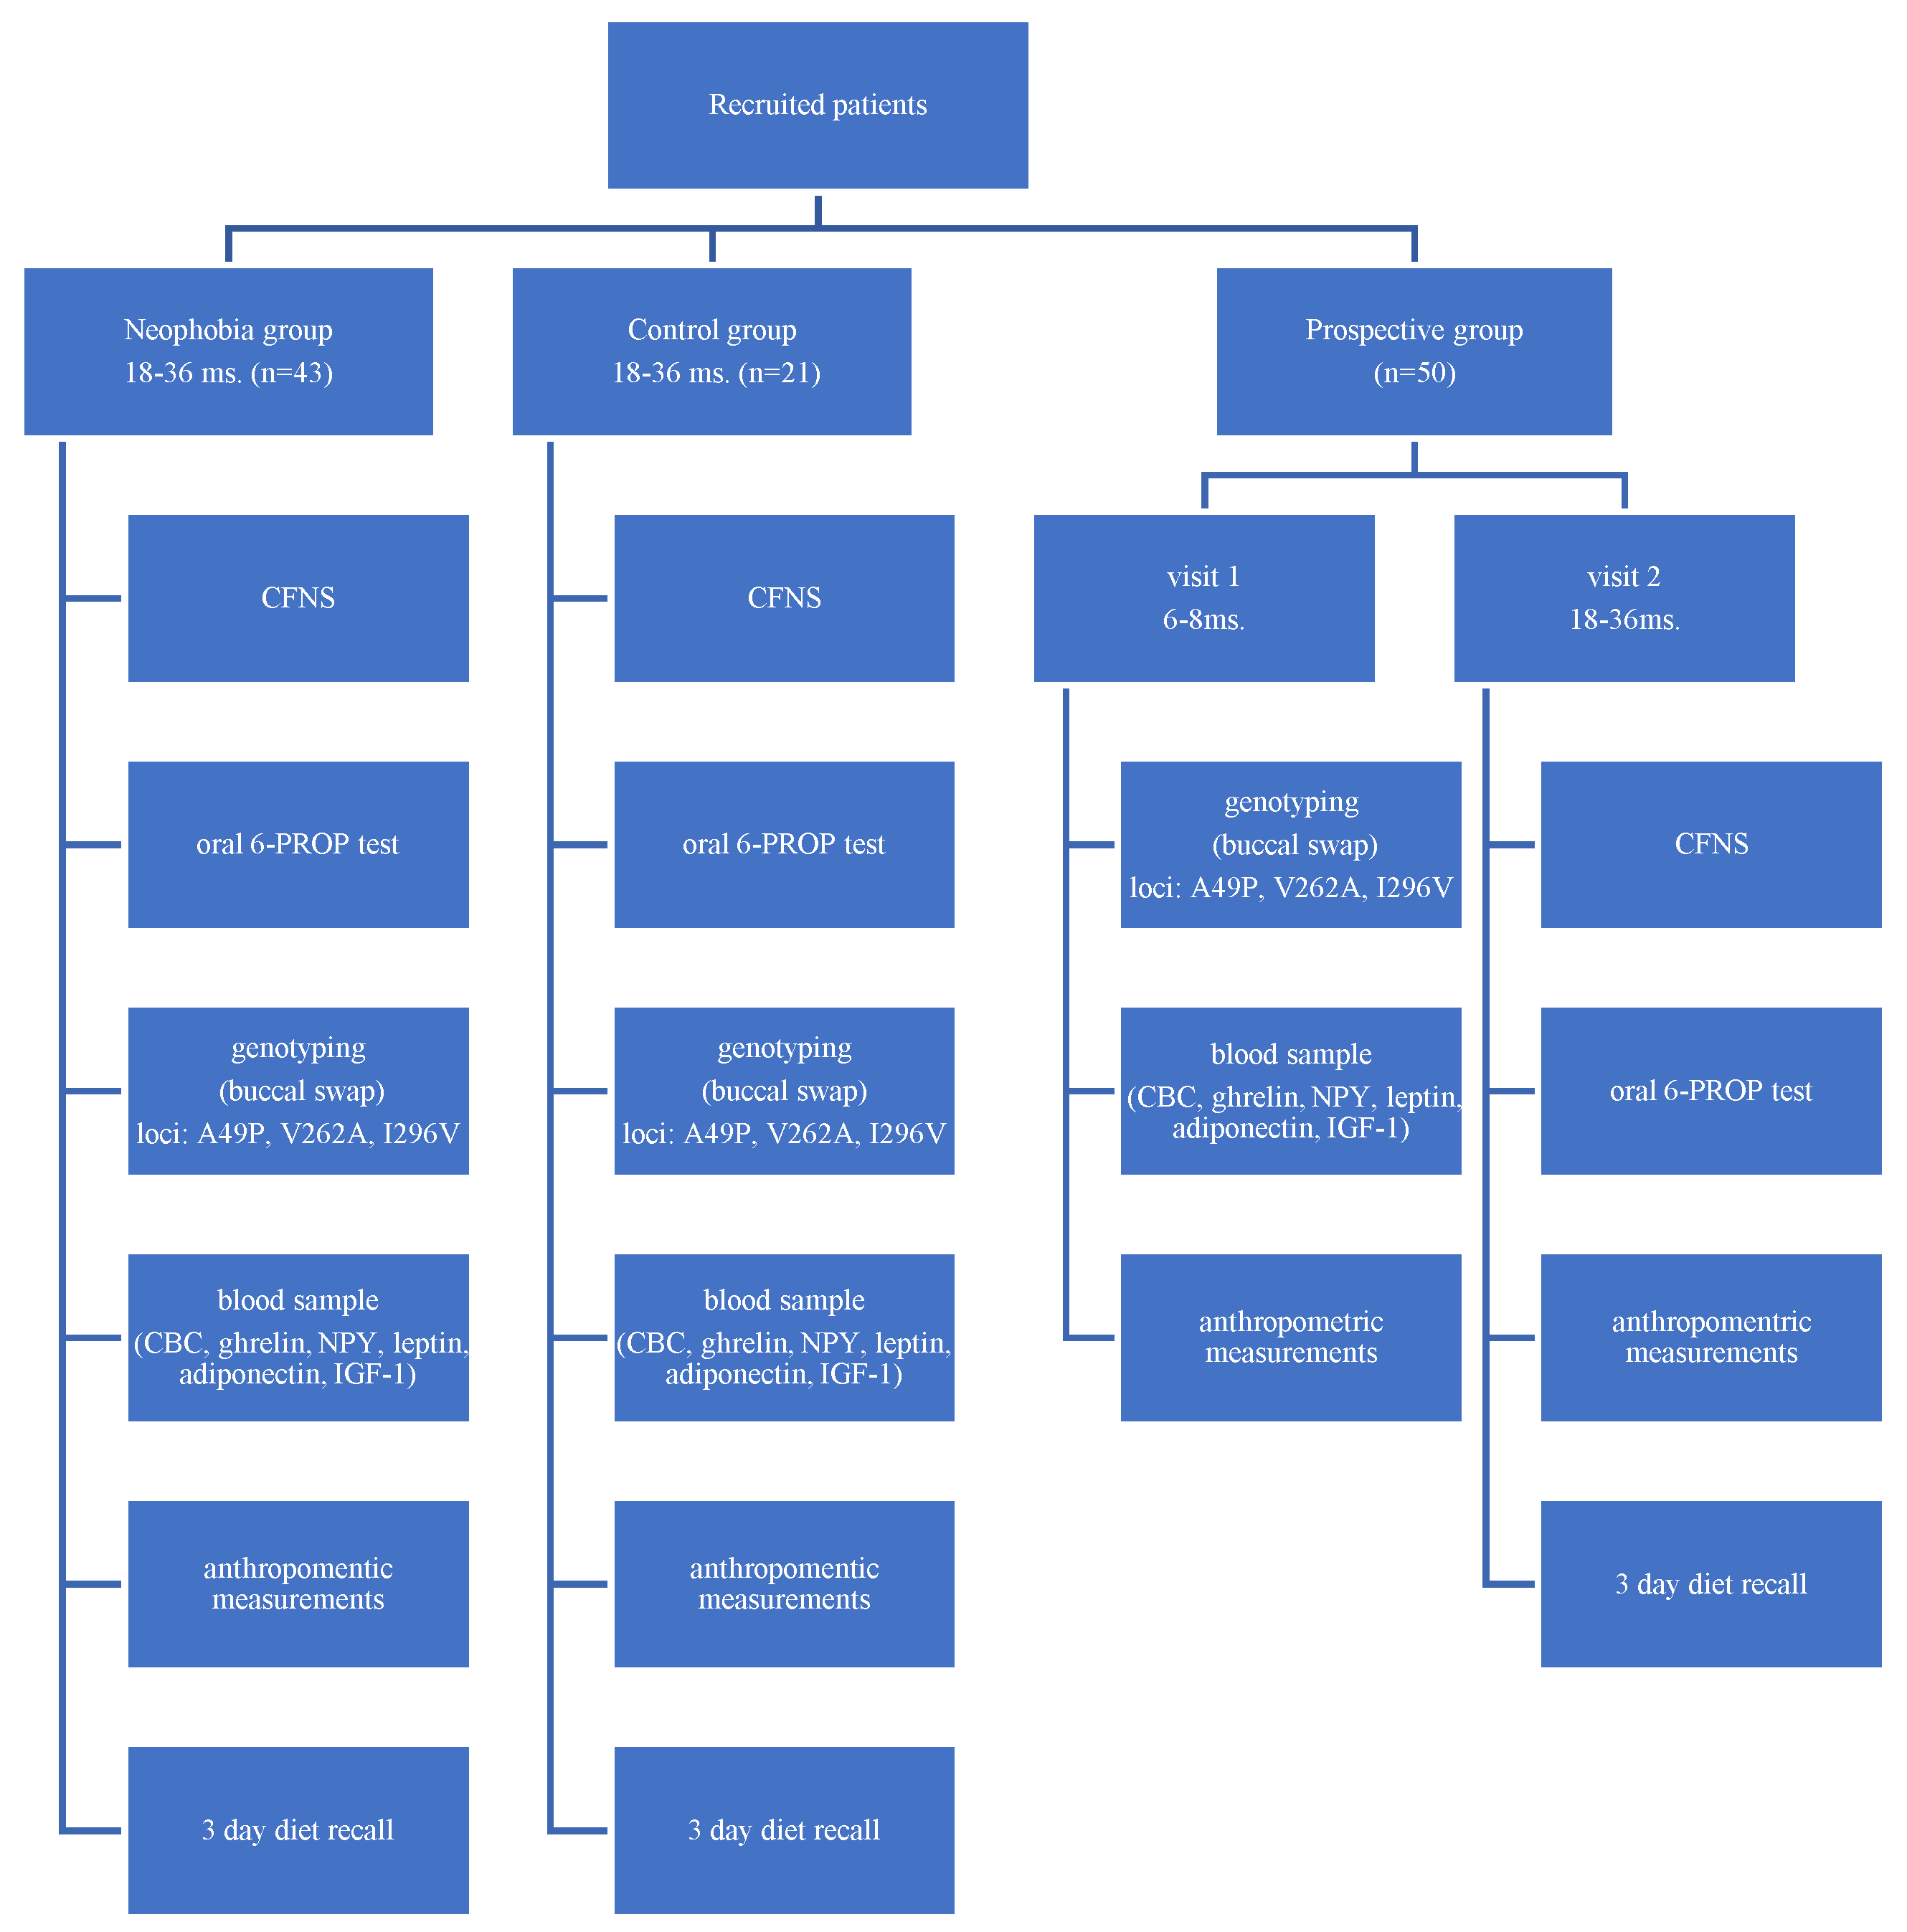
The study had two parts—the first part was performed on children aged 18–36 months with diagnosed food neophobia and their age-matched controls; the second part involved prospective assessment of the infants at 6 months of age, with a follow-up investigation at 18–36 months of age (prospective group). Figure 2 presents the flowchart of study design.
In the first part of study, participants were assessed with the Child Food Neophobia Scale (CFNS) and based on the scale result were classified into two groups: a neophobia group and a control group. Children in the neophobia group were recruited from children referred to our clinic because of a feeding disorder, as well as via self-application through the social media (dedicated Facebook page was created for the purposes of the study). The control group formed children with minor clinical problems, recruited in a local outpatient clinic and via self-application through the social media. Gastrointestinal and metabolic diseases, as well as a failure to thrive, were the exclusion criteria for both, control and neophobia groups. Genotyping for bitter taste sensitivity was performed using buccal swabs for all participants in the study. Furthermore, all patients underwent an oral 6-PROP test, anthropometric measurements, and tests for serum levels of leptin, adiponectin, IGF-1, ghrelin, NPY, and complete blood count (CBC) measurements, from a blood sample after 4 h fasting.
In a parallel study, healthy infants (prospective group) were recruited through a local pediatric outpatient clinic and also through self-application via social media. At the first visit, genotyping for bitter taste sensitivity was performed using buccal swabs, as well as anthropometric measurements, and serum levels of leptin, adiponectin, IGF-1, ghrelin, NPY, and CBC measurements from blood samples after 4 h fasting. During the second visit, participants were assessed with the CFNS, anthropometric measurements, and 6-PROP test for the bitter taste sensitivity. The control visit was done remotely due to the epidemiological situation related to the COVID-19 pandemic.

4.2. Assessment of the Food Neophobia

Information pertaining to child food neophobia was obtained through a parent-reported questionnaire, based on the translation of the Child Food Neophobia Scale (CFNS) [34,35]. The CFNS is a 8-item instrument that assesses the degree of food neophobia or avoidance of new food. The instrument was completed by parents. The CFNS has a range of 8–40, with higher scores reflecting greater amounts of the trait. Each question is answered on a 1–5 Likert scale (Strongly disagree, Disagree, Neither agree nor disagree, Agree, Strongly agree) Table 10.

4.3. Assessment of the Taste Sensitivity

The genetic testing for the three polymorphisms in the region of the gene encoding TAS2R83 receptor was performed (loci: A49P, V262A, I296V) by MEDGEN Medical Center (Warsaw, Poland). On the basis of haplotype distribution, participants were divided into two groups: tasters (with high sensitivity to PROP) and non-tasters (with low bitter sensitivity).
Furthermore, all participants at the age of 18–36 months had an oral N-Propylthiouracil Test Paper, PROP (Precision Laboratories) performed, in order to confirm taste sensitivity. Patients were phenotyped as tasters (symptomatic negative reaction/grimace/crying after contact of the tongue with the test paper) and non-tasters (no reaction to test paper).

4.4. Laboratory Tests

The complete blood count (CBC) was performed using basic laboratory equipment. The level of hormones and peptides responsible for the feeling of satiety (leptin, adiponectin, IGF-1), as well as peptides accountable for the feeling of hunger (NPY, ghrelin) were assessed after 4 h of fasting in all children. The assays were performed using commercial ELISA kits (Cloud-Clone Corp., City of Katy, TX, USA; Labnoratorini medicina a.s., Brno, Czech Republic; Mediagnost, Reutlingen, Germany).

4.5. Ethical Considerations

All the procedures were reviewed and approved by the Independent Review Board (Bioethical Committee Children’s Memorial Health Institute, Approval Number: 204/KBE/2015). Patients’ caregivers gave their written informed consent prior to enrolment in the study.

4.6. Statistical Analysis

Statistical analyzes were carried out using the IBM SPSS Statistics version 26 package. The basic descriptive statistics, chi-square tests of independence, Pearson correlation coefficient r, Spearman’s r correlation analysis rho, Student’s t-tests, and Mann–Whitney tests, as well as Kruskal–Wallis tests, were applied. The level of statistical significance was α = 0.05.

Author Contributions

Conceptualization, A.R. and A.W.; methodology, A.W. and A.R.; validation, A.W., P.S. and A.R.; formal analysis, A.W.; investigation, A.W., K.P., P.M.-S. and D.K.; resources, A.W.; data curation, A.W.; writing—original draft preparation, A.W. and A.R; writing—review and editing, A.W., A.R. and P.S.; supervision, P.S.; project administration, A.W. and P.S.; funding acquisition, A.W. All authors have read and agreed to the published version of the manuscript.

Funding

This research was funded by Nutricia Research Foundation grant number RG 3/2017. The Nutricia Research Foundation had no role in the design and conduct of the study.

Institutional Review Board Statement

The study was conducted in accordance with the Declaration of Helsinki, and approved by the Review Board (Komisja Bioetyczna IP CZD (Approval Number: 204/KBE/2015) for studies involving humans. Patients’ caregivers will give their written informed consent before the start of any procedure.

Informed Consent Statement

Not applicable.

Data Availability Statement

All data supporting the findings of this study are collected in the excel file and are available from the corresponding author on reasonable request.

Acknowledgments

Study sponsored by grant No: RG 3/2017 obtained from the NUTRICIA Foundation. Electronic. The authors would like to thank the patients and the caregivers of patients who participated in this study.

Conflicts of Interest

The authors declare no conflict of interest.

Abbreviations

6-PROP6-propylthiouracil
BMIbody mass index
CFNchild food neophobia
CFNSchild food neophobia scale
IGF-1insulin-like growth factor-1
NPYneuropeptide Y

References

  1. Goday, P.S.; Huh, S.Y.; Silverman, A.; Lukens, C.T.; Dodrill, P.; Cohen, S.S.; Delaney, A.L.; Feuling, M.B.; Noel, R.J.; Gisel, E.; et al. Pediatric Feeding Disorder: Consensus Definition and Conceptual Framework. J. Pediatr. Gastroenterol. Nutr. 2019, 68, 124–129. [Google Scholar] [CrossRef] [PubMed]
  2. Milano, K.; Chatoor, I.; Kerzner, B. A Functional Approach to Feeding Difficulties in Children. Curr. Gastroenterol. Rep. 2019, 21, 51. [Google Scholar] [CrossRef] [PubMed]
  3. Białek-Dratwa, A.; Szczepańska, E.; Szymańska, D.; Grajek, M.; Krupa-Kotara, K.; Kowalski, O. Neophobia—A Natural Developmental Stage or Feeding Difficulties for Children? Nutrients 2022, 14, 1521. [Google Scholar] [CrossRef]
  4. Torres, T.D.O.; Gomes, D.R.; Mattos, M.P. Factors associated with food neophobia in children: Systematic review. Rev. Paul. Pediatr. 2021, 39, e2020089. [Google Scholar] [CrossRef] [PubMed]
  5. Cooke, L.; Wardle, J.; Gibson, E.L. Relationship between parental report of food neophobia and everyday food consumption in 2–6-year-old children. Appetite 2003, 41, 205–206. [Google Scholar] [CrossRef]
  6. Dovey, T.M.; Staples, P.A.; Gibson, E.L.; Halford, J.C. Food neophobia and ‘picky/fussy’ eating in children: A review. Appetite 2008, 50, 181–193. [Google Scholar] [CrossRef]
  7. Łoboś, P.; Januszewicz, A. Food neophobia in children. Pediatr. Endocrinol. Diabetes Metab. 2019, 25, 150–154. [Google Scholar] [CrossRef]
  8. Polin, R.A.; Fox, W.W.; Abman, S.H. Fetal and Neonatal Physiology: Expert Consult (2-Volume Set); Elsevier Health Sciences: North York, ON, Canada, 2011. [Google Scholar]
  9. Smail, H.O. The roles of genes in the bitter taste. AIMS Genet. 2019, 6, 88–97. [Google Scholar] [CrossRef]
  10. Cont, G.; Paviotti, G.; Montico, M.; Paganin, P.; Guerra, M.; Trappan, A.; Demarini, S.; Gasparini, P.; Robino, A. TAS2R38 bitter taste genotype is associated with complementary feeding behavior in infants. Genes Nutr. 2019, 14, 13. [Google Scholar] [CrossRef]
  11. Kim, U.K.; Jorgenson, E.; Coon, H.; Leppert, M.; Risch, N.; Drayna, D. Positional cloning of the human quantitative trait locus underlying taste sensitivity to phenylthiocarbamide. Science 2003, 299, 1221–1225. [Google Scholar] [CrossRef]
  12. Boxer, E.; Garneau, N. Rare haplotypes of the gene TAS2R38 confer bitter taste sensitivity in humans. Springerplus 2015, 4, 505. [Google Scholar] [CrossRef] [PubMed]
  13. Mennella, J.A.; Pepino, M.Y.; Duke, F.F.; Reed, D.R. Age modifies the genotype-phenotype relationship for the bitter receptor TAS2R38. BMC Genet. 2010, 11, 60. [Google Scholar] [CrossRef] [PubMed]
  14. Negri, R.; Di Feola, M.; Di Domenico, S.; Scala, M.G.; Artesi, G.; Valente, S.; Smarrazzo, A.; Turco, F.; Morini, G.; Greco, L. Taste perception and food choices. J. Pediatr. Gastroenterol. Nutr. 2012, 54, 624–629. [Google Scholar] [CrossRef] [PubMed]
  15. Tsuji, M.; Nakamura, K.; Tamai, Y.; Wada, K.; Sahashi, Y.; Watanabe, K.; Ohtsuchi, S.; Ando, K.; Nagata, C. Relationship of intake of plant-based foods with 6-n-propylthiouracil sensitivity and food neophobia in Japanese preschool children. Eur. J. Clin. Nutr. 2012, 66, 47–52. [Google Scholar] [CrossRef]
  16. Lumeng, J.C.; Cardinal, T.M.; Sitto, J.R.; Kannan, S. Ability to taste 6-n-propylthiouracil and BMI in low-income preschool-aged children. Obesity 2008, 16, 1522–1528. [Google Scholar] [CrossRef]
  17. Faith, M.S.; Heo, M.; Keller, K.L.; Pietrobelli, A. Child food neophobia is heritable, associated with less compliant eating, and moderates familial resemblance for BMI. Obesity 2013, 21, 1650–1655. [Google Scholar] [CrossRef]
  18. Brown, C.L.; Vander Schaaf, E.B.; Cohen, G.M.; Irby, M.B.; Skelton, J.A. Association of Picky Eating and Food Neophobia with Weight: A Systematic Review. Child. Obes. 2016, 12, 247–262. [Google Scholar] [CrossRef]
  19. De Cosmi, V.; Scaglioni, S.; Agostoni, C. Early Taste Experiences and Later Food Choices. Nutrients 2017, 9, 107. [Google Scholar] [CrossRef]
  20. Spahn, J.M.; Callahan, E.H.; Spill, M.K.; Wong, Y.P.; Benjamin-Neelon, S.E.; Birch, L.; Black, M.M.; Cook, J.T.; Faith, M.S.; Mennella, J.A.; et al. Influence of maternal diet on flavor transfer to amniotic fluid and breast milk and children’s responses: A systematic review. Am. J. Clin. Nutr. 2019, 109, 1003S–1026S. [Google Scholar] [CrossRef]
  21. Cappellotto, M.; Olsen, A. Food Texture Acceptance, Sensory Sensitivity, and Food Neophobia in Children and Their Parents. Foods 2021, 10, 2327. [Google Scholar] [CrossRef]
  22. Shende, P.; Desai, D. Physiological and Therapeutic Roles of Neuropeptide Y on Biological Functions. Cell Biol. Transl. Med. 2019, 7, 37–47. [Google Scholar]
  23. Yi, M.; Li, H.; Wu, Z.; Yan, J.; Liu, Q.; Ou, C.; Chen, M. A Promising Therapeutic Target for Metabolic Diseases: Neuropeptide Y Receptors in Humans. Cell. Physiol. Biochem. 2018, 45, 88–107. [Google Scholar] [CrossRef]
  24. Kumar, R.; Mal, K.; Razaq, M.K.; Magsi, M.; Memon, M.K.; Memon, S.; Afroz, M.N.; Siddiqui, H.F.; Rizwan, A. Association of Leptin With Obesity and Insulin Resistance. Cureus 2020, 12, e12178. [Google Scholar] [CrossRef] [PubMed]
  25. Friedman, J.M. Leptin and the endocrine control of energy balance. Nat. Metab. 2019, 1, 754–764. [Google Scholar] [CrossRef] [PubMed]
  26. Obradovic, M.; Sudar-Milovanovic, E.; Soskic, S.; Essack, M.; Arya, S.; Stewart, A.J.; Gojobori, T.; Isenovic, E.R. Leptin and Obesity: Role and Clinical Implication. Front. Endocrinol. 2021, 12, 585887. [Google Scholar] [CrossRef] [PubMed]
  27. Wang, R.; Van Keeken, N.M.A.; Siddiqui, S.; Dijksman, L.; Maudsley, S.; Derval, D.; Van Dam, P.S.; Martin, B. Higher TNF-α, IGF-1, and Leptin Levels are Found in Tasters than Non-Tasters. Front. Endocrinol. 2014, 5, 125. [Google Scholar] [CrossRef]
  28. Wali, P.; King, J.; He, Z.; Tonb, D.; Horvath, K. Ghrelin and obestatin levels in children with failure to thrive and obesity. J. Pediatr. Gastroenterol. Nutr. 2014, 58, 376–381. [Google Scholar] [CrossRef]
  29. Choi, H.M.; Doss, H.M.; Kim, K.S. Multifaceted Physiological Roles of Adiponectin in Inflammation and Diseases. Int. J. Mol. Sci. 2020, 21, 1219. [Google Scholar] [CrossRef]
  30. Okauchi, Y.; Kishida, K.; Funahashi, T.; Noguchi, M.; Ogawa, T.; Ryo, M.; Okita, K.; Iwahashi, H.; Imagawa, A.; Nakamura, T.; et al. Changes in Serum Adiponectin Concentrations Correlate with Changes in BMI, Waist Circumference, and Estimated Visceral Fat Area in Middle-Aged General Population. Diabetes Care 2009, 32, e122. [Google Scholar] [CrossRef]
  31. Lähdeaho, M.-L.; Ukkola, O.; Jokela, M.; Huhtala, H.; Knip, M.; Kesäniemi, Y.A.; Kuusela, A.-L. Peptide hormones in infants with feeding disorders. Scand. J. Clin. Lab. Investig. 2013, 73, 387–391. [Google Scholar] [CrossRef]
  32. Marlow, C.S.; Forestell, C.A. The effect of parental food neophobia on children’s fruit and vegetable consumption: A serial mediation model. Appetite 2022, 172, 105942. [Google Scholar] [CrossRef] [PubMed]
  33. Wu, Y.; He, H.; Cheng, Z.; Bai, Y.; Ma, X. The Role of Neuropeptide Y and Peptide YY in the Development of Obesity via Gut-brain Axis. Curr. Protein Pept. Sci. 2019, 20, 750–758. [Google Scholar] [CrossRef] [PubMed]
  34. Pliner, P.; Hobden, K. Development of a Scale to Measure the Trait of Food Neophobia in Humans. Appetite 1992, 19, 105–120. [Google Scholar] [CrossRef]
  35. Laureati, M.; Bergamaschi, V.; Pagliarini, E. Assessing childhood food neophobia: Validation of a scale in Italian primary school children. Food Qual. Prefer. 2015, 40, 8–15. [Google Scholar] [CrossRef]
Figure 1. Distribution of TAS2R38 diplotype in group of Polish children recruited to the study.
Gastrointestdisord 04 00023 g001
Figure 2. Flowchart of study design. CBC = complete blood count, 6-PROP = 6-propylthiouracil, CFNS = the child food neophobia scale, NPY = neuropeptide Y, IGF-1 = insulin-like growth factor.
Gastrointestdisord 04 00023 g002
Table 1. Descriptive characteristic of food neophobia and control group.
Food Neophobia Group (n = 43)Control Group (n = 21)
MMeSDMin.Max.MMeSDMin.Max.
CFNS Score30.9831.004.7617.0040.0017.6718.004.098.0024.00
Anthropometric measurements
BMI (percentile)38.6737.0026.840.4092.0047.9548.0025.954.0085.00
Laboratory tests
Adiponectin (μg/mL)19.2319.056.006.9332.9018.3816.406.1911.0029.20
NPY (pg/mL)2599.482556.50728.35571.003974.002203.602322.50806.52476.003466.00
IGF-1 (ng/mL)116.62111.5048.2443.50239.00101.96105.8562.6119.10250.00
Ghrelin (pg/mL)4729.444581.002101.421234.009864.004155.603811.501721.75738.008172.00
Leptin (ng/mL)1.891.222.870.3218.801.531.211.160.204.52
WBC9.759.302.026.5015.909.2610.003.230.8014.00
RBC4.514.460.333.945.454.624.650.234.154.90
HGB12.3012.200.8110.8014.3012.4412.500.6210.9013.40
HTC35.3935.002.4732.0042.0035.7636.001.3533.0038.00
MCV77.7378.002.5373.0083.0077.4778.002.7273.0083.00
PLT342.84339.0076.37201.00509.00340.53339.0059.15275.00459.00
M = mean, Me = median, SD = standard deviation, Min. = minimum, Max. = maximum, CFNS = the Child Food Neophobia Scale, NPY = Neuropeptide Y, IGF-1 = Insulin-like growth factor, WBC = white blood cell, RBC = red blood cell, HGB = hemoglobin, HCT = hematocrit, MCV = mean corpuscular volume, PLT = platelet count.
Table 2. Descriptive characteristic of prospective group (n = 50).
MMeSDMin.Maks.
CFNS Score—v216.8213.009.388.0037.00
Anthropometric measurements
BMI (percentile)—v135.3632.5028.630.4099.00
BMI (percentile)—v236.4232.5027.670.4094.00
Laboratory tests—v1
adiponectin μg/mL22.4822.056.0312.4036.70
NPY pg/mL2623.132756.00758.80841.003891.00
IGF-1 ng/mL63.2455.4034.612.00157.00
ghrelin pg/mL4913.274690.502038.201224.009094.00
leptin ng/mL2.642.061.570.596.83
WBC10.5810.602.506.3017.40
RBC4.494.490.323.705.34
HGB11.6111.700.729.9012.90
HTC34.8834.007.5530.0077.00
MCV88.0476.0078.7167.00540.00
PLT402.15400.50113.24118.00627.00
M = mean, Me = median, SD = standard deviation, Min. = minimum, Max. = maximum, v1 = visit 1, at age of 6–8 months, v2 = visit 2, at age of 18–36 moths, CFNS = the Child Food Neophobia Scale, NPY = Neuropeptide Y, IGF-1 = Insulin-like growth factor, WBC = white blood cell, RBC = red blood cell, HGB = hemoglobin, HCT = hematocrit, MCV = mean corpuscular volume, PLT = platelet count.
Table 3. Comparison between the neophobia group and the control group.
Food Neophobia Group (n = 43)Control Group (n = 21) 95% CI
MSDMSDTpLLULd Cohena
CFNS score30.984.7617.674.0910.97<0.00110.8815.742.92
BMI38.6726.8447.9525.95−1.310.194−23.414.850.35
RBC4.510.334.620.23−1.150.255−0.290.080.35
HGB12.300.8112.440.62−0.610.543−0.590.320.18
HTC35.392.4735.761.35−0.680.497−1.490.730.18
MCV77.732.5377.472.720.330.741−1.331.850.10
PLT342.8476.37340.5359.150.110.914−40.7445.360.03
Leptin1.892.871.531.16
Adiponectin19.236.0018.386.190.520.606−2.444.140.14
NPY2599.48728.352203.60806.521.930.058−13.86805.620.53
IGF-1116.6248.24101.9662.611.010.314−14.2543.580.28
Ghrelin4729.442101.424155.601721.751.060.294−510.641658.320.29
M = mean, SD = standard deviation, CFNS = Child Food Neophobia Scale, WBC = white blood cell, RBC = red blood cell, HGB = hemoglobin, HCT = hematocrit, MCV = mean corpuscular volume, PLT = platelet count, NPY = Neuropeptide Y, IGF-1 = Insulin-like growth factor, LL = lower limit, UL = upper limit.
Table 4. The relationship between the occurrence of food neophobia and hypersensitivity to bitter taste (6-PROP).
6-PROP Taster6-PROP Non-TasterOdds Ratio [95% CI]
N%N%
Food neophobia group1794.4%1748.6%18.00 [2.15–150.40]
Control group15.6%1851.4%
χ2(1) = 10.88; p = 0.001; Vc = 0.45
Table 5. The relationship between the diplotype and the incidence of food neophobia.
Food Neophobia GroupControl Group
N%N%
AVI heterozygous1741.5%942.9%
AVI homozygous24.9%314.3%
PAV homozygous1741.5%419.0%
Other rare diplotypes512.2%523.8%
χ2(3) = 4.75; p = 0.191; Vc = 0.28
Table 6. Correlation between the serum level of the gut-brain hormonal axis and enteric peptides with CFNS score and BMI (percentile) in participants from the first part of the study.
CFNSBMI
Adiponectinr Pearson’s0.120.10
Relevance0.3640.430
NPYr Pearson’s0.28−0.28
Relevance0.0300.030
IGF-1r Pearson’s0.020.17
Relevance0.8700.190
Ghrelinr Pearson’s0.210.02
Relevance0.0970.875
Leptinrho Spearman−0.030.28
Relevance0.8090.027
CFNS = Child Food Neophobia Scale, BMI = body mass index, NPY = Neuropeptide Y, IGF-1 = Insulin-like growth factor.
Table 7. Differences in gut-brain hormones and enteric peptides serum levels depending on the bitter taste sensitivity haplotype in prospective group.
AVI Heterozygous (n = 18)AVI Homozygous
(n = 6)
PAV Homozygous
(n = 19)
Other (n = 5)H(3)pη2
MMeMMeMMeMMe
Adiponectin26.7523.7532.7526.5022.0020.0016.0016.505.000.1720.11
NPY28.643028.5018.832541.5022.182752.0025.202608.003.090.3780.07
IGF-129.2571.3523.0055.1018.8248.1030.8065.206.230.0980.13
Ghrelin25.695190.0029.755289.0021.424308.0025.604272.001.930.5880.04
Leptin25.362.0620.501.8724.322.1526.903.380.710.8710.02
M = mean, Me = median, NPY = Neuropeptide Y, IGF-1 = Insulin-like growth factor.
Table 8. Relationship between serum level of the gut-brain hormones and enteric peptides at the age of weaning and CFNS score at 18–36 months of age and BMI in prospective group.
CFNS ScoreBMI
Visit 1
Age of 6–8 Months
Visit 2
Age of 18–36 Months
Adiponectinr Pearson’s−0.06−0.080.33
Relevance0.7600.6000.073
NPYr Pearson’s−0.16−0.110.00
Relevance0.3870.4430.994
IGF-1r Pearson’s−0.15−0.04−0.07
Relevance0.4200.7870.683
Ghrelinr Pearson’s0.000.020.06
Relevance0.9910.9020.737
Leptinr Pearson’s−0.090.190.23
Relevance0.6220.1880.204
Table 9. Correlation between genotype and bitter taste perception to a 6-PROP.
6-PROP Taster6-PROP Nontaster
N%N%
AVI heterozygous928.1%2444.4%
AVI homozygous13.1%814.8%
PAV homozygous1546.9%1629.6%
Other721.9%611.1%
χ2(3) = 7.22; p = 0.064; Vc = 0.29
Table 10. Child Food Neophobia Scale Questionnaire.
Child Food Neophobia Scale QuestionnaireScore Range
1. My child is constantly sampling new and different foods1–5
2. My child does not trust new foods1–5
3. If my child does not know what is in a food, she/he will not try it1–5
4. My child likes unusual dishes, e.g., from different countries1–5
5. At a party, my child likes to try new foods.1–5
6. My child is not afraid to eat things she/he has never had before1–5
7. My child is very fussy about the foods she/he will eat1–5
8. My child eats everything1–5
TOTAL SCORE8–40
Publisher’s Note: MDPI stays neutral with regard to jurisdictional claims in published maps and institutional affiliations.

