Article

Corrosion Behavior of Electrochemical and Thermal Treated Titanium into Artificial Saliva: Effect of pH and Fluoride Concentration

1
Laboratory of Interaction Materials and Environment (LIME), Mohamed Seddik Ben Yahia University, Jijel 18000, Algeria
2
Departement of Chemistry, University of Jijel, Jijel 18000, Algeria
3
UMR 7246, Divided Materials, Interfaces, Reactivity, Electrochemistry (MADIREL), CNRS, Aix Marseille University, 13013 Marseille, France
*
Author to whom correspondence should be addressed.
Corros. Mater. Degrad. 2025, 6(4), 52; https://doi.org/10.3390/cmd6040052
Submission received: 24 July 2025 / Revised: 29 September 2025 / Accepted: 7 October 2025 / Published: 15 October 2025

Abstract

This work investigates and compare the corrosion behavior in artificial saliva of oxide thin films grown on commercially pure titanium (cp-Ti), via electrochemical oxidation (EO) in sulphate bath at 1 V and thermal treatment (TT) at 450 °C, for durations between 20 min and 4 h. The goal is to determine which method and duration provide the optimal protection for titanium against degradation in dental environment particularly in varying fluoride concentration and acidity. Surface characterizations were performed through morphological and microstructural analysis using scanning electron microscopy (SEM), energy-dispersive X-ray spectroscopy (EDS) and X-ray diffraction (XRD). Electrochemical behavior was conducted in Fusayama-Meyer solution (pH = 6.50 and T = 37 °C) using potentiodynamic polarization curve (PPC) and electrochemical impedance spectroscopy (EIS), under varying pH and fluoride ion concentrations. The results demonstrated that a 3-h duration treatment provided the optimal corrosion resistance for both EO and TT processes. The pH of the environment influenced corrosion performance markedly: both acidic (pH 2.5) and basic (pH 9.0) conditions increased Icorr and decreased Rp, indicating degradation of the passive oxide layer outside neutral conditions. Similarly, increasing fluoride concentrations (1000; 5000; and 12,300 ppm) significantly impaired corrosion resistance. At 12,300 ppm F, untreated Ti showed severe degradation, with EIS revealing the formation of a porous outer layer and a weakened inner barrier layer (Rf = 33 W·cm2 for the outer layer and Rct = 21 kW·cm2 for the barrier layer). In contrast, the TT-treated surface remained highly protective even under these aggressive conditions, with minimal surface damage and the highest resistances for both the outer and the inner layers (Rf = 1610 kW·cm2; Rct = 1583 kW·cm2), significantly outperforming the EO film. These findings highlight the superior performance of thermal oxidation at 450 °C for 3 h as a promising surface treatment for enhancing the corrosion resistance of titanium in fluoride-rich oral environments. Understanding these strategies helps improve the longevity and security of titanium dental implants.

1. Introduction

In recent years, titanium (Ti) and its alloys have been widely used in orthopedics and dentistry as dental implants and brackets [1,2,3,4,5,6], due to their biocompatibility, favorable mechanical properties including compatible Young’s modulus and minimal toxicity [7]. They also exhibit remarkable corrosion resistance in various environments, including the human body, primarily attributed to the formation of a thin passive film predominantly composed of amorphous titanium dioxide (TiO2) [8,9]. The protective efficacy of these passive layers is influenced by their characteristics, such as thickness and structure, as well as the microstructure of the underlying substrate, including grain size [3,10,11]. Consequently, it is imperative to investigate the stability of these oxide films in simulated biological fluids [12,13].
However, the oral environment presents complex and dynamic conditions that can challenge the integrity of the passive film on titanium surfaces. The increasing use of prophylactic dental products to prevent plaque and caries formation has introduced additional variables affecting implant corrosion [14]. Many of these products contain fluoride ions (F) at varying concentrations, such as 200 ppm in mouth rinses, 1000–1500 ppm in toothpastes and 10,000–20,000 ppm in gels [6,15]. Several studies have evaluated the corrosion behavior of Ti and its alloys in media containing fluoride [16,17,18], albumin [19] and bacteria [20,21]. In general, the presence of those species accelerates the corrosion process of these materials. Other factors such as fluctuating pH levels and temperature variations can compromise the corrosion resistance of titanium [15,22]. For instance, acidic conditions and high fluoride concentrations have been shown to destabilize the passive film, leading to increased corrosion rates [23,24,25]. Moreover, the formation of hydrofluoric acid (HF) in low pH environments can further exacerbate the degradation of titanium surfaces [26]. Nakagawa et al. demonstrated a linear correlation between the pH threshold for titanium corrosion and the logarithm of fluoride concentration, indicating that lower pH levels require less fluoride to initiate corrosion [17]. Similarly, Lindholm-Sethson and Ardlin identified distinct corrosion behaviors—passive, nonpassive, and active based on varying fluoride concentrations and pH levels [27].
To enhance the bioactive properties and modify the physicochemical, mechanical, and electrical characteristics of titanium surfaces, various surface treatments have been employed [7,11]. A straightforward approach to create a barrier on the biomaterial surface is to form an oxide layer. Although Ti alloys naturally develop a tightly adherent protective oxide when exposed to air, this layer is not entirely stable. Under specific conditions, such as the presence of high chloride or fluoride concentrations, this oxide layer can be compromised, leading to localized corrosion. To improve corrosion resistance, a denser oxide layer can be developed through thermal oxidation [28,29,30] or anodic oxidation [31,32]. For example, a thermal oxidation at around 600 °C can produce a duplex rutile/anatase TiO2 structure, that results in an enhancement of the corrosion resistance in acidic environments [33]. Surface treatments such as electrochemical anodization have been shown to significantly improve the corrosion resistance of titanium implants. Anodization thickens and stabilizes the oxide layer, reducing corrosion rates by up to 96% when optimized voltages and durations are used (e.g., 15 V produces a compact oxide layer with superior resistance compared to untreated titanium). Such modifications also provide additional functional and esthetic benefits, and are considered simple, cost-effective, and ecologically friendly options for enhancing implant longevity [34,35,36]. Additionally, electrochemical nano-engineering approaches, such as the fabrication of TiO2 nanotubes, have shown promise in improving both corrosion resistance and bioactivity for dentistry [37] or orthopedics applications [38].
Additional surface treatments, such as inducing compressive stresses and refining surface grains, improve the protective oxide layer of titanium alloys. Common techniques include anodizing, plasma electrolytic oxidation (PEO), laser treatment, and protective coatings. These methods increase the thickness, density, and uniformity of the oxide layer, thereby reducing localized corrosion, particularly pitting and crevice corrosion. Recent studies have also shown that the application of composite coatings significantly improves corrosion resistance by further strengthening this protective layer, particularly by increasing its density and homogeneity, which particularly limits localized corrosion [39,40,41,42].
Despite these advancements, there remains a lack of comprehensive studies comparing the effectiveness of different surface treatments, such as thermal and electrochemical oxidation, in mitigating corrosion under varying fluoride concentrations and pH levels. Understanding the interplay between these factors is crucial for optimizing the performance and longevity of titanium-based dental implants. This study aims to investigate the impact of surface treatments, specifically thermal and electrochemical oxidation, on the corrosion behavior of titanium in artificial saliva environments with varying pH levels (ranging from 2.5 to 9) and fluoride concentrations (up to 12,300 ppm). Electrochemical techniques, including Potentiodynamic Polarization and Electrochemical Impedance Spectroscopy (EIS), will be employed to assess the corrosion resistance of treated and untreated titanium samples. The findings will contribute to a better understanding of how surface modifications can enhance the durability of titanium dental implants in fluoride-rich and acidic oral conditions.

2. Materials and Methods

2.1. Preparation of the Samples

Pure titanium bars with a diameter of 15 mm (Mayitr, cp-Ti, ASTM B265, Grade 2) were cut into 3 mm-thick discs with a thickness of about 2 mm and used as working electrodes. The discs were mechanically polished using SiC abrasive paper, progressing from grit 240 to 2500, followed by polishing with a 1 µm alumina suspension. The samples then underwent ultrasonic cleaning in pure ethanol for 5 min and finally dried using compressed air. These untreated samples are referred to as “B” (bare titanium).
Compact TiO2 layers were developed either by thermal treatment (TT) or by electrochemical oxidation (EO) with durations ranging from 20 min to 4 h. For thermal treatment, the samples were annealed ex-situ in air at 450 °C using a standard furnace (Nabertherm, Lilienthal, Germany, 30/3000 °C) with a controlled heating rate of 5 °C/min.

2.2. Electrochemical Oxidation

Electrochemical oxidation is a surface treatment that improves titanium corrosion resistance by creating a dense titanium dioxide (TiO2) layer through anodic polarization in a sulfate electrolyte. The characteristics of this layer depend on the electrolyte used, the manufacturing method, the oxidation time, and the electrical parameters of the process [34]. Starting for previous works made by our group [43], electrochemical oxidation was carried out in a 1 M sodium sulphate solution (Sigma-Aldrich Rectapur, Darmstadt, Germany) using a conventional three-electrode electrochemical cell, at room temperature. The setup included a platinum foil counter electrode, an Ag/AgCl reference electrode (0.2 V vs. NHE), and the pure titanium discs placed in a Teflon electrode holder with a 1 cm2 working surface as working electrodes. Oxidation was conducted at a constant potential of 1 V vs. Ag/AgCl.

2.3. Structural and Morphological Analyses

The crystallographic structure of the samples was assessed using X-ray diffraction (XRD). Patterns were recorded using an X’Pert Philips MPD diffractometer (Malvern Panalytical Company, Worcestershire, UK), equipped with a PANAlytical X’Celerator detector, operating with CuKα radiation (λ = 1.5406 Å). Measurements were conducted over a 2θ range of 20° to 80° at an operating voltage of 40 kV and a current of 30 mA. A scan rate of 0.01°/min was used, providing a good balance between data quality and acquisition time.
The surface morphology of the selected coatings was examined using Scaning Electron Microscopes (SEM) by using the secondary electron detectors. A Philips XL 30 ESEM (Eindhoven, The Netherlands) was employed for general imaging, while a ZEISS Gemini 500 70-04 (Oberkochen, Germany) provided high-magnification images when required. Both microscopes were equipped with an energy-dispersive X-ray Spectroscopy (EDS) system for chemical composition analysis.

2.4. Electrochemical Measurements

Electrochemical corrosion studies were conducted in artificial saliva using a Biologic VSP-300 potentiostat (Seyssinet-Pariset, France). The electrochemical cell configuration was identical to that used for the EO treatment, with either bare or surface-treated titanium acting as the working electrode (exposed area: 1 cm2). The electrolyte used was Fusayama-Meyer artificial saliva (F.M.S), which closely mimics the ionic composition of natural saliva. The formulation included: KCl (0.4 g/L), NaCl (0.4 g/L), CaCl2·2H2O (0.906 g/L), NaH2PO4·2H2O (0.690 g/L), Na2S·9H2O (0.005 g/L) and urea (1 g/L); all purchased from Sigma-Aldrich [44]. The temperature of the electrolyte was maintained at 37 ± 0.5 °C using a thermostatic bath. The initial pH was 6.50. Given that the oral pH can vary between 2 and 11, hydrochloric acid or sodium hydroxide was added to adjust the pH to 2.50 or 9.00, respectively. To assess the effect of fluoride on the corrosion resistance, sodium fluoride was added at concentrations of 1000, 1500 and 12,300 ppm.
All samples were first immersed in the electrolyte for 1 h prior to electrochemical testing to stabilize the open circuit potential (OCP). Electrochemical impedance spectroscopy (EIS) was then conducted over a frequency range from 100 kHz to 10 mHz using an AC perturbation of 10 mV (peak-to-peak) around the OCP. The impedance spectra were analyzed in terms of the real (Z’) and imaginary (Z”) components, as well as the total impedance (|Z|) and phase angle and represented on Nyquist plots. The spectra were fitted on an equivalent electrical circuit model using ZSim 3.30 d software for further analysis. Finally, potentiodynamic polarization curves (PPC) were recorded by scanning the potential from −300 mV/OCP to 1 V vs. reference electrode at a scan rate of 1.0 mV/s. Key electrochemical parameters, such as corrosion current density (Icorr), corrosion potential (Ecorr) and Tafel slopes (ba and bc), and were determined by Tafel’s slope method, using the intersection of the cathodic slope with a line crossing Ecorr. Indeed, with the anodic part under passivation, the Tafel method is not valid. The passivation current density (Ipass) was measured at 1 V, while the polarization resistance (Rp) was determined by analyzing the polarization curve within ±10 mV of the open-circuit potential (EOCP), using the Stern-Geary equation [45]:
R p = β a β c 2.3 I c o r r ( β a + β c )
To ensure reproducibility, all electrochemical measurements were repeated three times. The curves being almost superimposable (the margins of error were around 5% on the extrapolated values, which led to 10% on Rp), only one curve will be presented per experiment.

3. Experimental Results

3.1. Surface Analysis

Three-hour treatments were applied via annealing (TT) and electrochemical oxidation (EO) to produce bulk films. A blue color, visible to the naked eye, appeared on TT samples, while no color change was observed on the EO samples. Surface coloration is directly linked to an optical phenomenon of thin-layer interference (iridescence), the color obtained depending on the thickness of the oxide layer formed and is directly proportional to the temperature or the voltage applied [46]. The blue color should correspond to a thickness of the order of 60 nm, whereas below 30 nm no color is detected by the naked eye. For the same heat treatment conditions as those used in this study (450 °C, 3 h), Velten et al. found a TiO2 thickness around 40 nm [47].
The crystallinity of these samples was analyzed using X-ray diffraction (XRD), with Figure 1 displaying the diffraction patterns for the bare titanium substrate (Figure 1a), the EO-treated sample (Figure 1b) and the TT-treated sample (Figure 1c). The diffractograms are similar, displaying only the peaks corresponding to the titanium substrate (JCPDS 44-1294). However, a slight difference is observed in the TT sample, which shows a shoulder preceding the (002) plan (see the magnification insert in Figure 1). This feature may be attributed to the incorporation of oxygen atoms into the titanium structure, as oxygen is highly soluble in the titanium matrix up to an O/Ti molar ratio of 0.5%. An oxygen-enriched titanium phase can form when oxygen atoms occupy alternate layer of octahedral interstices, causing a significant expansion along with the c-axis, with only a minor modification in the a-axis [48]. The bulk layers produced by either EO or TT remain amorphous, or the crystalline phase is too limited to be detected by our instrumentation in good accordance with previous results [43].

3.2. Morphological Analysis

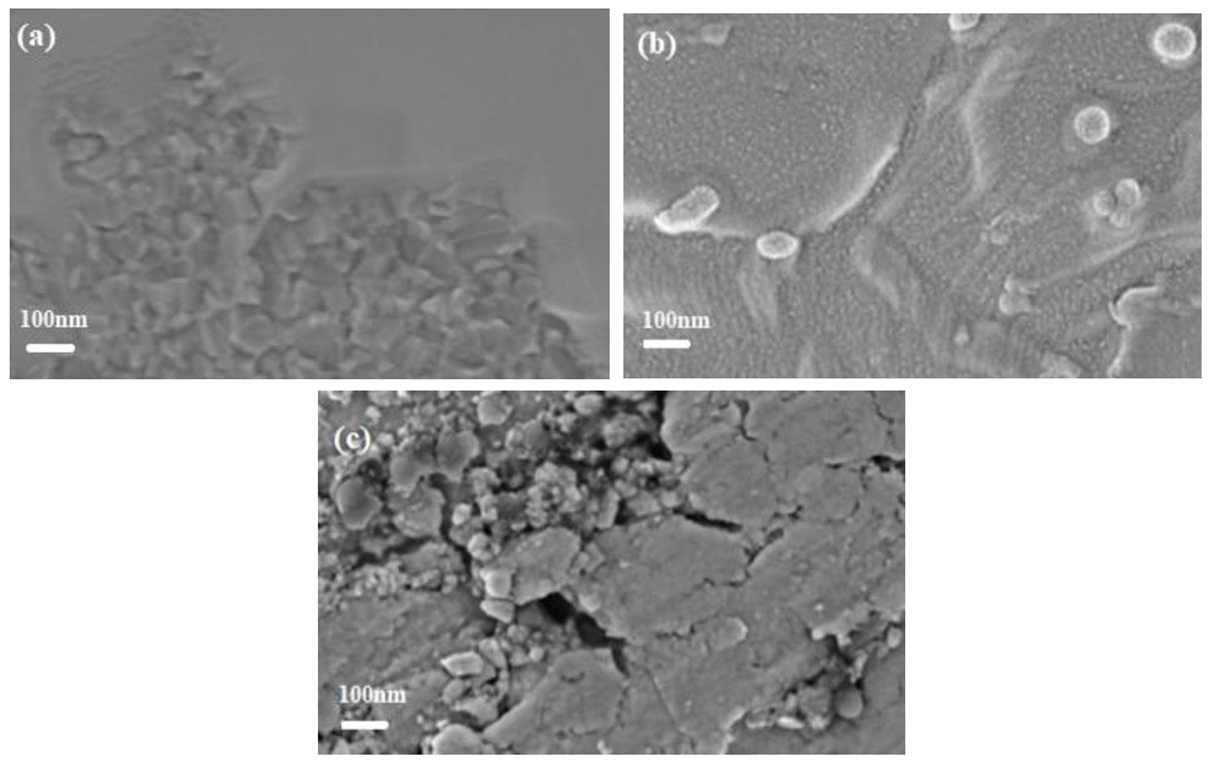
SEM observations with a magnification of 55,000× g, were conducted on the bare titanium (B), TT and EO samples. The titanium surface (Figure 2a) is composed of faceted crystallites approximately 100 nm in size. TT and EO layers (Figure 2b and c respectively) are thin with nanoscale dimensions. The TT surface appears denser and more homogeneous, while the EO surface exhibits some parts with cracks and holes, each around 100 nm or smaller. EDS analysis, performed on the whole surface shown in Figure 2 with an accelerating voltage of 10 kV, is summarised in Table 1. The presence of oxygen on the bare titanium indicates the formation of a thin native oxide layer. Both surface treatments led to an increased concentration of oxygen, indicating the thickening of the oxide film.

3.3. Electrochemical Measurements

3.3.1. Effect of pH on B

  • Potentiodynamic polarization curves
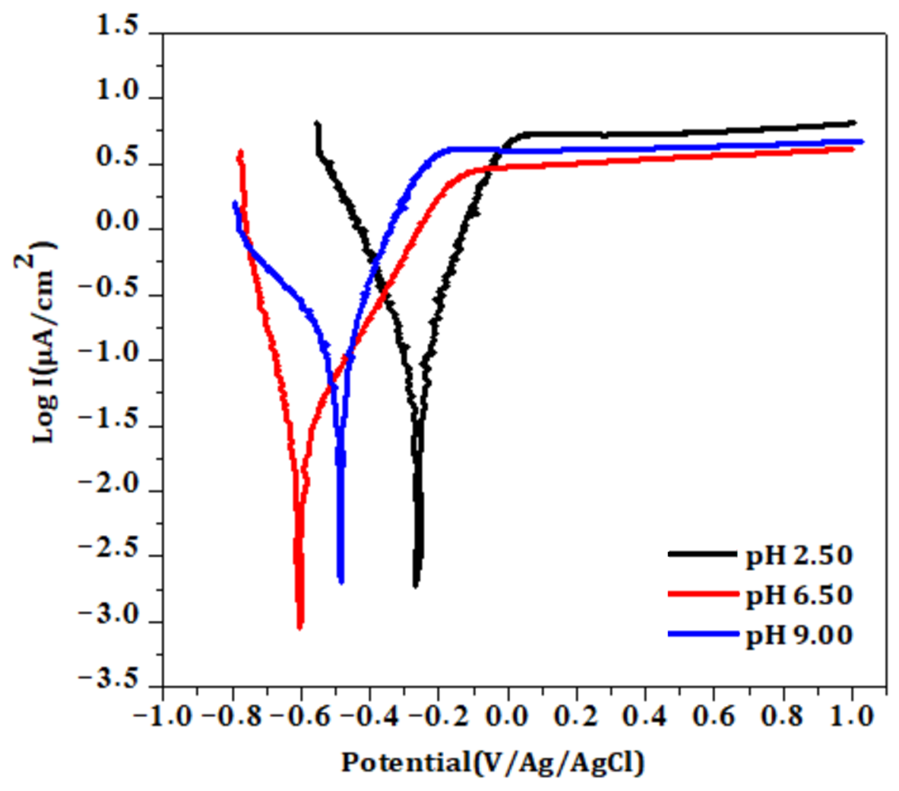
Figure 3 shows the PPC obtained for Ti after 1 h immersion in artificial saliva at different pH levels (2.50, 6.50 and 9.00). They all present similar trend. In the cathodic domain −0.3 V/OCP to Ecorr the current registered can be attributed to the oxygen reduction. All anodic curves exhibit a stable current within the potential range of 0.2 to 1 V, indicating the passive state of the surface. In all cases, the corrosion mechanism is then a direct passivation of the surface. No pitting phenomenon could be detected. The influence of the pH is evident; the oxidation currents are lowest in the neutral medium (pH 6.5) and increase under both acidic and basic conditions. The electrochemical parameters derived from the curves are summarized in Table 2 along with their margin of error. The lowest Icorr (23 nA·cm−2) and Ipass (4 nA·cm−2) along with the highest Rp (1.24 × 10⁶ W·cm2), were observed in the neutral medium, indicating optimal passivation. In contrast, deviations in pH significantly increase the corrosion rate of Ti, likely due to the accelerated degradation of the native TiO2 layer at pH 2.50 and pH 9.00 [15]. Usually, an effective passivation leads to low icor and ipass together with a shift of the corrosion potential Ecor towards noble values, that is not the case here. The possible interpretation of this non usual phenomenon can be due to the slowing down of the cathodic reaction (the cathodic βc Tafel slopes were determined to be 94 against 162 or 222 mV/decade at pH 6.5, 2.5 and 9 respectively). The corrosion potential corresponding to the balance between anodic and cathodic reactions, the reduction of cathodic kinetics (by adsorption or blocking of active sites) moves the intersection of anodic/cathodic curves towards a more negative potential [49].
b.
Electrochemical impedance spectroscopy measurements
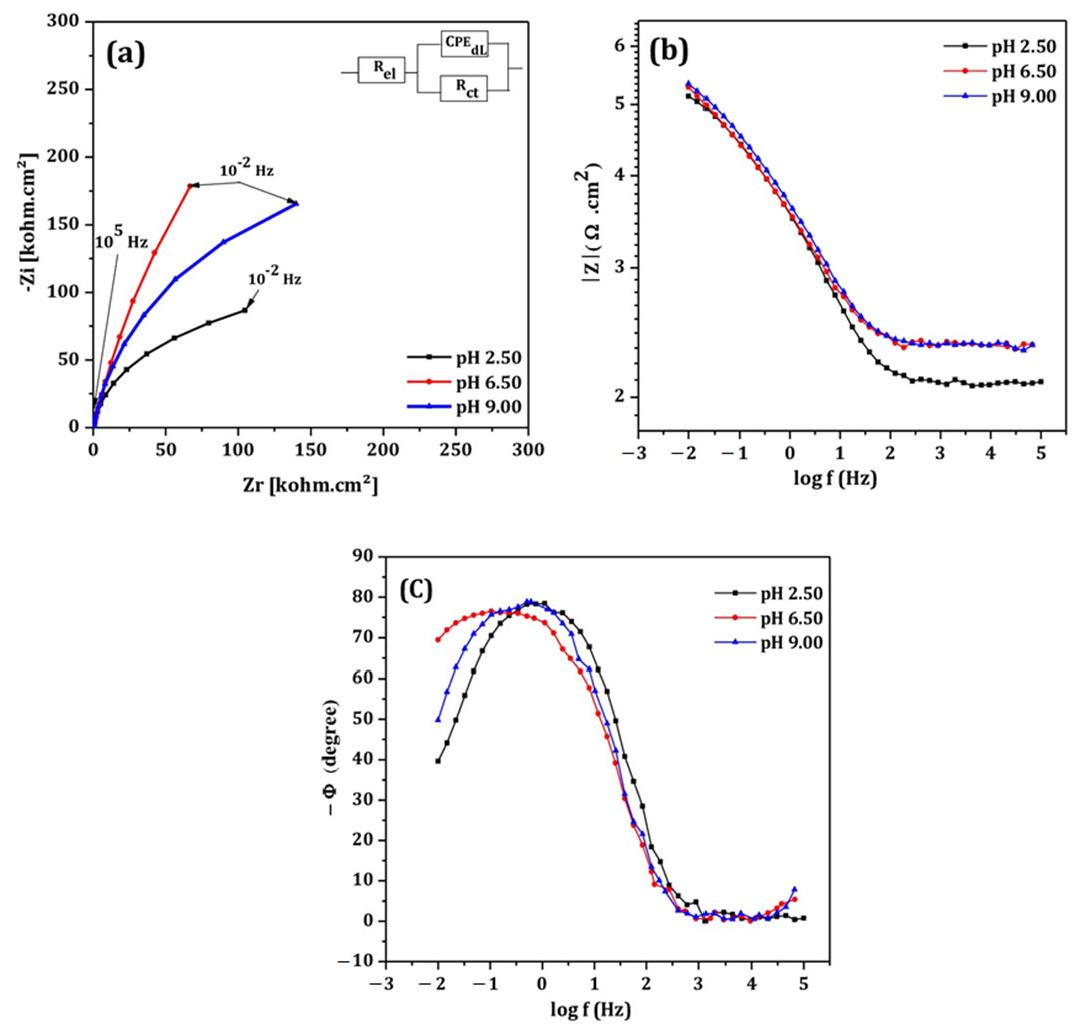
EIS spectra are plotted in the form of Nyquist plots. A single equivalent electrical circuit (Randle’s circuit), illustrated in Figure 4 (insert), was employed to model the system. This circuit includes a charge transfer resistance (Rct) in parallel with a constant phase element representing the double-layer capacitance (CPEdl), both in series with the electrolyte resistance (Rel). This model aligns with the one proposed by Valentim et al. [15] for pure titanium immersed in artificial saliva.
The fitting results are summarized in Table 3 and demonstrate a clear influence of pH on all parameters. The CPEdl was notably higher at acidic pH levels, indicating increased capacitance likely due to surface roughening or enhanced adsorption processes. The lowest Rct, indicative of the poorest corrosion resistance, was observed in the acidic medium, while the highest Rct, reflecting the most stable passive layer, was observed in the neutral condition (pH 6.5). Note that Rct values deduced from EIS are in good accordance than those determined by potentiodynamic polarization method (for example 1.39 × 10⁶ W·cm2 for the total resistance from EIS against 1.24 106 W·cm2 from PPC at pH 6.5)
The Bode-phase diagrams are shown in Figure 4b,c. Bode phase curves have a symmetrical appearance that suggests only one time constant for all groups, indicating a passive, compact, homogeneous, and protective film. At high frequencies (HF), both phase angle and impedance were low. As the frequency decreased, impedance increased, and the phase angle also rose. At low frequencies (LF), impedance stabilized, and the phase angle for titanium (Ti) in acidic environments was the lowest, indicating poor corrosion resistance in saliva at low pH.
Both EIS and PPC results demonstrated that corrosion rates increase at low and high pH levels, underscoring the importance of maintaining near-neutral pH in oral environments to preserve the integrity of titanium implants.
For the subsequent experiments, the pH was maintained at 6.50, representing the neutral conditions typically found in the oral environment.

3.3.2. Effect of Surface Treatments

  • Potentiodynamic polarization curves
Potentiodynamic experiments were conducted on EO and TT in F.M.S for various durations, as shown in Figure 5a and Figure 5b respectively. For comparison, the curve obtained from the bare substrate is also included in both figures. Whatever the surface treatment, the shape of the curves is always the same. The corrosion mechanism is then unmodified: direct passivation of the underlying Ti substrate is performed through the defects in the insulating oxide layers formed. Across all treatment and durations, the treated surface exhibited higher corrosion potentials and lower oxidation currents compared to the bare substrate, indicating improved corrosion resistance.
Electrochemical parameters extracted from Figure 5a,b are summarized in Table 4 and Table 5 respectively. In both cases, an increase in the oxidation time leads initially to an improvement of the corrosion properties, but after 3 h this trend is reversed: the best corrosion resistance was observed after 3 h of treatment, as indicated by the lower Icorr and Ipass values and the highest Rp [29].
It is likely that treatment durations exceeding 3 h lead to a thickening of the passive oxide layer, which may introduce defects that exacerbate corrosion, thereby diminishing the protective effect. These defects have been already mentioned in [50,51], coming from the burst of oxygen bubbles inside the film or a dielectric breakdown phenomenon due to the continuous application of a high voltage through a insulating layer.
The corrosion behavior obtained after a 3-h duration treatment, determined through the values of icorr and Rp values, is quite the same taking into account the measurement uncertainties.
b.
EIS measurement
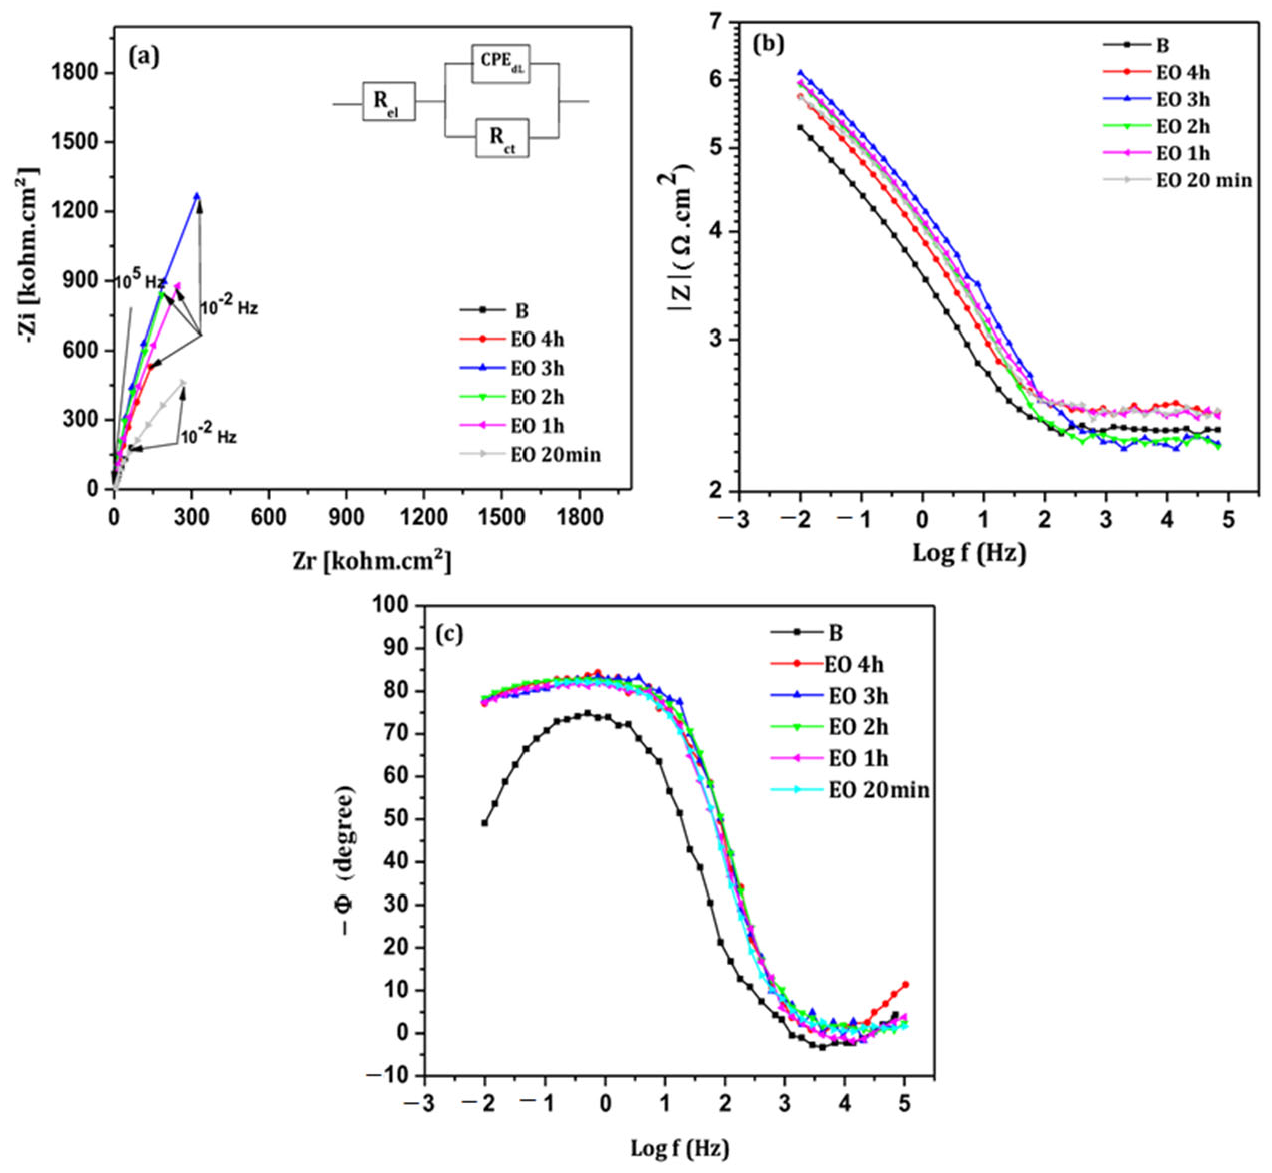
The Nyquist diagrams for EO and TT treated titanium surfaces at different oxidation durations are presented in Figure 6a and Figure 7a, respectively. Each diagram displays a semi circular shape with varying diameters depending on the treatment duration. The same equivalent circuit, as previously described, was used to fit these diagrams. The fitting results for both EO and TT are summarized in Table 6 and Table 7.
In both cases, the charge transfer resistances (Rct) increased with the treatment duration, peaking at 3 h before decreasing, which is consistent with the conclusions drawn from the potentiodynamic polarization measurements. Note that the values of the resistance determine by these two techniques are in good agreement. Simultaneously, the double layer capacitance (CPEdl) decreased with longer oxidation durations, while the exponent (n) remained approximately 0.9.
The value of Z at low frequencies in the Bode modulus plots (Figure 6b and Figure 7b) represents the corrosion resistance of samples. The highest corrosion resistances were obtained at 3 h for both treatments, (even if the value seems sometimes very close due to the large scale).
This suggests the formation of a well-distributed, adherent passive titanium oxide film across the metal surface.

3.3.3. Effect of Fluoride Ions on the Bare Titanium Surface (B)

  • Potentiodynamic polarization curves
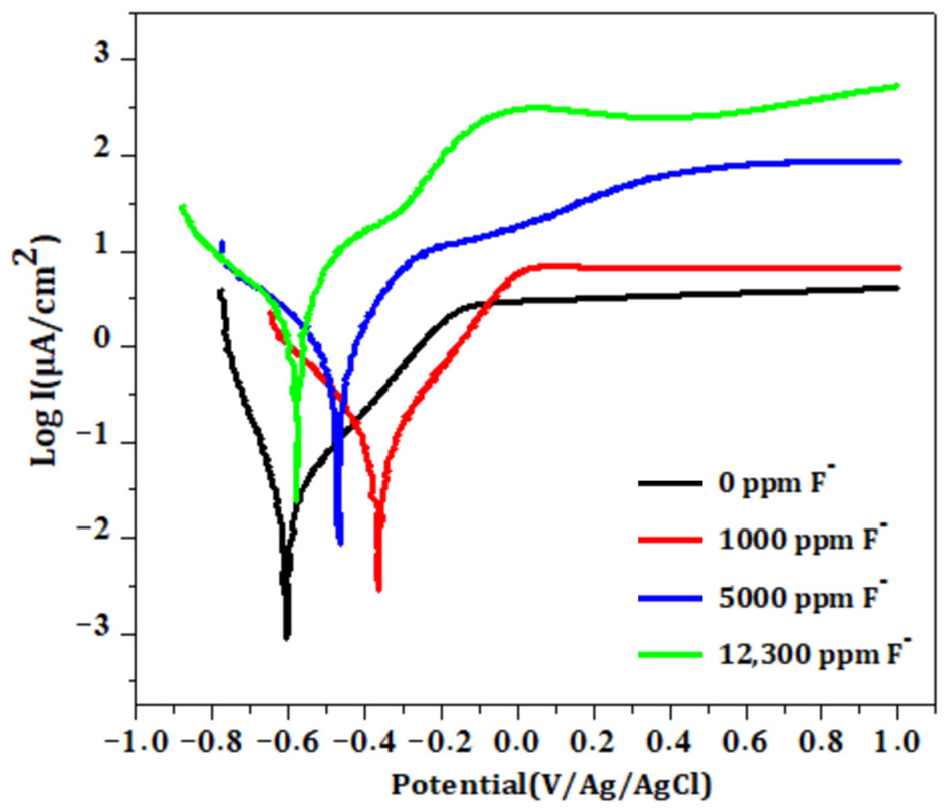
Figure 8 shows the potentiodynamic polarization curves for the bare substrate in artificial saliva with increasing fluoride ions concentrations. The corresponding electrochemical parameters are summarized in Table 8. The initially stable passive state of titanium becomes increasingly compromised as fluoride concentration rises. At low fluoride levels, the oxidation currents remain relatively constant at high potentials, while at higher concentrations, current oscillations emerge, suggesting localized breakdown of the passive layer. Both Icorr and Ipass increase significantly, while Rp decreases indicating a marked deterioration in corrosion resistance. This behavior is likely due to the aggressive attack of fluoride ions, which are known to degrade the protective TiO2 film, in good correlation with the results mentioned by Lindholm-Stehson and Ardlin in a solution containing NaCl 9 g/L and NaF till A wt% [27].
b.
EIS measurement
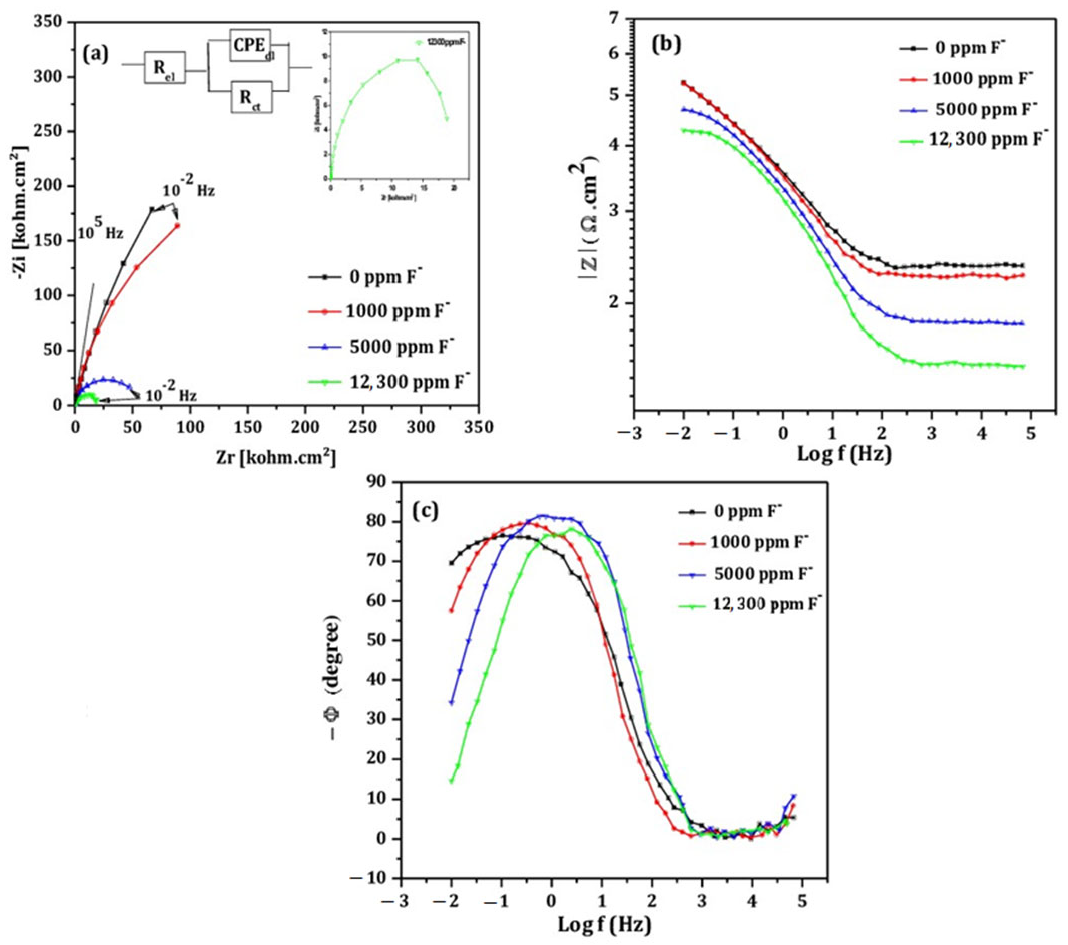
Nyquist plots obtained from impedance measurements in fluoride-containing artificial saliva are shown in Figure 9a. As the fluoride concentration in the solution increases, the semicircle diameter decreases, indicating a loss in corrosion resistance. This result is in good correlation with the Bode modulus plots (Figure 9b), the lowest corrosion resistance corresponding to the lowest value of Z. The destabilization of the passivated metal layer is attributed to the formation of fluoride containing compounds (e.g., TiF4, TiOF2, Na2TiF6) that result in a porous surface structure [14,52,53].
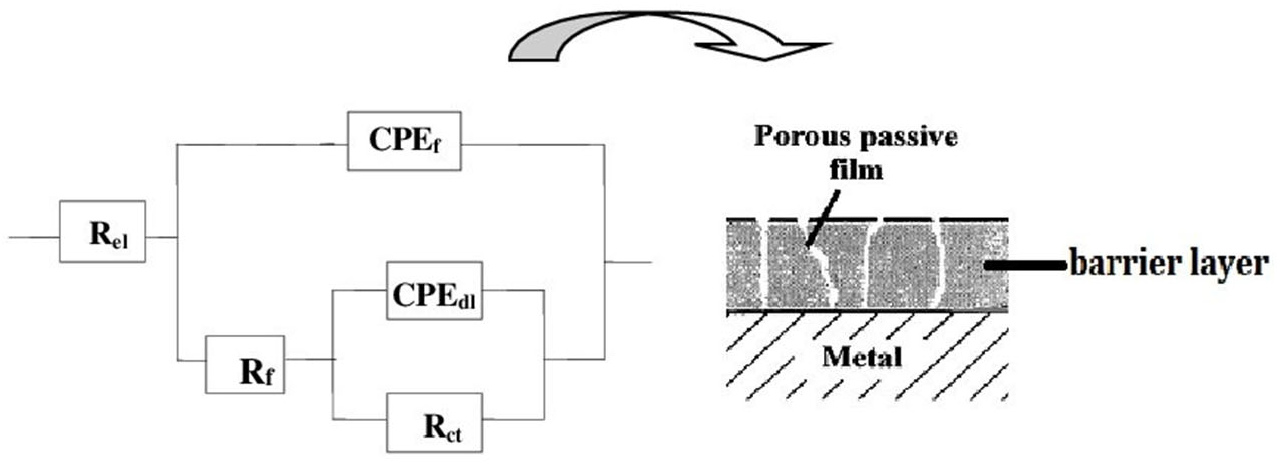
At low fluoride concentrations, the system can be modeled using the standard Randle’s equivalent circuit (Figure 9, insert). However, at 12,300 ppm F, a more complex model with two time constants is necessary (Figure 10), consistent with prior study proposed for Ti immersed in saline solution [54], in Ringer’s solution [55], and Hank’s solution [16]. This model distinguishes between a compact inner barrier layer and a porous outer layer. The outer layer is described by a constant phase element (CPEf) and a resistance Rf, and the inner by the double layer capacitance CPEdl and the charge transfer resistance Rct, with all elements connected in series with the electrolyte resistance Rel. Due to structural heterogeneities within those two layers, constant phase elements (CPE) rather than simple capacitances (C) are used to simulate the non-ideal capacitive behavior. The results obtained in Table 9 indicate a decrease Rel F concentration increases. At 12,300 ppm, Rct remains significantly higher (21 kΩ·cm2) than Rf (33 Ω·cm2), indicating that the inner layer provides most of the corrosion resistance. The decreasing Rct trend with rising F content is consistent with the polarization data.
SEM observations, presented in Figure 11 reveal the impact of F at: 1000 ppm (Figure 11a) some surface degradation is visible, while at (Figure 11b) large pores up to 20 µm in diameter, are observed, confirming substantial damage of the passive film.
Several studies have demonstrated that fluoride ions significantly influence the corrosion behavior of titanium, particularly under acidic conditions. At high fluoride concentrations, the protective oxide layer on titanium is compromised, leading to corrosion forms such as pitting and crevice corrosion. The corrosion process results in surface degradation, including increased roughness, discoloration, and a marked reduction in corrosion resistance. The interaction between fluoride concentration and pH is critical, with acidic conditions accelerating corrosion even at lower fluoride concentrations. This mechanism of corrosion can contribute to clinical complications like peri-implantitis in dental applications. Multiple in vitro studies have affirmed that titanium and its alloys are highly vulnerable to fluoride-induced corrosion, especially when exposed to acidic environments or fluoride-containing dental products [56,57].

3.3.4. Corrosion Behavior of EO and TT Samples in 12,300 ppm Fluoride-Containing Saliva

  • Potentiodynamic polarization curves
To evaluate the fluoride resistance of bulk titanium oxide films formed by electrochemical oxidation (EO.3 h) and thermal treatment (and TT.3 h), potentiodynamic tests were carried out in F.M.S containing 12,300 ppm (Figure 12). The untreated titanium (B) is also shown for reference. The corrosion potential shifts positively from B to EO to TT, while Icorr and Ipass decrease in the reverse order. As detailed in Table 10, the TT sample demonstrates the most effective passivation with its Rp value nearly 6 times higher than EO and 150 times greater than, confirming its superior corrosion resistance in aggressive fluoride environments.
b.
EIS measurement
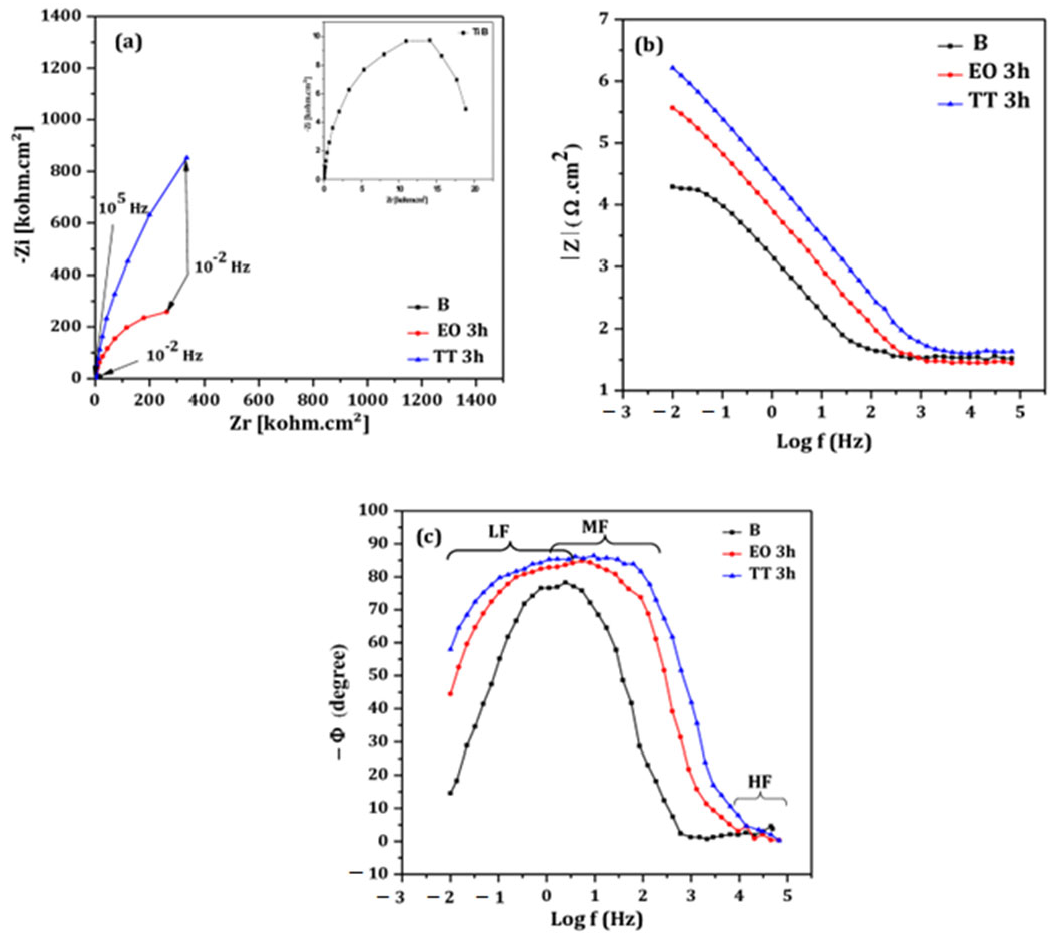
Nyquist diagrams for B, EO and TT surfaces in 12,300 ppm are presented in Figure 13. All curves were fitted using the two-time constant model described previously, representing the porous outer layer and the compact inner barrier; the corresponding electrical parameters are summarized in Table 11. The diameter of the semicircles decreases progressively from TT to EO to B. This order reflects increasing resistance values in both porous (Rf) and barrier (Rct) layers, with TT exhibiting the most protective oxide structure results are in good agreement with the findings from the polarization experiments.
SEM images after corrosion experiments in concentrated fluoride solution are shown in Figure 14. While the B surface (cf. Figure 11b) shows extensive degradation, both EO surface (Figure 14a) and TT (Figure 14b) samples exhibit a uniform surface with minimal signs of corrosion. The EO sample exhibits minor defects (approximately 1 µm in diameter), likely linked to pre-existing cracks and pores initiated by the defects (cracks and holes) already present on the initial the surface (see Figure 2c). In contrast, the sample TT shows no visible damage. EDS analysis (Table 12) conducted on 10 × 10 µm2 area at 10 KV, confirms a higher atomic oxygen content in the TT surface compared to EO, suggesting a denser or thicker oxide layer.
Several recent studies have shown that fluoride ions promote the formation of soluble titanium fluoride complexes, which destabilize the protective TiO2 passive film and accelerate corrosion. In particular, Wang et al. demonstrated that increasing fluoride concentration leads to transitions in the oxide film from a compact to a porous structure, significantly reducing corrosion resistance. The critical fluoride concentration at which the passive film breaks down depends strongly on pH, with acidic conditions exacerbating the degradation. This fluoride-induced corrosion is dynamic, involving localized breakdown and repassivation cycles, which poses challenges for the durability of titanium implants in fluoride-rich environments [58].

4. Conclusions

  • The study demonstrated that corrosion rates increase at both low and high pH levels, underscoring the importance of maintaining near-neutral pH in oral environments to preserve the integrity of titanium implants.
  • Treatment durations from 20 min to 4 h were tested, with 3 h identified as optimal for both electrochemical and thermal oxidation. During this time, TiO2 layers effectively passivated the titanium surface in neutral saliva (pH 6.5). However, EO-treated films showed nanoscale defects like pores and cracks that may reduce long-term protection.
  • Electrochemical tests performed at fluoride concentrations of 1000, 1500 and 12,300 ppm revealed a strong correlation between fluoride contact and corrosion severity. Higher fluoride levels led to increase corrosion current density and decrease polarization resistance, indicating significant degradation of the passive layer. EIS results at 12,300 ppm F suggested the formation of a dual layer structure composed of an inner barrier layer and an outer porous layer, which likely accounts for the extensive pitting observed by SEM.
  • Both EO and TT surface modifications significantly enhanced the corrosion resistance of titanium in artificial saliva, even under aggressive fluoride concentrations. Notably, the TT treated samples provided superior performance, attributed to the formation of a more compact and defect-free layer compared to EO.

Author Contributions

Conceptualization, M.F. and M.E.; Data acquisition and analysis F.K.; Methodology, M.F. and M.E.; Validation, M.F., A.K., S.A. and M.E.; Writing—original draft preparation, F.K.; Writing—review and editing, F.K., M.F. and M.E.; Project administration, M.F. and M.E. All authors have read and agreed to the published version of the manuscript.

Funding

This research received no external funding.

Data Availability Statement

The raw data supporting the conclusions of this article will be made available by the authors on request.

Conflicts of Interest

The authors declare no conflict of interest.

References

  1. Rojo, L.; Gharibi, B.; McLister, R.; Meenan, B.J.; Deb, S. Self-assembled monolayers of alendronate on Ti6Al4V alloy surfaces enhance osteogenesis in mesenchymal stem cells. Sci. Rep. 2016, 6, 30548. [Google Scholar] [CrossRef] [PubMed]
  2. Truong, V.K.; Lapovok, R.; Estrin, Y.S.; Rundell, S.; Wang, J.Y.; Fluke, C.J.; Crawford, R.J.; Ivanova, E.P. The influence of nano-scale surface roughness on bacterial adhesion to ultrafine-grained titanium. Biomaterials 2010, 31, 3674–3683. [Google Scholar] [CrossRef] [PubMed]
  3. Chelariu, R.; Bolat, G.; Izquierdo, J.; Mareci, D.; Gordin, D.M.; Gloriant, T.; Souto, R.M. Metastable beta Ti-Nb-Mo alloys with improved corrosion resistance in saline solution. Electrochim. Acta 2014, 137, 280–289. [Google Scholar] [CrossRef]
  4. Lu, J.; Zhang, Y.; Huo, W.; Zhang, W.; Zhao, Y.; Zhang, Y. Electrochemical corrosion characteristics and biocompatibility of nanostructured titanium for implants. Appl. Surf. Sci. 2018, 434, 63–72. [Google Scholar] [CrossRef]
  5. Park, J.W.; Kim, Y.J.; Park, C.H.; Lee, D.H.; Ko, Y.G.; Jang, J.H.; Lee, C.S. Enhanced osteoblast response to an equal channel angular pressing-processed pure titanium substrate with microrough surface topography. Acta Biomater. 2009, 5, 3272–3280. [Google Scholar] [CrossRef]
  6. Robin, A.; Meirelis, J.P. Influence of fluoride concentration and pH on corrosion behavior of Ti-6Al-4V and Ti-23Ta alloys in artificial saliva. Mater. Corros. 2007, 58, 173–180. [Google Scholar] [CrossRef]
  7. Marino, C.E.B.; Mascaro, L.H. EIS characterization of a Ti-dental implant in artificial saliva media: Dissolution process of the oxide barrier. J. Electroanal. Chem. 2004, 568, 115–120. [Google Scholar] [CrossRef]
  8. Schiff, N.; Grosgogeat, B.; Lissac, M.; Dalard, F. Influence of fluoride content and pH on the corrosion resistance of titanium and its alloys. Biomaterials 2002, 23, 1995–2002. [Google Scholar] [CrossRef]
  9. Mazare, A.; Totea, G.; Burnei, C.; Schmuki, P.; Demetrescu, I.; Ionita, D. Corrosion, antibacterial activity and haemocompatibility of TiO2 nanotubes as a function of their annealing temperature. Corros. Sci. 2016, 103, 215–222. [Google Scholar] [CrossRef]
  10. Li, J.; Li, S.J.; Hao, Y.L.; Huang, H.H.; Bai, Y.; Hao, Y.Q.; Guo, Z.; Xue, J.Q.; Yang, R. Electrochemical and surface analyses of nanostructured Ti-24Nb-4Zr-8Sn alloys in simulated body solution. Acta Biomater. 2014, 10, 2866–2875. [Google Scholar] [CrossRef]
  11. Liu, X.; Chu, P.K.; Ding, C. Surface modification of titanium, titanium alloys, and related materials for biomedical applications. Mater. Sci. Eng Rep. 2004, 47, 49–121. [Google Scholar] [CrossRef]
  12. Marino, C.E.B.; Biaggio, S.R.; Rocha-Filho, R.C.; Bocchi, N. Voltammetric stability of anodic films on the Ti6Al4V alloy in chloride medium. Electrochim. Acta 2006, 51, 6580–6583. [Google Scholar] [CrossRef]
  13. Alves, V.A.; Reis, R.Q.; Santos, I.C.B.; Souza, D.G.; Gonçalves, T.F.; Pereira-da-Silva, M.A.; Rossi, A.; da Silva, L.A. In situ impedance spectroscopy study of the electrochemical corrosion of Ti and Ti–6Al–4V in simulated body fluid at 25 °C and 37 °C. Corros. Sci. 2009, 51, 2473–2482. [Google Scholar] [CrossRef]
  14. Mutlu, I. Synthesis and characterization of Ti−Co alloy foam for biomedical applications. Trans. Nonferrous Met. Soc. China. 2016, 26, 126–137. [Google Scholar] [CrossRef]
  15. Valentim, A.R.B.; Mathew, T.M.; Assunção, W.G.; Yuan, J.C.C.; Wimmer, M.; Sukotjo, C. Stability of cp-Ti and Ti-6Al-4V alloy for dental implants as a function of saliva pH- an electrochemical study. Clin. Oral Implants Res. 2012, 23, 1055–1062. [Google Scholar] [CrossRef]
  16. Souza, J.C.M.; Barbosa, L.S.; Ariza, E.A.; Henriques, M.; Teughels, W.; Ponthiaux, P.; Celis, J.P.; Rocha, L.A. How do titanium and Ti6Al4V corrode in fluoridated medium as found in the oral cavity? An in vitro study. Mater. Sci. Eng. 2015, 47, 384–393. [Google Scholar] [CrossRef]
  17. Nakagawa, M.; Matsuya, S.; Shiraishi, T.; Ohta, M. Effect of fluoride concentration and pH on corrosion behavior of titanium for dental use. J. Dent. Res. 1999, 78, 1568–1572. [Google Scholar] [CrossRef] [PubMed]
  18. Janužis, G.; Milvydaitė, G.; Miškinytė, M.; Latakas, D.; Griškonis, G. Fluoride Induced Corrosion Impact on Peri-Imlantitis: A Systemic Review. Ann. Dent. Spec. 2023, 11, 87–92. [Google Scholar] [CrossRef]
  19. Huang, H.H. Effect of fluoride and albumin concentration on the corrosion behavior of Ti-6Al-4V alloy. Biomaterials 2003, 24, 275–282. [Google Scholar] [CrossRef]
  20. Laurent, F.; Grosgogeat, B.; Reclaru, L.; Dalard, F.; Lissac, M. Comparison of corrosion behaviour in presence of oral bacteria. Biomaterials 2001, 22, 2273–2282. [Google Scholar] [CrossRef]
  21. Souza, J.C.M.; Henriques, M.; Oliveira, R.; Teughels, W.; Celis, J.P.; Rocha, L.A. Do oral biofilms influence the wear and corrosion behavior of titanium? Biofouling 2010, 26, 471–478. [Google Scholar] [CrossRef]
  22. Murrell, S.; Marshall, T.; Moynihan, P.; Qian, F.; Wefel, J. Comparison of in vitro erosion potentials between beverages available in the United Kingdom and the United States. J. Dent. 2010, 38, 284–289. [Google Scholar] [CrossRef] [PubMed]
  23. Assis, S.L.; Wolynec, S.; Costa, I. Corrosion characterization of titanium alloys by electrochemical techniques. Electrochim. Acta 2006, 51, 1815–1819. [Google Scholar] [CrossRef]
  24. Souza, M.E.; Lima, L.; Lima, C.R.P.; Zavaglia, C.A.C.; Freire, C.M.A. Effects of pH on the electrochemical behaviour of titanium alloys for implant applications. J. Mater. Sci Mater. Med. 2009, 20, 549–552. [Google Scholar] [CrossRef] [PubMed]
  25. Chen, W.Q.; Zhang, S.M.; Qiu, J. Surface analysis and corrosion behavior of pure titanium under fluoride exposure. J. Prosthet. Dent. 2020, 124, 239.e1–239.e8. [Google Scholar] [CrossRef]
  26. Souza, J.C.; Apaza-Bedoya, K.; Benfatti, C.A.; Silva, F.S.; Henriques, B. A comprehensive review on the corrosion pathways of titanium dental implants and their biological adverse effects. J. Met. 2020, 10, 1272. [Google Scholar] [CrossRef]
  27. Lindholm-Sethson, B.; Ardlin, B.I. Effects of pH and fluoride concentration on the corrosion of titanium. J. Biomed. Mater. Res. Part A Off. J. Soc. Biomater. 2008, 86, 149–159. [Google Scholar] [CrossRef]
  28. Çomaklı, O.; Yazıcı, M.; Yetim, T.; Yetim, A.F.; Çelik, A. The effect of calcination temperatures on structural and electrochemical properties of TiO2 film deposited on commercial pure titanium. Surf. Coat. Technol. 2016, 285, 298–303. [Google Scholar] [CrossRef]
  29. Jamesh, M.; Kumar, S.; Narayanan, T.S.N.S.; Chu, P.K. Effect of thermal oxidation on the corrosion resistance of Ti6Al4V alloy in hydrochloric and nitric acid medium: Effect of thermal oxidation on the corrosion resistance of Ti6Al4V alloy. Mater. Corros. 2013, 64, 902–907. [Google Scholar] [CrossRef]
  30. Jayaraj, J.; Ranjith, P.M.; Ningshen, S.; Ramanathan, S. Studies on Corrosion of Titanium and Air-Oxidized Titanium in Fluorinated Nitric Acid. Trans. Indian Inst. Met. 2019, 72, 1917–1926. [Google Scholar] [CrossRef]
  31. Diamanti, M.V.; Curto, B.D.; Pedeferri, M. Anodic oxidation of titanium: From technical aspects to biomedical applications. J. Appl. Biomater. Biomech. 2011, 9, 55–69. [Google Scholar] [CrossRef] [PubMed]
  32. Doulache, M.; Trari, M.; Benchettara, A. The oxidation of titanium thin films in phosphoric medium. Prot. Met. Phys. Chem. Surf. 2014, 50, 200–208. [Google Scholar] [CrossRef]
  33. Minhas, B.; Dino, S.; Zuo, Y.; Qian, H.; Zhao, X. Improvement of Corrosion Resistance of TiO2 Layers in Strong Acidic Solutions by Anodizing and Thermal Oxidation Treatment. J. Mater. 2021, 14, 1188. [Google Scholar] [CrossRef]
  34. Pour, H.K.; Ansari, H.; Tehrani, A. In vitro effect of anodization of titanium abutments on their tensile bond strength to implant-supported lithium disilicate all-ceramic crowns. J. Dent. Res. 2023, 20, 99. [Google Scholar] [CrossRef]
  35. Ningrum, E.O.; Khoiroh, I.; Nastiti, H.I.; Affan, R.A.; Karisma, A.D.; Agustiani, E.; Widiyanto, S. Surface coating effect on corrosion resistance of titanium alloy bone implants by anodizing method. Int. J. Technol. 2023, 14, 749–760. [Google Scholar] [CrossRef]
  36. Jáquez-Muñoz, J.M.; Gaona-Tiburcio, C.; Mendez-Ramirez, C.T.; Carrera-Ramirez, M.G.; Baltazar-Zamora, M.A.; Santiago-Hurtado, G.; Almeraya-Calderon, F. Corrosion of anodized titanium alloys. Coatings 2024, 14, 809. [Google Scholar] [CrossRef]
  37. Guo, T.; Scimeca, J.C.; Ivanovski, S.; Verron, E.; Gulati, K. Enhanced Corrosion Resistance and Local Therapy from Nano-Engineered Titanium Dental Implants. Pharmaceutics 2023, 15, 315. [Google Scholar] [CrossRef]
  38. Djendel, A.; Ait Ahmed, N.; Knauth, P.; Eyraud, M. Improved corrosion and adhesion properties of titanium alloy for endoprostheses applications using a two-step anodization method. Surf. Coat. Technol. 2023, 461, 129437. [Google Scholar] [CrossRef]
  39. Mohammed, A.A. Evaluation of the corrosion resistance and biology properties for titanium surface coated with various composite coatings. Appl. Phys. A 2025, 131, 372. [Google Scholar] [CrossRef]
  40. Lu, W.Q.; Liu, Y.J.; Wu, X.; Liu, X.C.; Wang, J.C. Corrosion and passivation behavior of Ti-6Al-4V surfaces treated with high-energy pulsed laser: A comparative study of cast and 3D-printed specimens in a NaCl solution. Surf. Coat. Technol. 2023, 470, 129849. [Google Scholar] [CrossRef]
  41. Wang, X.; Qin, P.; Chen, L.Y.; Sun, H.; Zhang, L.C. Corrosion behavior and mechanisms of the heat-treated Ti5Cu produced by laser powder bed fusion. Corros. Sci. 2023, 221, 111336. [Google Scholar] [CrossRef]
  42. Lu, W.; Liu, Y.; Wu, X.; Liu, X.; Wang, J. Corrosion behavior and microstructural effects on passivation film mechanisms in forged Ti-5Al-5Mo-5V-1Cr-1Fe titanium alloy under laser surface remelting. Corros. Sci. 2024, 241, 112542. [Google Scholar] [CrossRef]
  43. Rossi, S.; Volgare, L.; Perrin-Pellegrino, C.; Chassigneux, C.; Dousset, E.; Eyraud, M. Dual Electrochemical Treatments to Improve Properties of Ti6Al4V Alloy. J. Mater. 2020, 13, 2479. [Google Scholar] [CrossRef]
  44. Matykina, E.; Arrabal, R.; Mingo, B.; Mohedano, M.; Pardo, A.; Merino, M.C. In vitro corrosion performance of PEO coated Ti and Ti6Al4V used for dental and orthopaedic implants. Surf. Coat. Technol. 2016, 307, 1255–1264. [Google Scholar] [CrossRef]
  45. Stern, M.; Geary, A. Electrochemical polarization: I. A theoretical analysis of the shape of polarization curves. J. Electrochem. Soc. 1957, 56, 104. [Google Scholar] [CrossRef]
  46. Gaul, E. Coloring titanium and related metals by electrochemical oxidation. J. Chem. Educ. 1993, 70, 176–178. [Google Scholar] [CrossRef]
  47. Velten, D.; Biehl, V.; Aubertin, F.; Valeske, B.; Possart, W.; Breme, J. Preparation of TiO2 layers on cp-Ti and Ti6Al4V by thermal and anodic oxidation and by sol-gel coating techniques and their characterization. J. Biomed. Mater. Res. 2002, 59, 18–28. [Google Scholar] [CrossRef]
  48. Ting, C.C.; Chen, S.Y.; Liu, D.M. Preferential growth of thin rutile TiO2 films upon thermal oxidation of sputtered Ti films. Thin Solid Films 2002, 402, 290–295. [Google Scholar] [CrossRef]
  49. Helbert, V.S.; Nazarov, A.; Vucko, F.; Larché, N.; Thierry, D. Effect of Cathodic Polarisation Switch-Off on the Passivity and Stability to Crevice Corrosion of AISI 304L Stainless Steel. Materials 2021, 14, 2921. [Google Scholar] [CrossRef]
  50. Liu, Z.J.; Zhong, X.; Walton, J.; Thompson, G.E. Anodic Film Growth of Titanium Oxide Using the 3-Electrode Electrochemical Technique: Effects of Oxygen Evolution and Morphological Characterizations. J. Electrochem. Soc. 2016, 163, 75–82. [Google Scholar] [CrossRef]
  51. Cheung, K.H.; Pabbruwe, M.B.; Chen, W.F.; Koshy, P.; Sorrell, C.C. Thermodynamic and microstructural analyses of photocatalytic TiO2 from the anodization of biomedical-grade Ti6Al4V in phosphoric acid or sulfuric acid. Ceram. Int. 2021, 47, 1609–1624. [Google Scholar] [CrossRef]
  52. Lin, F.H.; Hsu, Y.S.; Lin, S.H.; Chen, T.M. The growth of hydroxyapatite on alkaline treated Ti−6Al−4V soaking in higher temperature with concentrated Ca2+/HPO42− simulated body fluid. Mater. Chem. Phys. 2004, 87, 24–30. [Google Scholar] [CrossRef]
  53. Fojt, J.; Joska, L.; Málek, J. Corrosion behaviour of porous Ti−39Nb alloy for biomedical applications. Corros. Sci. 2013, 71, 78–83. [Google Scholar] [CrossRef]
  54. Mareci, D.; Ungureanu, G.; Aelenei, D.M.; Mirza-Rosca, J.C. Electrochemical characteristics of titanium based biomaterials in artificial saliva. Mater. Corros 2007, 58, 848–856. [Google Scholar] [CrossRef]
  55. González, J.E.G.; Mirza-Rosca, J.C. Study of the corrosion behavior of titanium and some of its alloys for biomedical and dental implant applications. J. Electroanal. Chem. 1999, 471, 109–115. [Google Scholar] [CrossRef]
  56. Qu, Q.; He, Y.; Li, L.; Yang, M.; Lai, B.; Chen, Y. Effect of fluorine ion on the corrosion of Ti-6Al-4V alloy in artificial saliva. Int. J. Electrochem. Sci. 2015, 10, 7453–7464. [Google Scholar] [CrossRef]
  57. Janužis, G.; Milvydaitė, G.; Miškinytė, M.; Latakas, D.; Griškonis, G. A Systematic Review on the Effects of Fluoride-Induced Corrosion in Peri-Implantitis. Turk. J. Dent. Hyg. 2023, 3, 61–67. [Google Scholar] [CrossRef]
  58. Wang, L.; Wang, M.; Zhong, M.; Li, X.; Cui, Z. Degradation of thermal oxide film on pure titanium in an acidic environment containing fluoride. Npj Mater. Degrad. 2022, 6, 65. [Google Scholar] [CrossRef]
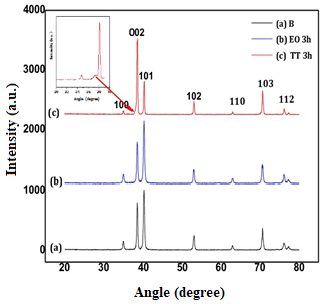
Figure 1. X-ray diffraction (XRD) patterns of commercially pure titanium samples before and after surface treatment: (a) untreated titanium (B), (b) electrochemically oxidized titanium (EO) in a neutral electrolyte for 3 h, and (c) thermally treated titanium (TT) in air at 450 °C for 3 h.
Cmd 06 00052 g001
Figure 2. SEM-SE micrographs with a secondary electron detector for: (a) untreated titanium (B), (b) thermally treated (TT) sample oxidized in air at 450 °C for 3 h, and (c) electrochemically oxidized (EO) sample treated for 3 h in neutral electrolyte. All images were taken before corrosion testing. (×55,000).
Cmd 06 00052 g002
Figure 3. Potentiodynamic polarisation curves of untreated titanium (B) immersed in Fusayama-Meyer artificial saliva (F.M.S) at different pH values (2.5, 6.5 and 9.0) at 37 °C.
Cmd 06 00052 g003
Figure 4. (a) Nyquist, (b) Bode-magnitude and (c) Bode-phase plots from electrochemical impedance spectroscopy (EIS) on untreated titanium (B) after 1 h of immersion in artificial saliva at different pH values (2.5, 6.5 and 9.0) at 37 °C.
Cmd 06 00052 g004
Figure 5. Potentiodynamic polarization curves for: (a) electrochemically oxidized (EO), and (b) thermally treated titanium (TT) as a function of treatment duration (20 min, 1 h, 2 h, and 4 h). Measurements conducted in Fusayama-Meyer saliva (pH = 6.5) at 37 °C.
Cmd 06 00052 g005
Figure 6. (a) Nyquist, (b) Bode-magnitude and (c) Bode-phase plots from EIS recorded on electrochemically oxidized titanium (EO) after different treatment durations (20 min, 1 h, 2 h, 3 h and 4 h) in Fusayama-Meyer saliva (pH = 6.5) at 37 °C. The plots obtained on the untreated titanium (B) were added for comparison.
Cmd 06 00052 g006
Figure 7. (a) Nyquist, (b) Bode-magnitude and (c) Bode-phase plots from EIS recorded on thermally treated titanium (TT) at 450 °C for different durations (20 min, 1 h, 2 h, 3 h and 4 h) in Fusayama-Meyer saliva (pH = 6.5) at 37 °C. The plots obtained on the untreated titanium (B) were added for comparison.
Cmd 06 00052 g007
Figure 8. Potentiodynamic polarisation curves for untreated titanium (B) in Fusayama-Meyer saliva at 37 °C with various fluoride ions concentrations: 0, 1000, 5000, and 12,300 ppm.
Cmd 06 00052 g008
Figure 9. (a) Nyquist, (b) Bode-magnitude and (c) Bode-phase plots from EIS recorded on untreated titanium (B) after 1 h of immersion in Fusayama-Meyer saliva with increasing fluoride concentrations (0, 1000, 5000, and 12,300 ppm) at 37 °C.
Cmd 06 00052 g009
Figure 10. Electrical equivalent circuits used for fitting EIS data: single-time constant Randle’s circuit (for low fluoride concentrations) and two-time constant model (for high fluoride concentration, 12,300 ppm), representing a porous outer layer and an inner barrier layer.
Cmd 06 00052 g010
Figure 11. SEM-SE micrographs obtained with a secondary electron detector on untreated titanium (B) after corrosion experiments in artificial saliva at 37 °C containing (a) 1000 ppm F and (b) 12,300 ppm F both at 37 °C. The surface shows increasing porosity and damage with higher fluoride concentration.
Cmd 06 00052 g011
Figure 12. Potentiodynamic polarization curves for bare titanium (B), electrochemically oxidized (EO), and thermally treated (TT) samples, both treated for 3 h, in Fusayama-Meyer saliva with 12,300 ppm fluoride ions at 37 °C.
Cmd 06 00052 g012
Figure 13. (a) Nyquist, (b) Bode-magnitude and (c) Bode-phase plots from EIS recorded on bare titanium (B), electrochemically oxidized (EO), and thermally treated (TT) samples, both treated for 3 h, in Fusayama-Meyer saliva with 12,300 ppm fluoride ions at 37 °C.
Cmd 06 00052 g013
Figure 14. SEM-SE micrographs obtained with a secondary electron detector after corrosion experiments in artificial saliva containing 12,300 ppm F at 37 °C on (a) electrochemically oxidized (EO) and (b) thermally treated (TT) titanium samples, both treated for 3 h. The TT sample exhibits minimal damage compared to EO. (X 12,000).
Cmd 06 00052 g014
Table 1. Elemental composition (in wt%) obtained by energy-dispersive X-ray spectroscopy (EDS) for untreated titanium (B), electrochemically oxidized titanium (EO), and thermally treated titanium (TT) samples prior to corrosion testing.
wt%TiO
B92 ± 18 ± 2
TT74 ± 126 ± 2
EO74 ± 126 ± 2
Table 2. Electrochemical parameters obtained from Tafel plots on untreated titanium (B) immersed in Fusayama-Meyer artificial saliva at 37 °C, under different pH conditions (2.5, 6.5, and 9.0).
pHEcorr
(mV/
Ag/AgCl)
Icorr × 10−9
(A·cm−2)
Average Tafel Slope (mV dec−1)RP × 106
(Ω·cm2)
Ipass × 10−6
(A·cm−2)
βaβc
2.50−266 ± 1391 ± 4141 ± 7162 ± 80.36 ± 0.046.30 ± 0.3
6.50−613 ± 3023 ± 1219 ± 1194 ± 51.24 ± 0.124.00 ± 0.2
9.00−481 ± 2481 ± 4115 ± 5222 ± 110.40 ± 0.044.50 ± 0.2
Table 3. Fitting electrochemical parameters determined from Nyquist diagrams (Figure 4) for untreated titanium (B) immersed for 1 h in Fusayama-Meyer artificial saliva at different pH values (2.5, 6.5, and 9.0), using an equivalent electrical circuit model. n: represents the exponent of the Constant Phase Element (CPE) used to model the non-ideal capacitive behavior of the electrochemical interface.
pHRel
(Ω·cm2)
CPEdl × 10−6
(Ω−1·cm−2·sn)
nRct
(kΩ·cm2)
Chi-Squared
2.50211 78 0.91 300 0.002
6.50228 57 0.86 1390 0.002
9.00228 43 0.90 420 0.003
Table 4. Electrochemical parameters obtained from Tafel plots in Figure 5a for Ti electrochemically oxidized (EO) for different durations (20 min, 1 h, 2 h, and 4 h) and tested in Fusayama-Meyer saliva (pH 6.5) at 37 °C.
Ecorr
(mV/Ag/AgCl)
Icorr × 10−9
(A·cm−2)
Average Tafel Slope (mV dec−1)RP × 106
(Ω·cm2)
Ipass × 10−6
(A·cm−2)
βaβc
B−613 ± 3023 ± 1219 ± 1194 ± 51.24 ± 0.124.00 ± 0.2
EO 4 h−549 ± 2712 ± 0.6400 ± 2087 ± 42.58 ± 0.261.68 ± 0.09
EO 3 h−144 ± 76 ± 0.3399 ± 20177 ± 98.87 ± 0.890.32 ± 0.02
EO 2 h−376 ± 196 ± 0.3313 ± 16107 ± 55.77 ± 0.580.44 ± 0.02
EO 1 h−293 ± 157 ± 0.4308 ± 15152 ± 86.31 ± 0.630.52 ± 0.03
EO 20 min−238 ± 1218 ± 0.9251 ± 13128 ± 62.04 ± 0.201.58 ± 0.08
Table 5. Electrochemical parameters obtained from Tafel plots in Figure 5b for Ti thermally treated (TT) at 450 °C for different durations (20 min, 1 h, 2 h, and 4 h) and tested in Fusayama-Meyer saliva (pH 6.5) at 37 °C.
Ecorr
(mV/Ag/AgCl)
Icorr × 10−9
(A·cm−2)
Average Tafel Slope (mV dec−1)RP × 106
(Ω·cm2)
Ipass × 10−6
(A·cm−2)
βaβc
B−613 ± 3023 ± 1219 ± 1194 ± 51.24 ± 0.124.00 ± 0.2
TT 4 h−331 ± 1710 ± 0.5195 ± 10124 ± 63.29 ± 0.330.16 ± 0.01
TT 3 h−194 ± 107 ± 0.4335 ± 17105 ± 54.96 ± 0.500.15 ± 0.01
TT 2 h−286 ± 1410 ± 5416 ± 21142 ± 74.59 ± 0.460.19 ± 0.01
TT 1 h−267 ± 1312 ± 6433 ± 22139 ± 73.80 ± 0.380.26 ± 0.01
TT 20 min−218 ± 1117 ± 1304 ± 1585 ± 41.69 ± 0.170.56 ± 0.03
Table 6. Electrochemical impedance spectroscopy (EIS) fitting parameters from Nyquist plots (Figure 6) for EO samples treated for various durations, immersed in Fusayama-Meyer saliva (pH 6.5) at 37 °C.
Electrochemical Oxidation
Rel
(Ω·cm2)
CPEdl × 10−6
(Ω−1·cm−2·sn)
nRct
(kΩ·cm2)
Chi-Squared
B228 57 0.86 1390 0.002
EO 4 h213 15 0.87 3460 0.002
EO 3 h197 10 0.92 11,210 0.004
EO 2 h229 15 0.94 7300 0.006
EO 1 h291 14 0.94 3800 0.003
EO 20 min29720 0.90 1490 0.002
n: represents the exponent of the Constant Phase Element (CPE) used to model the non-ideal capacitive behavior of the electrochemical interface.
Table 7. EIS fitting parameters from Nyquist plots (Figure 7) for TT samples oxidized at 450 °C for different durations, immersed in Fusayama-Meyer saliva (pH 6.5) at 37 °C. Parameters obtained using the equivalent circuit of Figure 10.
Thermal Oxidation
Rel
(Ω·cm2)
CPEdl × 10−6
(Ω−1·cm−2·sn)
nRct
(kΩ·cm2)
Chi-Squared
B228 57 0.86 1390 0.002
TT 4 h297 9 0.93 4880 0.006
TT 3 h226 8 0.92 6325 0.008
TT 2 h252 9 0.94 4700 0.002
TT 1 h218 7 0.94 3220 0.002
TT 20 min2969 0.92 1491 0.002
n: represents the exponent of the Constant Phase Element (CPE) used to model the non-ideal capacitive behavior of the electrochemical interface.
Table 8. Electrochemical parameters obtained from Tafel plots in Figure 8, on untreated titanium (B) exposed to Fusayama-Meyer saliva at 37 °C with increasing fluoride concentrations (1000, 5000, and 12,300 ppm).
Ecorr
(mV/Ag/AgCl)
Icorr × 10−9
(A·cm−2)
Average Tafel Slope (mV dec−1)RP × 103
(Ω·cm2)
Ipass × 10−6
(A·cm−2)
βaβc
0 ppm F−613 ± 30 23 ± 1219 ± 1194 ± 51242 ± 1244 ± 0.2
1000 ppm F−354 ± 1790 ± 5186 ± 9221 ± 11488 ± 487 ± 0.4
5000 ppm F−470 ± 24770 ± 36177 ± 9277 ± 1461 ± 687 ± 4
12,300 ppm F−579 ± 291765 ± 88143 ± 7278 ± 1423 ± 2589 ± 29
Table 9. EIS fitting parameters derived from Nyquist plots (Figure 9) for untreated titanium (B) immersed for 1 h in Fusayama-Meyer saliva containing different fluoride concentrations (1000, 5000, and 12,300 ppm), modeled using the equivalent circuit in Figure 10.
Rel
(Ω·cm2)
CPEf × 10−6
(Ω−1·cm−2·sn)
n1Rf
(Ω·cm2)
CPEdl × 10−6
(Ω−1·cm−2·sn)
n2Rct
(kΩ·cm2)
Chi-Squared
0 ppm228 ---57 0.861390 0.002
1000 ppm180 ---58 0.91524 0.002
5000 ppm67 ---62 0.92150 0.004
12,300 ppm371500.88331 0.3021 0.002
n: represents the exponent of the Constant Phase Element (CPE) used to model the non-ideal capacitive behavior of the electrochemical interface.
Table 10. Electrochemical parameters obtained from Tafel plots presented in Figure 12 comparing untreated titanium (B), electrochemically oxidized (EO), and thermally treated (TT) samples after 3 h of treatment, tested in Fusayama-Meyer saliva with 12,300 ppm F at 37 °C.
Ecorr
(mV/Ag/AgCl)
Icorr × 10−9
(A·cm−2)
Average Tafel Slope
(mV dec−1)
RP × 103
(Ω·cm2)
Ipass × 10−6
(A·cm−2)
βaβc
B−579 ± 291765 ± 88143 ± 7278 ± 1423 ± 2589 ± 29
EO 3 h−465 ± 2453 ± 3169 ± 8130 ± 7602 ± 6068 ± 3
TT 3 h−206 ± 109 ± 0.5258 ± 13100 ± 53481 ± 348 0.25 ± 0.01
Table 11. EIS fitting parameters from Nyquist plots (Figure 13) for B, EO.3 h, and TT.3 h samples after corrosion testing in Fusayama-Meyer saliva with 12,300 ppm fluoride at 37 °C, fitted using the two-layer equivalent circuit in Figure 10.
Rel
(Ω·cm2)
CPEf × 10−6
(Ω−1·cm−2·sn)
n1Rf
(kΩ·cm2)
CPEdl × 10−6
(Ω−1·cm−2·sn)
n2Rct
(kΩ·cm2)
Chi-Squared
B371500.880.0331.350.30210.002
EO 3 h29210.94250.710.605330.006
TT 3 h4270.97161028,1500.9315830.006
n: represents the exponent of the Constant Phase Element (CPE) used to model the non-ideal capacitive behavior of the electrochemical interface.
Table 12. EDS elemental composition (in wt%) of the surface oxide layers on EO. and TT. samples both obtained after 3 h treatment, after immersion in Fusayama-Meyer saliva containing 12,300 ppm fluoride at 37 °C.
wt%TiO
TT4456
EO7921
Disclaimer/Publisher’s Note: The statements, opinions and data contained in all publications are solely those of the individual author(s) and contributor(s) and not of MDPI and/or the editor(s). MDPI and/or the editor(s) disclaim responsibility for any injury to people or property resulting from any ideas, methods, instructions or products referred to in the content.