Article

Long Term Measurements of High Temperature Corrosion in a Waste Incineration Plant Using an Online Monitoring System

Institute for Energy Systems & Technology, Technical University of Darmstadt, Otto-Berndt-Str. 2, 64287 Darmstadt, Germany
*
Authors to whom correspondence should be addressed.
Corros. Mater. Degrad. 2025, 6(3), 45; https://doi.org/10.3390/cmd6030045
Submission received: 17 July 2025 / Revised: 22 August 2025 / Accepted: 15 September 2025 / Published: 18 September 2025

Abstract

High-temperature corrosion is a frequently observed phenomenon in waste incineration facilities. Municipal solid waste presents substantial corrosion potential attributed to elevated chlorine content and significant inhomogeneity in calorific value and chemical composition, rendering stable plant operation and corrosion control challenging. Conventional countermeasures, such as cladding or reduced steam parameters, lack temporal resolution and incur substantial costs or reduced efficiency. For this study, a waste incineration plant was equipped with an online corrosion monitoring system featuring ten sensors distributed across three vertical boiler passes. The system employs an electrochemical measurement principle to enable the detection of corrosion with temporal resolution. The recorded data reveals decreasing corrosion attack and increasingly stable deposits along the flue gas path. Combined with the temperature measurements, the sensor data proves the effectiveness of the shower cleaning in the third pass and confirms successful removal of the deposits. Statistical analysis shows a correlation between CO content and sensor data, while other parameters (e.g., steam flow, flue gas temperatures) exhibit no conclusive correlations, emphasizing the system’s added value. Chemical analysis of the electrodes and deposits reveal significant indications of chlorine and sulfur, suggesting chlorine-catalyzed active oxidation as the predominant corrosion mechanism.

1. Introduction

In waste incineration plants (WIP), fireside corrosion has a major influence on boiler and superheater lifetime [1]. Due to the fuel composition, the main cause for corrosion are reactions of the base material either with chlorine species, such as the gaseous HCl or Cl2 or from deposited particles [2,3]. In waste treatment facilities, two mechanisms have been identified as the most relevant causes of corrosion: Chlorine-based active oxidation and hot corrosion, also referred to as molten salt corrosion. Active oxidation is characterized as a reaction of chlorine compounds, such as HCl or Cl2, and the base material of boiler components to metal chlorides within the deposits. The chlorine compounds can diffuse into the deposits from the gas phase or be released within the deposits themselves via sulphation of previously deposited chloride salts. Hot corrosion refers to metallic materials dissolving when coming into direct contact with molten salts, significantly reducing the lifespan of the affected boiler components. Chlorides, sulfates, and corrosion products, including metal chlorides and sulfates, have been observed to form low-melting eutectics. An addition of heavy metals, such as lead or zinc, has been reported to further reduce the melting temperature and increase the corrosion attack [4]. Due to the reduced melting temperature of the salt eutectica, molten salt corrosion in industrial furnaces has been reported at temperatures as low as 300 °C [5,6].
Common countermeasures to decrease corrosion attack, mitigate maintenance cost and enable reliable operation include conservatively chosen steam parameters, reducing the achievable electrical efficiency of the process [7]. Despite the reduced steam temperatures, fireside corrosion remains a challenge in the context of waste incineration due to the volatile nature of municipal solid waste (MSW) or industrial waste. Another measure is cladding the original surface with corrosion resistant materials; for example, Nickel-based alloys [8]. This method can be applied to components exhibiting higher than expected levels of corrosion in operation. The extent of the corrosion attack is usually inspected during plant stops by non-destructive testing (NDT) procedures, such as visual or ultrasonic inspections. Corrosion coupons, which are mounted on the fireside of the furnace can also provide an estimate of the material lost to corrosion attack over a certain operational period. These options are only viable during shutdowns, thus observations can only be made with low temporal resolution [2].
Both measuring techniques and countermeasures are of a static nature, meaning they are constant during operation. However, due to the inhomogeneous composition of MSW and process influences, the intensity of the corrosion attack in WIPs fluctuates over time. As a result, the general remaining lifetime of a component can be predicted, but the limited temporal resolution does not allow analysis of the relationships between corrosion attack and the operating conditions of the power plant. As described above, drivers of material loss in power plants vary with time, but the commonly employed counter measures are static. Dynamic countermeasures include recirculation of flue gas components [9], or temporary countermeasures, such as specific modes of operation. Some operators have experimented with additives to reduce corrosion attack. Quantification of the efficiency of these methods is usually difficult, because the component in question can only be inspected during the next plant stop [2]. In addition to enabling dynamic corrosion countermeasures, on-line monitoring provides the operator with additional data to make informed decisions when evaluating control strategies and operating modes.
In the literature, a number of ways to implement online methods for corrosion monitoring by using the electrochemical properties of corrosion mechanisms have been reported, as Jaske et al. summarize [10]. A survey of the extant literature on electrochemical online corrosion monitoring systems reveals several limitations: Either the measurement periods or the number of sensors employed are limited [1,11], or the tests were conducted in laboratory environments, using ashes to replicate similar conditions [12,13]. Developments of online corrosion monitoring systems based on already available measurements were reported by plant operators. These systems are mostly focused on detecting zones with a reducing atmosphere by measuring the CO content of the near-wall atmospheres [14]. This approach relies on CO as an indicator to reveal reducing environments, providing spatially and temporally resolved data. However, the dominant corrosion mechanisms in WIPs do not require reducing atmospheres. Recently, several measurements using electrochemical measurement techniques in industrial plants were reported [15,16]. Both studies employed actively cooled probe designs, which were used to conduct measurements ranging from hours to 20 days in length. However, commercial application requires a much longer service life of the monitoring systems. Therefore, the presently available studies cannot provide a comprehensive review of the measurement system’s capabilities in realistic application environments.
This study presents an online corrosion monitoring system that provides time-resolved corrosion data and reports on the results of a test phase at a WIP in the Czech Republic. The main aims are to demonstrate the readiness of the online-corrosion measurement system in industrial environments over realistic operation intervals and to discuss the added value the system provides for the plant operator. In our previous studies, we reported on results of online monitoring of the corrosion attack in power and waste incineration plants [17,18]. This study expands the research in this area, discussing the correlations between sensor and plant data in greater detail and adding an investigation of the influence of electrode geometry on the recorded signals. In previous measurements, significant differences in the structure of the corrosion signals were found on sensors mounted in different positions in the boiler of a WIP [17]. Thus, the sensors were distributed in the three vertical passes of the boiler in groups, to verify previous results. In addition to the previously presented research, an additional electrode geometry was tested, aiming to provide increased sensitivity. This research will help provide reliable corrosion readings from the measurement system, thus fulfilling a key requirement for intuitive usability by operator personnel. The sensors used in this study are passively cooled and mounted in the membrane wall, allowing long term measurements without permanent supervision. In order to contribute further to the understanding of corrosion mechanisms found in WIPs, the electrodes of the sensors were subjected to extensive chemical analysis. This comprehensive evaluation of corrosion monitoring in a commercially operated facility should prove beneficial to both researchers and plant operators, as it offers insights into the process of establishing an online corrosion monitoring system in an industrial application.

2. Materials and Methods

The measurements were conducted in a waste to energy plant in the Czech Republic, which was commissioned in 2015. The plant serves as disposal point for the local domestic waste, and supplies the local district heating network. The boiler features a reverse-acting grate firing system and three vertical channels for radiant heat transfer, followed by a horizontal channel with the superheater tubes. The installed generator output is 10.5 MW [19]. The following sections describe the employed measurement system and sensor design, as well as the methods used for analysis of the measurement data.

2.1. Measurement Principle

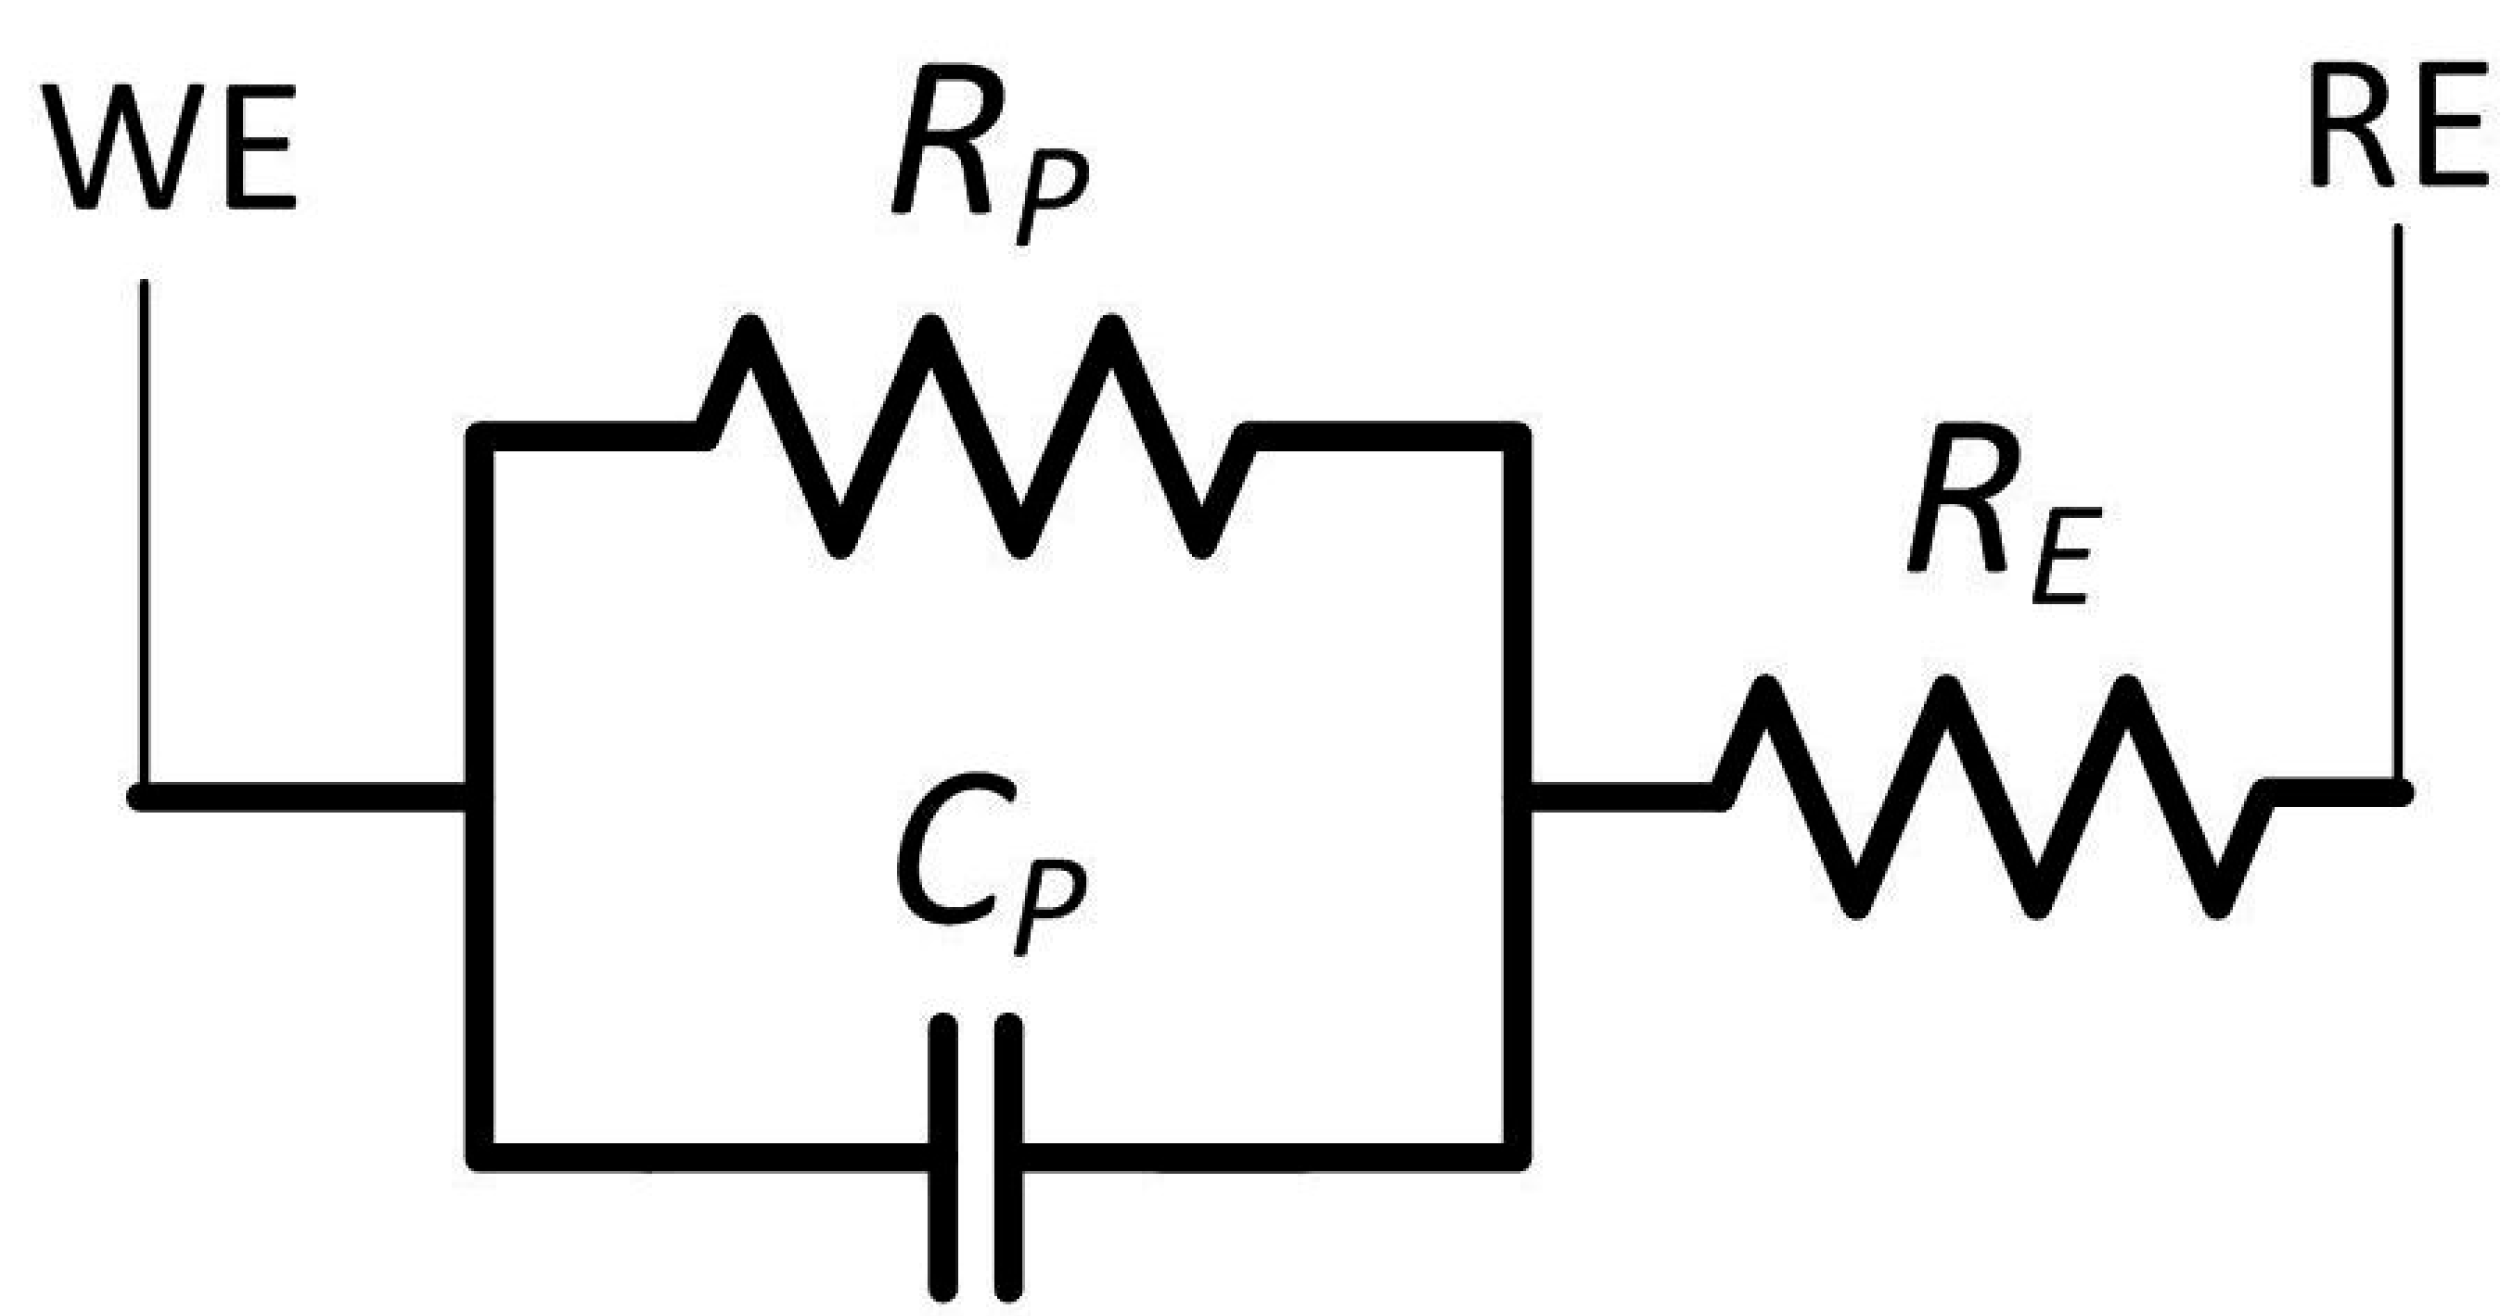
The online measurement of the corrosion attack is based on the Linear Polarization Resistance (LPR) method [10]. The electrodes and deposits form an electrochemical cell, which is represented by the simplified Randles Circuit, as demonstrated in the following Figure 1. In its freely corroding state, the electrode trends towards the free corrosion potential, where anodic and cathodic partial reactions are in equilibrium. In this state, a double layer forms at the electrodes surface as a result of the differing potential between deposits and electrodes. To leave the metal lattice, ions must overcome the resistance provided by the double layer, which is modeled by the polarization resistance RP and the polarization capacity CP. In the Simplified Randles Circuit, the resistor RE denotes the electrolyte resistance between the working and reference electrodes (WE/RE). For aqueous electrolytes, RE can frequently be neglected, allowing RP to be measured directly by employing a low excitation frequency [10]. When RE is significant, as in this study, a high frequency measurements enable direct determination of RE, since the currents predominantly charge the capacitor CP. At low excitation frequencies, the influence of CP becomes negligible and the measured resistance corresponds to the sum of RP and RE instead. The excitation parameters used here are listed in Table 1.
Stern and Geary [20] derived the formula shown in Equation (1) to calculate the corrosion current from a given polarization resistance RP, provided the employed AC currents amplitudes are sufficiently small:
I c o r r =   B R P
Here, the anodic and cathodic Tafel slopes define B as a material constant, as shown in equation 2. High values of Icorr (or low values for RP) indicate a high corrosion attack, because the double layer provides only low resistance to ions leaving the metal lattice.
B = β a + β c 2.3 β a + β c
The employed measurement principle can be described as a simplified electrochemical impedance spectroscopy (EIS), featuring potentiostatic polarization of the electrodes at two specified frequencies. The main reason to choose the LPR method over EIS was the availability of robust and comparatively inexpensive industrial grade field devices capable of performing the LPR measurements. The intended scope of the measurements would not have been possible within the budget constraints of the research project with the use of the EIS method.
To guarantee adequate data integrity within recorded measurement intervals, multiple validation procedures are implemented on the original datasets. These involve the detection of data storage failures, short-circuits of the sensor electrodes and thermocouple failures. Where accessible, data from the plant control system was incorporated in the plausibility analysis, along with the sensor data. Given the clustered arrangement of sensor installations, anomalous readings from individual sensors can be dependably identified through comparative analysis. The employed methods are the same as in our previous publication, where they are described in greater detail [18].

2.2. System and Sensor Design

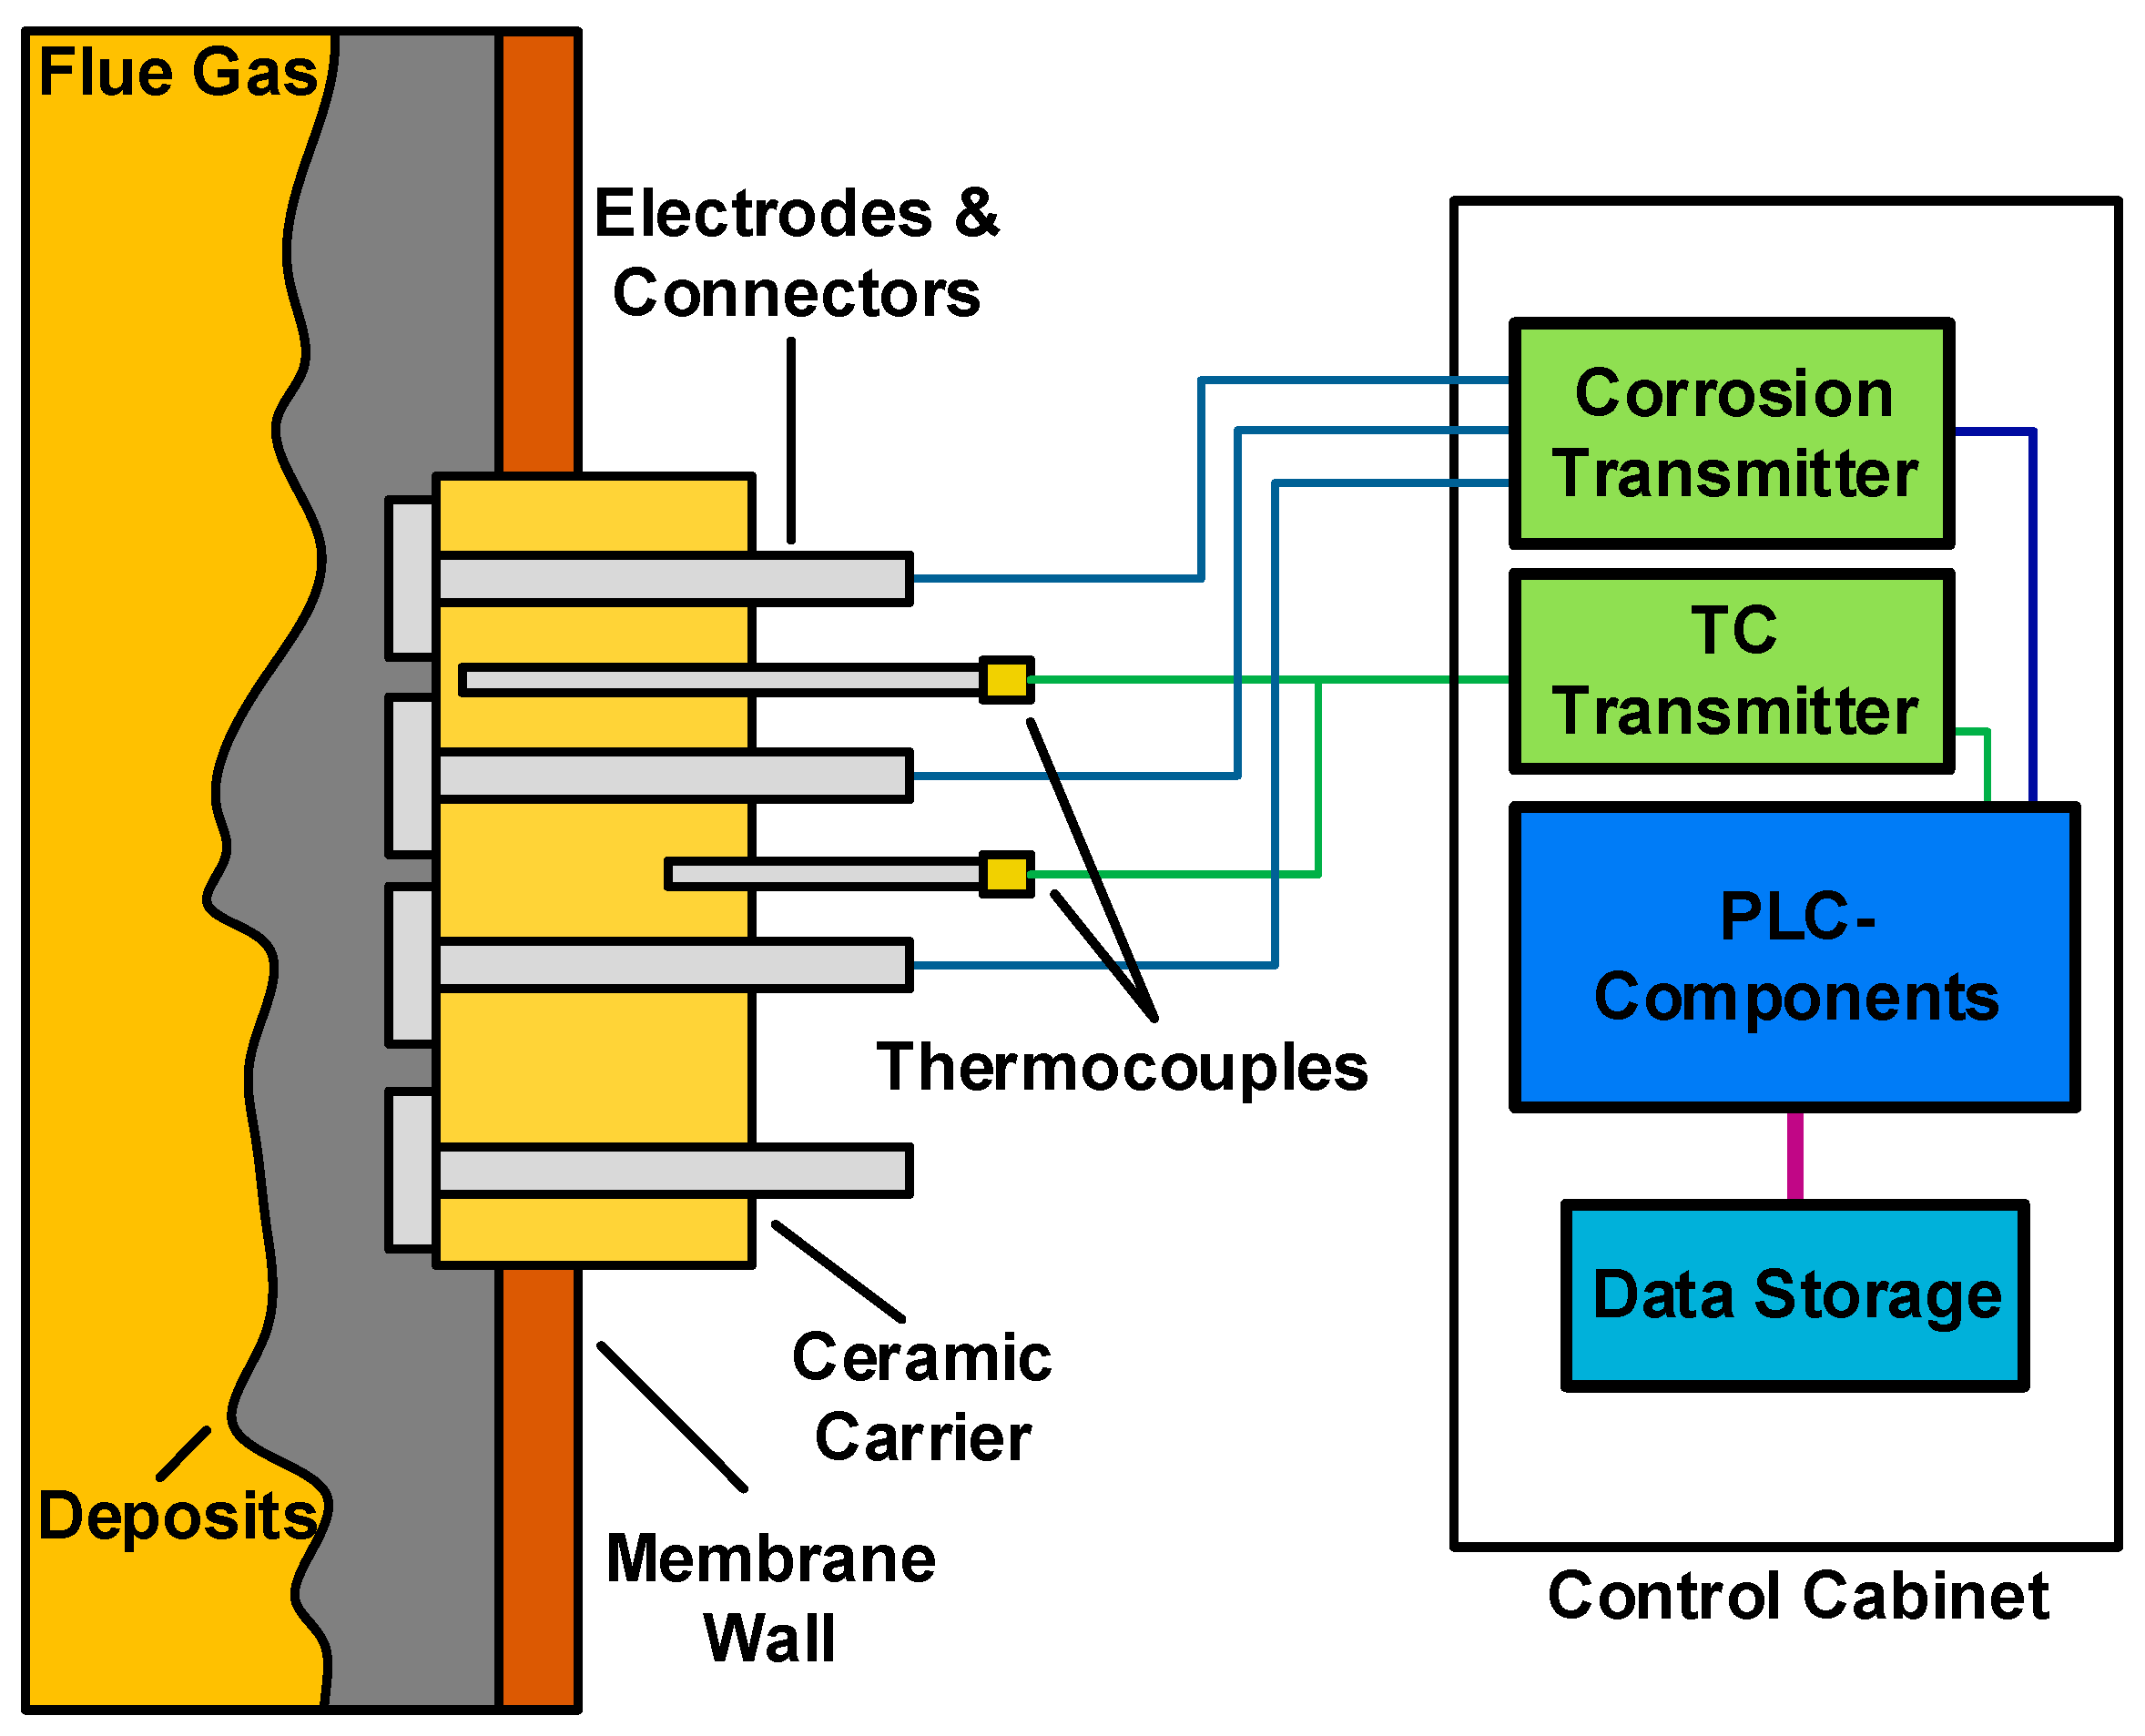
The online corrosion monitoring system employed in this study consists of three major components: The sensors, the local transmitter cabinets and the central control cabinet. The local cabinets house the corrosion transmitters, switches for connecting to the sensors, as well as the temperature transmitters. The central cabinet is responsible for controlling the switches, storing the measurement data and the central energy supply for the system. In theory, the programmable logic controller (PLC) components of the system can be expanded to address far more sensors than the ten planned for this study. Thus, the system can easily be scaled to meet virtually any demands in terms of measurement locations and spatial resolution of the corrosion attack. However, the main cost factor of the systems are the corrosion transmitters, and each added transmitter would yield diminishing returns in terms of new information about the corrosion attack. Using the same transmitter for an increasing number of sensors would decrease the temporal resolution of the measurements, contradicting the main selling point of the online method. The final size of the system in industrial applications will likely be defined by economic considerations.
The sensors are equipped with electrodes to measure the corrosion attack and two thermocouples (TC), measuring the temperature in the ceramic carrier. One TC tip is located 0.5 mm beneath the electrodes, the other at a distance of 5.5 mm, enabling the determination of the heat flux through the carrier. In Figure 2, an overview of the measurement system is presented, detailing the major system components and connections.
The sensors feature electrodes, which extend into the combustion chamber of the boiler. During operation, deposits form on the electrodes from fuel ash and other solid or molten components of the fuel. Together with the electrodes, which are mounted on an isolating ceramic carrier, these deposits form an electrochemical cell, which can be used to determine the current level of corrosion attack by means of the Linear Polarization Method (LPR) [10]. As displayed in Figure 3A, the sensors are mounted from the outside of the boiler after minor preparations of the position and due to the passive cooling, closely follow the temperature of the membrane wall in operation. On the fireside, two electrode geometries were employed in this study. The standard geometry (labeled “4Q”) for this study is shown in Figure 3B and features four squared electrodes, of which three are used for the measurement principle. The fourth electrode functions as a coupon and can be used to ensure that the measurements themselves do not influence the corrosion attack. To enhance the sensitivity of the sensors for low corrosion environments, the alternative geometry (labeled “3L”) shown in Figure 3C was developed. The underlying idea in for the alternative geometry is to reduce the effective resistance between working- and auxiliary electrodes by elongating the opposing edges. Both geometries have been used in previous research [17,18], but never in close proximity in the same plant and connected to the same transmitter, as in this study with the third set of sensors (see Section 2.3). This procedure allows direct comparison of the results from both geometries.
The electrodes are manufactured from 16Mo3 (1.5415) steel, which is a similar grade compared to the base material used for the boiler components. 16Mo3 is suited for high temperature applications up to 530 °C [21]. According to the Pitting Resistance Equivalent Number (PREN), the material features a low resistance to corrosion attack. This choice was made so the electrodes would experience significant corrosion attack during the measurements, ensuring both evaluable corrosion signals and mass loss. Since a replacement of the sensors was planned for each revision during the project duration, the durability of the electrodes was of no concern here. In previous investigations in a lignite fired boiler, a sensor set of comparable design and with the less robust 3L geometry was dismounted after a service time of three years. After this extended service interval, some of the connectors on the working and auxiliary electrodes failed, but the more robust reference electrodes could reliably be recovered. We thus concluded that the 4Q geometry should have performed better in this long-term application with a single sensor set [18]. In another WIP, sensors with the 4Q geometry were in service for a time of two years and were successfully recovered with all electrodes intact [17]. It can thus be concluded that the total service time of the sensors, if manufactured from low grade steel, is around two to three years, depending of the process. Durability could likely be increased by manufacturing the carrier and connector parts from higher grade steel, without affecting sensitivity. If the behavior of a specific alloy is of interest, the electrodes could be manufactured from other materials as well in other applications.

2.3. Measurement Scope

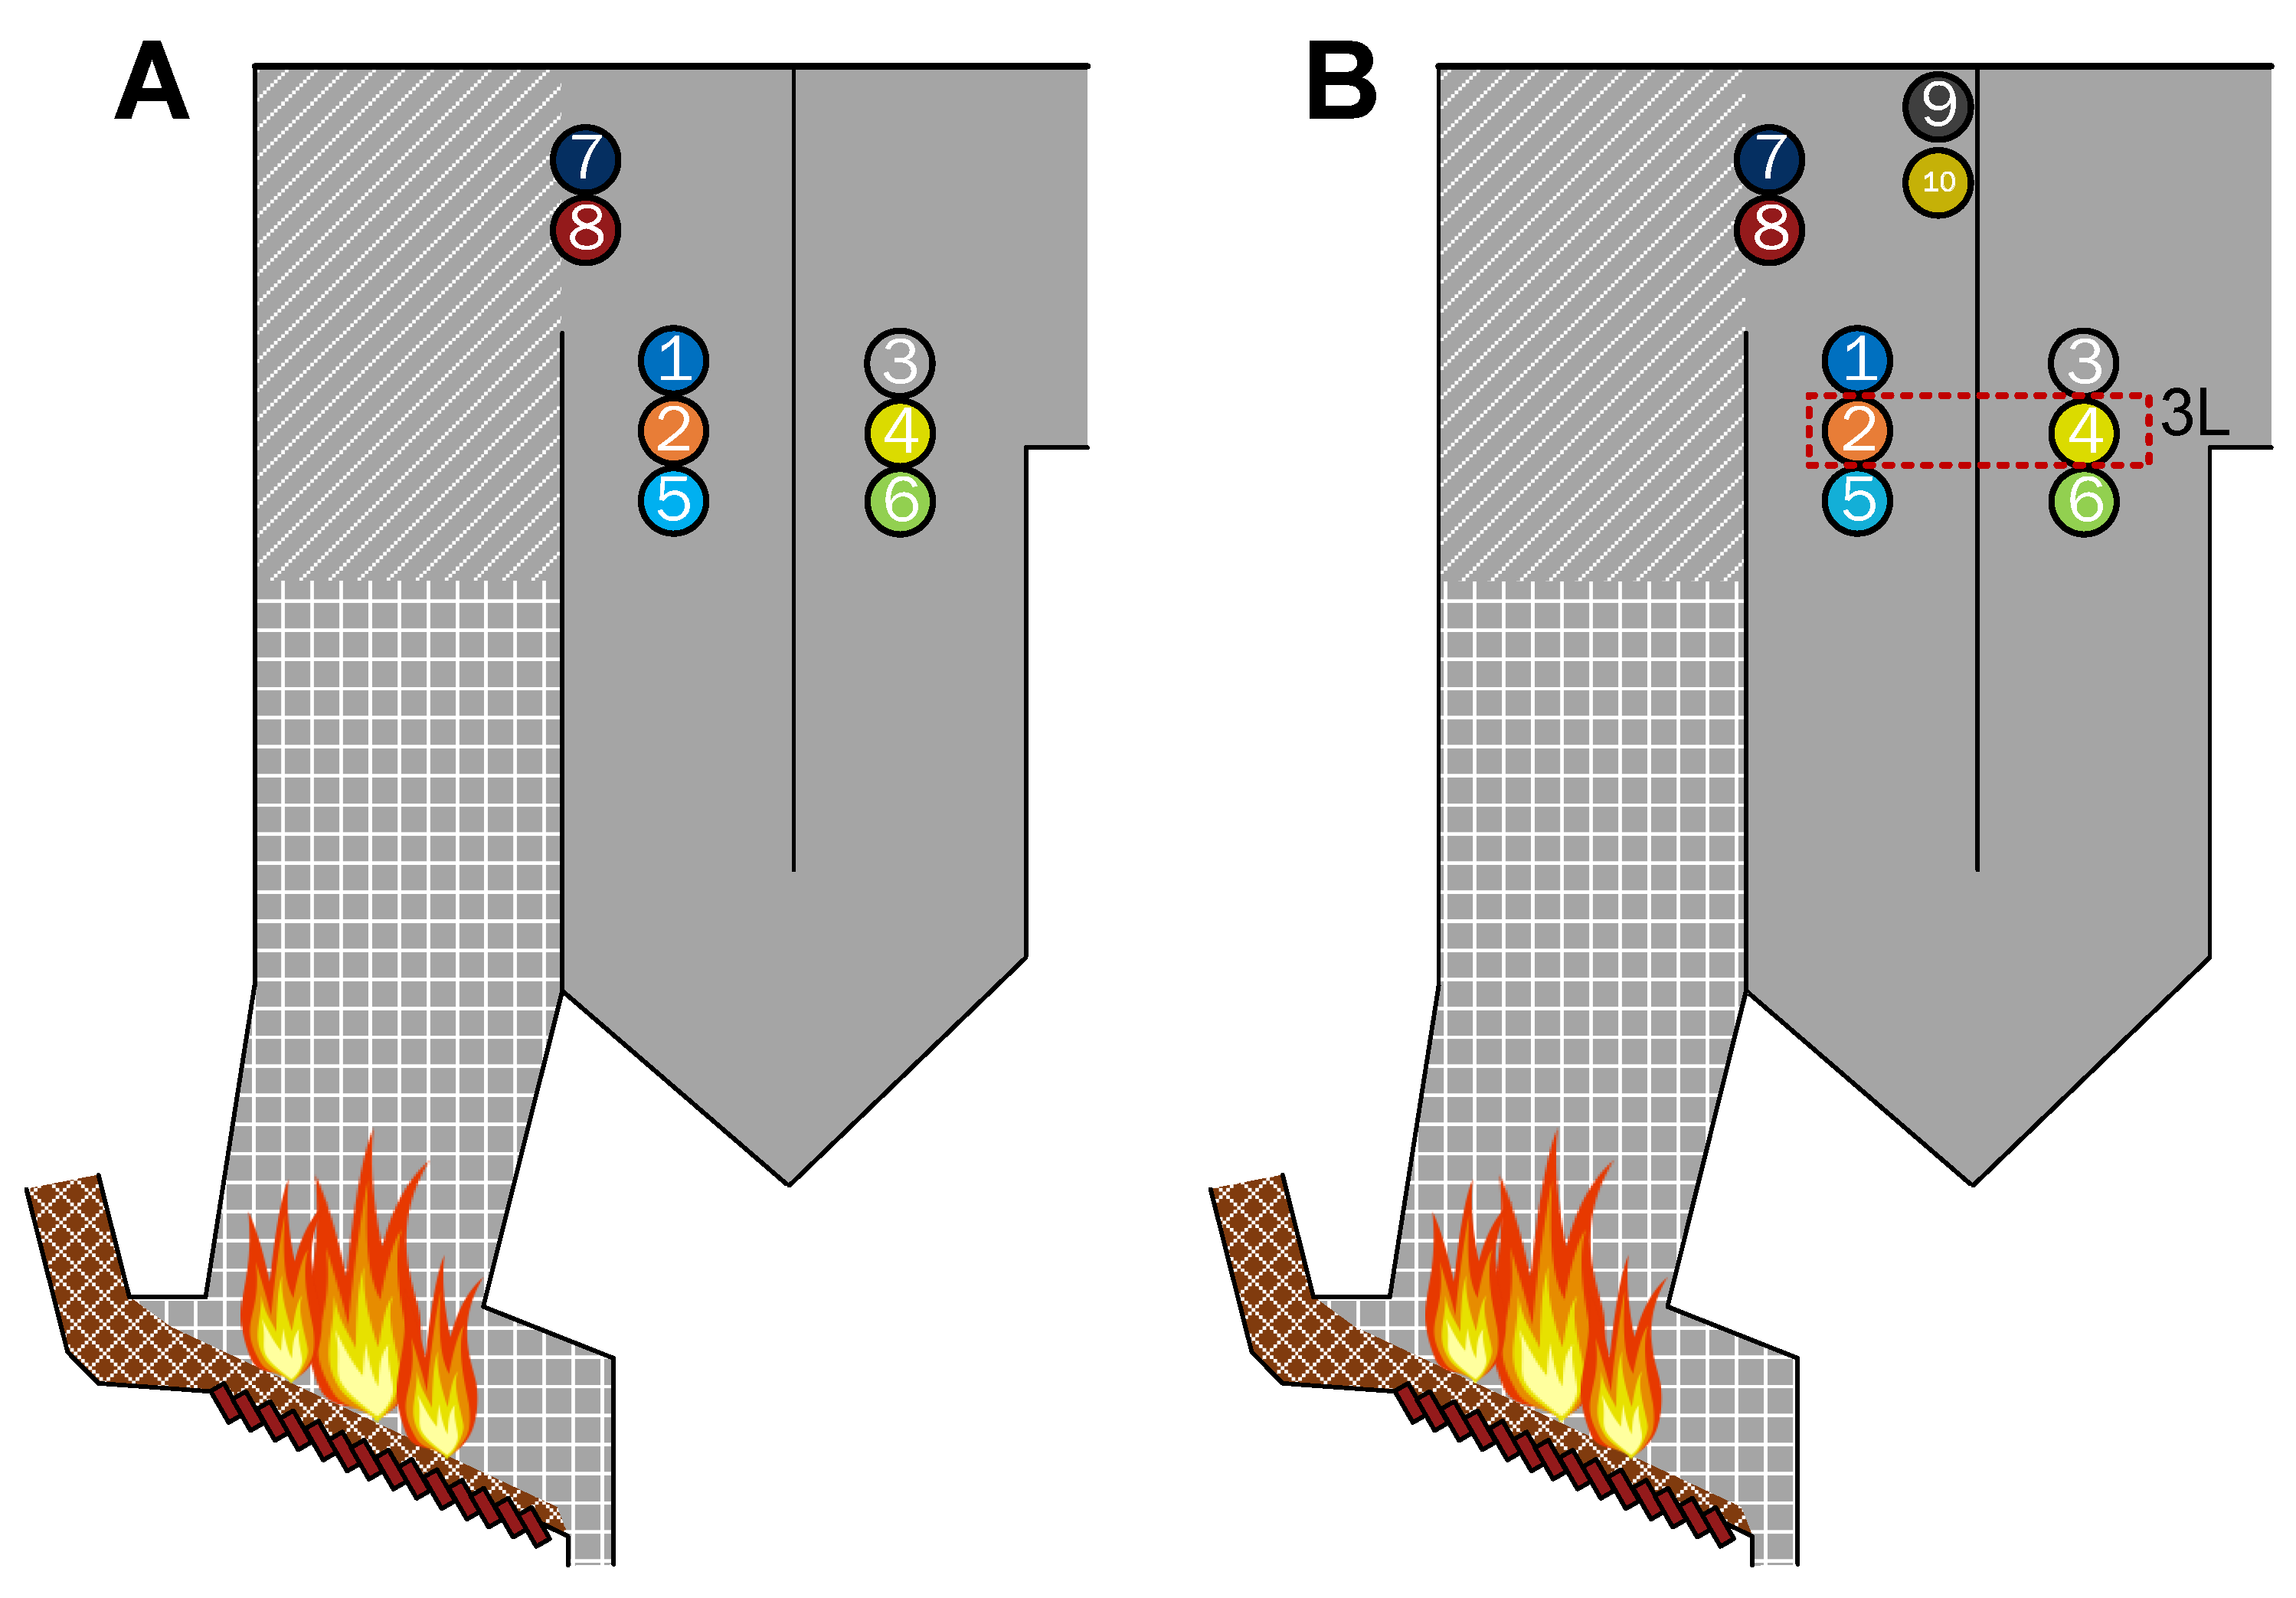
During the research project, long-term online corrosion measurements were performed for a three-year interval. The system was first installed in August 2022 and featured eight sensors in three groups located in the side wall of the boiler, as detailed in Figure 4A. For cost efficiency, the corrosion transmitters alternate between two sensors each, providing on average one corrosion measurement every eight minutes per sensor. In an effort to generate sufficient data for calibration of the corrosion signals, the sensors were replaced by a new set each year. For the third sensor set, the operator suggested the installation of a fourth sensor group located near a position where extensive corrosion was detected by conventional monitoring techniques. Furthermore, sensors S2 and S4 were equipped with the alternative electrode geometry for the third sensor set. Figure 4B provides an overview of the third sensor set in the boiler, where sensors S9 and S10 were added. In the original plan, sensors S7 and S8 were placed at the same height as the other groups in the first pass of the boiler. This placement had to be changed per request of the plant operator, which is why this group was moved along the flue gas path to the end of the cladded area.
The original plan to quantify the sensor signals involved regular replacement of the sensors and analysis of the mass loss of the electrodes. This procedure requires the recovered electrodes from the measurements, as well as a complete data set of the recorded corrosion signals. Unfortunately, the boiler walls were sandblasted before the sensors of the first set could be removed. Since sandblasting is an abrasive cleaning procedure, the derived mass losses of the electrodes would have been imprecise. Thus, calibration based on the first sensor set was not feasible. During measurements with the second set, a storage malfunction lead to the loss of a significant portion of the recorded data, making quantification unviable. The electrodes could be recovered with intact deposits, and were used to perform the chemical analysis presented in this work. The data storage problem has been solved by implementation of redundancies, and measurements with the third set of sensors are ongoing as of the time of writing this work. The measurements are planned to be continued until 2026. Table 2 summarizes the main difference between the three sensor sets and presents the commissioning dates, as well as the employed electrode geometries. In November 2024, a measurement campaign was performed, which included two quick load transitions from full to partial load and back.
If sensor recovery is successful for the third sensor set, this will provide the basis for a Quantification of the recorded corrosion data based on the electrodes mass loss. A possible approach for quantification of LPR measurements was presented in our previous publication about measurements in waste treatment facilities [17]. Based on the measurements with the third set, a comparison with the results from the other WIP can be drawn.
For future measurements, the measurement positions can easily be adapted to other boiler sizes or accessibility of the boiler wall at individual plants. Additional sensors could be distributed based on the operator’s experience about anomalies in the material loss of the walls. The sensor distribution in this study was chosen so that measurements could be taken at positions as far apart as possible in the flue gas path while keeping the spatial distance between the sensors small. This allows the use of short cables between the sensors and transmitters and simplifies the installation of the system on site. The installation of sensors in groups has proven valuable in the past, enabling the validation of characteristic patterns for the mounting position and detection of sensor failure. Based on these considerations, a minimum of six sensors, placed in groups of two in each vertical pass would be recommended for measurements in a boiler of this design.

2.4. Scope of the Chemical Analysis

In addition to the sensor and plant data analysis, the deposits found on the electrodes of the second sensor set were examined using incident light microscopy (ILM) (Nikon, Tokyo, Japan),scanning electron microscopy (SEM) (Thermo Fisher Scientific, Hillsboro, OR, USA) and energy-dispersive X-ray spectroscopy (EDX) (Oxford Instruments, Abingdon, Oxfordshire, UK). The ILM images are used to characterize the loss of the base material and identify differences between the sensor groups. SEM analysis aims to determine the thickness and protectiveness of the oxide layers, while EDX reveals the distribution of corrosive components in the deposits. Together, this information can be used to discuss characteristic differences in the actual corrosion attack on the sensor electrodes, providing data for validation of the electrochemical measurements. In addition, likely candidates for the dominant corrosion mechanism can be determined. As discussed in Section 2.3, this sensor set was retrieved from the plant after approximately a year in service with intact deposits. The sensor data shows increased corrosion during plant stops, when the sensor temperature drops below 50 °C. In previous studies, this phenomenon could be attributed to hygroscopic properties of the deposits, which lead to an acidic environment on the membrane walls during shutdowns, facilitating corrosion attack [17]. Thus, the sensors were recovered from the membrane wall at the beginning of a plant shutdown, as soon as the membrane wall temperature had cooled down enough to allow safe working conditions. The sensor temperature was still above the critical temperature at the point of removal. The electrodes were extracted from the sensors and promptly packaged with a drying agent following the recovery process, with the objective of preserving the state of the subject to the greatest extent possible. The preparation of the cross sections was carried out dry, without oil or water, to avoid the loss of soluble components. The analysis was performed on two electrodes from each sensor group, chosen based on the thickness and overall integrity of the deposits after dismounting from the ceramic carrier. This provides a comprehensive overview of the corrosion attack from the end of the first to the end of the third vertical pass.

2.5. Temperature Influence on Measurement Data

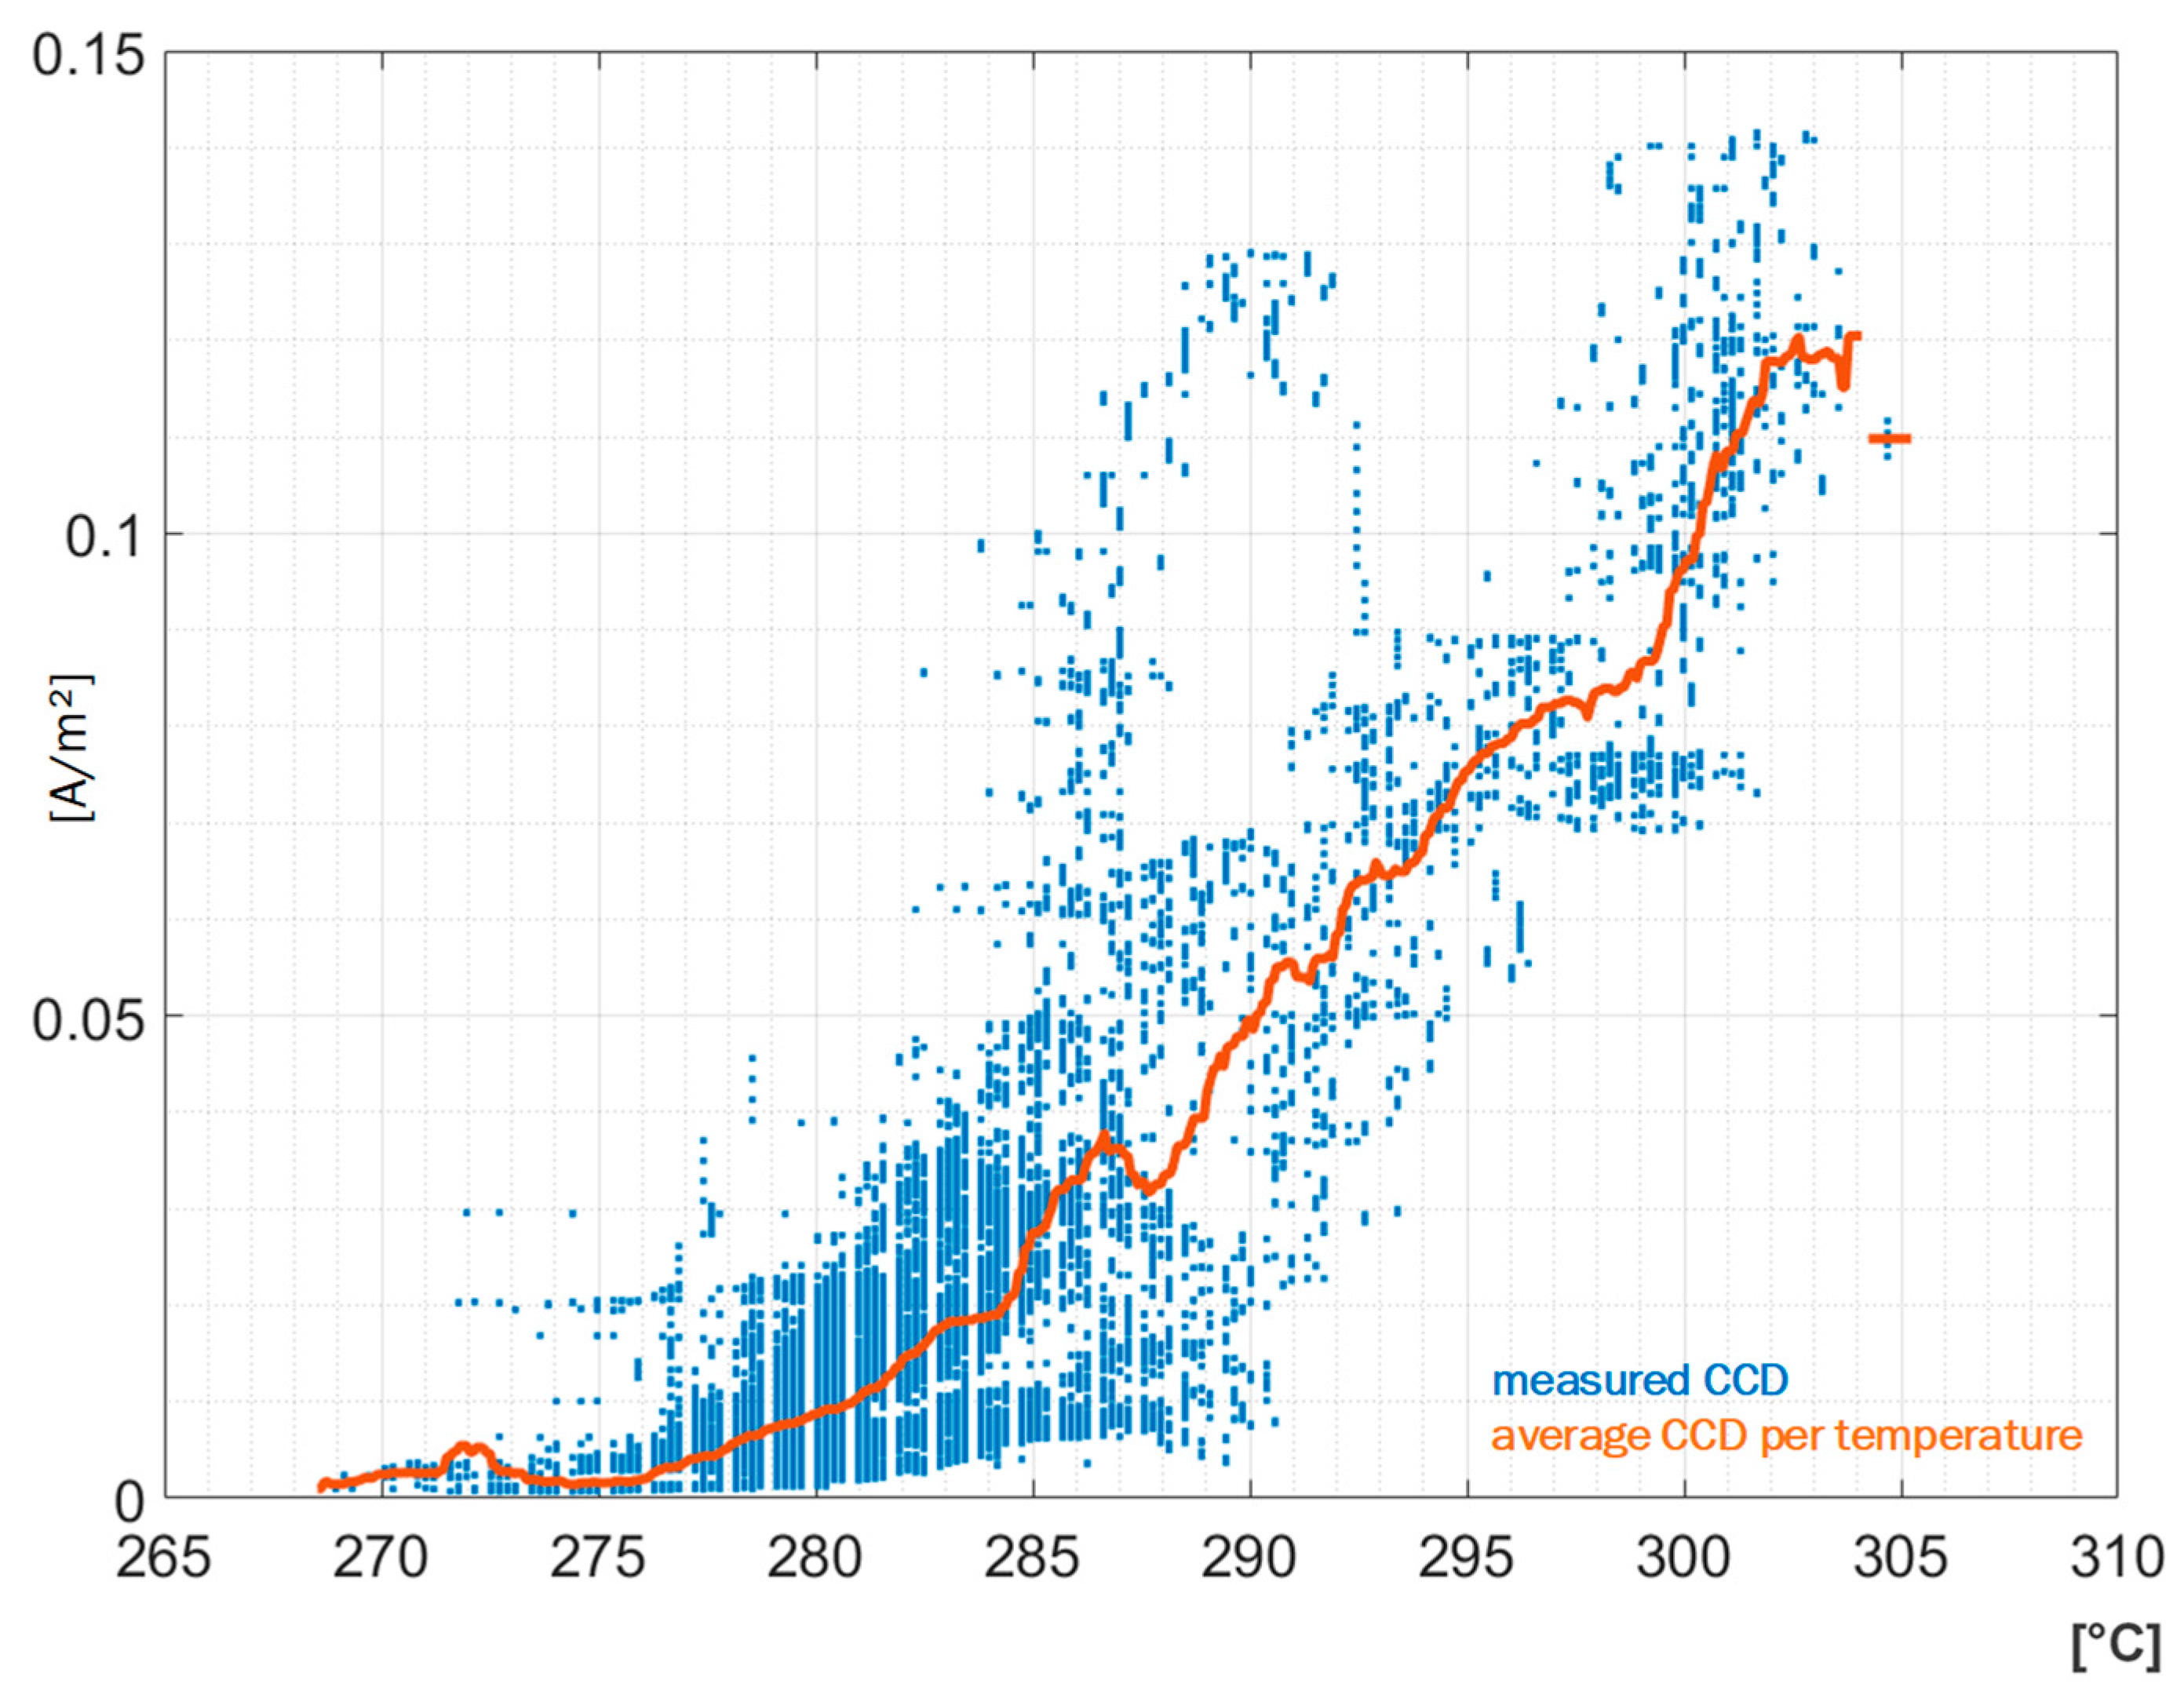
Corrosion phenomena in high temperature environments strongly depend on the temperature at which the corrosion reactions take place [22]. The recorded sensor data supports this hypothesis, showing increased corrosion current densities (CCD) above 260 °C sensor temperature. During operation, the sensors usually do not exceed 320 °C. In this limited temperature range, recorded CCD span multiple orders of magnitude and continuously rise with increasing sensor temperatures. Since temperature cannot be controlled due to the sensor design, the temperature influence requires normalization to facilitate detection of correlations between plant parameters and sensor data. The normalization procedure aims to eliminate temperature effects by comparing individual CCD measurements against temperature-specific baseline values derived from the data set. This approach produces normalized CCD that indicate whether recorded corrosion attack exceeded or fell below expected levels for the respective sensor temperature, enabling more effective statistical detection of plant control parameter effects compared to analyzing raw sensor data. Figure 5 provides an overview of the results of this normalization process, showing the individual sensor readings as blue dots and the derived baseline as orange graph. Our previous publication describes the normalization process in greater detail [18].

2.6. Principal Component Analysis

The principal component analysis (PCA) is a statistical tool, which can be applied to large data sets. The main applications of the procedure are twofold: The first is to reduce the dimensionality of the data set by identifying correlations between the original variables and grouping them in principal components (PC), the second to reduce noise in the data by discarding PC which describe insignificant variance in the data set. The data should be prepared by centering and scaling, so that the mean values of all variables are zero and the standard deviation equals one. The PCA involves firstly the determination of the covariance matrix of the original variables and then the computation of the eigenvectors and eigenvalues thereof. While the eigenvectors of the covariance matrix represent the principal components, the eigenvalues determine the amount of variance in the original data set explained by the corresponding PC. Typically, as in this study, the PC with the highest eigenvalues are chosen to further analyze the data set. An inherent property of the PC is that they are uncorrelated with each other, simplifying further analysis [23].
PCA is used in this study to gain an understanding of the structure of the plant data and identify interesting operational parameters for correlation analysis with the recorded sensor data. The analysis is based on the CCD from the ten corrosion sensors, as well as operational plant data recorded from November 2024 to March 2025. During this interval, the initial deposit build-up was completed for all sensors of the third set, ensuring representative data for the comparison.
The stability of the PCA is tested by employing a bootstrap algorithm, which randomly samples rows from the original set until the same set size is reached. This process is repeated one hundred times to create new data sets. These bootstrapped sets are then input into the PCA again to ensure that the results are not rooted in a specific subset of observations contained by the original data set.

2.7. Discussion of Measurement Accuracy

The measurement system records admittance, CCD measurements, and temperature via two thermocouples with differing insertion depths, allowing for estimation of heat flux density. The calculation is based on the assumptions of uniform and one-dimensional heat transfer, which is likely not the case in application due to deposit coverage. Temperature measurement uncertainty is low (±2 °C), compared to the absolute temperature value [24]. However, the typical temperature difference created by the two insertion depths during operation is between 2 and 3 °C. Combined with possible errors during sensor assembly, the uncertainties lead to a high expected relative error of up to 250°% for the heat flux calculation. It should be noted that, despite the high estimation of the relative error, none of the sensors show an inversed temperature difference, where the TC with higher insertion depth reads lower temperatures than the other. Therefore, the calculations are likely more accurate than the estimation presented here. Nonetheless, heat flux results should be interpreted qualitatively rather than quantitatively. A comparison between absolute heat flux values of different sensors is also not sensible under these preconditions.
A detailed analysis of the measurement error of the corrosion transmitters used in this study has been presented in our previous publication [18]. For the purpose of the analysis presented in this study, two key results of this analysis are important: Firstly, the value of the Polarization Resistance RP can be determined with less than 15% relative error in the range from 300 Ω to 30,000 Ω, which equates to an indicated CCD between 1 A/m2 and 10−3 A/m2. In practice, this interval translates to a high corrosion attack and includes the majority of the recorded signals analyzed in this study. Secondly, despite decreasing accuracy when measuring higher resistances, which equals lower corrosion attack, the qualitative nature of the signal was proven, meaning lower signals can be interpreted safely as lower corrosion attack. The inaccuracy of the measurement in low corrosion environments would therefore be relevant for a quantification approach of the sensor data, which is beyond the scope of the present study.

3. Results and Discussion

This chapter presents the results of the conducted experiments, discussing the recorded sensor data and the correlations with plant parameters, as well as the chemical analysis of the retrieved electrodes. The sensor data analysis is based on the sensor set currently mounted in the plant and corresponding plant data. The chemical analysis was performed in the second sensor set, which was in operation from July 2023 to August 2024. As discussed in Section 2.3, the data does not allow for a quantification of the sensor data as described in previous publications [17,18]. Instead, correlations with operational events such as shower cleaning, plant data and the chemical analysis are employed for validation of the sensor data.

3.1. Analysis of Sensor Data

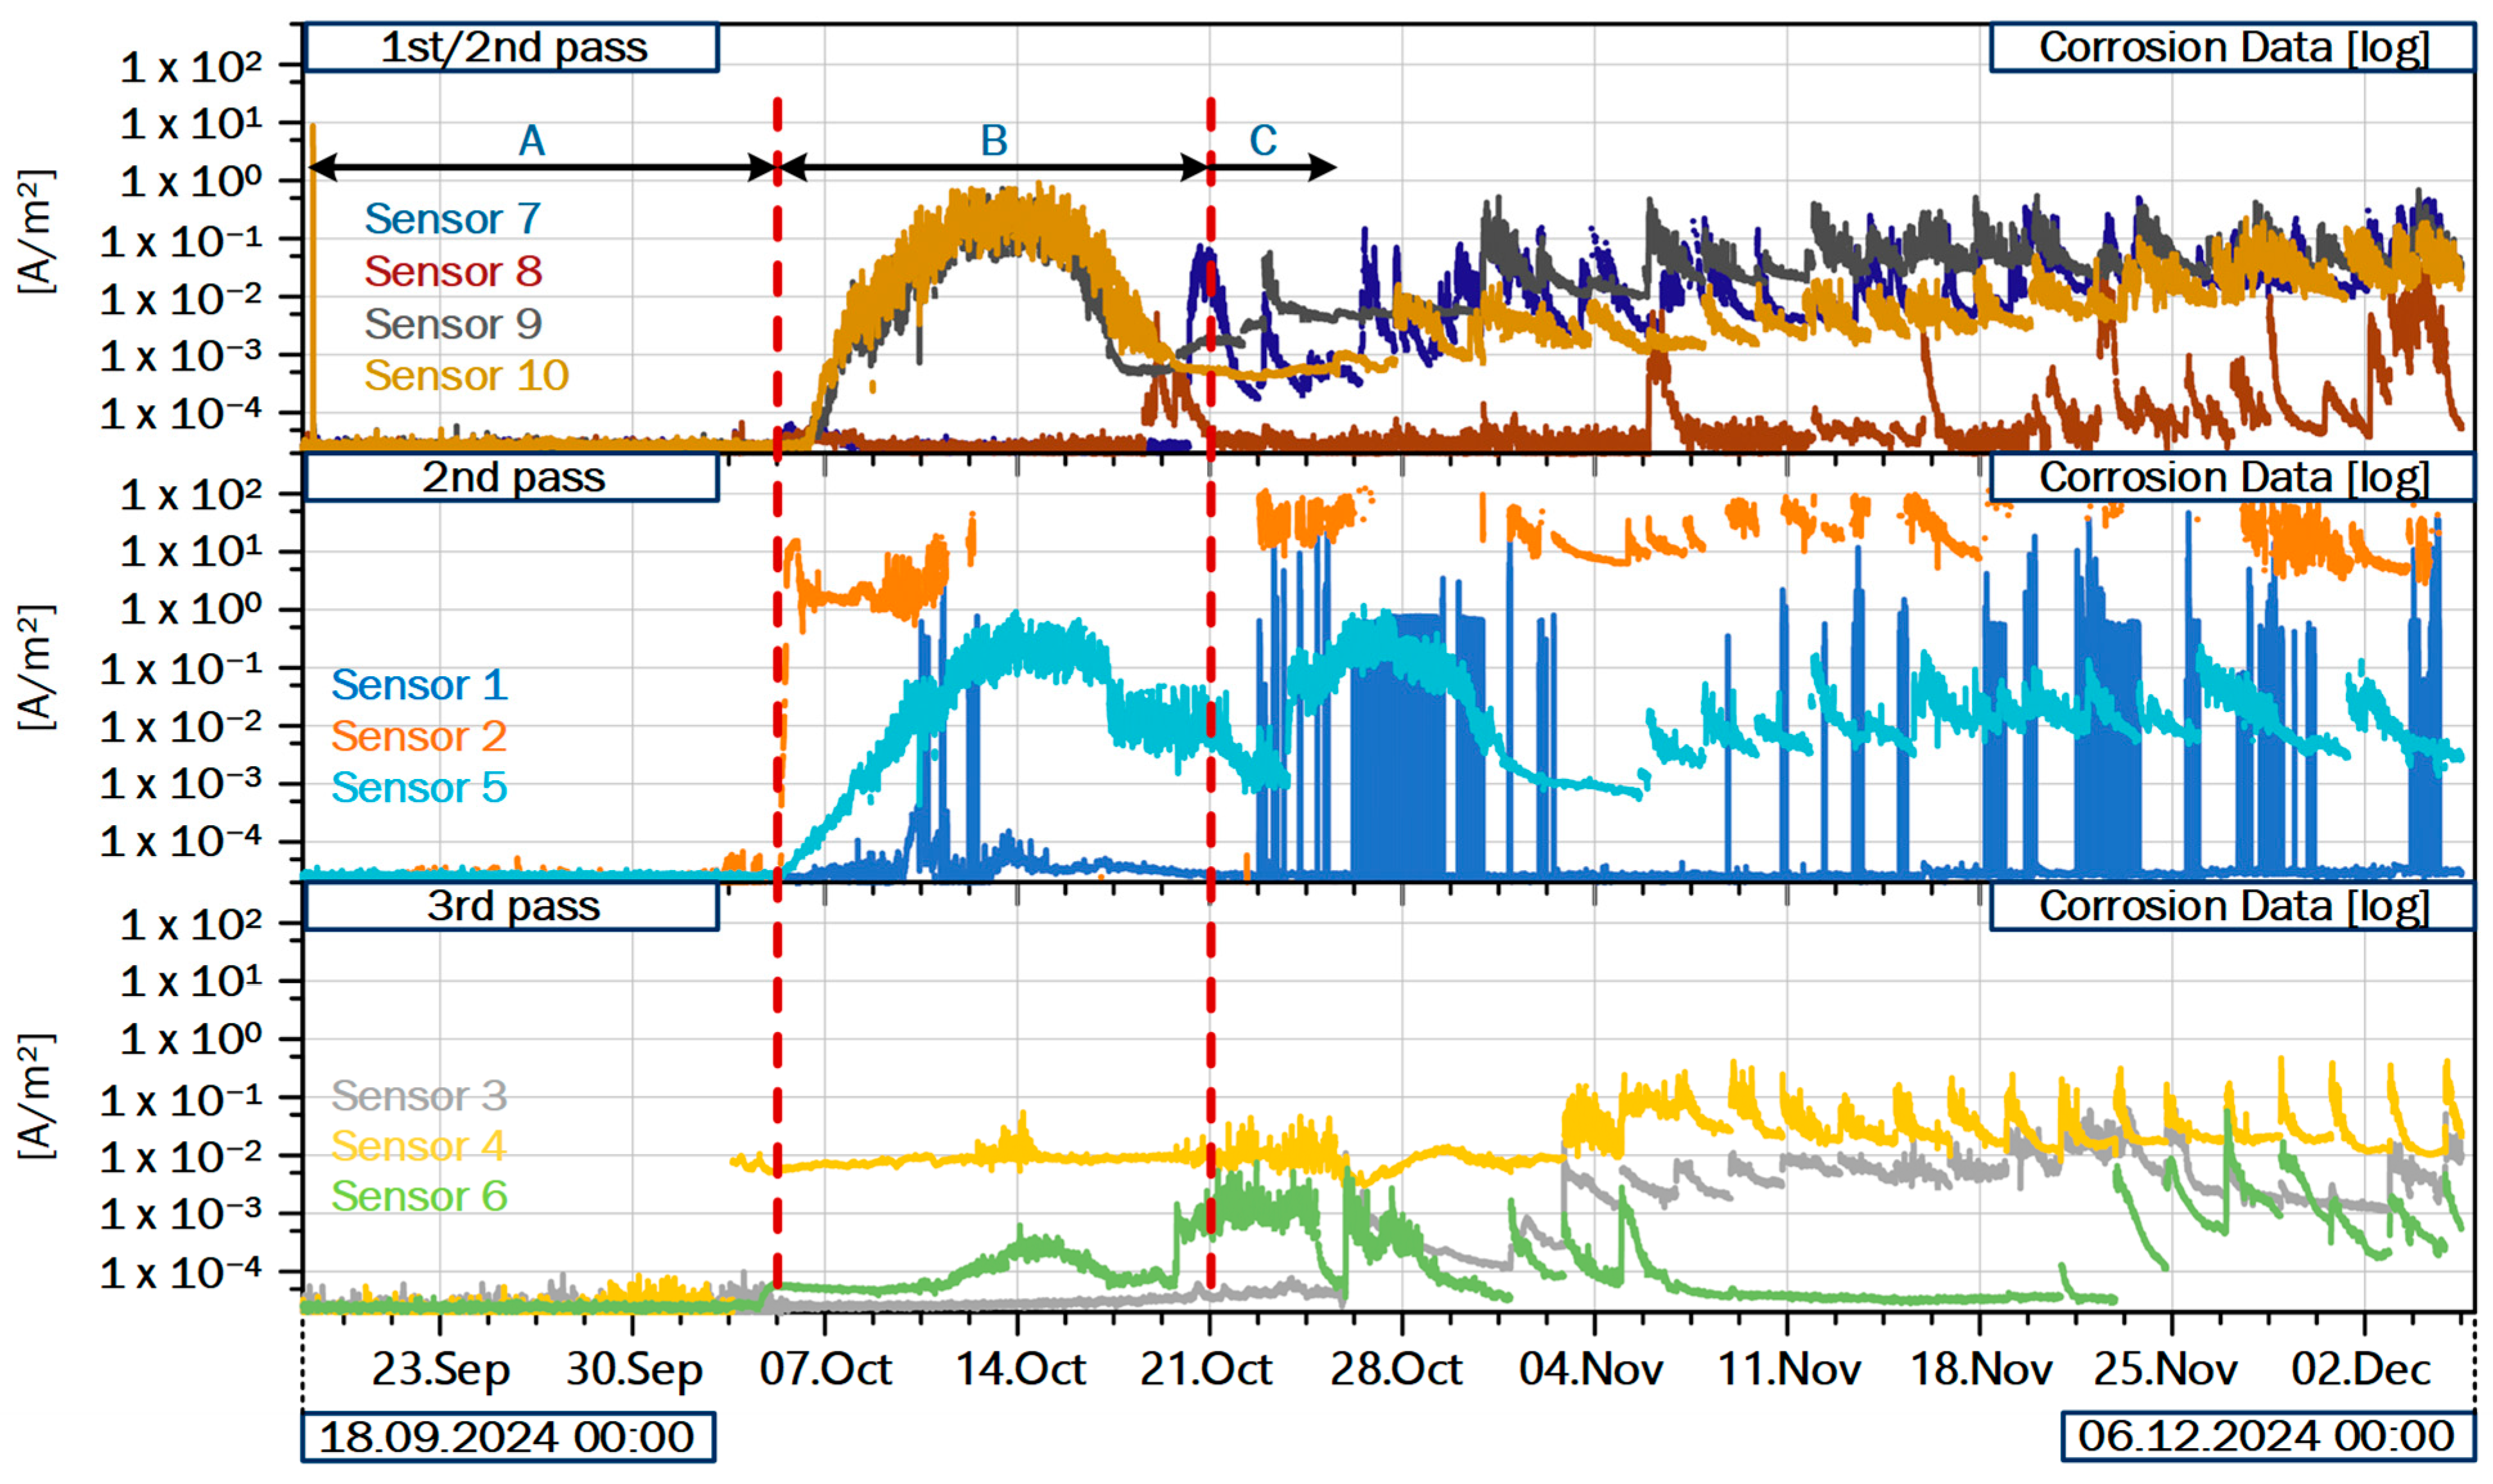
This section discusses the data recorded directly by the sensors and the interpretation thereof. The following analysis is based on the data recorded with the third sensor set, starting with its installation in September 2024. The data set serves as an example for the entirety of the performed measurements. Discussed observations and presented conclusions can also be found in the data from the other sensor sets. As a first step, the time resolved corrosion data recorded by the monitoring system is analyzed. Figure 6 provides and overview of the sensor data recorded during commissioning of the third sensor set in 2024, as well as the following months. The sensors are grouped based on their location in the boiler, with the top graph showing the sensors placed first along the flue gas path (compare Figure 4). In interval A, before the first plant startup, all sensors show the default signal. After startup, about two to three weeks are needed to form significant deposits (interval B). Following the initial deposit build-up, the data from almost all sensors shows the expected patterns and magnitudes of corrosion (interval C).
Comparing the corrosion signals of sensors within the same group, we usually find comparable patterns. For example, in the first group, consisting of sensors S7 to S10, the recorded CCD trend towards a base level between 10 × 10−2 and 10 × 10−1 A/m2 in interval C. All sensors show peaks with a steep ascending flank, increasing the signal of up to one order of magnitude. The descending flanks are commonly flatter, forming a characteristic saw tooth pattern. These peaks are comparable in frequency and magnitude for the sensors in each respective group, indicating that the corrosion attack is comparable. Notable outliers from their respective groups are firstly sensors S1 and S8 and secondly the two sensors equipped with the alternative electrode geometry, S2 and S4. The signals from S1 likely originate from an electrical issue. Comparable patterns were observed in previous experiments and could be attributed to conductive components in the deposits on the electrodes. Subsequent tests showed that short circuits between electrode connectors would produce similar results. In the present case, a detailed analysis can only be conducted after dismounting the sensor. Sensor S8 delivers plausible recordings and continuous measurements, albeit much a lower CCD than sensor S7, which is mounted just about twenty centimeters further upwards in the boiler wall. During the measurement campaigns, a pronounced line of thicker deposits was identified with an infrared (IR) camera during the second measurement campaign. The line of deposits crossed the area where S7 and S8 are mounted, providing a plausible explanation of this behavior. Due to the flue gas flow field of the plant, which is being redirected from upwards flow in the first pass to downwards flow in the second in that area, sensor S8 might be located in an area with low deposition rates.
The two sensors equipped with the alternative electrode geometry, as displayed in Figure 3, also exhibit different behavior compared to the other sensors in the same group. In both cases, the CCD are of a higher level and recorded peaks are more pronounced, supporting the hypothesis that the alternative design increases sensor sensitivity. In the second pass, this increase unfortunately results in insufficient data quality, because the upper measurement range limit is reached frequently. In the third pass, sensor S4 confirms increased sensitivity of the alternative geometry, while also recording continuous corrosion signals. This allows a detailed analysis of the cleaning measures employed in the plant, as discussed below. Both sensor signals seem to jump from the base signal level to the operation signal at the first plant startup, suggesting that the initial deposition formation phase might also be shortened by the alternative geometry. From the first data set, we can conclude that the test of the alternative geometry was successful. Elongating the opposing edges of the working- and auxiliary electrodes shows promising results for the application in low-corrosion environments and might also help in situations where deposits form only slowly. This can be seen from the following analysis of the cleaning activity, which was enabled by the increased sensitivity of the alternative geometry. Overall, the standard geometry remains the more robust and versatile geometry for the application at hand, allowing measurements and general interpretation of the data in the low-corrosion area of the third pass, while not exceeding measurement limits in the areas with higher corrosion attack.
Comparing the signals from the three groups to each other, we notice a decrease in absolute indicated CCD along the flue gas path. All sensors show peaks with the characteristic saw tooth pattern described above. In the sensor data, CCD peaks are frequently accompanied by corresponding peaks in temperature and heat flux. The deposits on the electrodes do not only act as electrolyte in the measurement principle, but also influence heat transfer from the flue gas into the membrane wall and consequently, the water cycle of the plant. Since the deposits separate the electrodes from the hot flue gas and provide an additional heat transfer resistance, sensor temperatures and heat flux tend to decrease beneath thick deposits. A peak with a steep ascending flank in both temperature and CCD thus signals detaching deposits. In the first two groups, these peaks appear randomly distributed for each sensor, suggesting that the deposits detach, for example, after growing too thick or due to variations in the flue gas flow. There are incidents where all sensors in the first two groups simultaneously show a peak, for example, on 5 November at around 18:00. The incident is easily identified in Figure 6 as the first peak of sensor S8 in interval C. The substantial increase in CCD on a large number of sensors indicates a large event in the plant. A plausible explanation would be an event influencing the combustion on the grate, such as the fall of a substantial quantity of waste from the fuel slider onto the combustion bed. The material suddenly falling onto the burning bed can partially extinguish the fire, before igniting and releasing significant amounts of volatiles, thus causing a peak in temperature and unburnt components in the flue gas. Another possible event is the detachment of a significant amount of deposits from the membrane walls. In the first pass, the deposits have been observed to reach thicknesses of up to 0.5 m, covering the entire width of the membrane wall and reaching several meters in height. If such a large deposit detaches, it also has the potential to temporarily extinguish the fire, impeding clean combustion of the fuel on the grate. Both kinds of events have been observed in the boiler during the two measurement campaigns, and are thus possible explanations for the recorded signals. It is evident that both events have the potential to temporarily impede combustion on the bed, thereby resulting in the subsequent distribution of substantial quantities of unburned or corrosive species within the boiler.
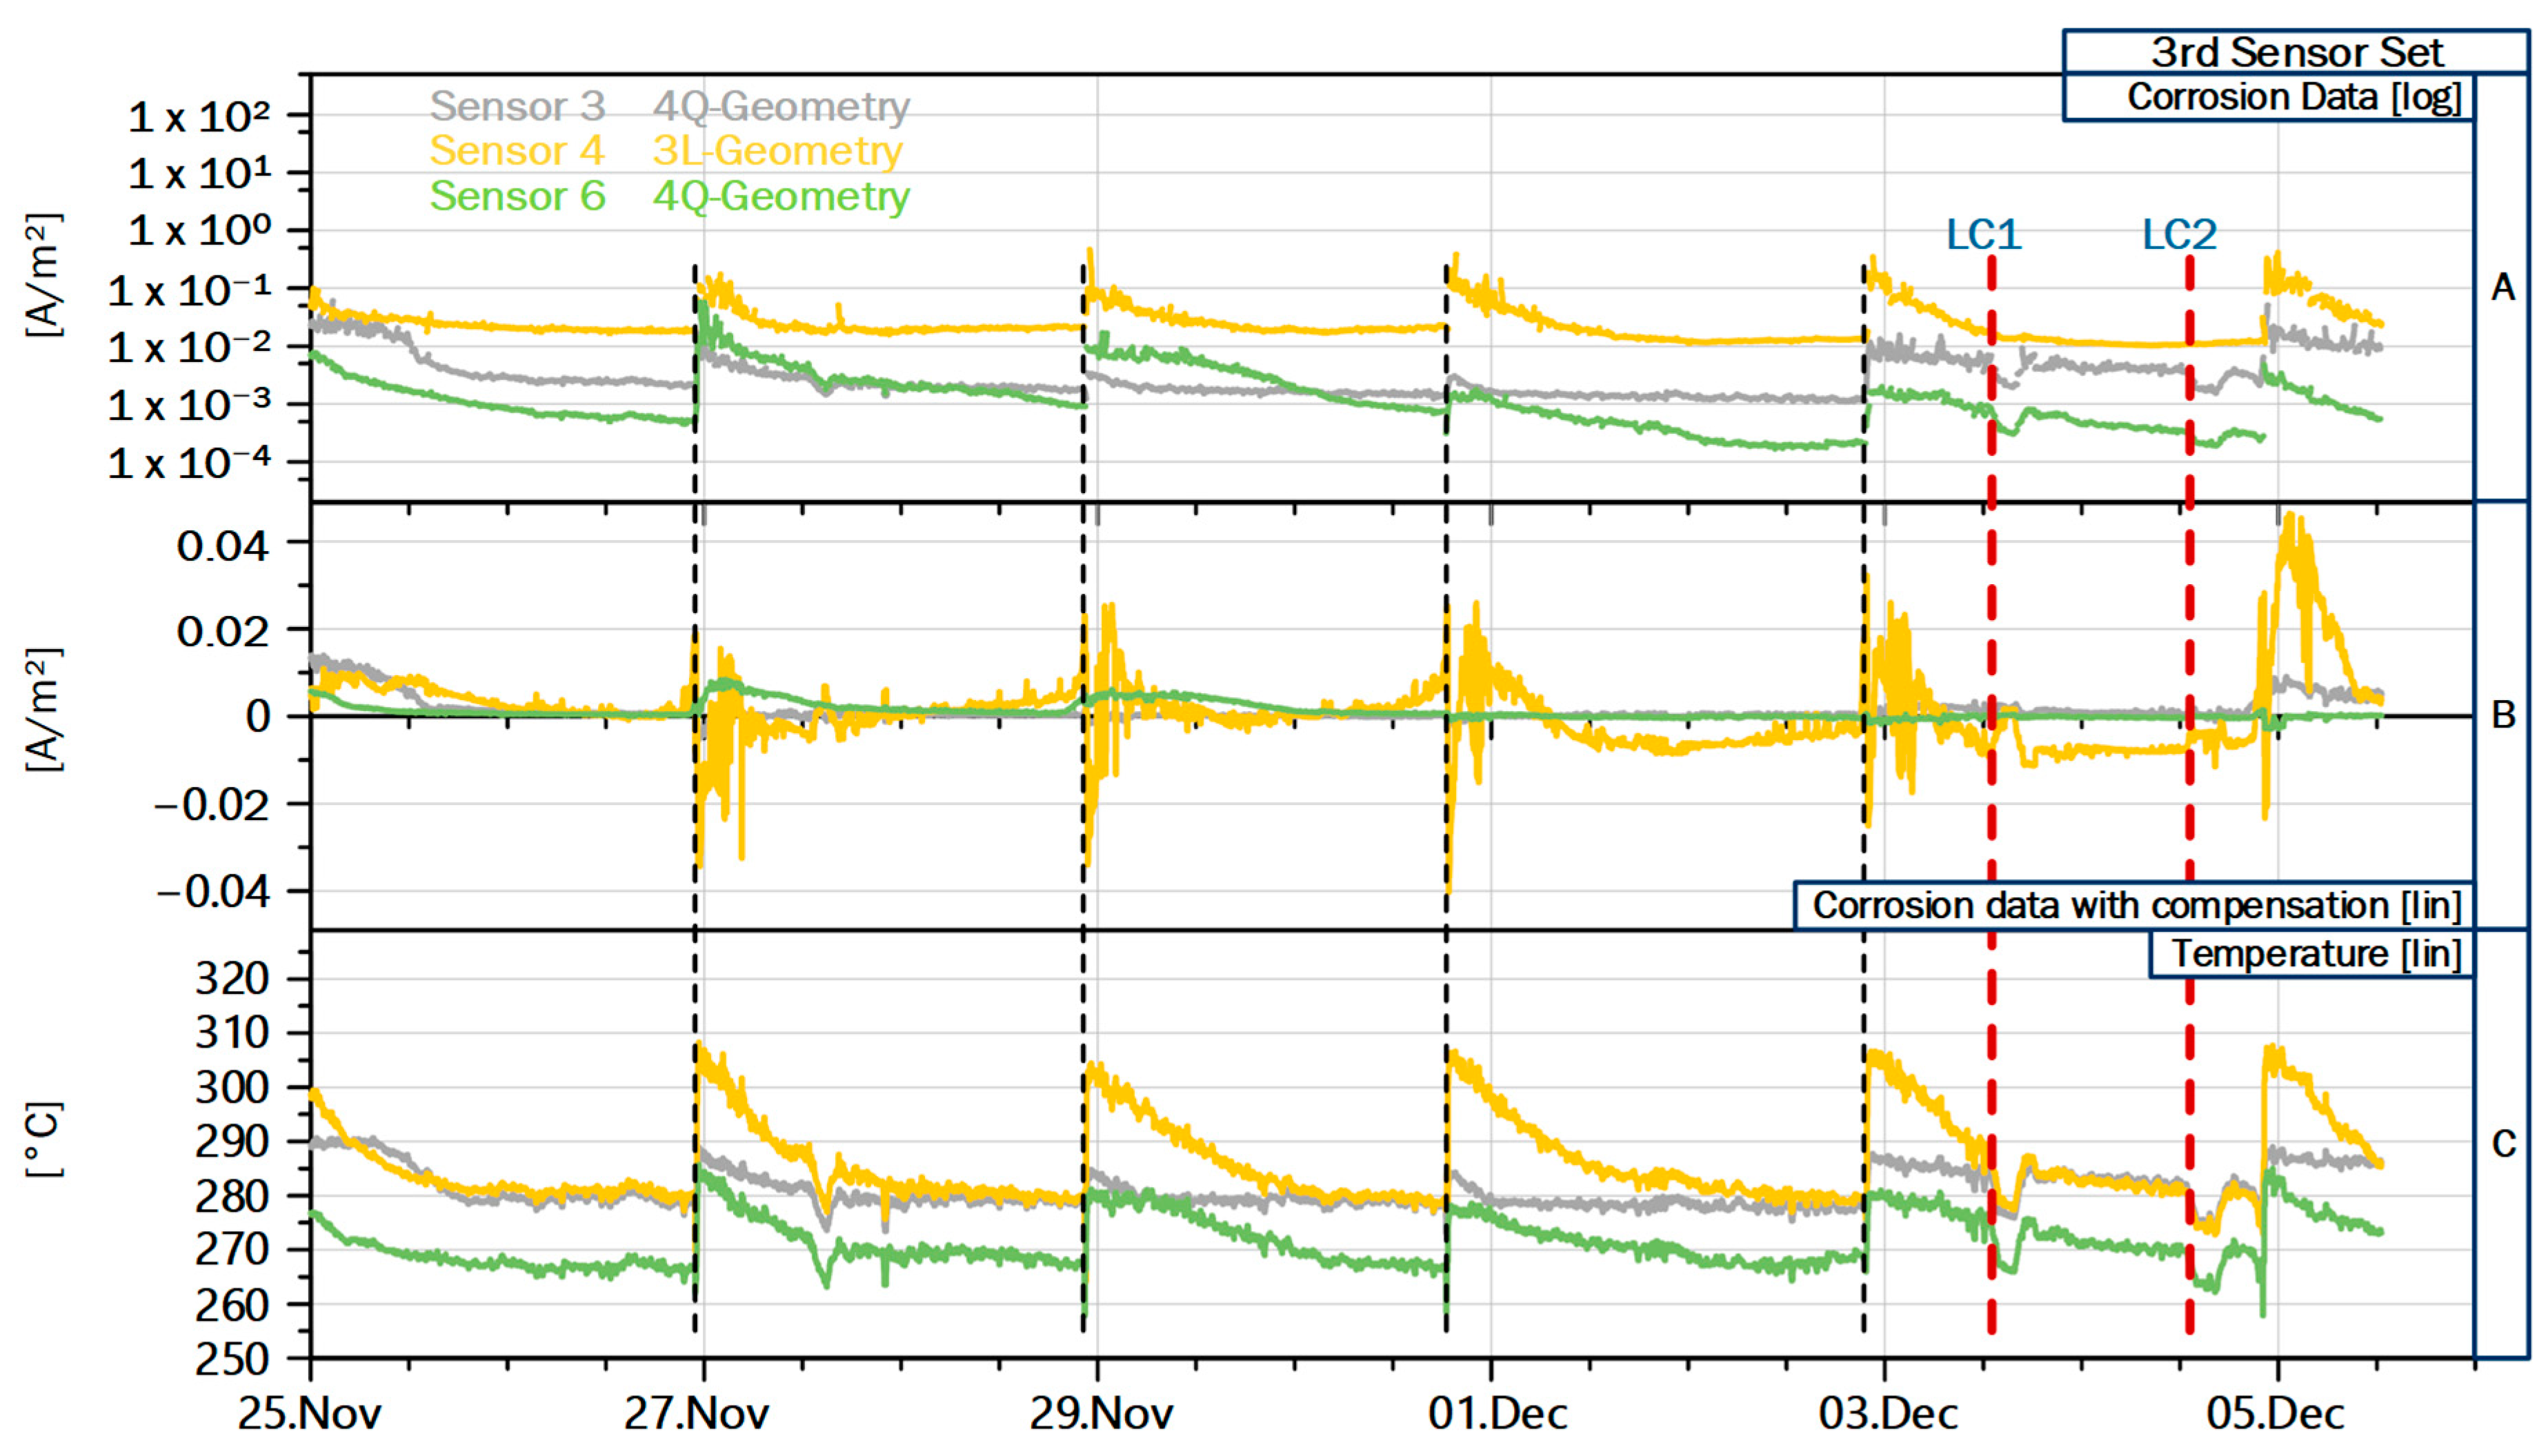
In the third group, which is mounted in the third pass, the peaks exhibit a noticeable synchronicity, as detailed in Figure 7. Here, the recorded CCD of sensors are shown in the top diagram, the CCD with temperature compensation (compare Section 2.5) appear in the middle, and the recorded temperatures are displayed at the bottom. As discussed, temperature has a major influence on the corrosion attack, which becomes obvious, since the graphs for temperature and CCD exhibit the same saw-tooth pattern. The interpretation of this pattern, which also appears qualitatively in the heat-flux measurements, is the slow build-up of deposits over time, followed by rapid detachment. Since deposits act as an insulation layer, decreasing wall temperature and heat flux, and form a diffusion barrier for corrosive species from the gas phase, deposit growth can explain the coupled developments of the sensor data. Since all sensors in the third group show regularly spaced and synchronized peaks indicating deposit detachment, a common cause is likely. From the operator, we received the information that shower cleaning is used to remove excessive deposits in the third pass and thus keep the flue gas temperatures before the first superheater at an acceptable level. The shower cleaning is performed every second night shift, which matches with the peaks recorded by the third sensor group.
Figure 7 also illustrates the added value of the temperature compensated CCD: Since temperature and CCD are directly related as discussed above, correctly attributing an increasing corrosion signal to either temperature changes or operational influences is not trivial. The temperature compensation combines both information and highlights intervals with CCD which are atypical for the current sensor temperature. Thanks to the added sensitivity of the 3L geometry, a more detailed analysis of the cleaning measures is possible at the example of the data from sensor S4. The two day interval between shower cleaning shows a recurring pattern: Directly after cleaning, both CCD and temperature increase, but the compensated CCD is negative, indicating that the freshly cleaned sensor records a below average corrosion attack for the increased temperature. During the initial deposit build up in the first hours after the cleaning event, the compensated CCD swings back into the positive, most likely because the freshly deposited corrosive species can directly interact with the electrodes base material, without having to diffuse into a stable deposit layer. After about six to twelve hours, the compensated CCD returns to near zero values or even becomes slightly negative until the next cleaning event is registered. This behavior indicates the growing deposits continue to increase heat transfer resistance and also act as a diffusion barrier between the freshly deposited corrosive species and the electrode base material. Towards the end of the intervals between cleaning events, the compensated CCD often starts to increase again, because the corrosion does not reduce as much as the temperature. This indicates that at some point, increasing thickness of the deposits does not increase the resistance to diffusion of corrosive species anymore, but continues to impede heat transfer. In practice, the interval for the shower cleaning in the third pass was determined by the flue gas temperature at the end of the third pass, which has to stay below a certain threshold to protect the superheater tubes from excessive temperatures and thus corrosion attack. Taking both corrosion measurements and experience of the operator into account, the chosen cleaning interval appears a good compromise, because more frequent cleaning would induce more corrosion peaks at the membrane wall during initial deposit build up, while less frequent cleaning would likely result in increased corrosion of the superheater tubes.
Figure 7 also displays the two short load changes performed for the second measurement campaign on the 3rd and 4th December, marked with LC1 and LC2. The load changes are visible in the temperature readings from all sensor groups, with drop by about 10 °C during the partial load state. In the third group, sensors S3 and S6 react to the first load change with decreased CCD, which is expected given the lower temperature. Sensor S3 shows no reduction in CCD for the second load change, where the recorded corrosion signal is already low and the decrease in the other two sensors is also lower than for the first load change. Similar behavior is observed in the other sensor groups, supporting the conclusion that stable deposits can mask short term influences from operation, especially in the case of stable deposits in the third pass. This also indicates that for thorough analysis of partial load states, longer periods are necessary to account for the change in deposit structure and growth.

3.2. Analysis of Plant Data

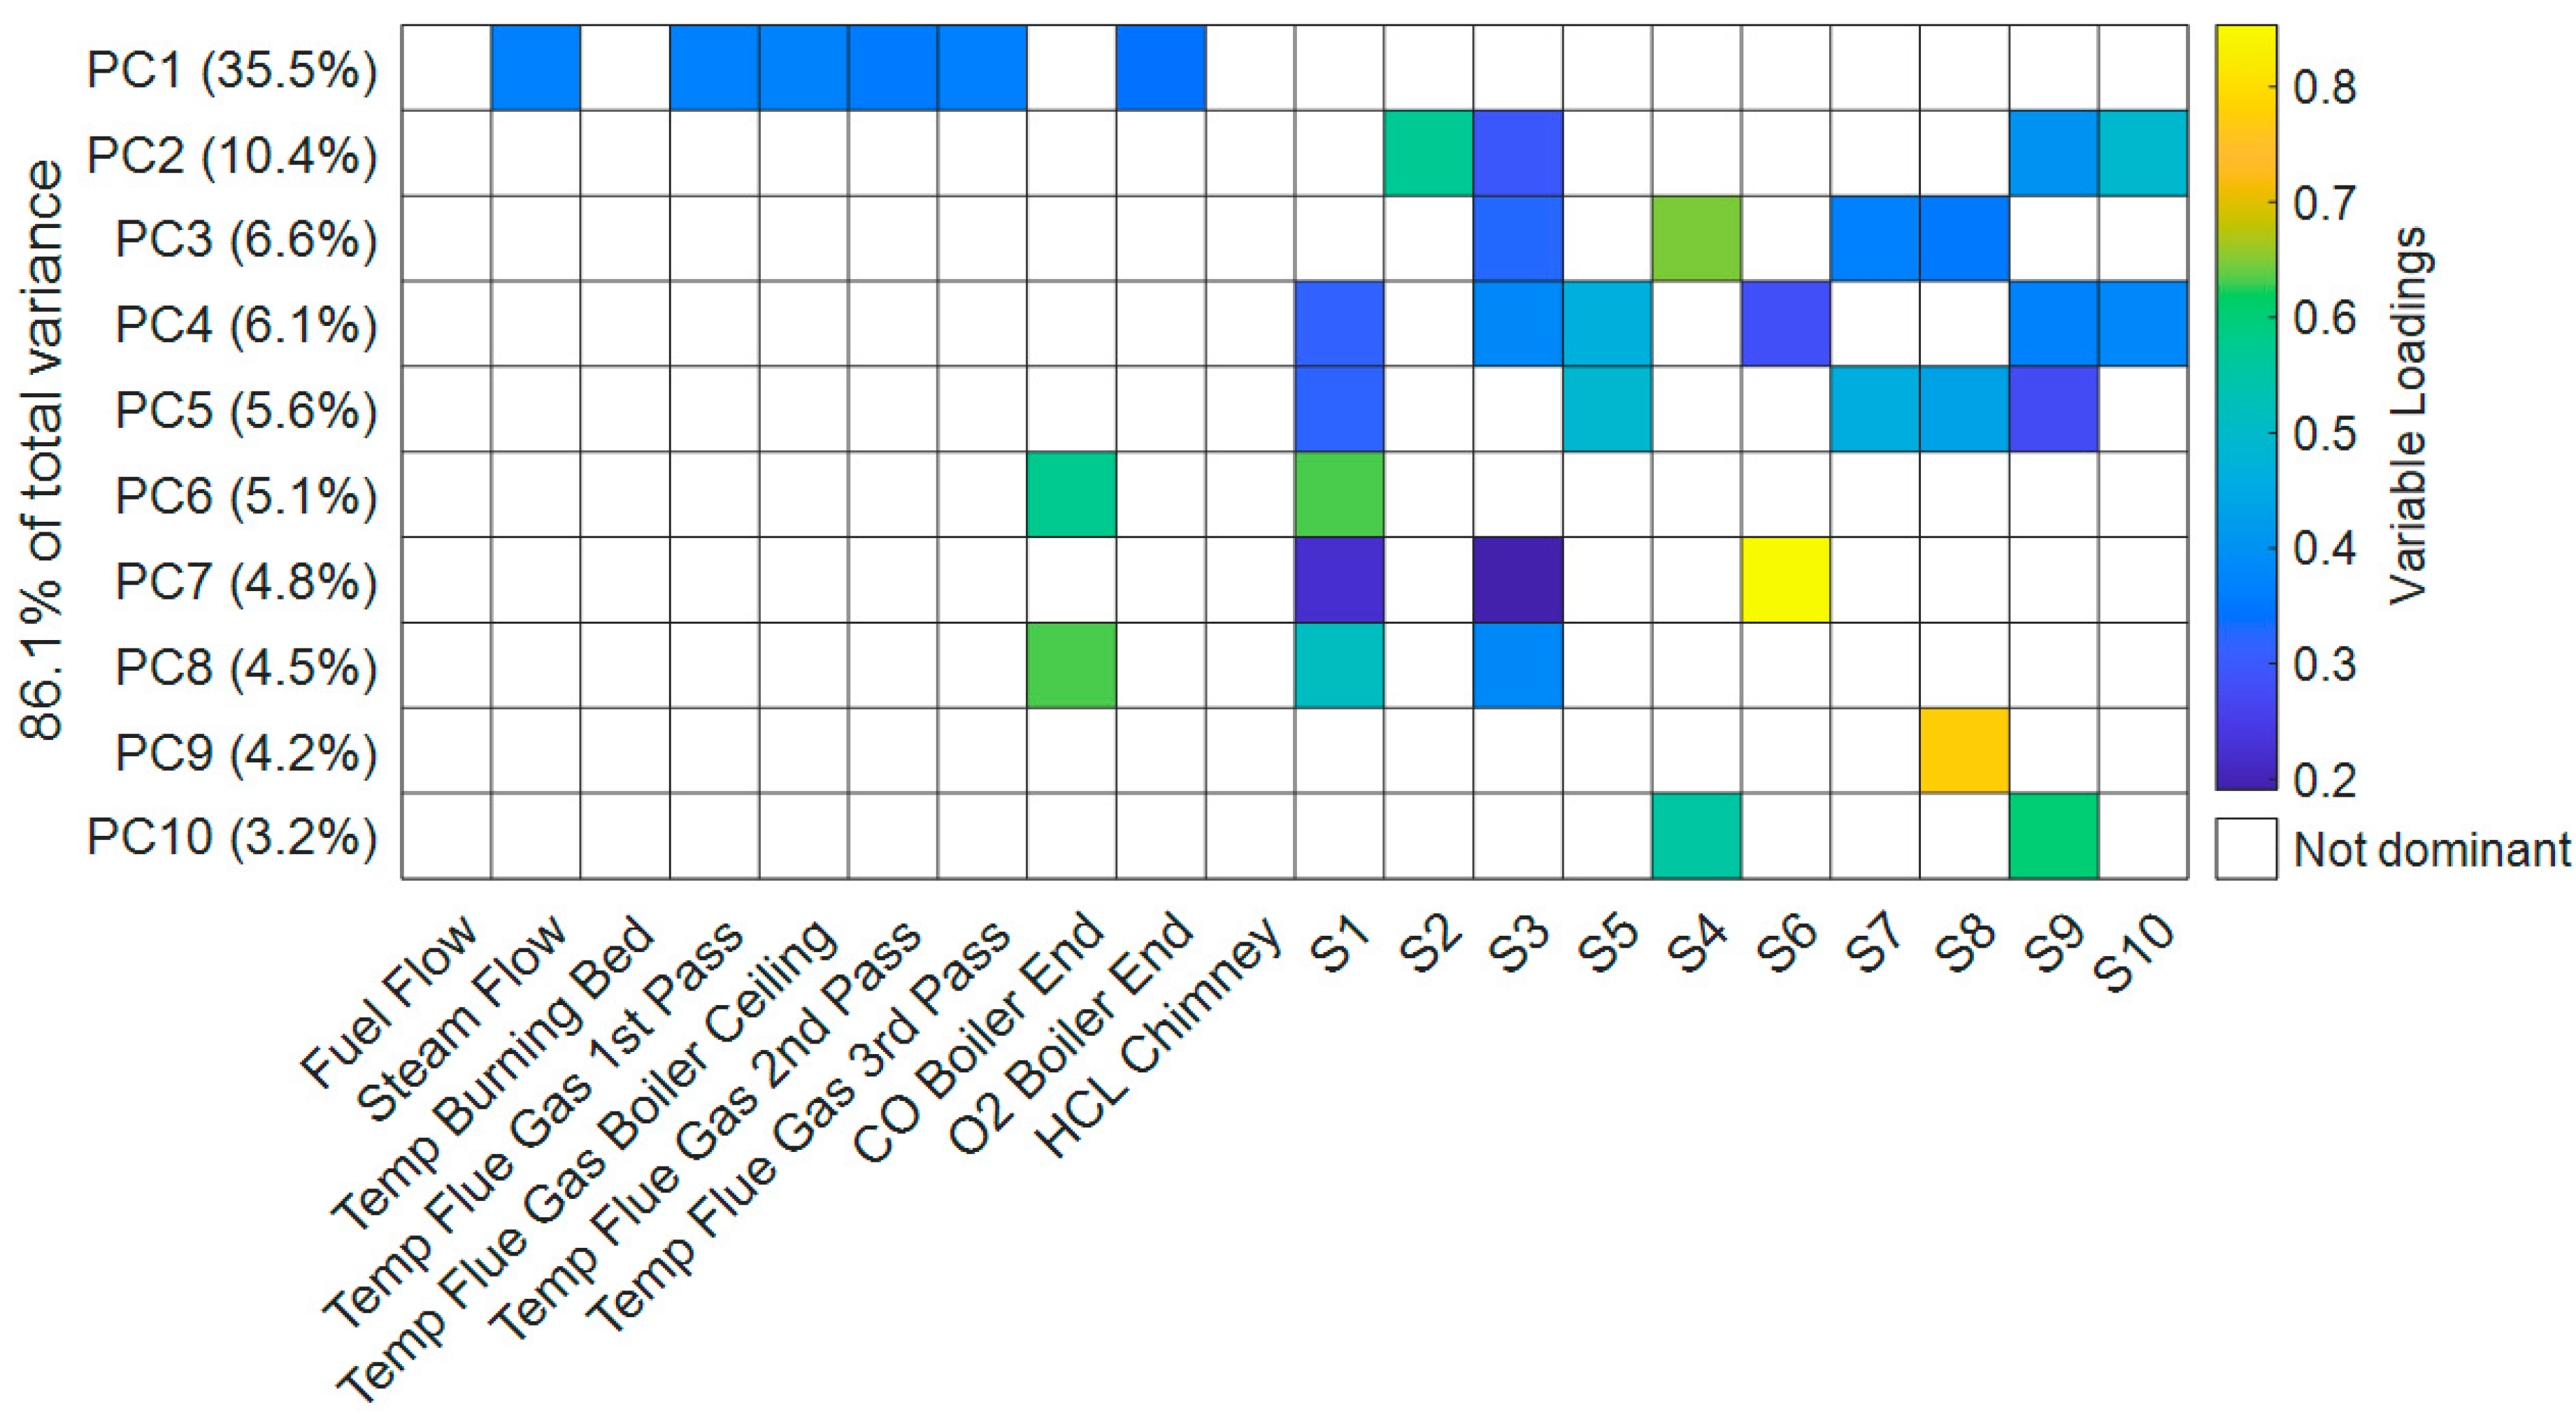
To understand the structure of the available data set, a principal component analysis (PCA) is performed with operational plant data and the compensated CCD from the third sensor set. In Figure 8, the initial ten original variables represent the available measurements from the power plant. The following ten variables are the compensated CCD computed from the measurement system’s data. The resulting set contains 43,475 observations for the 20 analyzed variables, providing a solid basis for analysis. To assess the stability of the PCA, 100 new data sets are derived from the original set using a bootstrap algorithm. The stability of the PCA is assessed by analyzing the explained variance by the PC for each sample. The results of this evaluation are presented in Table 3, which displays the variance explained for the first ten PC of the original data set, as well as the 97.5 and 2.5 percentiles and the mean of all bootstrap samples. The resulting 95% confidence intervals for each PC are relatively small, showing no overlaps down to the tenth PC and indicating good stability of the overall analysis. The contributions of the original variables to the respective PC are also analyzed, and exemplary results for the dominant contributors to PC1 are shown in Table 4. In this case, the average relative difference between the variable loadings of the original and the mean of all Bootstrap PCA amounted to only 0.48%, while the 2.5 and 97.5 percentiles differed by only 9% from the results of the original data set. With average differences below 5%, the second to tenth PC also show good agreement again, indicating sufficient reliability for further analysis. Regarding the significance of the individual PC for analysis, an often-cited criterion is to discard any PC with an eigenvalue below one, originally proposed by Kaiser [25]. According to this criterion, the first six PC are significant for further analysis, as shown in Table 5.
Figure 8 displays a heat map of the PCA, detailing the contributions of the original variables to the first ten PC. To identify the most influential variables for each PC, only the most dominant variables are colorized, until a cumulative share of 85% of the cumulative squared variable loadings is reached. The variance explained by the individual principal components (PC) drops off quickly, which results in the first 10 components explaining about 86% of the total variance in the data set. As displayed in Figure 8, the first PC explains about 36% of the total data variance and is dominated by the variables from the plant control system. The most dominant variables include the total steam flow, flue gas temperatures and the O2 content at the end of the boiler. This set of variables can be interpreted as a description of the fireside control loop of the plant, which is supposed to provide the desired amount of steam and maintain a stable combustion of the fuel. From the coloration in the heat map, we can see that the dominant variables in PC1 are evenly contributing, indicating a strong correlation between the plant variables. This is plausible, since the data set mostly consists of intervals with stable plant operation under full load. Notably, the fuel flow and the burning bed temperature are not among the most influential variables of the first PC, indicating a weaker correlation in the measurement interval. Due to the high volatility of the fuels heating value, this appears plausible. In addition, the movement of the waste on the grate is complex and non-trivial to predict or simulate. Both grate bars and fuel sliders are necessary to introduce and stoke fuel in the boiler, which is needed to fully convert the fuel. However the movement of the waste particles on the grade depends on many parameters, such as particle shape and adhesive forces, and not every movement of the bars leads directly to waste movement [26]. These inconsistencies in waste transport support the weaker link between the parameters describing the combustion bed and the temperature data from the boiler.
The following PC2 to PC10 consist mainly of differing combinations of the recorded sensor data, the only exception being the CO content of the flue gas measured at the end of the boiler. Such a connection is plausible, since CO is an indicator for reducing conditions, which can lead to accelerated corrosion attack [27]. This relation appears in PC6 and PC8 for sensors S1 and S3, which are located in the second pass. The higher PC (ten to twenty) indicate relations between the burning bed temperature, the fuel flow and the content of HCl at the chimney. This connection could be interpreted to originate from incontinuities in the fuel flow or the fuel itself, both of which have been observed during the measurement campaigns on site. During the measurement campaigns on site, irregular fuel flow was frequently observed. The lead to significant quantities of the waste accumulating on the fuel sliders and then falling onto the grate, partially covering the burning material and leading to a peak in the release of volatiles and corrosive species. The importance of chlorine and sulfur species for corrosion phenomena in waste incineration plants is well discussed in the literature [1,22,28]. However, the available data reveal no conclusive connection, probably because the corrosive species are measured at the chimney and the gas cleaning plant is interposed. This positioning is logical for the operator, who intends to prove compliance with emission protection laws. Comparison with the corrosion data from the boiler is unlikely to yield conclusive results, however, due to the effects of the gas cleaning plant on flue gas composition.
The relation between the CO content and the corrosion attack can be visualized by a scatter plot, which is displayed in Figure 9A. Here, the normalized CCD recorded by sensor S3 is plotted over the CO content in the flue gas at the boiler end. The samples recorded during full load are shown as green dots; the red dots represent partial load states. To identify the trend, an average of the scattered data is computed for evenly spaced intervals of the CO content, resulting in a running average shown as black graph within the scatter plot. The blue graph in Figure 9B displays the number of values used to compute the average in the individual intervals. The data clearly shows that increased CO content leads to increased normalized CCD for this sensor. A similar, albeit less pronounced, correlation is exhibited by other sensors in the second and third pass. The absence of a correlation for the sensors mounted in the first pass could suggest that the CO content has a negligible effect in the corrosion phenomena taking place there. Evaluation of the deposits from sensors S7 and S8 reveal a chlorine based corrosion mechanism, where the effect of reducing atmospheres might be negligible. To summarize, the plant control data shows limited correlation with the recorded CCD by the measurement system, suggesting that the major influence on corrosion is not the operation of the plant, but the fuel and the resulting deposit composition on the boiler walls. Some sensors suggest an influence of CO content in the flue gas on the corrosion attack.

3.3. Chemical Analysis of the Deposits

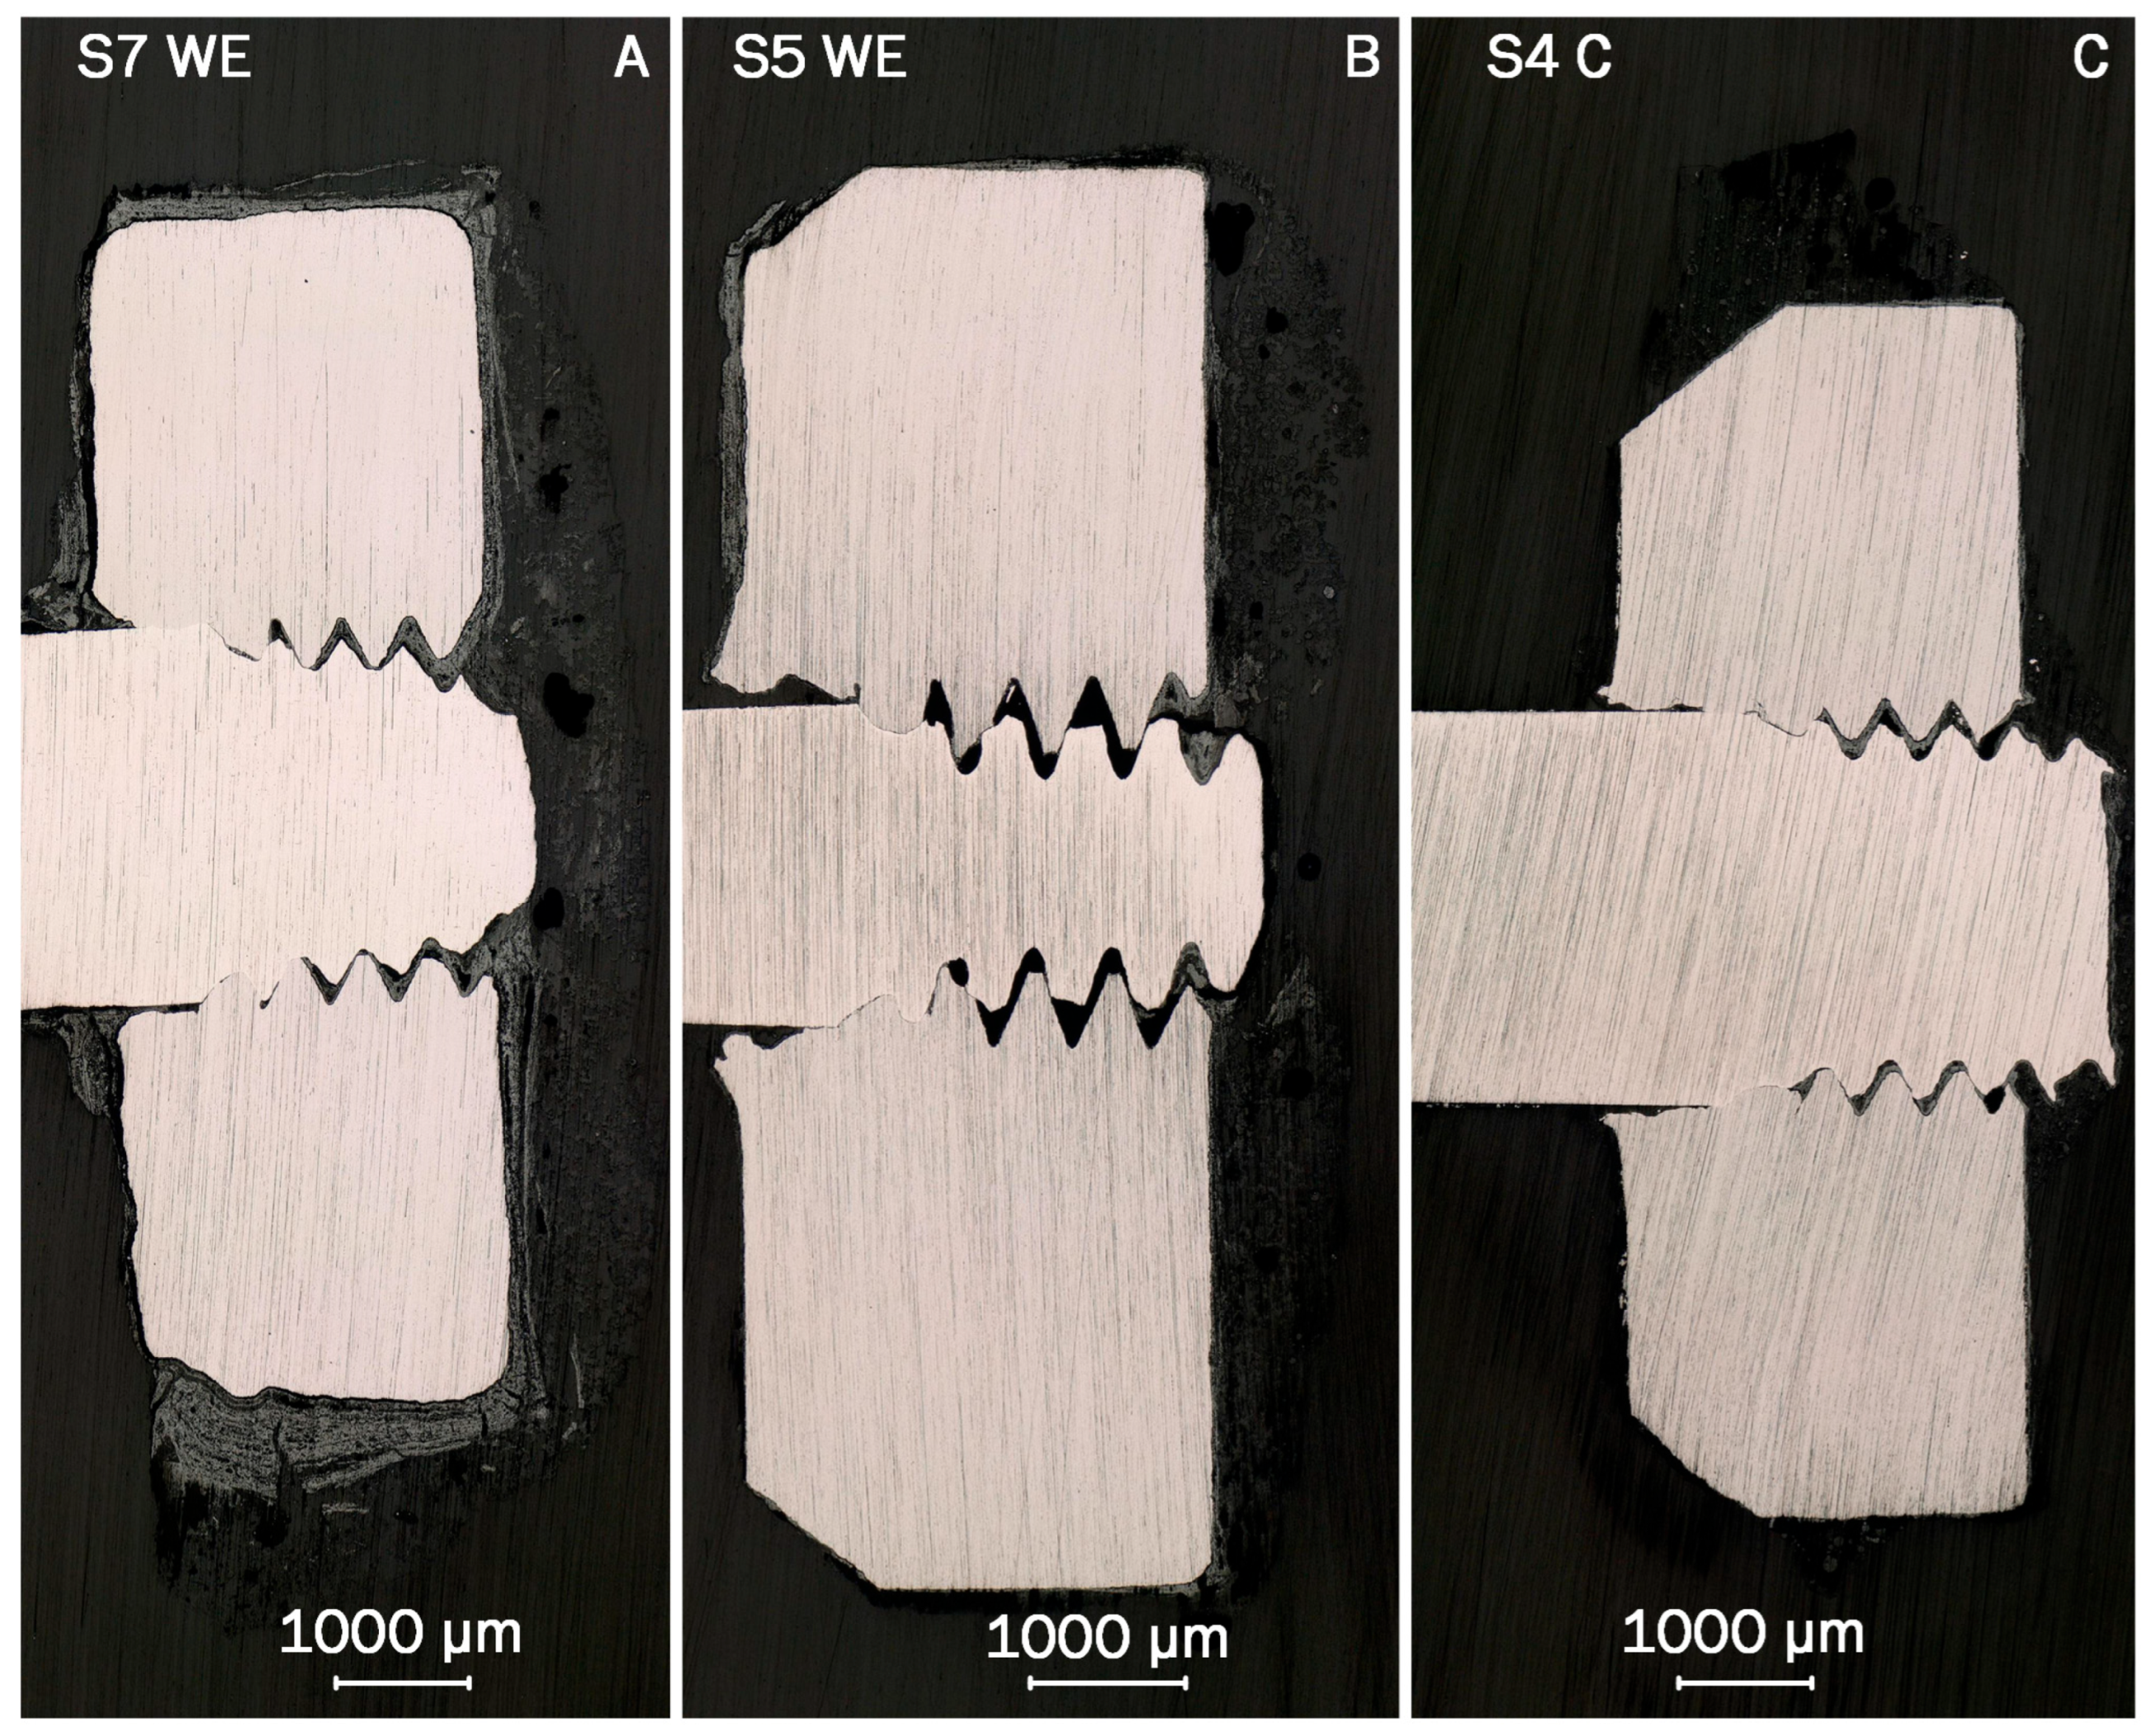
The images obtained from incident light microscopy (ILM) of sensors S7, S5 and S4 are displayed in Figure 10, representing the results from each sensor group. In the images, the base material of the electrodes and connectors is displayed in bright gray. The material used for embedding the electrodes and deposits appears at the edges of the image in the dark gray. The deposits are displayed in various tones, darker than the base material, but brighter than the matrix. Comparing the shape of the base material of the cross sections, sensor S7 exhibits the most deformed shape. The shape of the electrode of sensor S4, visible as bright gray in the Figure, shows almost no change in the shape in comparison to the manufactured state. The cross section of sensor S5 is closer to the shape of sensor S4, but shows signs of the corrosion attack at the top of the electrode, mainly in the area of the thread. Although the base shape of the cross section remains virtually unchanged for S5, the surface at the top exhibits singular recesses and appears coarser in direct comparison the surface of S4. In addition, the thread connecting the electrode plate to the connector appears more rounded than that of S4, also indicating material loss. The thickest adhering deposits are observed on the surfaces of the electrode from S7, surprisingly including the base surface, which was facing the ceramic carrier during operation. This was likely caused by a gap from manufacturing, which allowed the initial deposition of particles during operation. The shape of the cross section suggests that this also allowed corrosion attack on the bottom of the electrode. The general trend observed from the ILM analysis is thus decreasing corrosion attack in the direction of the flue gas path, with thicker deposits on the surfaces of the electrodes from the first pass. Despite being based on a different sensor set, these observations are in good agreement with the evaluation of the sensor signals presented in Section 3.1. In both sensor sets two and three, the highest signals were observed in the first pass, matching the position of the electrode with the highest observed mass loss.
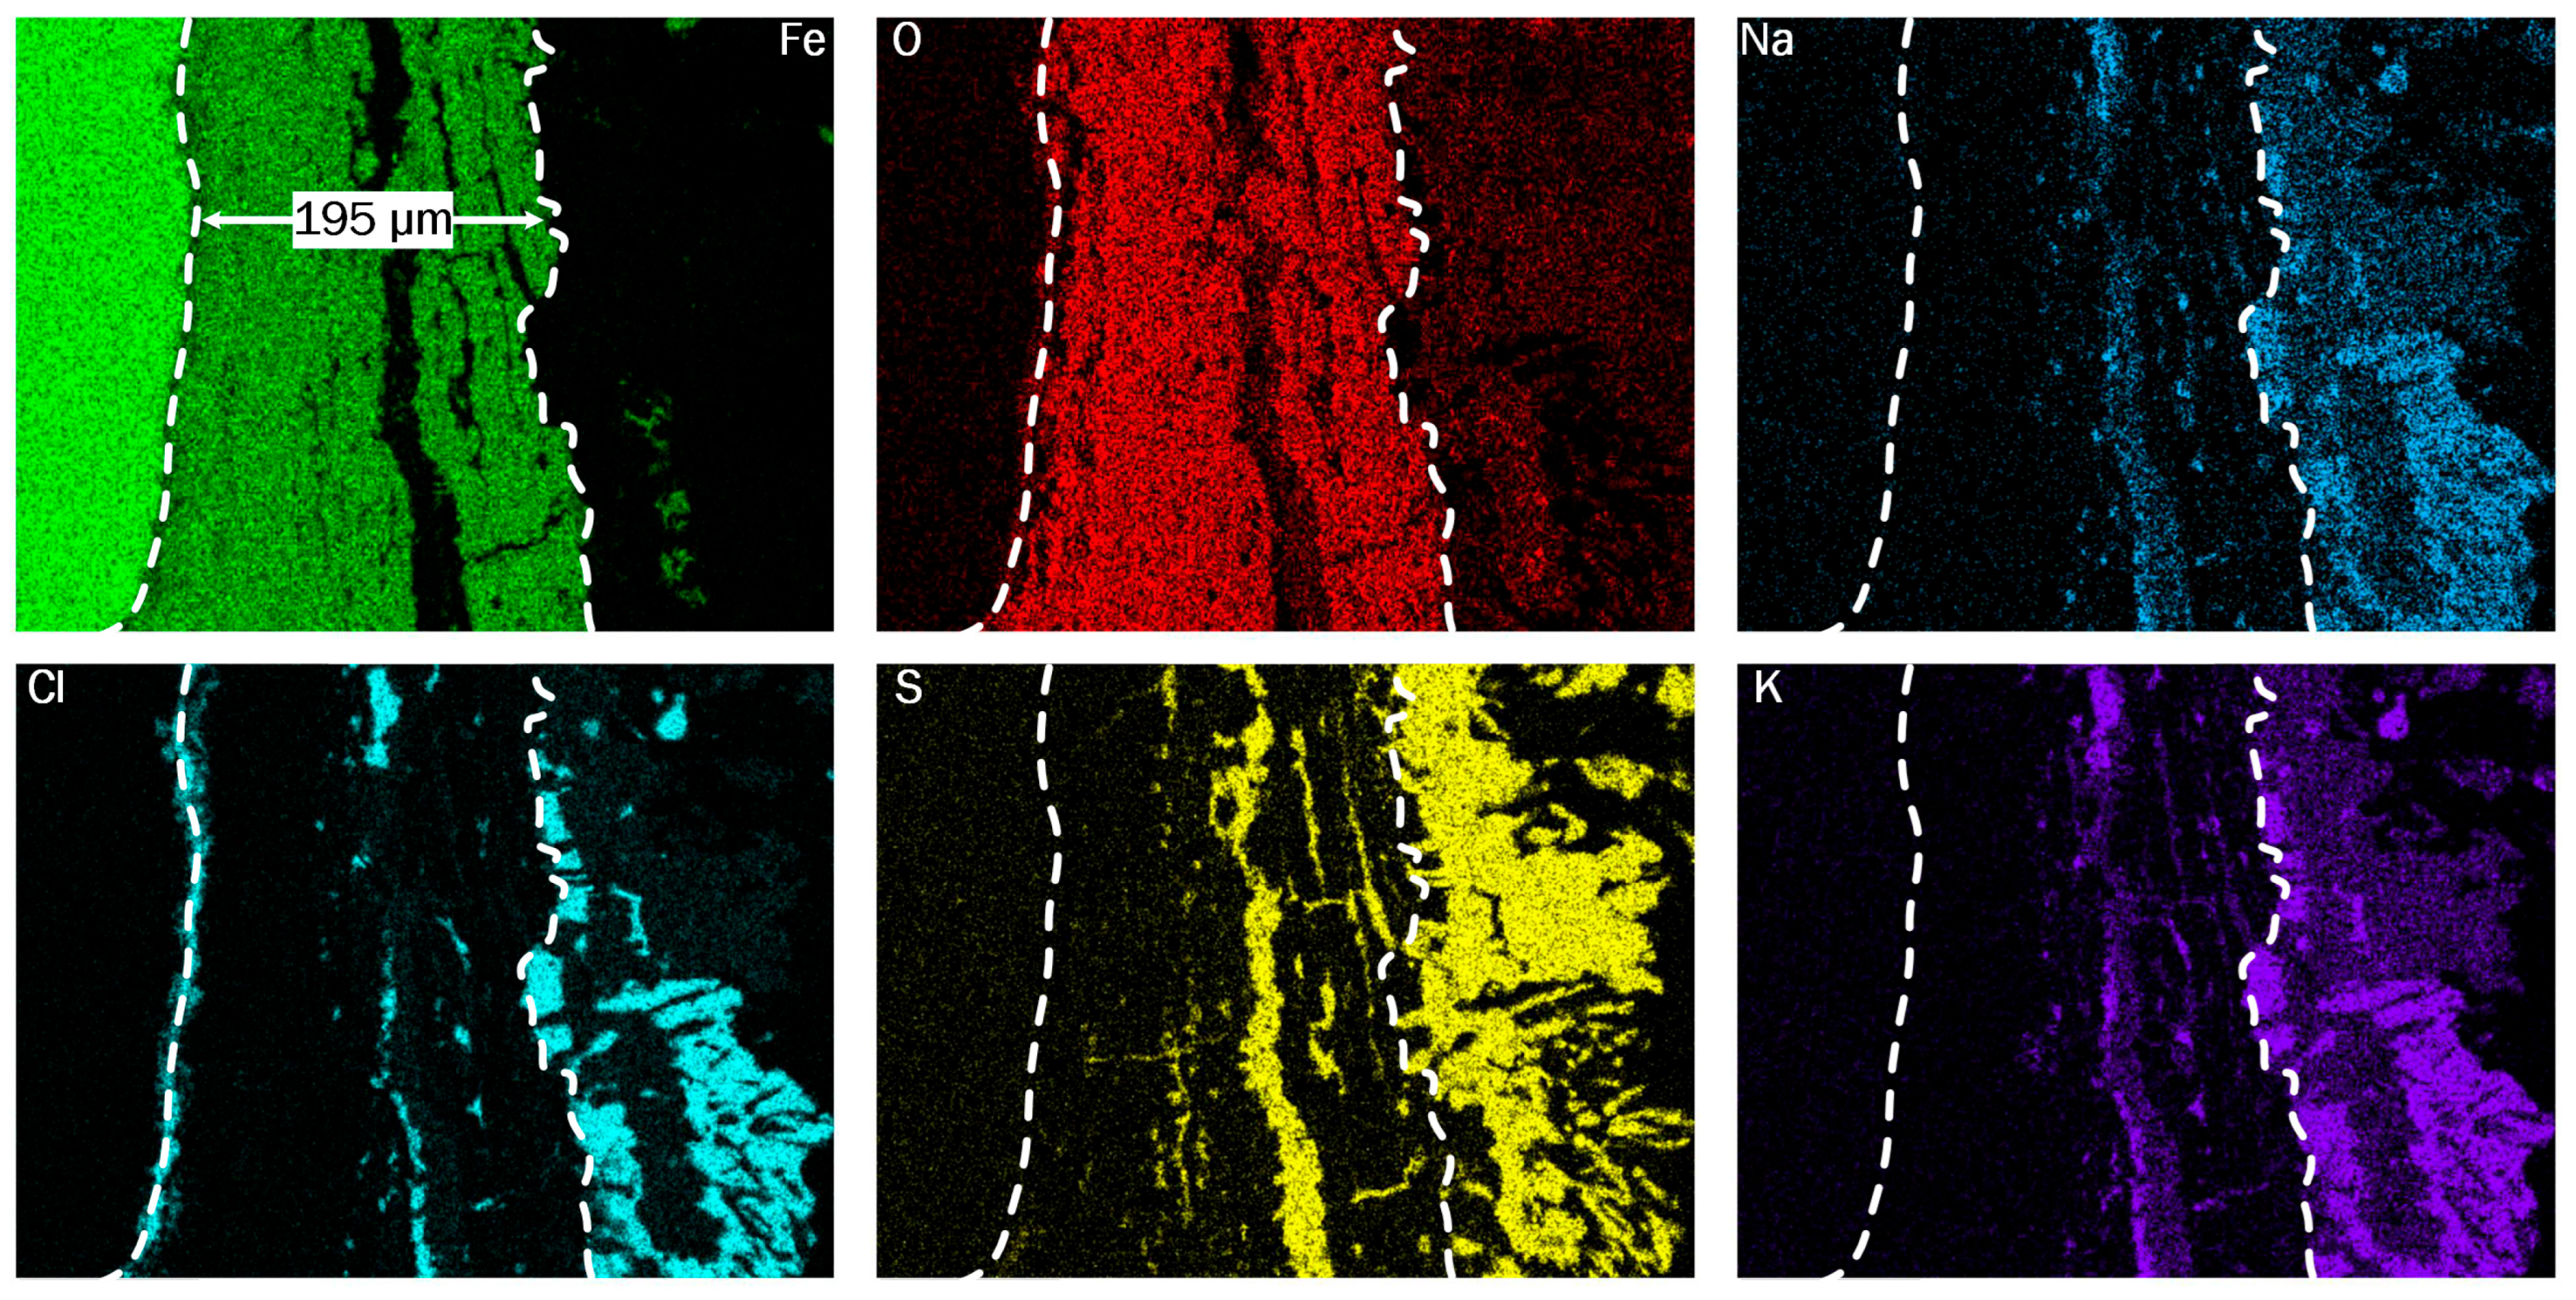
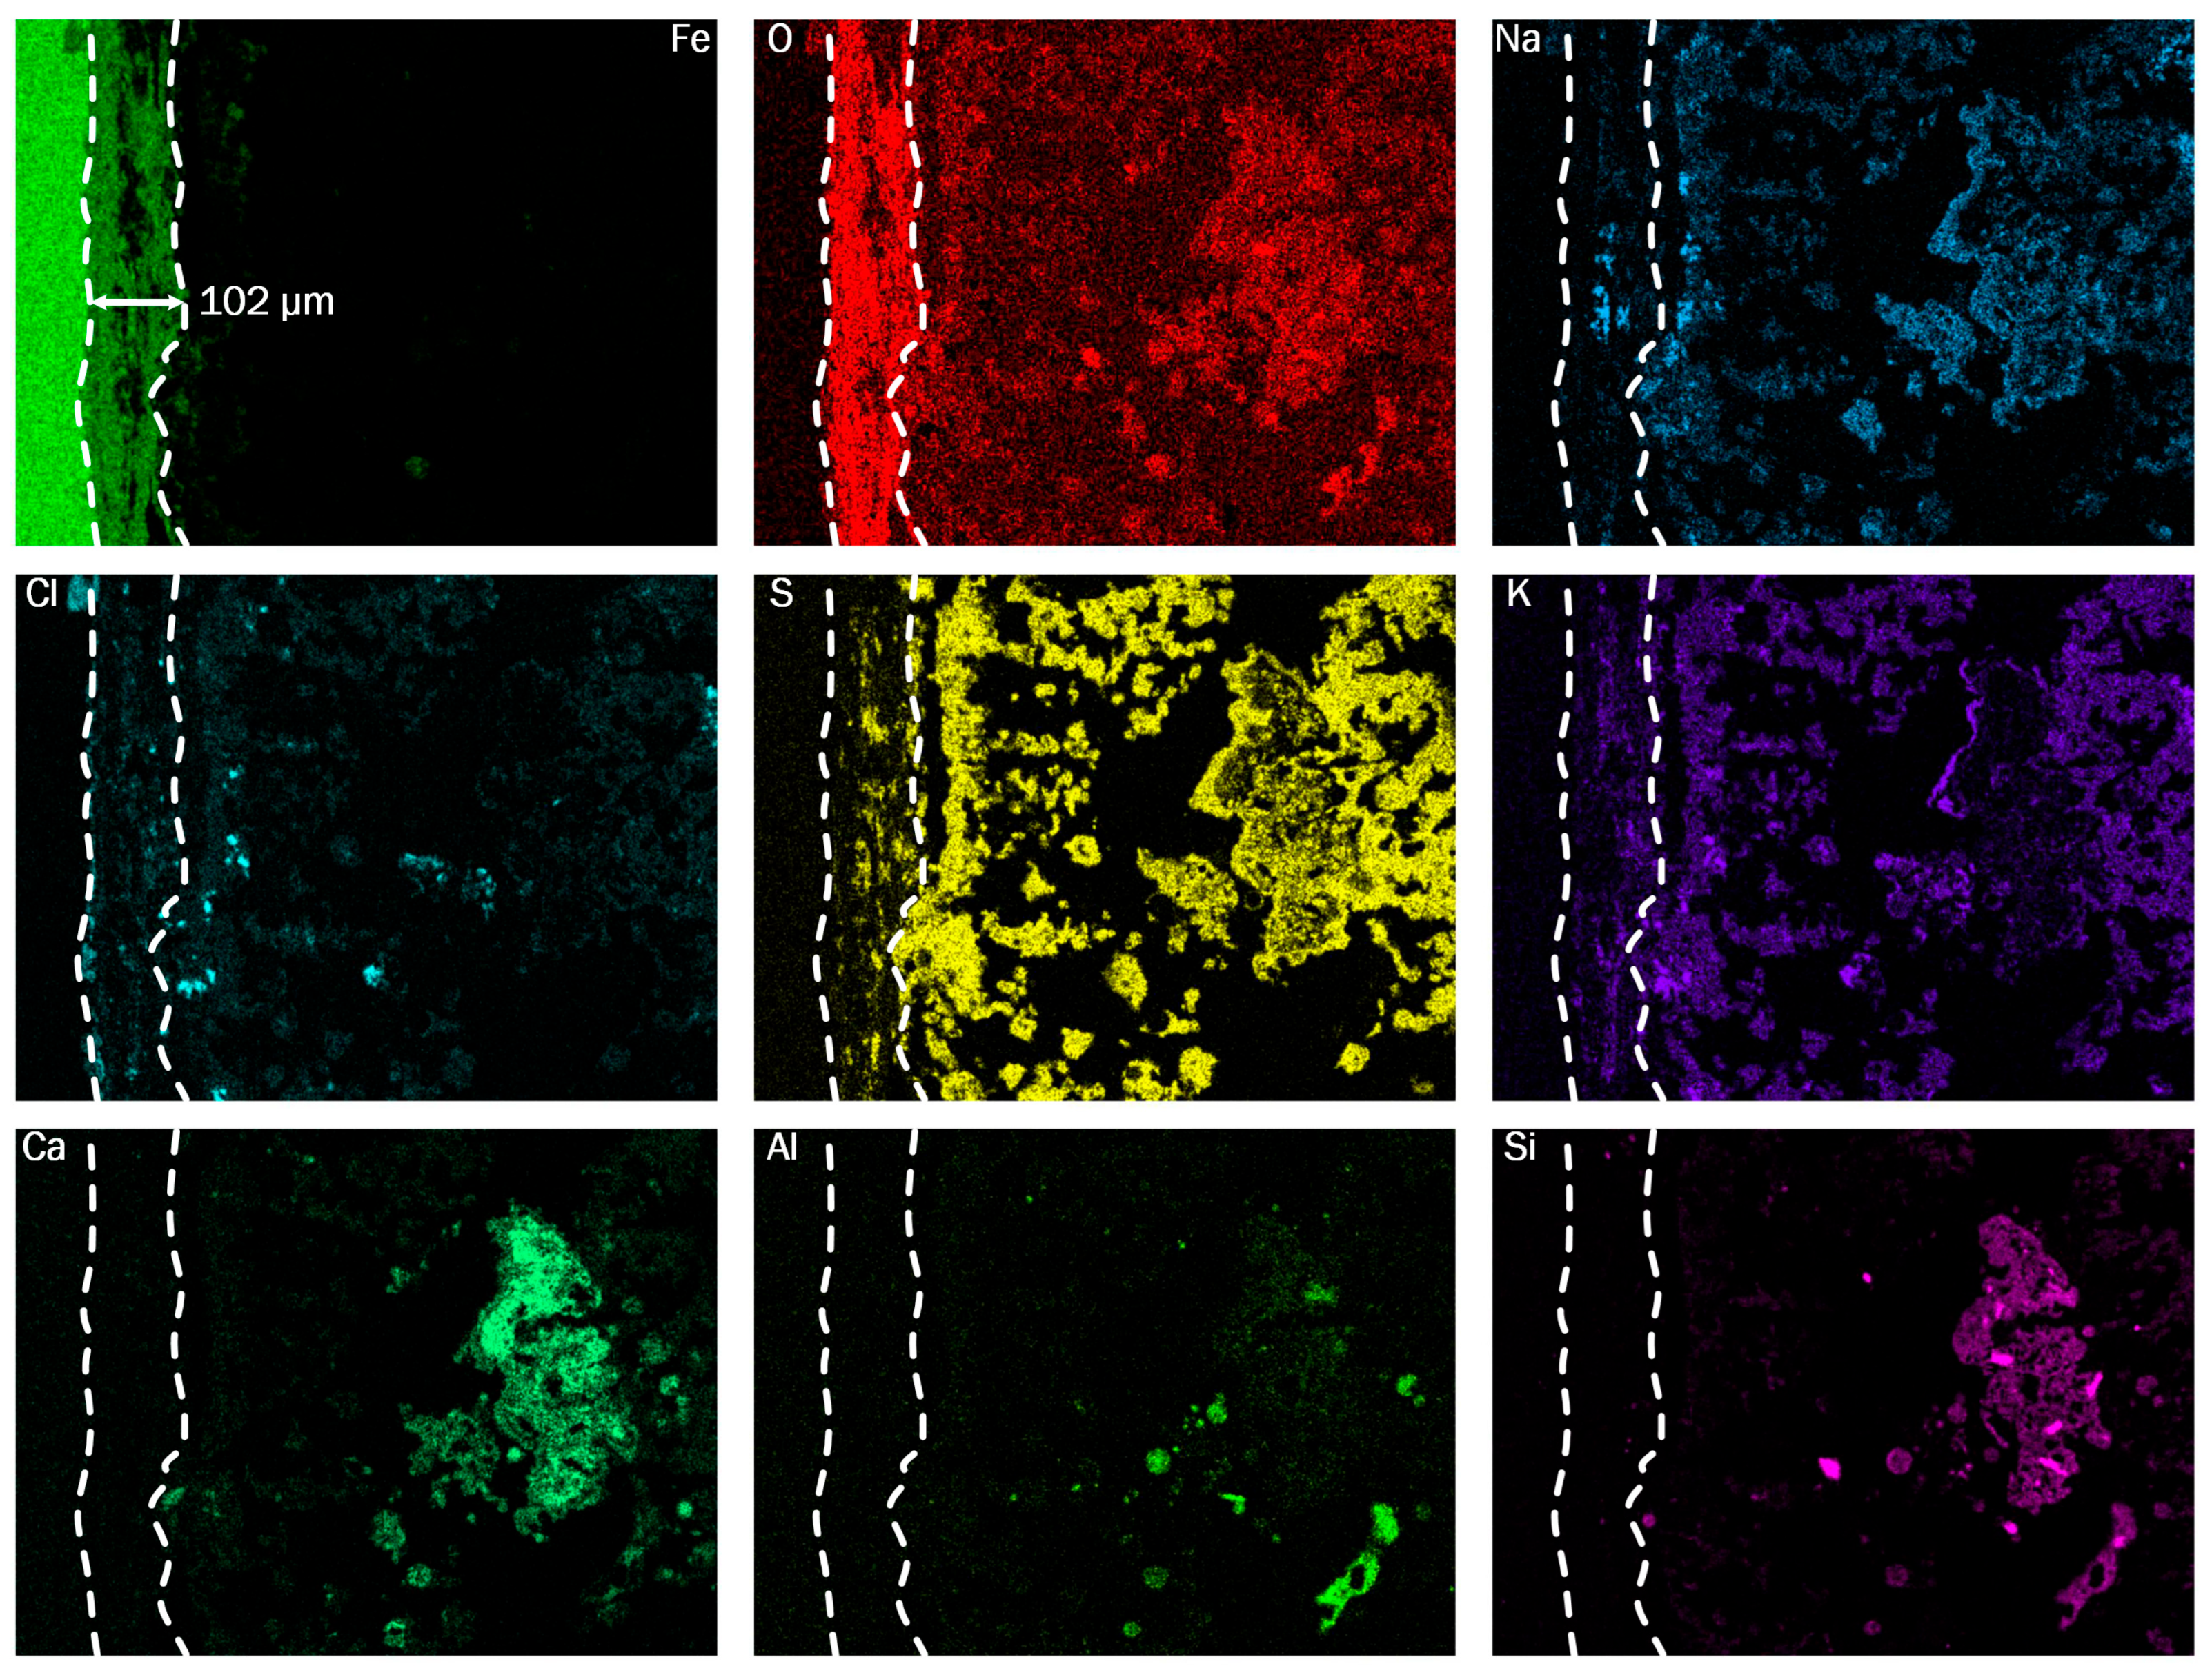
Figure 11 displays the results of the EDX scans on the working electrode of S7, showing the distributions of iron, oxygen, chlorine, sulfur, sodium and potassium in the corrosion products and deposits. S7 shows overall similar structures with three main layers, comparable to the results of EDX scans on the other electrodes. The first layer from the left is the base material, where iron is detected exclusively. Next, an intermediate layer is displayed, which consists mainly of iron and oxygen and varies in thickness from 19 to 195 µm. The outermost layer contains a variety of elements, including alkali metals, as well as sulfur and chlorine. The relatively homogeneous deposit layer in the first pass suggests either partially molten deposits during operation or condensation of gaseous salts as the deposition mechanism, as opposed to the deposition of solid particles. Additionally, the presence of molten chlorine salts would also facilitate the diffusion of chlorine into the oxygen layer, providing the precondition to start the active oxidation. For reference, the interfaces between these layers are marked by white dashed lines.
Chlorine and sulfur, are present in most of the deposit layer, where the patterns match with indications of alkali-metals. In the case of S7, indications of sulfur are also displayed penetrating the intermediate layer in a delamination zone, which is visible in the Fe image as crack-like structure parallel to the base material’s surface. Strikingly, chlorine is not only displayed in the delaminated area, but also as continuous layer at the interface between base material and oxide layer. Local EDX-scans at the interface show peaks for iron and chlorine exclusively, suggesting the presence of iron-chloride. Since S7 also features the thickest oxide scale and also shows the most deformation of the cross section, the oxide scales likely do not protect against the dominant corrosion mechanism. Both distribution of chlorine and the presence of non-protective oxide scales align with the description of the active oxidation mechanism found in the literature, which may also be known as chorine catalyzed corrosion [5].
It is theorized that chlorine forms iron-chloride at the interface to the base material, which is stable due to a low oxygen partial pressure. The high steam pressure of iron chloride at elevated temperatures enables outwards diffusion into the oxide layer and provides potential to damage the protective oxide layer in the process. With sufficient oxygen availability in the outer oxide layers, iron-oxide becomes the stable phase again. This results in free chlorine in the oxide layer, which can again diffuse towards the base material, restarting the catalytic cycle [22].
Since sulfur and chlorine are present in the intermediate layer, both have to be considered when discussing the dominant corrosion mechanism. In the literature, chlorine has been found to trigger an accelerated corrosion attack, compared to the sulfur based mechanisms [22]. The presence of sulfur is viewed as an explanation for the initial release of chlorine within the deposits by sulphation of the initially deposited chlorine salts, providing a substantially increased corrosion potential compared to gas-phase chlorine [3]. The release of chlorine is also discussed to allow bubble formation, causing damage the oxide layer and facilitating delamination, which is also observed in this study [22]. The EDX scans on the electrodes from the first pass show all necessary prerequisites for both mechanisms: The presence of chlorine salts and sulfur in the outer deposit layer, as well as chlorine penetration into the interface between intermediate layer and base material. Thus, it can be deduced that the active oxidation mechanism is most likely the dominant cause for corrosion in the present study.
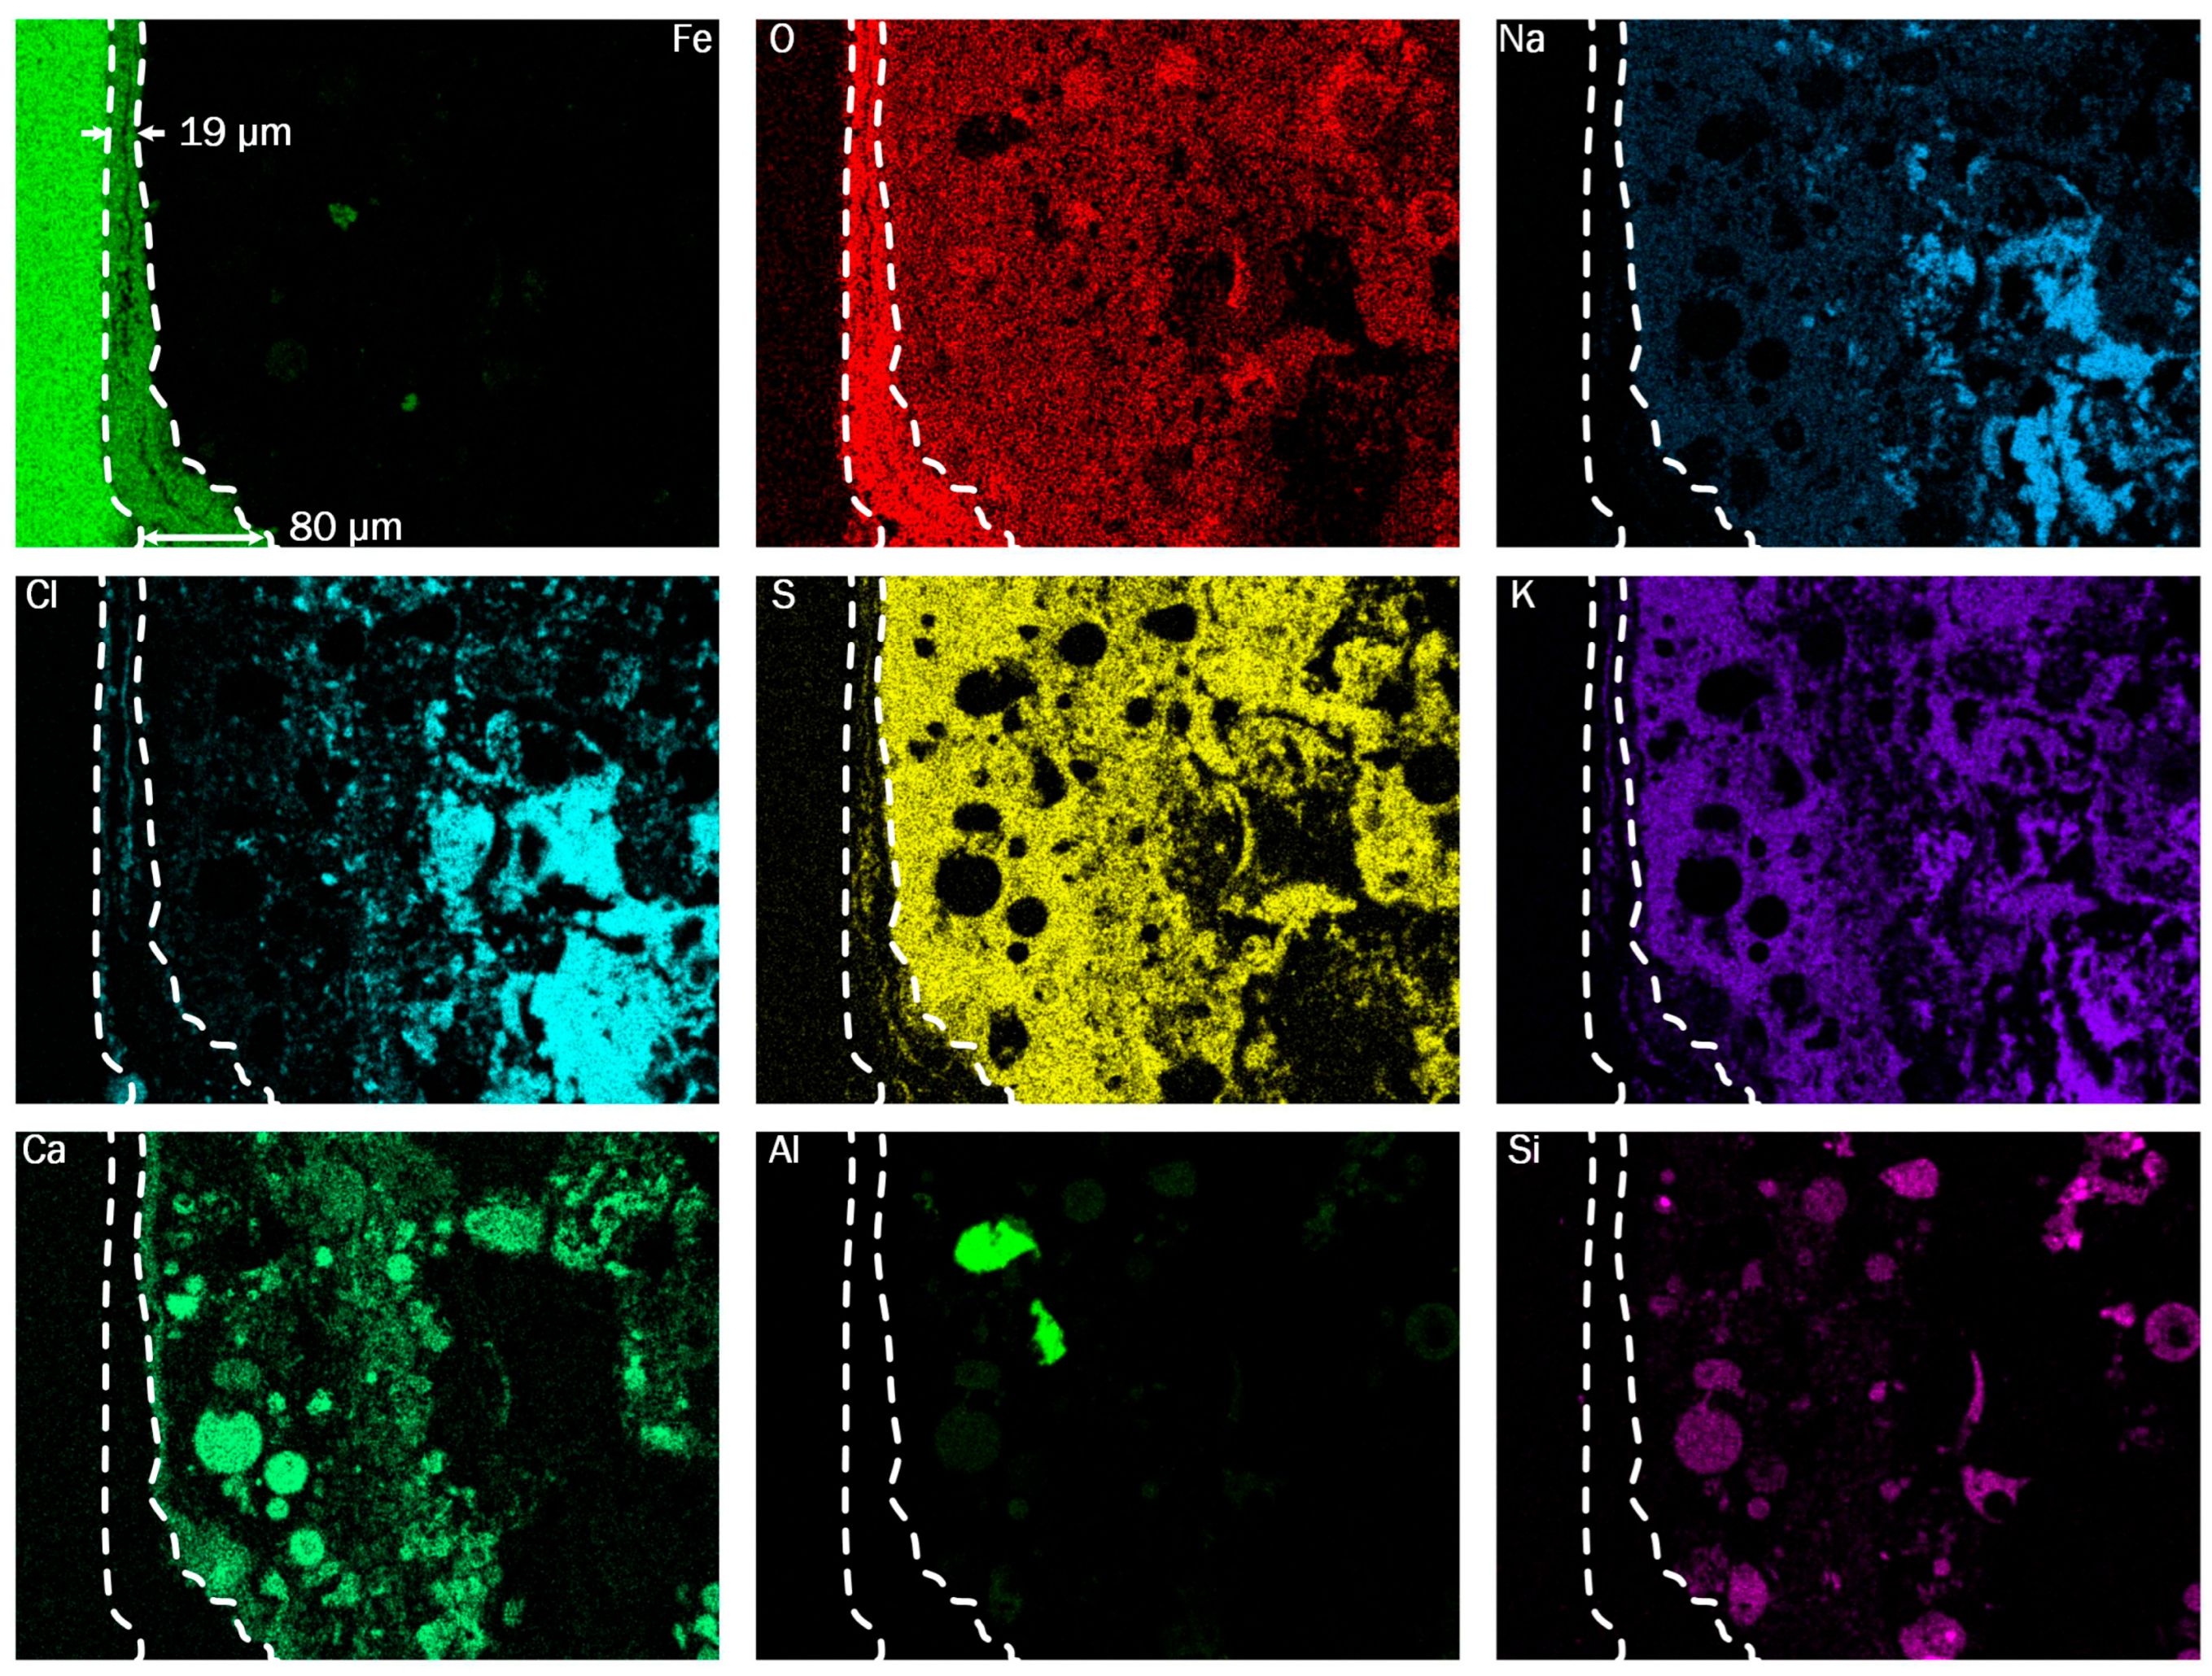
In the sensor group mounted in the third pass, the fundamental composition of the deposits is similar. The oxide layer is only 19 to 80 µm thick on S4, as Figure 12 illustrates. In terms of element distribution within the corrosion products and deposits, there are two key differences between the sensors from the first and third passes: Firstly, the oxide layer on S4 shows less penetration of sulfur and chlorine. Secondly, the deposit layer of S4 features a more heterogeneous structure compared to S7, including the presence of rounded particles composed mainly of calcium and silicon. These likely originate from the combustion process and adhere to the wall in the third pass. The heterogeneous structure in proximity to the iron oxide layer thus suggests that the deposits remain solid in the third pass and form as a result of particles sticking to the wall upon impact. The sensors from the second pass show an intermediate pattern compared to the two other positions, as shown in Figure 13. The oxide scales are about half as thick as in the first pass and show initial signs of delamination. Chlorine is present at the interface between base material and oxide layer, indicating the same dominant corrosion mechanism. The deposit layer is more homogeneous near the oxide layer than in the third pass, but still shows particle-like structures further away from the base material. This indicates a gradual transition of the deposit structures and decrease in the corrosion attack along the flue gas path. Due to the decreasing severity of the corrosion attack in the second and third passes, the influence of CO-rich atmospheres on the recorded CCD appears plausible. In the literature, chlorine catalyzed active oxidation is found to dominate the effects of other corrosion mechanisms, such as the effect of corrosion caused by oxygen deficiency [5]. This could explain why the correlation between CO content in the flue gas is only found for sensors mounted in the second and third pass, where the chlorine based mechanism is evidently less pronounced than in the first sensor groups.
These results agree well with the recorded CCD from the sensors of third set, which also identify the groups in the first pass as the sensors with the highest corrosion attack. Electrodes with higher recorded CCD show higher deformation of the cross section of the base material after operation, as well as thicker oxide layers with higher contents of chlorine and sulfur. Thus, the results of the chemical analysis support the measurement data recorded by the online corrosion monitoring system, providing an additional confirmation of the recorded data. The good agreement of the results over long measurement periods and multiple sensor sets suggests stable operation of the plant and consistent levels of the corrosion attack.
4. Conclusions

Online corrosion measurements were performed in a Czech waste incineration plant over the course of three years with a monitoring system utilizing the LPR-method, an electrochemical measurement principle. The system proved its readiness for deployment in industrial applications, providing measurement data of the corrosion attack with time and spatial resolution. The measurement period was divided into three intervals between plant revisions, and a new sensor set was installed for each interval. The internal relations of the measurement data remained similar for all measurement intervals, suggesting constant plant operation and stable frame conditions for the corrosion attack throughout the measurement period.
Evaluation of the sensor data revealed the highest corrosion attack at the sensor group installed at the end of the first pass, which an overall decreasing tendency along the flue gas path. The corrosion current densities (CCD) and sensor temperatures feature characteristic patterns, allowing conclusions about deposit growth, thickness and stability. The deposits in the first pass are shown as the most unstable, detaching frequently and re-growing quickly. In the third pass, deposit detachment happens synchronously for all sensors, as a result of regular shower cleaning. Judging from the corrosion measurements in the third pass, the frequency of the cleaning measures appears to be a good compromise. More frequent cleaning would induce higher corrosion of the membrane wall, longer cleaning intervals could expose the superheater tubes to excessive flue gas temperatures due to a fouled boiler.
The alternative electrode geometry tested in the third sensor set proved to provide increased sensitivity in low-corrosion environments. The results were satisfactory for the measurements in the third pass, where the increased sensitivity, enabled the detailed evaluation of the cleaning measures and the influence on the corrosion attack. Due to higher corrosion attack in the second pass, the alternative geometry failed to provide consistent measurements. Thus, the alternative geometry provided increased sensitivity as intended. In turn, the standard geometry provides a larger measurement range. This is beneficial for measurements in environments with generally higher corrosion attack, or when the extent of the attack is unclear in advance. Future research should further explore alternative electrode geometries, to enable adaptation of the sensor’s sensitivities to the application.
The statistical analysis of the measurement and plant data showed little connection between operational parameters, such as steam flow and flue gas temperatures, with the CCD. A principal component analysis identified most plant parameters as the first principal component, indicating no correlation with sensor data. The only correlation that could be identified was the CO content at the end of the boiler with CCD from sensors mounted in the second and third pass.
The results of the chemical analysis agree well with the data recorded by the online monitoring system. ILM shows significant deformation of the electrodes cross section in the first pass, which was the sensor group with the highest integrated CCD. SEM and EDX analyses show a thick, but non-protective oxide scale and a significant concentration of chlorine at the base material’s surface. The distribution of iron, oxygen and chlorine in the deposits and corrosion products suggests chlorine catalyzed active oxidation as the dominant corrosion mechanism. Extensive indications of chlorine and sulfur in the deposits support sulphation of deposited chlorine salts as the mechanism for initial chlorine release. The homogeneous structure of the deposit layer suggests condensation of gaseous salts as the deposition mechanism in the first pass. All indications for high corrosion attack diminish gradually along the flue gas path, which agrees well with the sensor data. The less pronounced chlorine penetration towards the base material in the second and third passes also agrees well with the fact that a correlation with CO content in the flue gas is only found for these sensor groups, since the chlorine mechanism would otherwise be dominating the corrosion attack.
All in all, this study provides not only proof of the added value provided by an online corrosion monitoring system in commercial waste incineration plants, but also offers additional data for the study of corrosion phenomena in power plants under commercial operation. Future research should continue to evaluate the possibility to quantify the recorded sensor data. The available data set does not allow the quantification with the actual material loss of the electrodes used for the measurements. The third sensor set, which is currently installed in the plant, will complete the data set and enable this analysis. The results should then be compared to the results obtained in previous experiments in power plants, to determine if a universally valid quantification formula is feasible, or if the quantification should be performed based on the corrosion attack in a specific plant.

Author Contributions

A.M.: Writing—Original Draft, Visualization, Software, Data Curation, Formal Analysis, Investigation, Methodology. D.H.: Writing—Review and Editing, Investigation. J.S.: Writing—Review and Editing, Supervision. B.E.: Conceptualization, Supervision, Funding acquisition. All authors have read and agreed to the published version of the manuscript.

Funding

This research was co-funded by the German Federal Ministry for Economic Affairs and Climate Action (BMWk) under the grant number 03EE5071B. The authors would like to thank all project partners (TU München, Martin GmbH für Umwelt-und Energietechnik and CMV-Systems GmbH & Co. KG) for their technical and financial support during the project.

Data Availability Statement

This work is based on data from the following measurements and sources: Corrosion and temperature measurements from the Membrane Wall Sensors; Chemical analysis of the sensor electrodes; Operational data recorded by the plant control system. The pre-processed sensor data and the reports of the chemical analyses are available from the corresponding author, Adrian Marx, upon reasonable request. Due to the sensitive nature of the operational data from the plant control system, this data set remains confidential and is not available.

Acknowledgments

Special thanks go to Pavel Veselý from Plzeňská teplárenská a.s. in the Czech Republic, for his continued support of the measurements, excellent on-site coordination and insightful comments about plant operation. The authors would also like to thank Marie Kaiser from CheMin GmbH in Germany, for providing her detailed expertise about the analysis of the chemical composition of the deposits.

Conflicts of Interest

The authors declare no conflicts of interest.

References

  1. Waldmann, B. Korrosion in Anlagen zur Thermischen Abfallverwertung: Elektrochemische Korrosionserfassung und Modellbildung. Ph.D. Thesis, Universität Augsburg, Augsburg, Germany, 2007. [Google Scholar]
  2. Waldmann, B.; Haider, F.; Horn, S.; Warnecke, R. Corrosion Monitoring in Waste-to-Energy Plants. In Proceedings of the Eurocorr—The European Corrosion Congress 2008, Edinburgh, UK, 7–11 September 2008. [Google Scholar]
  3. Ott, D. Hochtemperaturkorrosion in Müllverbrennungsanlagen: Die Kinetik der Chlorfreisetzung als Bestimmender Faktor. Ph.D. Thesis, Universität Augsburg, Augsburg, Germany, 2017. [Google Scholar]
  4. Spiegel, M. Salt melt induced corrosion of metallic materials in waste incineration plants. Mater. Corros. 1999, 50, 373–393. [Google Scholar] [CrossRef]
  5. Born, M. Dampferzeugerkorrosion; TU Bergakademie Freiberg: Freiberg, Germany, 2005. [Google Scholar]
  6. VGB Technische Vereinigung der Grosskraftwerksbetreiber e.V., Essen (Germany, F.R.), Maßnahmen zur Verminderung von Abzehrungen in Abfall- und Biomassegefeuerten Dampferzeugern (VGB-S-205-00-2018-04-DE). 2018. Available online: https://www.vgb.org/shop/technicalrules/vgb-standards/s205.html (accessed on 17 April 2023).
  7. Lindner, R. Turbines for waste-and biomass-incineration power plants. VGB PowerTech 2005, 85, 74–76. [Google Scholar]
  8. Gong, K.; Zheng, C.; Ju, D.; Ma, H.; Zhang, J. Corrosion of Ni-based alloy coatings prepared by laser cladding in high-temperature chloride environment. Surf. Coat. Technol. 2024, 484, 130823. [Google Scholar] [CrossRef]
  9. Andersson, S.; Blomqvist, E.W.; Bäfver, L.; Jones, F.; Davidsson, K.; Froitzheim, J.; Karlsson, M.; Larsson, E.; Liske, J. Sulfur recirculation for increased electricity production in Waste-to-Energy plants. Waste Manag. 2014, 34, 67–78. [Google Scholar] [CrossRef] [PubMed]
  10. Jaske, C.E.; Beavers, J.A.; Thompson, N.G. Improving Plant Reliability Through Corrosion Monitoring. In Proceedings of the Fourth International Conference on Process Plant Reliability, Houston, TX, USA, 15–17 November 1995. [Google Scholar]
  11. Cappeln, F.; Bjerrum, N.J.; Petrushina, I.M. Corrosion monitoring in a straw-fired power plant using an electrochemical noise probe. Mater. Corros. 2007, 58, 588–593. [Google Scholar] [CrossRef]
  12. Mabbutt, S.; Simms, N.; Oakey, J. High temperature corrosion monitoring by electrochemical noise techniques, Corrosion Engineering. Sci. Technol. 2009, 44, 186–195. [Google Scholar]
  13. Covino, B.S.; Bullard, S.J.; Holcomb, G.R.; Ziomek-Moroz, M.; Eden, D.A. Fireside Corrosion Probes for Fossil Fuel Combustion. In Proceedings of the CORROSION 2006, San Diego, CA, USA, 12–16 March 2006. [Google Scholar]
  14. Pronobis, M.; Hernik, B.; Wejkowski, R. Kinetics of low nox corrosion of waterwalls in utility boilers. Rynek Energii 2010, 91, 121–128. [Google Scholar]
  15. Vainio, E.; Ruozzi, A.; Kinnunen, H.; Laurén, T.; Hupa, L. Low-temperature corrosion in a BFB boiler firing biomass and waste streams—Online measurement technique for monitoring deposit corrosivity. Fuel 2024, 371, 131864. [Google Scholar] [CrossRef]
  16. Wang, Y.; He, J.; Wang, Y.; Sun, F.; Lu, C.; Zhang, S.; Duan, L. Development of an integrated online deposition and corrosion monitoring system in a full-scale solid waste CFB boiler. Waste Manag. 2024, 189, 211–218. [Google Scholar] [CrossRef] [PubMed]
  17. Marx, A.; Hülsbruch, D.; Müller, A.; Epple, B.; Ewert, F.; Peitan, J. Online corrosion monitoring in industrial boilers. Therm. Sci. Eng. Prog. 2023, 43, 102009. [Google Scholar] [CrossRef]
  18. Marx, A.; Hülsbruch, D.; Ströhle, J.; Epple, B. Analysis and quantification of high-temperature corrosion in lignite fired boilers using an online monitoring system. Corros. Sci. 2025, 253, 113012. [Google Scholar] [CrossRef]
  19. Plzeská teplárenská, a.s. ZEVO, Über uns|ZEVO Plzec. Available online: https://www.zevoplzen.cz/o-nas (accessed on 14 May 2025).
  20. Stern, M.; Geary, A.L. Electrochemical Polarization I: A Theoretical Analysis of the Shape of Polarization Curves. J. Electrochem. Soc. 1957, 104, 56. [Google Scholar] [CrossRef]
  21. Thyssenkrupp AG, Werkstoffdatenblatt: 16Mo3 (1.5415). Available online: https://ucpcdn.thyssenkrupp.com/_legacy/UCPthyssenkruppBAMXJacobBek/assets.files/pdf/produkte/stahl-flachprodukte/werkstoffdatenblatt-16mo3.pdf (accessed on 14 May 2025).
  22. Bürgel, R.; Maier, H.J.; Niendorf, T. Handbuch Hochtemperatur-Werkstofftechnik: Grundlagen, Werkstoffbeanspruchungen, Hochtemperaturlegierungen und Beschichtungen, 4th ed.; Vieweg + Teubner: Wiesbaden, Germany, 2011. [Google Scholar]
  23. Greenacre, M.; Groenen, P.J.F.; Hastie, T.; D’Enza, A.I.; Markos, A.; Tuzhilina, E. Principal component analysis. Nat. Rev. Methods Primers 2022, 2, 100. [Google Scholar] [CrossRef]
  24. DIN EN 60584-1:2014-07; Thermoelemente-Teil 1: Thermospannungen und Grenzabweichungen (IEC_60584-1:2013); Deutsche Fassung EN_60584-1:2013. DIN Media GmbH: Berlin, Germany. [CrossRef]
  25. Kaiser, H.F. The Application of Electronic Computers to Factor Analysis. Educ. Psychol. Meas. 1960, 20, 141–151. [Google Scholar] [CrossRef]
  26. Wissing, F.; Wirtz, S.; Scherer, V. Simulating municipal solid waste incineration with a DEM/CFD method—Influences of waste properties, grate and furnace design. Fuel 2017, 206, 638–656. [Google Scholar] [CrossRef]
  27. Moloko, K.G.; van der Merwe, J.W. Investigation of the mechanism for fireside corrosion in coal-fired boilers in South Africa. J. S. Afr. Inst. Min. Metall. 2021, 121, 305–316. [Google Scholar] [CrossRef]
  28. Paneru, M.; Stein-Brzozowska, G.; Maier, J.; Scheffknecht, G. Corrosion Mechanism of Alloy 310 Austenitic Steel beneath NaCl Deposit under Varying SO2 Concentrations in an Oxy-fuel Combustion Atmosphere. Energy Fuels 2013, 27, 5699–5705. [Google Scholar] [CrossRef]
Figure 1. Simplified Randles-Circuit.
Cmd 06 00045 g001
Figure 2. Simplified overview of the measurement system with major components and data connections.
Cmd 06 00045 g002
Figure 3. A mounted sensor from (A) the outside of the boiler and the (B) standard and (C) alternative electrode geometries, shown from the fireside of the boiler wall.
Cmd 06 00045 g003
Figure 4. Measurement positions of the (A) first two and (B) third sensor sets.
Cmd 06 00045 g004
Figure 5. Visualization of the temperature normalization of the recorded CCD.
Cmd 06 00045 g005
Figure 6. Overview of CCD recorded with the third sensor set in 2024, grouped according to sensor positions and showing data from plant revision (A), initial deposit build-up (B) and normal operation (C).
Cmd 06 00045 g006
Figure 7. (A) CCD, (B) CCD with temperature compensation and (C) sensor temperature from the third pass during the 2nd measurement campaign.
Cmd 06 00045 g007
Figure 8. PCA heat map of plant data and recorded CCD of sensors S1 to S10, showing top 85% of the dominant variables in each PC, color graded by individual loading.
Cmd 06 00045 g008
Figure 9. (A) Scatter plot of the normalized CCD recorded by sensor S3 over CO content in the flue gas at the end of the boiler (green), with running average (black) and (B) class sizes of the running average.
Cmd 06 00045 g009
Figure 10. ILM images of the cross sections of electrodes from sensors (A) S7, (B) S5 and (C) S4 of the second sensor set.
Cmd 06 00045 g010
Figure 11. EDX scans of sensor S7, showing element distributions of Fe, O, Na, Cl, S and K in the corrosion product and deposit layers.
Cmd 06 00045 g011
Figure 12. EDX scans of sensor S4, showing element distributions of Fe, O, Na, Cl, S, K, Ca, Al and Si in the corrosion product and deposit layers.
Cmd 06 00045 g012
Figure 13. EDX scans of sensor S5, showing element distributions of Fe, O, Na, Cl, S, K, Ca, Al and Si in the corrosion product and deposit layers.
Cmd 06 00045 g013
Table 1. Key parameters for the measurement principle.
ParameterValue
Low excitation frequency100 mHz
High excitation frequency200 Hz
Excitation Amplitude20 mV
B value25.6 mV
Table 2. Overview of the measurement scope.
Sensor SetFirstSecondThird
Sensors (Groups)8 (3)8 (3)10 (4)
Electrode Configuration4 squared4 squared4 squared
3 elongated on S2 & S4
Commissioning date11 August 202219 July 202318 September 2024
Decommissioning date18 July 202324 August 2024Measurements ongoing
State of electrodes at decommissioningSandblastedDeposits intact
Further analysis of electrodes-Chemical analysis-
Table 3. Stability analysis of the variance explained by PC1 to PC10, based on 100 bootstrap-samples of the original data set.
Primary ComponentPC1 [%]PC2 [%]PC3 [%]PC4 [%]PC5 [%]PC6 [%]PC7 [%]PC8 [%]PC9 [%]PC10 [%]
97.5 percentile35.7610.656.646.205.685.184.844.514.273.28
Mean of Bootstrap35.4610.456.566.145.645.154.814.464.203.22
Original data set35.4510.456.566.145.645.154.814.464.203.22
2.5 percentile35.1610.296.486.075.595.114.774.414.123.17
Original
Eigenvalue
7.092.091.311.231.131.030.960.890.840.64
Table 4. Stability analysis of the dominant variable loadings in PC1, based on 100 bootstrap-samples of the original data set.
Original VariableSteam FlowTemp Flue Gas 1st PassTemp Flue Gas Boiler CeilingTemp Flue Gas 2nd PassTemp Flue Gas 3rd PassO2 Boiler End
97.5 percentile0.3790.3700.3710.3600.366−0.341
Mean of Bootstrap0.3680.3690.3700.3590.365−0.342
Original data set0.3680.3690.3700.3590.365−0.342
2.5 percentile0.3670.3680.3690.3580.364−0.344
Table 5. Eigenvalues of the first ten PC for evaluation of significance.
Primary ComponentPC1PC2PC3PC4PC5PC6PC7PC8PC9PC10
Original
Eigenvalue
7.092.091.311.231.131.030.960.890.840.64
Disclaimer/Publisher’s Note: The statements, opinions and data contained in all publications are solely those of the individual author(s) and contributor(s) and not of MDPI and/or the editor(s). MDPI and/or the editor(s) disclaim responsibility for any injury to people or property resulting from any ideas, methods, instructions or products referred to in the content.