Article

Corrosion of Silica-Based Optical Fibers in Various Environments

1
Nuclear Engineering Program, Mechanical Engineering Department, Virginia Polytechnic Institute and State University, Blacksburg, VA 24060, USA
2
Luna Innovations Incorporated, 301 1st St. SW #200, Roanoke, VA 24011, USA
*
Author to whom correspondence should be addressed.
Corros. Mater. Degrad. 2023, 4(3), 445-465; https://doi.org/10.3390/cmd4030023
Submission received: 20 June 2023 / Revised: 25 July 2023 / Accepted: 4 August 2023 / Published: 8 August 2023

Abstract

:
This research article explores the potential of optical fibers as sensors, highlighting their ability to measure various parameters such as temperature, pressure, stress, and radiation dose. The study focuses on investigating the material compatibility of optical fibers in challenging sensing environments like Gen II/II+ and advance nuclear reactors, as well as concentrated solar power (CSP) plants. Material compatibility tests were conducted to determine the feasibility of using fluorine and germanium optical fiber sensors in these environments. The study found that raw fibers were corrosion-resistant to lead bismuth eutectic at 600 °C, regardless of the coating. In molten salt environments, raw fibers were incompatible with FLiNaK but showed corrosion resistance to MgCl₂-NaCl-KCl. However, the survivability of raw fiber optics improved with a gold coating in FLiNaK. Raw fiber optics were found to be incompatible in high-temperature steam at 1200 °C and in a pressurized water reactor (PWR) at 300 °C.

1. Introduction

Since the discovery of the physical properties of glass in the 1960s and the emergence of fiber optic communication [1], fiber sensing technology has experienced significant growth [2] across various sectors, including medical applications [3,4], communication systems [5], and construction industries [6], etc. Moreover, fiber optic sensing has made its way into the nuclear energy sector, particularly for temperature, pressure, and leak detection purposes [7,8]. Utilizing fiber optics as sensory indicators in nuclear power plants offers numerous advantages. Notably, fiber optics are immune to electromagnetic interference, and their compact size enables multiple sensors to be accommodated through a single reactor vessel feedthrough, allowing for the measurement of multiple environmental parameters through inline sensor multiplexing.
Ensuring the safety and reliability of a power plant requires a comprehensive understanding of the operating environment, and sensors play a crucial role in providing valuable information to operators. However, traditional sensor systems have certain limitations, such as occupying significant space due to the need for multiple sensing locations and various sensors for measuring different parameters, including temperature, pressure, strain, neutron fluence, and more. Typically, this necessitates the installation of instrumentation ports, with the number of ports equal to or greater than the number of sensing points and types of parameters being measured. In most cases, the number of penetrations exceeds the number of sensors, as traditional sensors rely on multiple conductive leads that are susceptible to electromagnetic interference [9]. On the other hand, optical fibers have long been recognized for their use in high-performance, long-distance data transmission through the utilization of light pulses. Interestingly, optical fibers also offer the capability to acquire physical data, such as temperature, pressure, strain, and other measurands, by analyzing the spectral reflection or transmission profile of a light source illuminating the fiber. Unlike traditional sensors, optical fiber sensors do not require an electrically conductive path to and from the sensor. With a typical fiber optic diameter of 125 µm, multiple fibers can be easily accommodated through a single instrumentation port for measuring various parameters simultaneously.
The work presented here is targeted towards optical fibers that use type-II fiber Bragg gratings (FBGs) to measure temperature [10] and Extrinsic Fabry-Perot Interferometer (EFPI) to measure pressure [11]. Temperature measurement using FBGs involves analyzing the shift in reflected peak wavelength, which changes proportionally with temperature. Additionally, Bonopera also discussed recent advancements which have been made in the development of Fiber Bragg Gratings (FBGs) for displacement measurements, opening up the potential for utilizing fiber optics in crack propagation measurements of structural materials [12]. Conversely, EFPI produces an interferometric pattern with constructive and destructive interference, and the period decreases as the EFPI etalon gap increases. More detailed information on measurement techniques can be found in the references [8,13].
Previous studies have successfully demonstrated temperature sensing in irradiated environments using protective packaging [8,11,14,15]. However, there is limited understanding regarding the performance of fiber optics when directly exposed to chemically harsh environments. This includes scenarios where the protective shell material has failed, resulting in exposed fibers, or situations requiring direct contact between the optical fiber glass and the working fluid, such as in glass EFPI pressure transducers [8,13] or potential analytic chemistry probes [16,17,18,19,20,21,22,23]. In a study by Wysokiński et al., they conducted experiments involving metal coating on material to enhance the thermal durability of silica optical fibers. They mainly used copper and some nickel coatings and tested them at temperatures ranging from 450 to 700 °C in air [24]. Their results demonstrated that employing different materials as coatings can substantially improve the fiber’s resistance to higher temperatures.
Additionally, direct contact between the working fluid and the optical fiber offers advantages such as faster thermal response rates and strain monitoring in materials without the interference of protective packaging. Investigating the performance of fiber optics in harsh environments like high-temperature steam, molten salt, and liquid metals has the potential to revolutionize sensor technology and create new possibilities across multiple industries, extending beyond the nuclear energy generation sector.
Optical fibers have emerged as highly promising sensor materials, owing to their exceptional properties. Their inherent immunity to electromagnetic interference allows accurate measurements of temperature, pressure, stress, and various other factors. The numerous advantages offered by optical fiber sensors have stimulated considerable interest in deploying them in a wide range of harsh sensing environments.
In order to evaluate the feasibility of employing optical fiber sensors in these challenging settings, it is imperative to conduct comprehensive material compatibility testing. The presence of fluorine (F) in SiO2 can minimize density fluctuations [25]. In addition, fluorine-doped fibers also have increased radiation resistance [26]. Germanium (Ge) fibers, on the other hand, have demonstrated excellent performance characteristics, particularly in terms of low-noise and high-speed responsivity [27]. However, limited research has been conducted on the behavior of fiber optics in such environments, particularly when SiO2 in the fiber contains Ge or F. The objective of this study is to examine the compatibility of SiO2 optic fibers with F and Ge within the fiber and assess the effectiveness of the fiber coating in protecting against high-temperature steam, molten salt, liquid metal, and high-temperature aqueous environments.

2. Experimental Methodology

2.1. Test Conditions and Materials

A selection of radiation-resistant optical fibers were examined in five different harsh high-temperature environments, specifically steam, FLiNaK (LiF 46.5 mol%–NaF 11.5 mol%–KF 42.0 mol%), MgCl₂-NaCl-KCl (MgCl₂ 44.74 mol%–NaCl 29.43 mol%–KCl 25.83 mol%), lead-bismuth eutectic (LBE) (Pb 44.5 at.% 55.5 at.%), and pressurized water reactor (PWR). The specific experimental conditions for each environment are provided in Table 1.
The tested fibers consisted of uncoated raw fibers primarily composed of SiO2, with the specific compositions of the fibers listed in Table 2. The scanning electron microscopy (SEM) images of the uncoated fibers prior to testing are depicted in Figure 1 and Figure 2. To evaluate the impact of coating on fiber performance, gold-coated SiO2 fibers were also examined, with the fiber compositions provided in Table 3. Figure 3 displays optical images of pre-test gold-coated SiO2 fibers, illustrating variations in the preparation of fiber ends.

2.2. Test Setup and Post-Test Analysis

The steam tests were performed using a horizontal tube furnace with controlled heating and cooling rates set at 5 °C/min. The fibers were placed in rectangular sample holders made of 99.95% pure alumina and inserted into the test region of the tube furnace. Figure 4 illustrates the arrangement of two types of fiber samples that could be tested simultaneously in the tube furnace. The flanges of the tube furnace were sealed, and the system was evacuated and purged with ultra-high-purity (99.999%) argon gas three times to remove air from the environment. Steam was generated in a steam generator using Type I deionized (DI) water, following the ASTM D1193-06 standard [28]. Once the desired temperature was reached, the steam was introduced into the tube furnace, maintaining a steam flow rate between 0.8–1.2 mg/cm2·s.
The fiber optic material compatibly tests in LBE were conducted in an environmentally controlled glovebox using a box furnace, and the experimental setups are depicted in Figure 5a. LBE were purchased from Goodfellow, where the compositions of Pb and Bi were 44.5 mol.% and 55.5 mol.%, respectively. To accommodate the lower density of fibers compared to molten LBE, individual fibers were inserted into alumina channels and secured in place with an alumina lid. The oxygen and moisture in the glovebox were kept at <100 ppm and <10 ppm, respectively.
For the preparation of FLiNaK salts, LiF (46.5 mol%), NaF (11.5 mol%), and KF (42.0 mol%) were placed in pure Ni crucibles (Alfa Aesar (Haverhill, MA, USA) 55 mL Nickel Crucible). The chemicals, sourced from Sigma Aldrich (St. Louis, MO, USA), with purities of LiF (>99%), KF (>99.5%), and NaF (>99%), underwent thermal purification at 400 °C for a minimum of 6 h to remove moisture, and were periodically stirred with a spatula. After thermal purification, the salts were heated to the desired temperature of 750 °C and maintained for 6 h to ensure homogeneity. As optical fibers are denser than molten salts, they could be fully immersed in the salts without the need for additional hold-down structures, as illustrated in Figure 5b. For the preparation of MgCl₂-NaCl-KCl, MgCl₂ (44.74 mol%), NaCl- (29.43 mol%), and KCl (25.83 mol%) were placed in a pure Al2O3 crucible (Advalue Technology, Tucson, AZ, USA). MgCl₂ was sourced from VWR with purity > 98% and both NaCl and KCl from Sigma Aldrich, with purities of >99%. The salt mixture was thermally purified at 117 °C for >24 h, 180 °C for >24 h, 240 °C for >6 h, and 400 °C for >6 h. After thermal purification, the salts were heated to the desired temperature of 700 °C and maintained for 6 h to ensure homogeneity.
The experiments in a PWR-simulant water were conducted under high-temperature (300 °C) and pressure (2200 psig) conditions, utilizing PWR water coolant chemistry. The test setup comprised an autoclave constructed from SS 316, a high-purity argon gas supply with oxygen concentration below 4 ppm, and a heating mantle equipped with a PID temperature controller to maintain the solution temperature. To prevent impurities from the autoclave from contaminating the test environment, the autoclave surface underwent oxidation prior to the experiment. The PWR coolant chemistry was prepared by dissolving 1500 ppm boron using boric acid (Sigma Aldrich > 99.5%) and 3 ppm lithium (Sigma Aldrich > 98%) in Type I DI water. For PWR tests conducted in the autoclave, the fiber was fully inserted into the autoclave.
Following the experiments, a FEI ( Hillsboro, OR, USA) Quanta 600F Field Emission SEM integrated with energy dispersive X-ray spectroscopy (EDS) was utilized to analyze the degradation of the fibers. For the examination of the post-test fiber cross-sections, the fibers were first embedded in epoxy resin and cast-mounted. The surfaces were then ground using SiC with a grit size of 1200, followed by polishing with a 1µm polycrystalline diamond suspension on a Nappad polishing pad. Optical images were captured using a Pace Technologies (Tucson, AZ, USA) 3000 microscope.

3. Results and Discussion

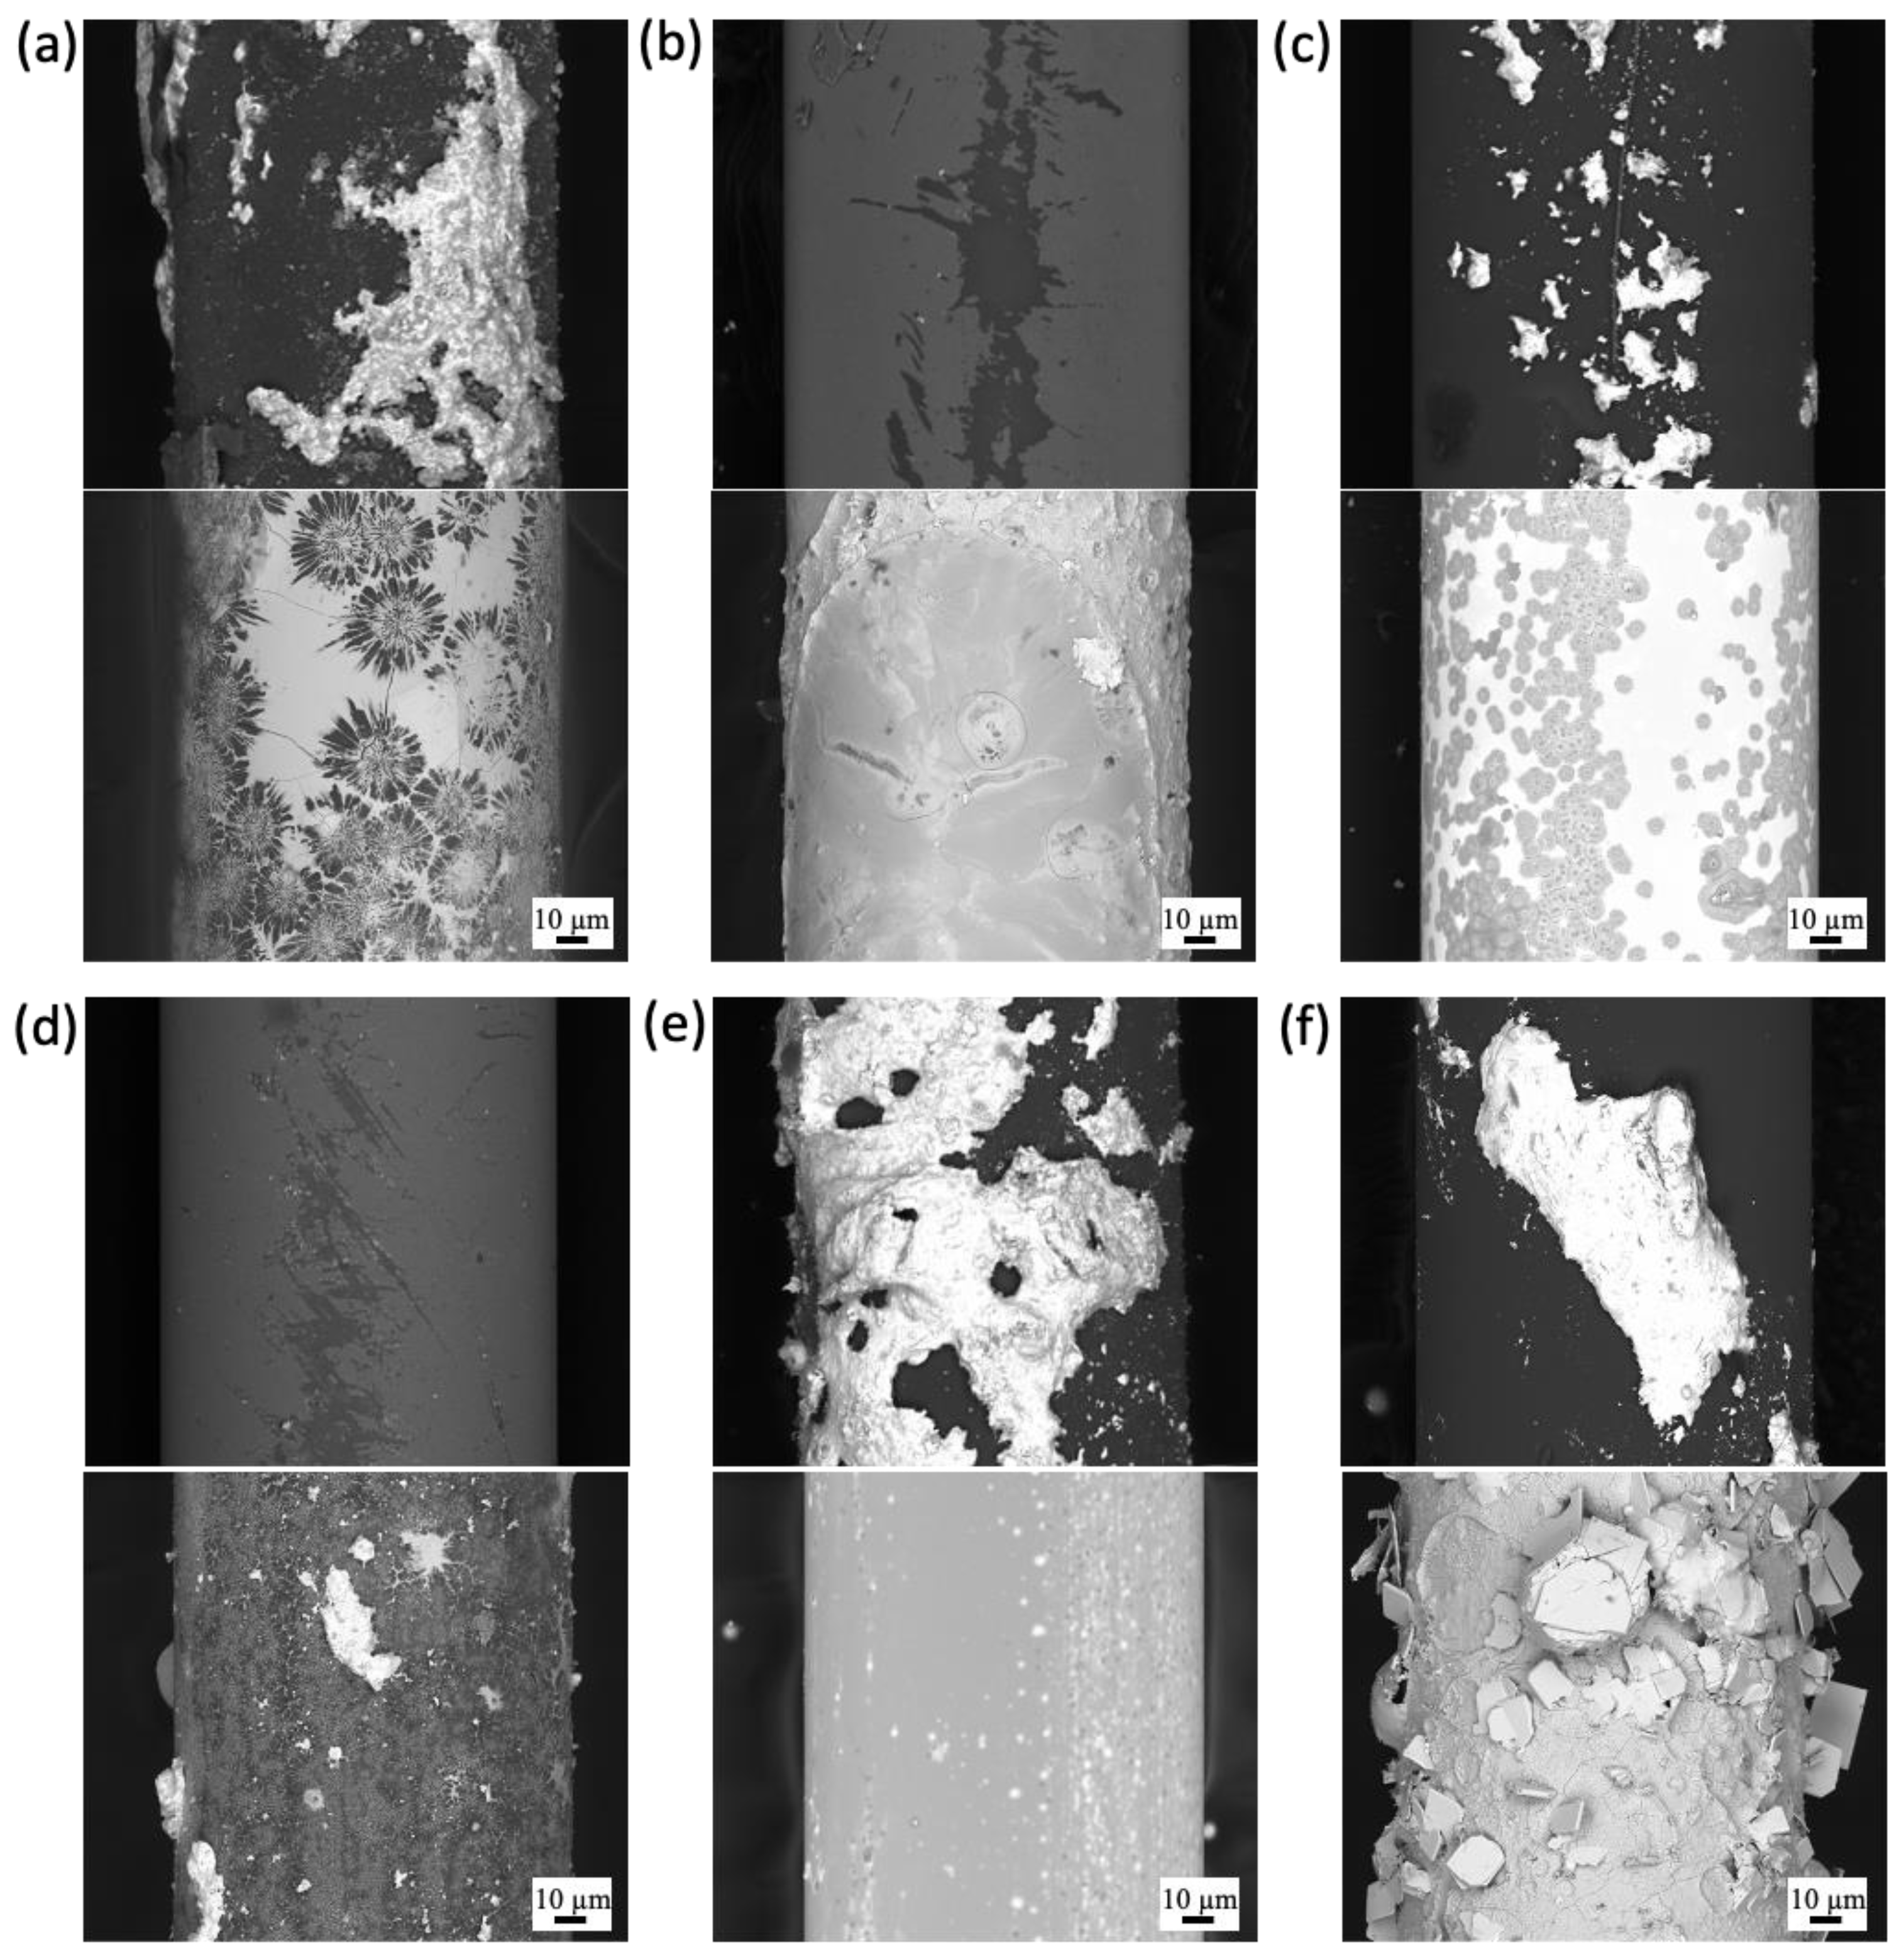
3.1. Uncoated SiO2 Fibers

3.1.1. High-Temperature Steam

The degradation of fiber specimens in high-temperature steam at 1200 °C was observed, with varying degrees of degradation within the same fiber material. The most severe degradation was evident in certain individual specimens, as depicted in Figure 6. Fibers F103, F105-1, F105-2, and F106 exhibited layered ring fractures, as shown in Figure 6c–f. Notably, the F103 specimen displayed severe disintegration in some cases. The brittleness of the fibers after exposure to steam made it extremely challenging to prepare cross-section samples for SEM. In severe cases like F103, the fiber disintegrated into small particles, making it impossible to salvage any long enough for SEM mounting. Consequently, cross-sections of the fiber were obtained from strands that remained intact in the axial direction. The EDS mapping of these samples is presented in Figure 7. The distortion of F102 was caused by the slanting position of the fiber during mounting. It is important to note that no migration of Ge or F was observed in any of the cases. The disintegration of the fiber in high-temperature steam indicates that the fibers would not survive in a beyond design basis accident (BDBA) scenario.

3.1.2. Molten Salt

The experimental results revealed that all fibers underwent complete dissolution within 0.5 h when exposed to the fluoride salt, FLiNaK, at 750 °C. This dissolution occurred due to the incompatibility of SiO2 with molten fluoride salt. However, a different outcome was observed when testing the fibers in chloride salt; specifically, MgCl2-KCl-NaCl at 700 °C. The selection of a lower temperature was based on considering the highest operational temperature typically encountered in MgCl2-KCl-NaCl applications. In this case, the raw fiber F103, which had previously demonstrated good corrosion resistance in LBE (as discussed in Section 3.1.3), was selected for testing. After 24 h of exposure to MgCl2-KCl-NaCl, the salt fully covered the surface of the fiber, as depicted in Figure 8. However, the salt did not penetrate the fiber, and no cracks were detected, as shown in Figure 9. This suggests that raw fibers have the potential to withstand prolonged periods of time and can be utilized in direct contact with MgCl2-KCl-NaCl without experiencing significant degradation.

3.1.3. Lead Bismuth Eutectic

The experimental results provide insights into the behavior of raw fibers when exposed to LBE at 600 °C. The SEM surface analysis depicted in Figure 10 reveals the changes that occurred on the fiber surfaces over a period of time. After 24 h of exposure to LBE, it can be observed that LBE adhered to the surfaces of the raw fibers. The adherence is evident in the form of a layer covering the fibers. However, when the exposure time was extended to 168 h, a more significant observation was made. LBE was found to have penetrated into some of the fibers, indicating a deeper interaction between the fiber material and the LBE.
In the case of F101, the LBE formed a concentric pattern on the fiber surface. A similar pattern was observed in F103, but the spots were relatively small compared to F101. Both F101 and F103 exhibited higher concentrations of F compared to the other raw fibers, suggesting a possible correlation between F content and LBE interaction. Interestingly, the results from F105-2 revealed that the effect of LBE adherence, as indicated by surface tension, did not directly correspond to a higher level of LBE penetration into the fiber. This suggests that factors beyond surface tension may influence the extent of LBE penetration.
Overall, these findings demonstrate the dynamic nature of the interaction between raw fibers and LBE over time. The observations of LBE adherence and penetration provide valuable insights into the behavior and potential degradation mechanisms of fibers exposed to LBE environments.
The experimental results indicate that the behavior of the fibers after 24 h of exposure to LBE is comparable to the results obtained after 168 h. This finding is supported by the cross-section SEM images provided in Figure 11 and Figure 12. In the case of fibers F101, F102, and F106, it can be observed from the SEM images that LBE has fully wetted the surfaces of these fibers after both 24 h (Figure 11) and 168 h (Figure 12) of exposure. It is worth mentioning that, in both cases, the dissolution of Ge and F into LBE was observed. While the fiber structure remained intact, the impact of the migration of certain amounts of F and Ge out of the fiber on the properties of the fiber optic is uncertain. This aspect will be subject to further investigation in future studies.
The observed behavior can be attributed to the corrosion mechanism that occurs in LBE, which relies on the physical dissolution of the material. The penetration of LBE into the fiber surfaces indicates the corrosive nature of the LBE environment and its interaction with the fiber material. The comparable results between the 24 h and 168 h exposure periods suggest that the corrosion process reaches a relatively stable state after 24 h, with no significant changes in the wetting behavior of LBE on the fiber surfaces over the longer exposure period. These findings contribute to a better understanding of the corrosion mechanism of fibers in LBE environments, emphasizing the importance of considering the physical dissolution of the material in such corrosive conditions.

3.1.4. Pressurized Water Reactor (PWR)

The experimental results reveal that fiber F103, which exhibited superior resistance in the LBE environment, did not fare well when exposed to the PWR (pressurized water reactor) primary water at 300 °C and 2200 psig. After 168 h of testing, F103 was found to have fully dissolved in the PWR environment.
The analysis of the PWR primary water using inductively coupled plasma mass spectrometry (ICP-MS) showed an increase in silicon (Si) concentration after the test. However, the measured concentration did not align with the expected value calculated based on the assumption that the entire fiber had completely dissolved (as shown in Table 4). This discrepancy in the results can be attributed to a couple of factors. Firstly, it is possible that there was residual SiO2 that did not fully dissolve into the PWR primary water. This could explain why the measured Si concentration was lower than the expected value. Secondly, the measurement of silicone using ICP-MS can be challenging due to the high ionization potential of silicone and susceptibility to polyatomic interferences. These factors may have contributed to differences in the measurement results obtained.
In conclusion, the experimental findings suggest that fibers alone cannot withstand normal operating conditions in a PWR without additional protective packaging. The complete dissolution of fiber F103 in the PWR primary water indicates the vulnerability of the fiber material to the corrosive environment of a PWR system.

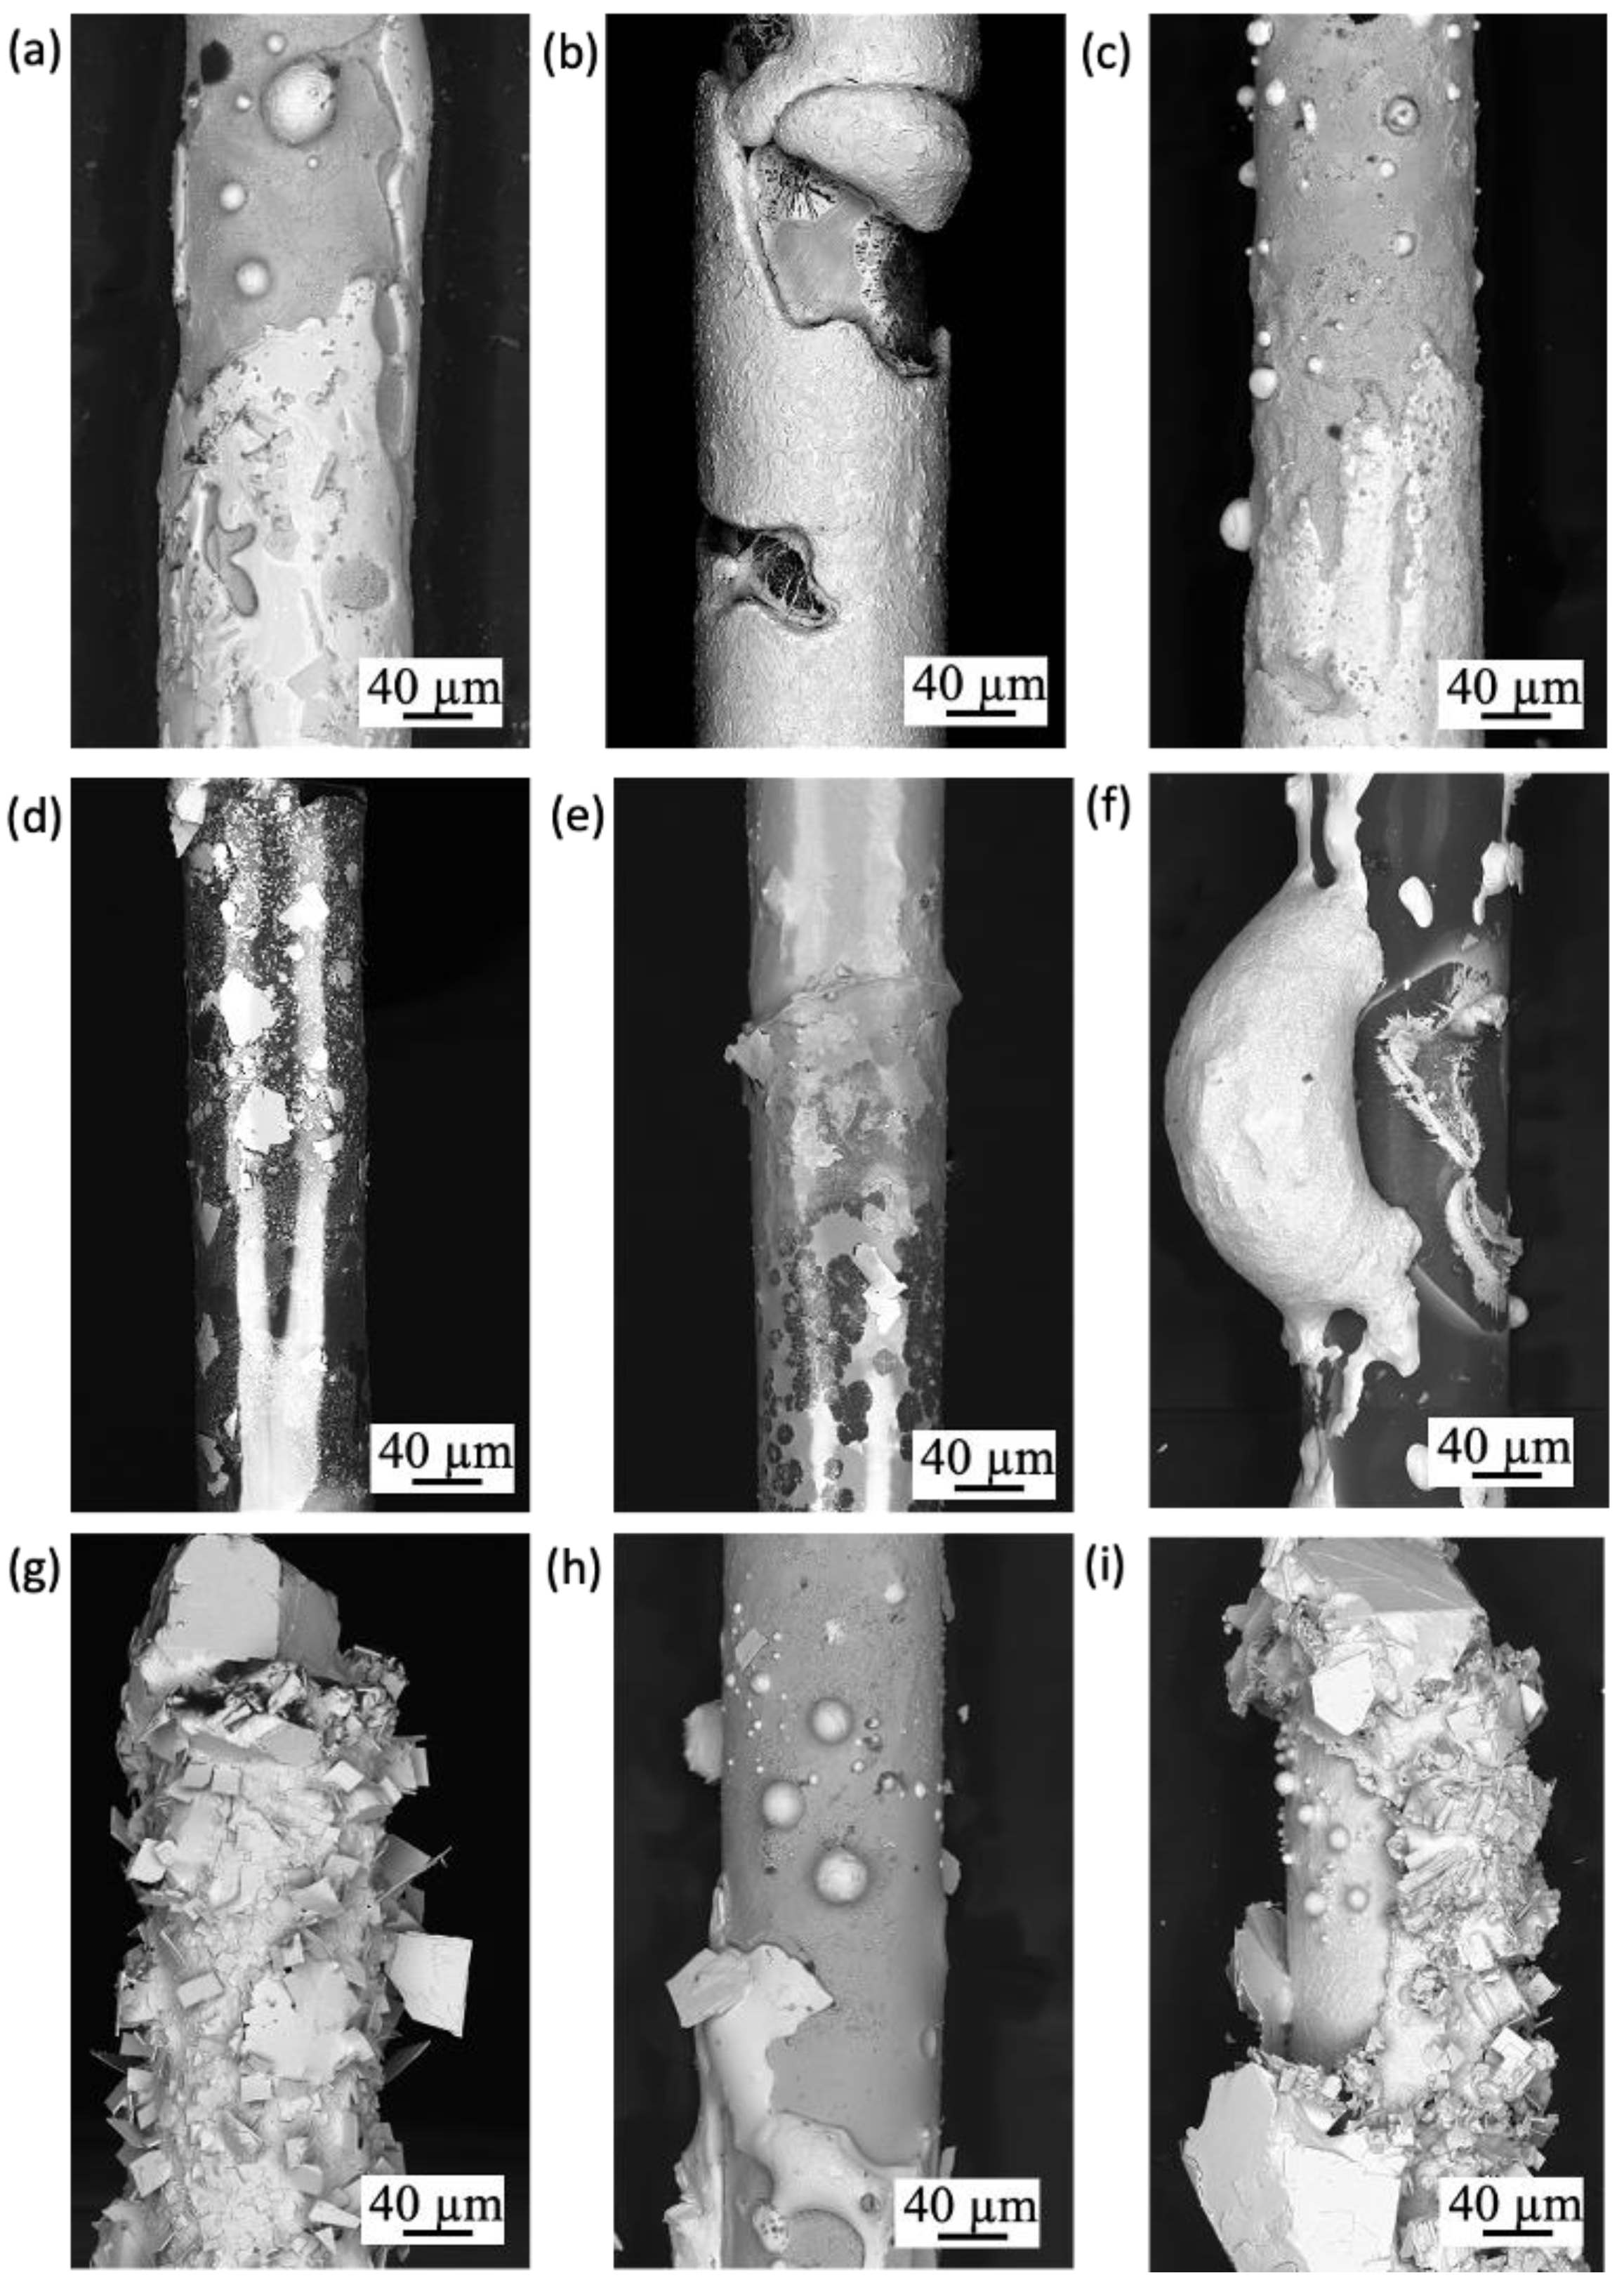
3.2. Coated SiO2 Fibers

3.2.1. Gold-Coated Fibers Exposed to Molten Salt

The experimental results presented in Figure 13 depict a series of images taken periodically from the exterior of a furnace where gold-coated fibers were immersed in FLiNaK at a temperature of 750 °C for a duration of 7 days. The fibers were divided into two main groups: 1 to 10, which had their ends cut with diagonal pliers or a razor blade before being coated with gold via vapor deposition, and 11 to 12, which were stripped and cleaved before receiving a gold coating via vapor deposition.
The qualitative difference between these two sets of samples lies in their construction. The first group retained their original gold coating along their length, but their end faces were crushed and also coated with gold. On the other hand, the second group consisted of fibers with 5–10 mm of exposed bare fiber, with a cleaved end that was gold-coated, albeit to a lesser extent due to “over spray” coating the stripped portion. Prior to the test, the fibers were examined using SEM to confirm their composition, as shown in Figure 14 (an example from one of the stripped and cleaved fiber receiving a gold coating via vapor deposition).
Upon evaluating the post-condition of the fibers, it was observed that they either ended up partially broken or experienced complete failure, rendering them irretrievable. Furthermore, it was observed that the FLiNaK salts were transparent initially, but after the test, the salt exhibited a slight yellow tint. This discoloration indicates the possibility of gold dissolution into the FLiNaK salt at a temperature of 750 °C. However, it is worth noting that the raw fibers without any coating fully dissolved in FLiNaK within the first 0.5 h of the test. In contrast, the gold-coated fibers did not begin deforming until the fourth day of testing, representing a significant improvement in their survivability. Furthermore, a specific experimental setup was designed to investigate the degradation of gold-coated fibers with their mid-section exposed to molten salt, while both ends were kept unexposed. The results from this experiment exhibited a similar pattern, wherein the fiber began to deform after four days of exposure and eventually collapsed after seven days. Notably, the external gold coat shell of the fiber remained intact, giving the appearance of an implosion collapse. This observation suggests that, while the thin gold coating might undergo some degradation, it acts as a protective barrier until later stages, preventing rapid fiber dissolution into the molten salt. However, as time progresses, the dissolution of the fiber into the molten salt surpasses the rate of gold degradation.
Based on these findings, it is evident that a thin coating film on the fibers can significantly enhance their ability to withstand harsh fluoride environments like FLiNaK. The coating serves as an effective protective layer, delaying the onset of fiber degradation and contributing to prolonged durability. Overall, these results provide valuable insights into the importance of coatings in extending fiber performance under challenging conditions.

3.2.2. Gold-Coated Fibers Exposed to LBE

The experimental results presented in this section focused on the evaluation of gold-coated fibers stripped and cleaved, before receiving a gold coating via vapor deposition in LBE environment at 600 °C. Typical images of the fiber surfaces and cross-sections after exposure to LBE were captured using BSE imaging, as illustrated in Figure 15 and Figure 16, respectively. It was observed that the wetting of LBE on some fibers was severe, indicating a significant interaction between the coated fiber and the LBE medium. In certain instances, such as in the case of Figure 16e with specimen 4, the absence of gold coating could be attributed to inadequate vapor deposition, resulting in a suboptimal gold coating. Figure 17 provided a comparison of the 7-day immersion test between raw (uncoated) fibers and gold-coated fibers. The results revealed that the presence of the gold coating had no noticeable effect on fiber degradation in the LBE environment. Furthermore, Figure 18 demonstrated the presence of LBE between the gold coating and the fiber, indicating the non-uniformity and, likely, non-hermetic nature of the gold coating, which allowed LBE to diffuse into the layer. This finding provided additional evidence that the gold coating, as utilized in the salt experiment discussed in Section 3.2.1 significantly slowed down the degradation of the fiber. However, the presence of small voids in the gold coating likely contributed to eventual failure.
Consequently, it is evident that a better and more uniform coating is necessary to enhance the corrosion resistance of the fiber in harsh environments. Although the gold coatings did not improve the already reasonable chemical resistance performance of the fibers in the LBE environment, they did provide a low-profile thermally conductive protective mechanical layer on the fiber. As a result, the gold-coated fiber exhibited greater durability and robustness during general handling compared to bare glass fiber.
In summary, the experimental results showed that the gold coating did not have a significant impact on the degradation of fibers in the LBE environment. The presence of LBE between the gold coating and the fiber indicated the non-uniformity of the coating and the need for a more effective solution to improve the corrosion resistance. While the gold coatings did not enhance the chemical resistance of the fibers, they did provide mechanical protection and improved handling robustness. Therefore, further research and development are required to achieve a better uniform coating that can effectively enhance the corrosion resistance of fibers in harsh environments.

4. Corrosion Mechanism

This section discusses the corrosion mechanism of SiO2 optic fibers in various environments.
High-temperature steam: Corrosion of SiO2 in high-temperature steam is a complex phenomenon. Previous research has provided evidence of SiO2 volatilization in high-temperature steam, especially at temperatures around 1200 °C, similar to those used in this study [29]. The degradation process occurred based on the principal of reaction of SiO2 with high-temperature steam as shown in Reaction (1).
Reaction (1) demonstrates the volatilization of SiO2 when exposed to steam [30]:
S i O 2 s + 2 H 2 O g S i O H 4 g
In addition, the SiO2 solubility in superheated steam for temperatures up to 500 °C has been observed by Morey et al. [31]. However, the temperature from the previous work matches closer to 1200 °C, which is used in this study and conducted in the same facility and parameters. These findings support the disintegration of SiO2 into Si(OH)4 due to its reaction with steam. Although, raw SiO2 were mixed with various amounts of F and Ge in the core in this study, but the presence of these elements has no influence on the degradation of fibers in high-temperature steam. The major degradation is still caused by the reaction of SiO2 with high-temperature steam.
Molten salts: The chemical reaction depicted in Reaction (2) explains that the dissolution of SiO2 into molten salts, where X is F or Cl. This reaction occurs based on the corrosion potential and the concentration of O2− in the molten salt.
S i O 2 + 4 X S i X 4 + 2 O 2
Hence, the stability of oxides in molten salt is dependent on the concentration of O2− in molten salt. With higher concentration of O2− ions in the molten salt, oxides are more thermodynamically stable, vice versa. On the other hand, Zhou et al. have indicated that, in chloride salt (MgCl2-NaCl-KCl), the preference of oxides existing in the molten salt ranked from SiO2, MgO, Na2O, and K2O, based on the thermodynamic and decomposition potential of oxide in bulk salt [32]. SiO2 demonstrates thermodynamic stability in the presence of MgCl2, NaCl, and KCl, indicating that it does not undergo a reaction to form SiCl4 [32]. This observation provides additional evidence for the survival of SiO2 in molten chloride salts in MgCl2-NaCl-KCl at 700 °C. However, SiO2 in molten fluoride in FLiNaK at 750 °C was not stable. This indicates that the equilibrium O2− concentration is higher in FLiNaK, in addition SiF4 is in gaseous state at 750 °C, resulting in a continuous Reaction (2) until SiO2 full dissolution.
Lead Bismuth Eutectic: Quartz is commonly used as a containment material in LBE [33,34]. Quartz is primarily composed of bonded silicon and oxygen atoms, with a chemical formula of SiO2. Oxides, which are stable in LBE, are typically utilized as protective barriers [35]. Li et al. have shown that silicon oxide formed on metals exhibits protective properties against corrosion in LBE [36]. While the presence of impurities or foreign elements can lead to various colors and types of quartz in nature, the addition of F and Ge core in this study did not affect the corrosion of raw SiO2 fibers in LBE, although some dissolution of F and Ge were found in LBE. Future studies will be conducted to investigate the effects of F and Ge migration on the optical properties of fibers. The corrosion of non-oxides in LBE can occur through the physical dissolution. However, there have been a limited number of studies conducted on the solubility of gold, fluorine, and germanium in LBE. According to the material compatibility test conducted in this study, the gold coating maintained its integrity and exhibited no indications of embrittlement. Therefore, in this particular case, raw SiO2 maintains stability in this environment, making it a suitable sensor material in LBE at 600 °C.
Pressurized Water Reactor (PWR): PWR is made up of water with boric acid and lithium hydroxide. With water, SiO2 can undergo hydrolysis and turn into H4SiO4 as depicted in Reaction (3). This is supported by the observed increase in Si concentration, as determined through ICP measurements.
S i O 2 ( s ) + 2 H 2 O ( a q ) H 4 S i O 4 ( a q )
Fournier and Rowe examined the solubility of amorphous silica and quartz in high-temperature waters and pressures [37]. Their findings revealed that quartz exhibits lower solubility in water compared to amorphous silica. Specifically, the concentration of silica in water derived from amorphous silica was 3–4 times higher than that from quartz at a temperature of 300 °C [37]. This highlights the significance of the SiO2 crystal structure in determining its corrosion resistance in high-temperature water environments and the importance of examining raw SiO2 fibers in PWR in this study. There is also the possibility of lithiation of SiO2 as thermodynamically, SiO2 has a tendency to undergo lithiation, wherein Li-O become more favorable compared to Si-O bonding [38]. Unfortunately, the addition of F and Ge in raw SiO2 did not improve the corrosion resistance in PWR at 300 °C.

5. Material Compatibility

The results and discussion of the study provide valuable insights into the behavior and compatibility of uncoated SiO2 fibers and gold-coated fibers in different harsh environments. The implications of these findings are as listed.
High-temperature steam: The severe degradation of uncoated SiO2 fibers in high-temperature steam indicates that they would not survive in beyond design basis accident scenarios above 1200 °C. This highlights the need for protective coatings or alternative fiber materials to enhance their compatibility in such environments. Further research could explore the performance of coated fibers in high-temperature steam to assess their effectiveness.
Molten salts: Uncoated SiO2 fibers showed complete dissolution when exposed to FLiNaK, a molten fluoride salt at temperatures above 750 °C. However, gold-coated fibers demonstrated improved survivability, with delayed deformation compared to uncoated fibers. This shows promising results, suggesting that thin gold coatings can significantly prolong the fibers’ ability to withstand harsh fluoride environments. Further development of coatings could enhance the corrosion resistance of fibers in molten salt environments. In addition to coatings, uncoated SiO2 fibers also showed no degradation in MgCl2-KCl-NaCl, a molten chloride salt at 700 °C for 24 h. This suggests that uncoated SiO2 fibers could possibly be used as a sensor material in chloride salts.
Lead Bismuth Eutectic: Uncoated SiO2 fibers exhibited minimal interaction with LBE, with some adherence and no significant penetration observed over time at a temperature of 600 °C. Gold coatings did not significantly affect fiber degradation in LBE, indicating the need for better, more uniform coatings to enhance corrosion resistance. The presence of LBE between the gold coating and the fiber suggests non-uniformity and the potential for improved coating solutions. Raw SiO2 fibers can be used as proven in the LBE environment experiment of this work.
Pressurized Water Reactor (PWR): Uncoated SiO2 fibers, including the previously corrosion-resistant F103 in LBE and MgCl2-NaCl-KCl, had fully dissolved in PWR primary water at 300 °C. This indicates the vulnerability of the fiber material to the corrosive environment of a PWR system. Additional protective packaging or alternative fiber materials are necessary to withstand PWR operating conditions.

6. Conclusions

In conclusion, this study investigated the corrosion behavior of fibers in extreme high-temperature environments, including steam, FLiNaK, MgCl₂-NaCl-KCl, LBE, and PWR. The results revealed that fibers exhibited good performance in the LBE environment, followed by molten MgCl₂-NaCl-KCl. However, they were unable to withstand the corrosive effects of FLiNaK, PWR, and high-temperature steam environments.
Nevertheless, the study demonstrated that applying a thin layer of gold coating on the surface of the fiber significantly improved its survivability in these harsh environments. However, it was observed that the failure of the fibers in these environments could be attributed to imperfections in the coating, which allowed direct contact between the fluoride salts and the fiber. Therefore, future investigations should focus on developing a better and more uniform coating to enhance the corrosion resistance and overall survivability of the fibers.
Furthermore, the study found that the addition of a gold coating did not provide any additional protection for fibers in the LBE environment. This suggests that alternative materials and coating techniques need to be explored to identify suitable options for enhancing fiber durability in LBE and similar environments. The uniformity and mechanism of the coating should be considered to ensure effective corrosion resistance. In conclusion, this study highlights the importance of considering material compatibility and coating strategies when utilizing fibers in extreme high-temperature environments. By addressing these challenges, optical fibers could find increased utility in industries such as nuclear power plants, concentrated solar power plants, and other high-temperature and chemically aggressive environments, where their immunity to electromagnetic interference and ability to withstand harsh conditions are advantageous.

7. Future Work

Following the material compatibility testing, future research will be dedicated to utilizing fiber optics for measuring temperature, pressure, and displacement in harsh environments. This will primarily focus on cases where the fibers have shown resilience, such as in the presence of LBE. Furthermore, for environments where optic fibers did not survive, significant attention will be given to developing improved coatings and identifying suitable materials that can enhance the overall performance and longevity of the fibers in these challenging conditions. Optical properties of the fibers will also be taken into consideration, including temperature compensation in Fiber Bragg Gratings (FBGs) for crack propagation measurement [39], as well as the packaging method of prestressed FBGs [12]. Additionally, the long-term utilization of fiber optics in harsh environments, as demonstrated by Lee et al. [40], will also be considered.

Author Contributions

A.L. contributed on the following aspects: methodology, formal analysis, data curation, writing—original draft preparation, reviewing and editing; S.D.R. contributed on the following aspects: conceptualization, methodology, writing, reviewing and editing, supervision, project administration, and funding acquisition. J.Z. contributed on the following aspects: reviewing and editing, supervision, project administration, and funding acquisition. All authors have read and agreed to the published version of the manuscript.

Funding

This material is based upon work supported by the U.S. Department of Energy, Office of Science, SC-1 under Award Number DE-SC0017826. (Disclaimer: This research article was prepared as an account of work sponsored by an agency of the United States Government. Neither the United States Government nor any agency thereof, nor any of their employees, makes any warranty, express or implied, or assumes any legal liability or responsibility for the accuracy, completeness, or usefulness of any information, apparatus, product, or process disclosed, or represents that its use would not infringe privately owned rights. Reference herein to any specific commercial product, process, or service by trade name, trademark, manufacturer, or otherwise does not necessarily constitute or imply its endorsement, recommendation, or favoring by the United States Government or any agency thereof. The views and opinions of authors expressed herein do not necessarily state or reflect those of the United States Government or any agency thereof.)

Data Availability Statement

The raw/processed data required to reproduce these findings will be provided upon request by the corresponding author.

Acknowledgments

This work used shared facilities at the Nanoscale Characterization and Fabrication Laboratory, funded and managed by Virginia Tech’s Institute for Critical Technology and Applied Science. Additional support is provided by the Virginia Tech National Center for Earth and Environmental Nanotechnology Infrastructure (NanoEarth), a member of the National Nanotechnology Coordinated Infrastructure (NNCI), supported by NSF (ECCS 1542100 and ECCS 2025151).

Conflicts of Interest

The authors declare no conflict of interest.

References

  1. Shampo, M.A.; Kyle, R.A.; Steensma, D.P.; Charles, K. Kao—Father of fiber optics. Mayo Clin. Proc. 2011, 86, e45. [Google Scholar] [CrossRef] [Green Version]
  2. Udd, E. An overview of fiber-optic sensors. Rev. Sci. Instrum. 1995, 66, 4015–4030. [Google Scholar] [CrossRef]
  3. Epstein, M. Fiber optics in medicine. Crit. Rev. Biomed. Eng. 1982, 7, 79–120. [Google Scholar]
  4. Mehrvar, M.; Bis, C.; Scharer, J.M.; Moo-Young, M.; Luong, J.H. Fiber-optic biosensors-trends and advances. Anal. Sci. 2000, 16, 677–692. [Google Scholar] [CrossRef] [Green Version]
  5. Sharma, P.; Pardeshi, S.; Arora, R.K.; Singh, M. A review of the development in the field of fiber optic communication systems. Int. J. Emerg. Technol. Adv. Eng. 2013, 3, 113–119. [Google Scholar]
  6. Bassil, A.; Chapeleau, X.; Leduc, D.; Abraham, O. Concrete crack monitoring using a novel strain transfer model for distributed fiber optics sensors. Sensors 2020, 20, 2220. [Google Scholar] [CrossRef]
  7. Kasinathan, M.; Sosamma, S.; BabuRao, C.; Murali, N.; Jayakumar, T. Fiber optic sensors for nuclear power plant applications. In Proceedings of the Annual Review of Progress in Quantitative Nondestructive Evaluation, Burlington, VT, USA, 17–22 July 2011; pp. 1013–1020. [Google Scholar]
  8. Rountree, S.D. Fiber-Optic Sensor for Simultaneous Measurement of Temperature and Pressure. In Proceedings of the 2018 Advanced Sensors and Instrumentation Webinar, Washington, DC, USA, 6 November 2018; Available online: https://www.energy.gov/ne/articles/2018-advanced-sensors-and-instrumentation-webinar (accessed on 19 June 2023).
  9. Kune, D.F.; Backes, J.; Clark, S.S.; Kramer, D.; Reynolds, M.; Fu, K.; Kim, Y.; Xu, W. Ghost talk: Mitigating EMI signal injection attacks against analog sensors. In Proceedings of the 2013 IEEE Symposium on Security and Privacy, Berkeley, CA, USA, 19–22 May 2013; pp. 145–159. [Google Scholar]
  10. Hirayama, N.; Sano, Y. Fiber Bragg grating temperature sensor for practical use. ISA Trans. 2000, 39, 169–173. [Google Scholar] [CrossRef] [PubMed]
  11. Wu, J.; Wang, M.; Zhao, K.; Huang, S.; Zaghloul, M.A.; Cao, R.; Carpenter, D.; Zheng, G.; Rountree, S.D.; Chen, K.P. Distributed fiber sensors with high spatial resolution in extreme radiation environments in nuclear reactor cores. J. Light. Technol. 2021, 39, 4873–4883. [Google Scholar] [CrossRef]
  12. Bonopera, M. Fiber-bragg-grating-based displacement sensors: Review of recent advances. Materials 2022, 15, 5561. [Google Scholar] [CrossRef] [PubMed]
  13. Rountree, S.D.; Ohanian, O.J.; Boulanger, A.; Kominsky, D.; Davis, M.; Wang, M.; Chen, K.; Leong, A.; Zhang, J.; Scurti, F. Multi-parameter fiber optic sensing for harsh nuclear environments. In Proceedings of the Fiber Optic Sensors and Applications XVII, Online, 12–17 April 2021; pp. 63–82. [Google Scholar]
  14. Corazza, C.; Rosseel, K.; Leysen, W.; Gladinez, K.; Marino, A.; Lim, J.; Aerts, A. Optical fibre void fraction detection for liquid metal fast neutron reactors. Exp. Therm. Fluid Sci. 2020, 113, 109865. [Google Scholar] [CrossRef]
  15. Petrie, C.M. Fiber Optic Sensor for Corrosion Monitoring in Molten Salt Irradiation Experiments; Oak Ridge National Lab. (ORNL): Oak Ridge, TN, USA, 2019. [Google Scholar]
  16. Wang, X.-D.; Wolfbeis, O.S. Fiber-optic chemical sensors and biosensors (2015–2019). Anal. Chem. 2019, 92, 397–430. [Google Scholar] [CrossRef] [PubMed]
  17. Fan, M.; Andrade, G.F.; Brolo, A.G. A review on recent advances in the applications of surface-enhanced Raman scattering in analytical chemistry. Anal. Chim. Acta 2020, 1097, 1–29. [Google Scholar] [CrossRef]
  18. Nakanishi, R.; Saeki, M.; Wakaida, I.; Ohba, H. Detection of gadolinium in surrogate nuclear fuel debris using fiber-optic laser-induced breakdown spectroscopy under gamma irradiation. Appl. Sci. 2020, 10, 8985. [Google Scholar] [CrossRef]
  19. Seitz, W.R. Chemical sensors based on fiber optics. Anal. Chem. 1984, 56, 16A–34A. [Google Scholar] [CrossRef]
  20. Tan, W.; Shi, Z.Y.; Kopelman, R. Development of submicron chemical fiber optic sensors. Anal. Chem. 1992, 64, 2985–2990. [Google Scholar] [CrossRef]
  21. Freeman, T.M.; Seitz, W.R. Chemiluminescence fiber optic probe for hydrogen peroxide based on the luminol reaction. Anal. Chem. 1978, 50, 1242–1246. [Google Scholar] [CrossRef]
  22. Yu, Q.; Zhou, X. Pressure sensor based on the fiber-optic extrinsic Fabry-Perot interferometer. Photonic Sens. 2011, 1, 72–83. [Google Scholar] [CrossRef] [Green Version]
  23. Bremer, K.; Lewis, E.; Leen, G.; Moss, B.; Lochmann, S.; Mueller, I.A. Feedback stabilized interrogation technique for EFPI/FBG hybrid fiber-optic pressure and temperature sensors. IEEE Sens. J. 2011, 12, 133–138. [Google Scholar] [CrossRef]
  24. Wysokiński, K.; Stańczyk, T.; Gibała, K.; Tenderenda, T.; Ziołowicz, A.; Słowikowski, M.; Broczkowska, M.; Nasiłowski, T. New methods of enhancing the thermal durability of silica optical fibers. Materials 2014, 7, 6947–6964. [Google Scholar] [CrossRef] [PubMed]
  25. Urata, S.; Nakamura, N.; Aiba, K.; Tada, T.; Hosono, H. How fluorine minimizes density fluctuations of silica glass: Molecular dynamics study with machine-learning assisted force-matching potential. Mater. Des. 2021, 197, 109210. [Google Scholar] [CrossRef]
  26. Liu, Y.; Blokland, W.; Long, C.D.; Riemer, B.W.; Wendel, M.W.; Winder, D.E. Strain measurement in the spallation target using high-radiation-tolerant fiber sensors. IEEE Sens. J. 2018, 18, 3645–3653. [Google Scholar] [CrossRef]
  27. Sui, K.; Feng, X.; Hou, Y.; Zhang, Q.; Qi, S.; Wang, Y.; Wang, P. Glass-clad semiconductor germanium fiber for high-speed photodetecting applications. Opt. Mater. Express 2017, 7, 1211–1219. [Google Scholar] [CrossRef]
  28. ASTM D1193; Standard Specification for Reagent Water. ASTM: West Conshohocken, PA, USA, 2003.
  29. Leong, A.; Yang, Q.; McAlpine, S.W.; Short, M.P.; Zhang, J. Oxidation behavior of Fe-Cr-2Si alloys in high temperature steam. Corros. Sci. 2021, 179, 109114. [Google Scholar] [CrossRef]
  30. Opila, E.J. Oxidation and volatilization of silica formers in water vapor. J. Am. Ceram. Soc. 2003, 86, 1238–1248. [Google Scholar] [CrossRef] [Green Version]
  31. Morey, G.; Hesselgesser, J. The solubility of quartz and some other substances in superheated steam at high pressures. Trans. Am. Soc. Mech. Eng. 1951, 73, 865–872. [Google Scholar] [CrossRef]
  32. Zhou, X.; Xie, H.; He, X.; Zhao, Z.; Ma, Q.; Cai, M.; Yin, H. Annihilating the formation of silicon carbide: Molten salt electrolysis of carbon–silica composite to prepare the carbon–silicon hybrid for lithium-ion battery anode. Energy Environ. Mater. 2020, 3, 166–176. [Google Scholar] [CrossRef] [Green Version]
  33. Liu, J.; Shi, Q.; Luan, H.; Yan, W.; Sha, W.; Wang, W.; Shan, Y.; Yang, K. Lead–bismuth eutectic corrosion behaviors of ferritic/martensitic steels in low oxygen concentration environment. Oxid. Met. 2015, 84, 383–395. [Google Scholar] [CrossRef] [Green Version]
  34. Abraham, D.; Leibowitz, L.; Maroni, V.; McDEAVITT, S.; Raraz, A. Corrosion of Structural Materials by Lead-Based Reactor Coolants; Argonne National Lab.: Lemont, IL, USA, 2000. [Google Scholar]
  35. Martın, F.; Soler, L.; Hernández, F.; Gomez-Briceno, D. Oxide layer stability in lead–bismuth at high temperature. J. Nucl. Mater. 2004, 335, 194–198. [Google Scholar] [CrossRef]
  36. Li, J.; He, X.; Xu, B.; Tang, Z.; Fang, C.; Yang, G. Effect of silicon on dynamic/static corrosion resistance of T91 in lead–bismuth eutectic at 550 C. Materials 2022, 15, 2862. [Google Scholar] [CrossRef]
  37. Fournier, R.O.; Rowe, J.J. The solubility of amorphous silica in water at high temperatures and high pressures. Am. Mineral. 1977, 62, 1052–1056. [Google Scholar]
  38. Sivonxay, E.; Aykol, M.; Persson, K.A. The lithiation process and Li diffusion in amorphous SiO2 and Si from first-principles. Electrochim. Acta 2020, 331, 135344. [Google Scholar] [CrossRef]
  39. Wang, H.-P.; Dai, J.-G.; Wang, X.-Z. Improved temperature compensation of fiber Bragg grating-based sensors applied to structures under different loading conditions. Opt. Fiber Technol. 2021, 63, 102506. [Google Scholar] [CrossRef]
  40. Lee, Z.-K.; Bonopera, M.; Hsu, C.-C.; Lee, B.-H.; Yeh, F.-Y. Long-term deflection monitoring of a box girder bridge with an optical-fiber, liquid-level system. Structures 2022, 44, 904–919. [Google Scholar] [CrossRef]
Figure 1. SEM backscatter electron (BSE) image of surface of uncoated fiber before test.
Cmd 04 00023 g001
Figure 2. Pre-test SEM image and EDS mapping of cross-section of uncoated fibers (a) F101, (b) F102, (c) F103, (d) F105-1, (e) F105-2, (f) F106.
Cmd 04 00023 g002
Figure 3. Optical microscope image of pre-test gold fibers prepared (a) as-is, (b) cleaved-end, and (c) re-coated ends.
Cmd 04 00023 g003
Figure 4. Experimental setup for fibers in steam test.
Cmd 04 00023 g004
Figure 5. Schematic diagram of fiber corrosion test experimental setup for (a) LBE and (b) molten salt environments.
Cmd 04 00023 g005
Figure 6. BSE images of fiber exposed to steam at 1200 °C (a) F101, (b) F102, (c) F103, (d) F105-1, (e) F105-2, and (f) F106 after 24 h.
Cmd 04 00023 g006
Figure 7. EDS cross-section mapping of (a) F101, (b) F102, (c) F103, (d) F105-1, (e) F105-2, and (f) F106 exposed in steam at 1200 °C after 24 h.
Cmd 04 00023 g007
Figure 8. (a) SE and (b) BSE images showing oxidized salt fully cover fiber optic F103 immersed in MgCl2-KCl-NaCl after 24 h at 700 °C.
Cmd 04 00023 g008
Figure 9. EDS cross-section mapping showing fiber optic F103 immersed in MgCl2-KCl-NaCl after 24 h at 700 °C.
Cmd 04 00023 g009
Figure 10. BSE images comparison of fiber exposed to LBE (a) F101, (b) F102, (c) F103, (d) F105-1, (e) F105-2, and (f) F106 for 24 h (top) and 168 h (bottom) at 600 °C.
Cmd 04 00023 g010
Figure 11. EDS cross-section mapping of (a) F101, (b) F102, (c) F103, (d) F105-1, (e) F105-2, and (f) F106 exposed in LBE after 24 h at 600 °C.
Cmd 04 00023 g011
Figure 12. EDS cross-section mapping of (a) F101, (b) F102, (c) F103, (d) F105-1, (e) F105-2, and (f) F106 exposed in LBE after 168 h at 600 °C.
Cmd 04 00023 g012
Figure 13. Images were taken periodically for gold-coated fibers in FLiNaK for a duration of 7 days and post-test fiber condition.
Cmd 04 00023 g013
Figure 14. Pre-test sample gold-coated fiber for stripped and cleaved before receiving a gold coating via vapor deposition examined under SEM with EDS mapping.
Cmd 04 00023 g014
Figure 15. BSE images of (a) Specimen 1, (b) Specimen 2, (c) Specimen 3, (d) Specimen 4, (e) Specimen 5, (f) Specimen 6, (g) Specimen 7, (h) Specimen 8, and (i) Specimen 9 exposed to LBE at 600 °C for 7 days.
Cmd 04 00023 g015
Figure 16. EDS cross-sectional mapping of (a) Specimen 1, (b) Specimen 2, (c) Specimen 3, (d) Specimen 4, and (e) Specimen 5 exposed to LBE at 600 °C for 7 days.
Cmd 04 00023 g016
Figure 17. A comparison of (a) raw and (b) gold-coated fibers in LBE at 600 °C showing that gold coating has no effect on SiO₂ fibers.
Cmd 04 00023 g017
Figure 18. BSE image of LBE at 600 °C found in between gold coating and fiber.
Cmd 04 00023 g018
Table 1. Experiment conditions for fibers.
EnvironmentTemperature (°C)Test Duration (h)
Steam120024
FLiNaK75024, 168
MgCl₂-NaCl-KCl70024
LBE60024, 168
PWR30024
Table 2. Compositions of uncoated raw fibers.
This Work IDSupplierWeight Percentage (wt%)
NameIDSiO2FGe (Core)
F 101FujikuraRRSMFB97.806-2.194---
F 102DrakaBB-elite 150C HTA99.911±0.0080.063±0.0010.026±0.001
F 103FujikuraRRSMFA98.606-1.394---
F 105-1DrakaSRH SM DLPC999.646±0.020.354±0.02--
F 105-2DrakaSuper RadHard SM 15PC:12/0099.646±0.020.354±0.02--
F 106DrakaSMF G652 DLPC9 PC:269/0099.974±0.0010.000-0.026±0.001
Table 3. Composition and details of gold-coated fibers.
SupplierAMS Technologies
Supplier IDASI9.0/125/155G
Core MaterialGeO2 doped SiO2
Core Diameter (µm)9.0 ± 0.5
Cladding MaterialSiO2
Cladding Diameter (µm)125 + 1/−3
Coating MaterialGold
With Coating Diameter (µm)155 ± 16
Table 4. ICP-MS results of fiber F103 in PWR primary after 168 h at 300 °C and 2200 psig.
DescriptionConcentration (ppb)
Pre-test Si723.8 ± 36
Post-test Si4301.2 ± 215
Difference between Post-test and Pre-test3577.4 ± 179
Expected Si concentration if fiber completely dissolved6245
Disclaimer/Publisher’s Note: The statements, opinions and data contained in all publications are solely those of the individual author(s) and contributor(s) and not of MDPI and/or the editor(s). MDPI and/or the editor(s) disclaim responsibility for any injury to people or property resulting from any ideas, methods, instructions or products referred to in the content.

