Abstract
Friction stir welded (FSW) aluminum–magnesium lightweight vehicle joints have gained significant interest due to their high strength-to-weight ratio. In this work, the corrosion resistance of this material is analyzed through electrochemical tests, which include open circuit potential (OCP) inspection and potentiodynamic polarization (PD) scanning. Weight loss measurements tested the corrosion rate of the FSW weld through cyclic corrosion testing (CCT) according to the standard SAEJ 2334. Mechanical properties were also investigated, including lap-shear strength, micro- and nano-hardness mapping, and true stress–strain curves as a function of local processing history. The electrochemical results indicate that the center weld zone’s corrosion property stays between the two base alloys. Indentation-based testing demonstrated that the weld zone behaves differently from base alloys. Lap shear strength surprisingly did not drop much even after eight weeks of cyclic corrosion tests, indicating that the joint did not allow any ingress of the electrolyte.
1. Introduction
The growing need for lighter structural automotive components is becoming essential for reducing overall energy consumption and environmental contamination of transportation, with the primary benefit being improved fuel economy due to reduced vehicle mass [1]. It is reported that magnesium (Mg) alloys are approximately 75% lighter than steel and 33% lighter than aluminum (Al) alloys because of their lower density [2]. Additionally, Al alloys are considered to have high corrosion and creep resistance, whereas Mg alloys are usually reported to have higher damping capacity [3]. Therefore, if Al-Mg dissimilar alloy joints can replace some traditional steel parts, the weight will be significantly reduced [4]. Furthermore, these lighter materials are expected to significantly improve fuel economy through a reduction in vehicle mass [5]. Usually, traditional welding joints, such as fusion welding between magnesium and aluminum, tend to be problematic because of the issues of bonding welds with different high-temperature flow characterizations, as well as their overall heterogeneity [3,6], which can result in defects, voids, and brittle intermetallic compounds at the interfaces between the two alloys [7]. Nevertheless, with optimized welding tool geometry, rotation and speed, good microstructure stability, high tensile strength, and ductility, better intermixing can be achieved with friction stir welding (FSW) of Al-Mg joints [8]. Over the last decade, this FSW technique has been widely reported with various dissimilar alloys [8,9,10,11].
FSW has successfully been demonstrated in the solid–state joining process as one of the mechanical interlocking methods that can be applied to sample boundaries during the welding process [2]. The FSW process is based on the heat produced by plunging the rotating weld tool with a particular force into the materials to soften and form a plastically deformed zone and cause the fabrics to flow. This relatively low heat involved during joining can reduce the probability of residual stress, intermetallic layers, chemical reactions, and distortions between welded materials [10,12]. These factors make it a preferred welding process compared to fusion welding. According to the published papers, FSW has been extensively applied for welding Al and Mg alloys to investigate the effect of welding tools, travel speed, lap configuration, etc., on the formation of intermetallic compounds (IMCs) [8,10,13,14,15,16].
Because two dissimilar bonded alloys can have severe galvanic corrosion exposed in the electrolyte and the increasing worldwide applications in the automotive and aerospace industry, it requires the systematic investigation of the corrosion and mechanical properties of FSW Al-Mg welds [17]. These properties are considered crucial because this FSW Al-Mg joint is a potential option for the next generation of lightweight door hem design. Therefore, this study seeks to investigate the properties of FSW specimens between 6022Al (top) and ZEK100 Mg (bottom) in terms of their corrosion behavior and mechanical properties under a defined welding condition. The corrosion rate of the Al-Mg alloys was investigated through electrochemical tests and component weight loss at different cathode-to-anode area ratios. Furthermore, the mechanical properties of the welded alloy were also investigated with hardness mapping, true stress–strain curve by and indentation-driven method, and lap-shear strength before and after the corrosion test.
2. Materials and Methods
2.1. Sample Information
Magna International, Inc., New Troy, MI, USA, provided the automotive 6022 Al alloy and ZEK100 Mg alloy sheets used. The chemical compositions of samples were determined by Spark-OES analysis, as shown in Table 1. A single scrolled shoulder with a tri-flute pin (Figure 1a) was selected to prepare a series of lap joints. Figure 1b shows the schematic appearance of Al-Mg lap-shear joints with a 1.27 mm thick 6022 Al sheet on top and a 1.2 mm thick ZEK100 Mg sheet at the bottom. The linear welding process was carried out under a constant power input of 2.3 kW, 0.9 m/min welding speed, 1° of tilt angle, 1.8 mm of the plunge depth, and 3.5 kN axial force. This tri-flute pin with scrolled shoulder produces higher surface roughness, fewer defects, more minor hook features, and greater joint strength than other shapes of the welding tool, as reported previously [7].

Table 1.
Chemical composition of AA 6022 Al and ZEK 100 Mg (wt.%).

Figure 1.
(a) Image of the tri-flute pin with the scrolled shoulder; (b) schematic of friction stir lap welding (FSLW) Al-Mg joint.
2.2. Experimental Methodology
2.2.1. Metallographic Characterization
A Simplimet 4000 compression mounting system from Buehler, Inc., Lake Bluff, IL, USA was used to mount the FSLW Al-Mg joints. The mounted FSLW samples were polished to remove the mechanical scratches and subsequently cleaned with ethanol in an ultrasonic bath. A Tegramin-20 grinder-polisher from Struers Inc., Cleveland, OH, USA. was used to polish the specimen and achieve a mirror finish with a 0.05 µm colloidal silica suspension as the final polishing step. Before metallographic analysis, 6022 Al was etched by Keller’s reagent: 25 mL methanol, 25 mL HCl, 25 mL HNO3, and one drop HF. Meanwhile, ZEK100 Mg was etched with 10 mL acetic acid, 10 mL DI water, and 4.2 g picric acid in 100 mL ethanol. The scanning electron microscope (SEM) images and the energy dispersive spectroscopy (EDS) were obtained from the JEOL JSM-7000F SEM. Optical micrographs (OM) were obtained with a Nikon Epiphot 200 Binocular inverted microscope.
2.2.2. Electrochemical Testing
The electrochemical studies of the samples were performed by Gamry 600 potentiostat consisting of a graphite rod as the counter electrode, Ag/AgCl (with saturated KCl electrolyte) acting as the reference electrode, and the sample being used as the working electrode. Before starting the experiment, the samples were polished up to 1200 µm sized emery paper to remove the native oxide, contaminants, and scratches from the surface, which was then washed with ethanol. Next, the open circuit potential (OCP) and potentiodynamic polarization scan (PD) were conducted to study the overall corrosion resistance properties of the samples in 3.5 wt.% NaCl solution on different regions (base alloy and stir/weld zone). The exposed area of the samples was 3.14 cm2, which was fixed for each test. OCP was measured for 1 h on each sample, whereas the PD was conducted at 0.1667 mV/s according to the ASTM G-59 standard. All the experiments were performed at a room temperature of 25 ± 2 °C.
2.2.3. Cyclic Corrosion Testing (CCT)
The surface vehicle standard laboratory cyclic corrosion test method (SAEJ 2334 [18]) was selected to create an accelerated corrosion environment for the bimetallic joints, which involves 6 h of humidity mode at 60 °C, 15 min of salt spray at room temperature with a salt solution containing 0.5 wt.% of NaCl, 0.1 wt.% of CaCl2 and 0.075 wt.% of NaHCO3 (pH = 7.7), then 17.45 h of a dry process at 50 °C as a daily repetition. Eight weeks of repeated loops were conducted in CCT to determine the weight loss of samples due to corrosion. All the samples were polished with the grit 1200 emery paper, cleaned in an ultrasonic bath with ethanol, and dried in the air before analysis. Each week after the corrosion exposure, specimens were washed with a solution containing 15 wt.% CrO3 in an ultrasonic bath for five to ten minutes to remove the corrosion products from the sample surface to obtain an accurate weight loss measurement.
2.2.4. Lap-Shear Tensile Test
Lap-shear strength of the FSW joints mainly focuses on the bonding strength, especially on the interlocking hook region before and after corrosion. The lap shear strength of samples before and after corrosion was tested with an Instron 5500 tensile tester with a strain rate of 0.762 mm/min.
2.2.5. Indentation Tests
Microindentation: The Buehler Wilson VH3300, an automatic Vickers/Knoop hardness tester, was used to find the hardness distribution on the cross-section surface of the Al-Mg welds. As shown in Figure 2, the specimen has 6022 Al on top and ZEK100 Mg at the bottom. Each side has three rows and 31 columns of indents, and the averaged data of each of the three rows will be taken to ensure reliability. The various hardness values were applied in MATLAB to divide each region of the FSW zone. The indent spacing was 0.4 mm vertically and 0.8 mm horizontally. In this experiment, a Vickers indent with HV 0.3 was applied.

Figure 2.
Schematic microindentation experimental design.
Nanoindentation: As detailed in [19], the flat-punch instrumented strength and plasticity microprobe testing technique utilized herein to measure regional stress–strain curves uses a KLA iMicro Pro nanoindenter system equipped with an InForce 1000 mN actuator. The test employs a 90 deg. diamond flat-punch tip with a flat and circular apex of approximately 10 um in diameter. This method returns the yield point and true stress–strain data, as well as power law strength coefficient and strain hardening exponent, as noted below:
In addition to plasticity parameters and stress–strain curve extraction, hardness was concurrently reported using the same test data. See [20] for further background and details.
3. Results and Discussions
3.1. Sample Characterization
It is known that different welding parameters in the FSW process will have a significant effect on the phase types and distributions [21,22]. In this work, the grain size, structures, and intermetallic compounds (IMCs) from FSW under the selected welding conditions were characterized. The etched Al-Mg welded specimen, observed from diverse views, shows that the grain structure and size are very different at various locations. Figure 3 shows the optical microscopic (OM) pictures of etched 6022 Al from the top view, where Figure 3a is the advancing side with the same direction of welding and tool rotation. Figure 3b shows the retreating side with the opposite welding direction and tool rotation. Moreover, because of this difference, it can be observed that the advancing side has a better and smoother connection zone between the welding area and base Al, whereas the retreating side contains more voids and bonding gaps compared to the advancing side [23].
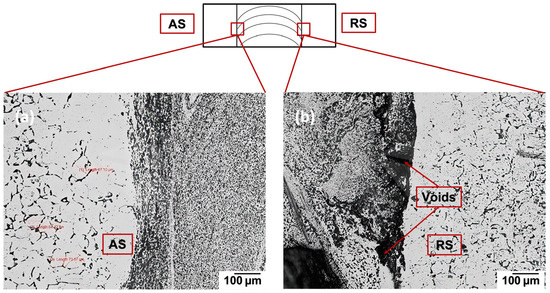
Figure 3.
Optical microscopic pictures of etched 6022 Al from the top perspective: (a) Advancing side (AS) and (b) retreating side (RS).
Figure 4 shows the grain size and structure at the cross-sectional view of the friction-stir welded 6022 Al alloy, Figure 5a under higher magnification; we could observe clearly that stirred zone (SZ) has the hardened precipitates dissolved, and the most significant amount of dynamic recrystallization process resulted from the high strain and thermal energies [24]. The surrounding thermomechanically affected zone (TMAZ) (Figure 5b) has a highly elongated grain structure caused by FSW-induced strains. In comparison, the heat-affected zone (HAZ) in Figure 5c refers to the region where the grains only experience thermally mediated recrystallization and grain refinement and, therefore, no mechanically plastic deformation [25]. In this case, we can observe the lower density of precipitates in SZ, TMAZ, and HAZ compared to base Al (Figure 5d) during the recrystallization process. The bottom of the ZEK100 Mg alloy also shows a similar grain distribution in that the center stirred region (Figure 6b) has a very clearly reduced grain size (~1 mm) while the surrounding base Mg (Figure 6a) has no evident FSW influence showing its original heterogeneous grain structure.
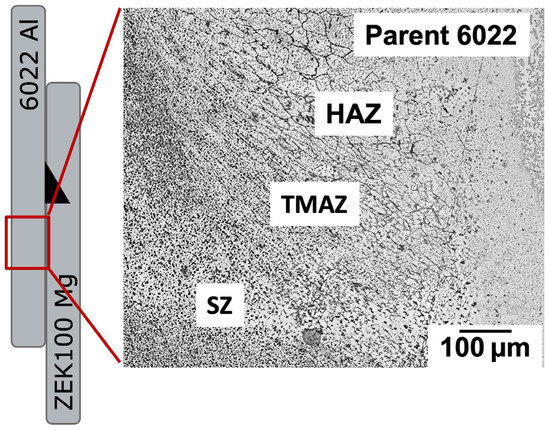
Figure 4.
Microscopic pictures of etched 6022 Al from a cross-sectional perspective shows distinguished zones.
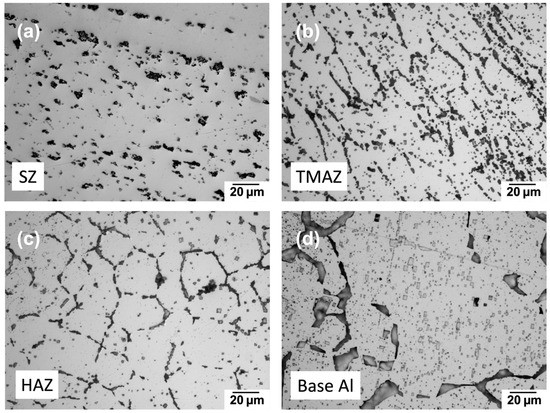
Figure 5.
Optical microscopic pictures of a grain structure on etched 6022 Al from a cross-sectional perspective: (a) Stirred zone; (b) thermomechanically affected zone; (c) heat-affected zone; (d) base 6022 Al.
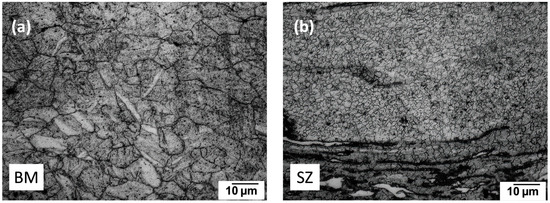
Figure 6.
Optical microscopic pictures of grain structure at 100× magnification on etched bottom ZEK100 Mg from the cross-sectional perspective: (a) Base metal; (b) stirred zone.
It is widely reported that there are usually two types of commonly observed intermetallic layers: The Al side has been identified as b-Al3Mg2 and the Mg side as a eutectic consisting of g-Al12Mg17 and the Mg-rich phase [26,27]. Determining the type of IMCs can happen between 6022 Al and ZEK100 Mg and also can make a comparison with the FSW joint; a diffusion-bonded Al-Mg weld was made under 390 °C and 2 h. As a result, two layers of IMCs: Al12Mg17 at the Mg side (IMC width ~25 μm) and Al3Mg2 at the Al side (IMC width ~65 μm) were observed and characterized by SEM micrograph, as shown in Figure 7a. The EDS elemental mapping spectra of Mg and Al is shown in Figure 7b and Figure 7c, respectively. Table 2 lists the EDS line scan results, identifying the two distinct intermetallic layers with their atomic weight percentage. By contrast, the FSW weld at the interfacial bonding region between 6022 Al and ZEK100 Mg in Figure 8a shows a formless division of the intermetallic layers due to the mechanical intermixing effect. Therefore, selected regions numbered with green boxes were performed using quantitative EDS mapping, and the results for b-Al3Mg2 and g-Al12Mg17 IMCs are listed in Table 3, which match the XRD results in Figure 8b.

Figure 7.
(a) SEM-SE image of diffusion bonded 6022 Al and ZEK100 Mg; (b) Mg and (c) Al are the respective EDS mapping of (a), which shows two intermetallic layers.

Table 2.
Index of EDS line-scan results from Figure 7a.
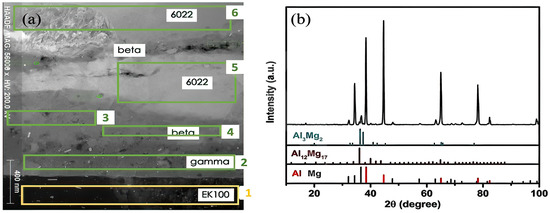
Figure 8.
(a) STEM ZC micrograph of the interfacial layer between FSW 6022 Al and ZEK100 Mg; (b) XRD analysis that shows evidence of IMCs.

Table 3.
Index of quantitative EDS results.
This finding backed up the result that solid–state welding processes, such as FSW or diffusion bonding (DB), are still susceptible to forming brittle Al-Mg IMCs from the liquid solidification process [28]. However, the FSW Al-Mg specimen contains much thinner intermetallic layers around the nanoscale, as shown in Figure 8a, where the scale bar is 400 nm compared to the diffusion-bonded Al-Mg. Based on the eutectic reaction: Liquid Al12Mg17 + Mg (437 °C). This dramatically reduced the number and concentration of IMCs due to the lower welding temperature (350–370 °C) and much shorter welding time (FSW weld speed 0.9 m/min). IMCs are usually grown with increasing duration time and amount of welding heat input [29,30], which makes FSW a preferred welding process, as compared to diffusion bond because fewer brittle IMC layers can reduce the formation of cracks in the intermixing region on IMC layers, as it can also be observed in Figure 7a.
Considering the identification of γ-Al12Mg17 and β-Al3Mg2 IMCs presented above, data-driven nanomechanical property mapping, clustering analysis, and feature deconvolution were applied to the interfacial regions of relevance. As shown in Figure 9 below, the severely plastically deformed edge of the nugget zone was analyzed via nanomechanical mapping testing protocols with a KLA Instruments iMicro nanoindenter, such that mechanical properties micrographs and large datasets with high-resolution positioning were able to be captured at a rate of 1 indent per second, wherein a target load of 0.6 mN was applied, and a 100 um by 100 um region with 10,000 nanoindentation data points was able to be captured. The said mechanical property map is shown in (a) and imposed to scale upon a digital micrograph of the region prior to indentation testing in (b). K-means clustering was applied to the dataset presented visually in (a) to identify the IMC layer specific hardness relative to the surrounding nugget zone matrix (c). The modulus of elasticity values vs. hardness values for all 10,000 data points presented in (a–c) are plotted as the y-axis and x-axis shown in (d). For further details surrounding nanomechanical property mapping and data analysis (in terms of both theory and practice), please see [31].
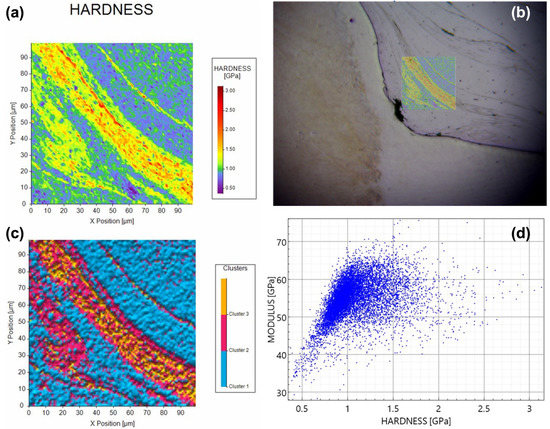
Figure 9.
(a) Nanomechanical property map or contour plot wherein the range of values obtained are visually depicted using a color-coded legend for hardness values. (b) Imposition of (a) onto the region tested to obtain (a,c,d). (c) K-means clustering analyzed and replotted form of (a), wherein three centroids were assumed. (d) Modulus vs. hardness for each of the 10,000 data points underwriting the nanomechanical mapping-based analysis presented.
3.2. Electrochemical Testing
Figure 10a shows the open circuit potential results of 6022 Al and ZEK100 Mg alloys exposed into 3.5 wt.% NaCl solution for 3600 s. The 6022 Al alloy exhibited the highest OCP value; in contrast, the ZEK100 Mg alloy shows lower potential, which means increased corrosion activity because Mg is galvanically more active than Al and is the most active of engineering materials [32,33]. Moreover, 6022 Al alloy shifted its OCP from −0.76 V to around −0.69 V vs. Ag/AgCl after 600 s of immersion and stabilized the OCP at around −0.70 V for the rest of the time. In the case of ZEK100 Mg, it increased from −1.48 V to −1.44 V after 600 s and then stabilized at around −1.43 V. The initial rising behavior in 6022 Al and ZEK100 Mg can be attributed to forming a passive film over the surface during immersion time. However, due to the intermixing process by stir welding, it is not surprising to observe that the weld zones (WZ) of 6022Al and WZ of ZEK100 Mg have very close OCP values and more adjacent to ZEK100 Mg (Al WZ: −1.49 V to −1.44 V, Mg WZ: −1.50 V to −1.48 V). This indicates that in the FSW process, the overlapping region of the top Al alloy could be mixed with the bottom Mg alloy to form a layer where they could have quite similar electrochemical behaviors.
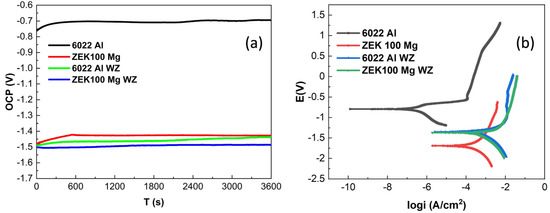
Figure 10.
(a) OCP plots (vs. Ag/AgCl) for 6022 Al and ZEK100 Mg and their weld zone (WZ), respectively; (b) potentiodynamic plots on 6022 Al ZEK100 Mg and their welding zone, respectively.
The potentiodynamic scan of 6022 Al, ZEK100 Mg, and their weld zones, respectively, are shown in Figure 10b. The current density (icorr) of 6022 Al alloys is lower than ZEK100 Mg, whereas two weld zone materials show the highest current density. The anodic current density of ZEK100 Mg is dramatically increased from corrosion potential. Alternatively, Al alloy shows the trans passive region around −0.55 to 0.50 V vs. Ag/AgCl, which infers the formation of part of a passive film during anodic scanning. The higher cathodic current density of Mg alloy is attributed to the presence of Mg, where oxygen reduction is dominant. The Ecorr and icorr on these different regions are calculated by fitting potentiodynamic polarization plots in the Tafel regions. Table 4 summarizes the electrochemical parameters of these two base alloys and their welding area. Ecorr value located between in the order of BM-ZEK Mg < Mg WZ ≅ Al WZ < BM-6022 Al, which shows similar results with the OCP test in Figure 9a. icorr; by contrast, materials from the welding region are behaving with a higher current density than the base metal, which could contribute to the mixing of two distinguished materials and could provide higher galvanic corrosion rate in these areas [34].

Table 4.
Parameters from potentiodynamic polarization scan.
The results from OCP and potentiodynamic scans confirm that for this kind of friction stir lap welded joints their very adjacent Ecorr and higher icorr make these regions more likely as an entirely new material, which has different properties from both of their parent alloys. The intermixing process from friction and rotation movement makes top Al alloy and bottom Mg alloy penetrate and diffuse into a mutual zone with similar electrochemical properties as new material.
3.3. Cyclic Corrosion Testing (CCT)
Figure 11 represents the weight loss rate for two groups of FSW samples with two different cathode-to-anode area ratios, tested for eight weeks. The results showed that at the initial two weeks, a larger cathode area was associated with a slightly higher corrosion rate than a smaller cathode area. This result matches the reported conclusion of the area effect in galvanic corrosion: For a given bimetallic corrosion system, a larger cathode or smaller anode means having a higher current density on the anode and, therefore, a greater corrosion rate [35]. However, after two weeks, the area effect gradually reduced because of the passivation behavior of aluminum alloy, which eliminates the cathodic area effect. It is found that at the initial corrosion stage there will form a thin Mg (OH)2 film [36] based on Equations (2)–(4) during corrosion. However, when Cl- exists, this film is quickly attacked and penetrated by Cl ions and then forms a porous structure, as shown in Figure 12a (corroded for one week in the corrosion chamber). The initial pitting corrosion was usually caused by aggressive anions corresponding to a critical potential where the adsorption capacity of chloride ions is stronger than that of oxygen atoms or water molecules [37,38]. Moreover, the aggressive anions can propagate into the tiny pores, making the breakdown potential even more negative.
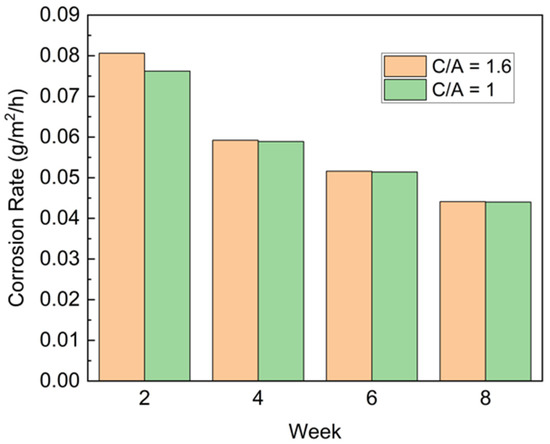
Figure 11.
Corrosion rate in weight loss vs. cathode: anode area ratio index.
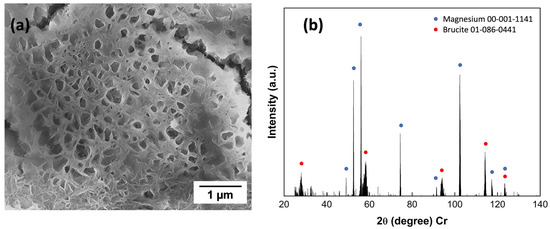
Figure 12.
(a) SEM images on ZEK100 Mg side of micro-pits within grains; (b) XRD result of the corrosion product.
With continued corrosion under cyclic conditions, the film can thicken, and cracks will appear. Within the cracks, water vapor condenses, and corrosive gases will be absorbed. These cracks provide a diffusion path for corrosive ions into the matrix, forming severe local corrosion at the early stage. Another result that can be observed from Figure 11 is the gradually decreased corrosion rate occurs biweekly. Magnesium corrosion products, for example, brucite from Equation (4) and XRD result in Figure 12b, are likely to have a repassivation effect, which could decelerate the corrosion rate before the film was attacked by the aggressive ions.
To understand the mechanism of corrosion attack on the ZEK100 Mg side, another FSW specimen was prepared and immersed into 0.1 M NaCl salt solution for 1 h. Figure 13 is the cross-sectional view of the X-ray element mappings from the FIB-lifted corrosion filament on ZEK100 Mg. Directly below the filament, the elements of Mg, Cl, O, Zn, and Zr highlight specific details on the oxide material in the filament region. Interestingly, the filament has a gradient of oxygen, a higher oxygen content at the base, and it decreases as it moves toward the upper surface. However, Mg shows an opposite gradient behavior compared to O, which indicates the adsorption behavior of O and the consumption of Mg. It is also interesting to note that Cl ions accumulate only in the base of the filament, which backs up the explanation that Cl ions can be small enough and easily penetrate through the corroded portion into the basement of the materials and lead to degradation of the materials.

Figure 13.
STEM/EDS of the FIB lamella and corresponding X-ray maps displaying the spatial location of Mg, Cl, O, Zn, and Zr in the corrosion product of ZEK100 Mg.
3.4. Lap Shear Tensile Test
The peak strength of six groups of specimens is plotted in Figure 14, and the averaged peak strength value is summarized in Table 5. Surprisingly, the bond strength between Al and Mg did not reduce too much based on the averaged data after eight weeks of the cyclic corrosion tests. The fractured specimen was analyzed through large-area EDS mapping (Figure 15) on the inner detached area of both parts. Some corrosion is still observed because an oxygen-rich layer surrounds the center weld area on both Al and Mg alloys. (Elements Na, Cl, and Cr come from the corrosion media and the etching solution). However, it also shows that the center weld region does not have many oxygen elements (color green) compared to the surrounding area, which explains that the corrosion media could not significantly affect the weld region and the bonding strength. These findings, to some extent, could state that FSW welded specimens have a relatively tight bonding force, which is not easy to let the corrosion fog penetrate the weld zone and, therefore, have a higher corrosion resistance. Weight reduction measured from the corrosion tests would have mostly come from the WZ surrounding region and base alloy.
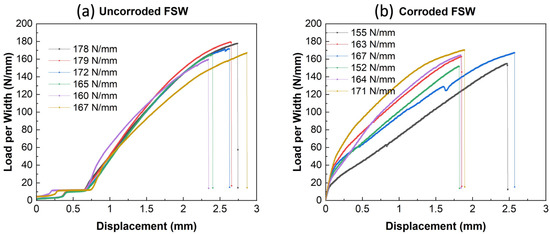
Figure 14.
Load-displacement curves of the FSW specimen: (a) Uncorroded; (b) corroded after eight weeks.

Table 5.
Summary of the peak strength. (unit: N/mm).
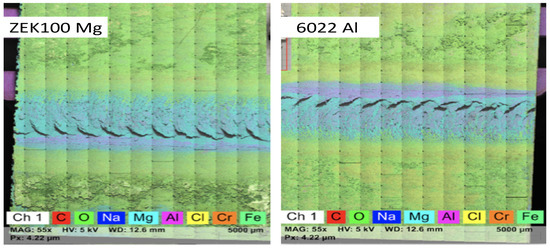
Figure 15.
Large area EDS mapping of ZEK100 Mg (left) and 6022 Al (right) on detached FSW specimens after eight weeks of cyclic corrosion testing.
3.5. Mechanical Properties through Indentation Testing
Figure 16a shows the average values of the hardness distribution map obtained by Vickers microindentation hardness tests. Figure 16b shows different zones (nugget, HAZ, hardened, base) based on the hardness values roughly identified through MATLAB-mediated visualization.
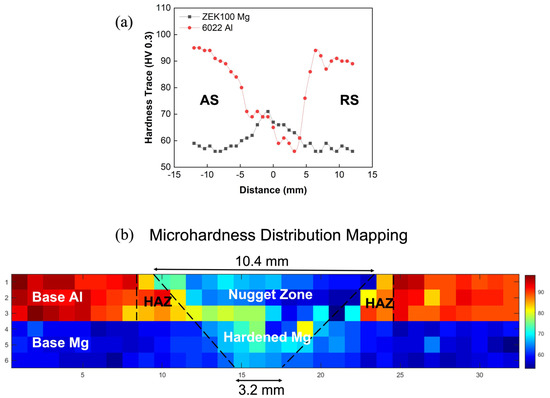
Figure 16.
(a) Averaged hardness values across the weld cross-section; (b) division of each FSW zone through hardness distribution.
The 6022 Al sample as a precipitation-hardened aluminum alloy [39] on the top showed a softened zone around the weld center, and it can be suggested that its hardness profile strongly depends on the hardened precipitation distribution instead of grain size. This softening effect in the central weld zone is caused by the dissolution and coarsening of the number of hardened precipitations [22]. By contrast, the bottom ZEK100 Mg sheet is not to be significantly affected by mechanical softening and dynamic recrystallization. Thus, it will rely more on the intermetallic layers and the grain size distribution according to the Hall–Petch relationship. As Figure 6 shows, the gradual reduction in grain size, therefore, the increased micro-hardness value from base metal to weld zone are shown in Figure 16a. Another finding from this plot is that the advancing side shown in Figure 16a appears to have a higher hardness value than the retreating side, especially on 6022 Al; this can also be observed in Figure 3, where the advancing side has a better and smoother weld connection as compared with the retreating side and where there is less continuous bonding, lack of material consolidation, and clear pores and voids.
Based on the approximate division of each zone from Figure 16b, the true stress–strain curves measured by a flat-punch instrumented strength and plasticity microprobe testing technique on each region of the FSW specimen give a similar tendency compared to their hardness values. Compared to the base Al, Al nuggets and Al HAZ exhibit lower strength because of the mechanical and thermal effects. While for magnesium, the surrounding hardened Mg region exhibits higher stress than that of the base Mg, as shown in Figure 17. These two mechanical results both indicate that for top sheet 6022 Al, the welding power and thermal effect could cause a decreased mechanical behavior. Whereas for the bottom ZEK Mg, the thermal effect could optimize the grain structure, and recrystallization could also help improve its mechanical properties.
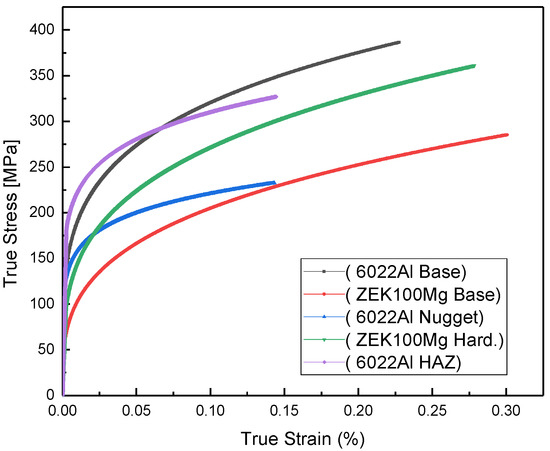
Figure 17.
True stress–strain curves from nanoindentation testing.
4. Conclusions
This study aims to provide corrosion and mechanical failure behaviors of friction stir welded (FSW) aluminum–magnesium (Al-Mg) alloy joints for the next-generation lightweight vehicle door hem materials that could significantly improve fuel efficiency and provide eco-friendly systems for sustainability requirements. This paper has mainly focused on experimentally examining the corrosion and mechanical properties of the FSW Al-Mg bimetallic joints under no protection conditions:
- Electrochemical tests indicate that this specific FSW Al-Mg joint shows a corrosion resistance in the order of BM-ZEK100 Mg ≅ Mg WZ ≅ Al WZ < BM-6022 Al and a corrosion rate in the order of BM-6022 Al < BM-ZEK100 Mg < Mg WZ ≅ Al WZ.
- Cyclic corrosion tests provide the biweekly corrosion rate through weight loss: It is found that the corrosion rate reduces with time because of the passivation effect and formation of slightly soluble products; the result also proves that at a very early stage, a larger cathode could lower the corrosion resistance to some extent. The immersion test backs up the mechanism of Cl- penetration, which causes the failure on the magnesium part.
- There is no noticeable reduction in lap shear strength before and after corrosion; the large area of EDS mapping results also indicates that the weld region has good resistance against the corrosion media because the common area is not exposed to corrosion media.
- Microindentation and nanoindentation have a similar trend on the unique region of cross-sectional FSW Al-Mg weld: 6022 Al alloy has the lowest hardness and actual stress value in the nugget zone due to the dissolution of precipitates. In contrast, the ZEK100 Mg has the highest hardness and true stress value in the center weld zone, which is attributed to grain size reduction.
Author Contributions
Q.D.: Perform the corrosion and mechanical experiments, data plot and analysis, writing original draft, review and editing. H.D. and P.U.: Process and prepare the FSW welds. B.C.S.: Application of flat-punch quasi-dynamic indentation testing for plasticity analysis of resultant zones. Application of nanomechanical mapping and analysis. Data plotting and analysis. Writing, reviewing, and editing. K.K.: Revise writing and plot hardness mapping. A.P.: Review, editing, and supervision. B.M.: Methodology, supervision, writing—review and editing. All authors have read and agreed to the published version of the manuscript.
Funding
This material is based upon work supported by the U.S. Department of Energy’s Office of Energy Efficiency and Renewable Energy (EERE) under the Award Number DE-EE0008454.
Data Availability Statement
The raw/processed data required to reproduce these findings cannot be shared at this time due to legal or ethical reasons.
Acknowledgments
The authors appreciate the material support provided by Tim Skszek, Magna; STEM/EDS data on FSW IMCs, STEM/EDS mapping on FIB filaments and large area mapping characterizations by Donovan N. Leonard from Oak Ridge National Laboratory; Rui Li from Xi’an Jiao Tong university for revising the paper. The authors also appreciate the methodological support provided by Jennifer Hay of KLA Instruments.
Conflicts of Interest
The authors declare no conflict of interest. The funders had no role in the design of the study; in the collection, analyses, or interpretation of data; in the writing of the manuscript; or in the decision to publish the results.
References
- Lee, M.; Jung, S.-H. Trends of Advanced Multi-Material Technology for Light Materials based on Aluminum. J. Weld. Join. 2016, 34, 19–25. [Google Scholar] [CrossRef]
- Wang, T.; Ramírez-Tamayo, D.; Jiang, X.; Kitsopoulos, P.; Kuang, W.; Gupta, V.; Barker, E.; Upadhyay, P. Effect of interfacial characteristics on magnesium to steel joint obtained using FAST. Mater. Des. 2020, 192, 108697. [Google Scholar] [CrossRef]
- Raval, S.K.; Judal, K. Recent Advances in Dissimilar Friction Stir Welding of Aluminum to Magnesium Alloys. Mater. Today Proc. 2020, 22, 2665–2675. [Google Scholar] [CrossRef]
- Rao, H.; Ghaffari, B.; Yuan, W.; Jordon, J.; Badarinarayan, H. Effect of process parameters on microstructure and mechanical behaviors of friction stir linear welded aluminum to magnesium. Mater. Sci. Eng. A 2016, 651, 27–36. [Google Scholar] [CrossRef]
- Karim, M.A.; Park, Y.-D. A review on welding of dissimilar metals in car body manufacturing. J. Weld. Join. 2020, 38, 8–23. [Google Scholar] [CrossRef]
- Xu, N.; Ren, Z.; Lu, Z.; Shen, J.; Song, Q.; Zhao, J.; Bao, Y. Improved microstructure and mechanical properties of friction stir-welded AZ61 Mg alloy joint. J. Mater. Res. Technol. 2022, 18, 2608–2619. [Google Scholar] [CrossRef]
- Das, H.; Upadhyay, P.; Kulkarni, S.S.; Choi, W. Dissimilar Joining of ZEK100 and AA6022 for Automotive Application. In Friction Stir Welding and Processing XI; Springer International Publishing: Berlin/Heidelberg, Germany, 2021. [Google Scholar] [CrossRef]
- Mohammadi, J.; Behnamian, Y.; Mostafaei, A.; Gerlich, A. Tool geometry, rotation and travel speeds effects on the properties of dissimilar magnesium/aluminum friction stir welded lap joints. Mater. Des. 2015, 75, 95–112. [Google Scholar] [CrossRef]
- Firouzdor, V.; Kou, S. Al-to-Mg Friction Stir Welding: Effect of Material Position, Travel Speed, and Rotation Speed. Met. Mater. Trans. A 2010, 41, 2914–2935. [Google Scholar] [CrossRef]
- Kostka, A.; Coelho, R.; dos Santos, J.; Pyzalla, A. Microstructure of friction stir welding of aluminium alloy to magnesium alloy. Scr. Mater. 2009, 60, 953–956. [Google Scholar] [CrossRef]
- Yan, J.; Xu, Z.; Li, Z.; Li, L.; Yang, S. Microstructure characteristics and performance of dissimilar welds between magnesium alloy and aluminum formed by friction stirring. Scr. Mater. 2005, 53, 585–589. [Google Scholar] [CrossRef]
- Liu, C.; Chen, D.; Bhole, S.; Cao, X.; Jahazi, M. Polishing-assisted galvanic corrosion in the dissimilar friction stir welded joint of AZ31 magnesium alloy to 2024 aluminum alloy. Mater. Charact. 2009, 60, 370–376. [Google Scholar] [CrossRef]
- Ji, S.; Li, Z.; Zhang, L.; Zhou, Z.; Chai, P. Effect of lap configuration on magnesium to aluminum friction stir lap welding assisted by external stationary shoulder. Mater. Des. 2016, 103, 160–170. [Google Scholar] [CrossRef]
- Chen, Y.; Nakata, K. Friction stir lap joining aluminum and magnesium alloys. Scr. Mater. 2008, 58, 433–436. [Google Scholar] [CrossRef]
- Fu, B.; Qin, G.; Li, F.; Meng, X.; Zhang, J.; Wu, C. Friction stir welding process of dissimilar metals of 6061-T6 aluminum alloy to AZ31B magnesium alloy. J. Mater. Process. Technol. 2014, 218, 38–47. [Google Scholar] [CrossRef]
- Dong, Z.; Song, Q.; Ai, X.; Lv, Z. Effect of joining time on intermetallic compound thickness and mechanical properties of refill friction stir spot welded dissimilar Al/Mg alloys. J. Manuf. Process. 2019, 42, 106–112. [Google Scholar] [CrossRef]
- Wang, T.; Sinha, S.; Komarasamy, M.; Shukla, S.; Williams, S.; Mishra, R.S. Ultrasonic spot welding of dissimilar Al 6022 and Al 7075 alloys. J. Mater. Process. Technol. 2019, 278, 116460. [Google Scholar] [CrossRef]
- Townsend, H.E. Laboratory Perforation Corrosion Tests of Autobody Steel Sheet; Corrosion Prevention, SP-1265; SAE: Warrendale, PA, USA, 1997; pp. 99–109. [Google Scholar] [CrossRef]
- Gleason, M.A.; Sousa, B.C.; Tsaknopoulos, K.; Grubbs, J.A.; Hay, J.; Nardi, A.; Brown, C.A.; Cote, D.L. Application of Mass Finishing for Surface Modification of Copper Cold Sprayed Material Consolidations. Materials 2022, 15, 2054. [Google Scholar] [CrossRef]
- Hay, J. Instrumented Indentation Apparatus Having Indenter Punch with Flat End Surface and Instrumented Indentation Method Using the Same. U.S. Patent 10,288,540, 14 May 2019. [Google Scholar]
- Tan, S.; Zheng, F.; Chen, J.; Han, J.; Wu, Y.; Peng, L. Effects of process parameters on microstructure and mechanical properties of friction stir lap linear welded 6061 aluminum alloy to NZ30K magnesium alloy. J. Magnes. Alloy. 2017, 5, 56–63. [Google Scholar] [CrossRef]
- Mishra, R.S.; Ma, Z. Friction stir welding and processing. Mater. Sci. Eng. R Rep. 2005, 50, 1–78. [Google Scholar] [CrossRef]
- Liang, Z.; Chen, K.; Wang, X.; Yao, J.; Yang, Q.; Zhang, L.; Shan, A. Effect of Tool Offset and Tool Rotational Speed on Enhancing Mechanical Property of Al/Mg Dissimilar FSW Joints. Met. Mater. Trans. A 2013, 44, 3721–3731. [Google Scholar] [CrossRef]
- Heidarzadeh, A.; Mironov, S.; Kaibyshev, R.; Çam, G.; Simar, A.; Gerlich, A.; Khodabakhshi, F.; Mostafaei, A.; Field, D.; Robson, J.; et al. Friction stir welding/processing of metals and alloys: A comprehensive review on microstructural evolution. Prog. Mater. Sci. 2021, 117, 100752. [Google Scholar] [CrossRef]
- Albannai, A. Review the common defects in friction stir welding. Int. J. Sci. Technol. Res. 2020, 9, 318–329. [Google Scholar]
- Sato, Y.S.; Park, S.H.C.; Michiuchi, M.; Kokawa, H. Constitutional liquation during dissimilar friction stir welding of Al and Mg alloys. Scr. Mater. 2004, 50, 1233–1236. [Google Scholar] [CrossRef]
- Somasekharan, A.; Murr, L. Microstructures in friction-stir welded dissimilar magnesium alloys and magnesium alloys to 6061-T6 aluminum alloy. Mater. Charact. 2004, 52, 49–64. [Google Scholar] [CrossRef]
- Firouzdor, V.; Kou, S. Formation of Liquid and Intermetallics in Al-to-Mg Friction Stir Welding. Met. Mater. Trans. A 2010, 41, 3238–3251. [Google Scholar] [CrossRef]
- Choi, D.H.; Ahn, B.-W.; Lee, C.-Y.; Yeon, Y.-M.; Song, K.; Jung, S.-B. Formation of intermetallic compounds in Al and Mg alloy interface during friction stir spot welding. Intermetallics 2011, 19, 125–130. [Google Scholar] [CrossRef]
- Liu, L.; Ren, D.; Liu, F. A Review of Dissimilar Welding Techniques for Magnesium Alloys to Aluminum Alloys. Materials 2014, 7, 3735–3757. [Google Scholar] [CrossRef]
- Jafarlou, D.M.; Sousa, B.C.; Gleason, M.A.; Ferguson, G.; Nardi, A.T.; Cote, D.L.; Grosse, I.R. Solid-state additive manufacturing of tantalum using high-pressure cold gas-dynamic spray. Addit. Manuf. 2021, 47, 102243. [Google Scholar] [CrossRef]
- Atrens, A.; Song, G.-L.; Cao, F.; Shi, Z.; Bowen, P.K. Advances in Mg corrosion and research suggestions. J. Magnes. Alloy. 2013, 1, 177–200. [Google Scholar] [CrossRef]
- Song, G.; Atrens, A. Understanding Magnesium Corrosion—A Framework for Improved Alloy Performance. Adv. Eng. Mater. 2003, 5, 837–858. [Google Scholar] [CrossRef]
- Lin, Y.-J.; Lin, C.-S. Galvanic corrosion behavior of friction stir welded AZ31B magnesium alloy and 6N01 aluminum alloy dissimilar joints. Corros. Sci. 2020, 180, 109203. [Google Scholar] [CrossRef]
- Song, G.L.; Atrens, A. Corrosion mechanisms of magnesium alloys. Adv. Eng. Mater. 1999, 1, 11–33. [Google Scholar] [CrossRef]
- Zeng, R.-C.; Zhang, J.; Huang, W.-J.; Dietzel, W.; Kainer, K.; Blawert, C.; Ke, W. Review of studies on corrosion of magnesium alloys. Trans. Nonferrous Met. Soc. China 2006, 16, s763–s771. [Google Scholar] [CrossRef]
- Kolotyrkin, J.M. Effects of Anions on the Dissolution Kinetics of Metals. J. Electrochem. Soc. 1961, 108, 209. [Google Scholar] [CrossRef]
- Tunold, R.; Holtan, H.; Berge, M.-B.H.; Lasson, A.; Steen-Hansen, R. The corrosion of magnesium in aqueous solution containing chloride ions. Corros. Sci. 1977, 17, 353–365. [Google Scholar] [CrossRef]
- Miao, W.; Laughlin, D. Precipitation hardening in aluminum alloy 6022. Scr. Mater. 1999, 40, 873–878. [Google Scholar] [CrossRef]
Disclaimer/Publisher’s Note: The statements, opinions and data contained in all publications are solely those of the individual author(s) and contributor(s) and not of MDPI and/or the editor(s). MDPI and/or the editor(s) disclaim responsibility for any injury to people or property resulting from any ideas, methods, instructions or products referred to in the content. |
© 2023 by the authors. Licensee MDPI, Basel, Switzerland. This article is an open access article distributed under the terms and conditions of the Creative Commons Attribution (CC BY) license (https://creativecommons.org/licenses/by/4.0/).