Abstract
The aim of this study was to investigate the oxidation kinetics of copper at low temperatures (60 °C to 100 °C) in air by isothermal thermogravimetric analysis (TGA) and quartz crystal microbalance (QCM). The weight change in thermogravimetric tests showed periodic weight increase and decrease. In thermogravimetric tests the mass of the copper sample increased until the oxidation gradually slowed down and finally started to decrease due to cracking and spalling of the oxide formed on the surface. In QCM tests using electrodeposited copper film, the weight change was rapid at the beginning but slowed to a linear relationship after few minutes. Temperature and exposure time appeared to have a large effect on oxide film thickness and composition. With QCM, oxidation at 60–80 °C produced less than 40 nm films in 10 days. Oxidation at 90–100 °C produced 40 nm thick films in a day and over 100 nm films in a week. Although SEM-EDS analyses in TGA tests indicated that oxygen was adsorbed on the copper surface, neither XRD patterns nor Raman spectroscopy measurements showed any trace of Cu2O or CuO formation on the copper surface. Electrochemical reduction analysis of oxidized massive copper samples indicated that the oxide film is mostly Cu2O, and CuO develops only after several days at 90–100 °C.
1. Introduction
Copper and copper alloys have always been of interest due to their unique properties such as thermal and electrical conductivity, ease of fabrication, and corrosion resistance [1]. These properties are needed in a wide range of applications, including automotive and transportation, electrical power, electronics, energy, and nuclear waste management [2,3,4]. In many applications copper is used at elevated temperature environments where corrosion is an extremely important issue and degrades the performance of copper. The corrosion rate, which increases with temperature, directly affects the service life of the material and could cause serious problems.
Copper oxides have potential applications in solar cells, semiconductors, gas sensors, catalysts, etc. Many researchers have studied the oxidation behavior of bulk copper metal [5,6,7,8] and copper thin films [9,10,11,12,13,14] at elevated temperatures in air. The main outcome of these studies indicated that copper oxidation products, Cu2O (cuprous oxide) and CuO (cupric oxide), are formed on the surface of copper at various temperatures and exposure times, and the growth of these oxide layers follows most frequently the parabolic law, indicating that the growth rate decreases with time and some maximum thickness range is expected.
Wan et al. [5] focused their research on the oxidation of copper in air at temperatures ranging from room temperature to 900 °C. They found that at 100–500 °C the corrosion products were flaky, and the thickness of the products varied from 50 nm at 100 °C to micro-meters at 500 °C, whereas at 800 °C they were netlike porous tissues. The initial oxidation product was Cu2O, which was converted to CuO with longer exposure. The oxidation products after 3 h at 500 °C were Cu2O and CuO. At 800 °C two layers were developed on the surface of copper; the inner layer of Cu2O and the outer layer made of Cu2O and CuO. Some of the oxidation products were also found to break away from the copper sample easily after about an hour of exposure to air, resulting in the formation of holes in the copper surface. Temperature was found to exponentially increase corrosion of copper. Honkanen et al. [6] investigated oxidation behavior of copper samples at 200 °C and 350 °C in air for 1–1100 min. At 200 °C oxide islands were observed in the surface of the copper samples and only after 1100 min oxidation was a uniform oxide layer formed, whereas at 350 °C the uniform oxide layer formed on the surface after 5 min exposure. At 200 °C and at 350 °C after 5 min oxidation the oxide structure was nano-crystalline cubic Cu2O. After oxidation for 25 and 100 min at 350 °C the crystal size of the oxide had grown, and the oxide structure was monoclinic CuO. In addition, Lee et al. [7] investigated the oxidation behavior of copper at 200 °C in air and observed fine Cu2O particles in the range 50 to 100 nm on the surface of the copper plate already after 10 min, but unlike Honkanen et al. [6], they also found a small amount of CuO after over 120 min exposure time. For oxidation at 300 °C, CuO was observed already after one minute of oxidation. The oxidized surface was composed of three layers; a 10 to 50 nm thick CuO layer, a 50 nm to several hundred nm thick Cu2O layer, and a region with decreasing oxygen content. Choudhary et al. [9] found that the initial oxidation of thin copper films started at about 150 °C, where the thermal energy overcomes the diffusion barrier of the native oxide layer, formed at room temperature, and Cu2O formation starts. However, a well-ordered crystalline Cu2O phase was observed only above 200 °C, and CuO started to appear only above 320 °C.
The low temperature oxidation kinetics of copper have also been studied by many researchers. At low temperatures, parabolic, logarithmic, inverse logarithmic, power law, and linear kinetics have been reported. According to Pinnel et al. [8], Zhong et al. [10], Ramanandan et al. [11], and Rice et al. [12], the oxidation kinetics follow the parabolic rate law, which suggests a diffusion-controlling oxidation mechanism, at temperature intervals 50–150 °C [8], 80–260 °C [10], 120–150 °C [11], and 250–350 °C [12]. According to Ramanandan et al. [11], the oxide film reached a thickness of 30 nm in tens of minutes at 140 °C and 150 °C, in an hour at 130 °C, and in a few hours at 120 °C. After that, the oxide layer did not grow further. However, linear growth of the oxide layer has also been reported. Unutulmazsoy et al. [13] studied the oxidation of Cu thin films in the temperature range of 100–450 °C and found that the formation of the CuO phase only starts after complete oxidation of Cu to Cu2O. The oxidation kinetics of Cu to Cu2O followed the linear rate law, which refers to surface reaction controlled oxidation, in the temperature range of 100–300 °C, whereas the oxidation kinetics of Cu2O to CuO seemed to be controlled by a parabolic rate law. The CuO phase was only formed at higher temperatures, T ≥ 300 °C. In addition, Derin et al. [14] reported that the formation of a Cu2O layer on the copper surface increase linearly in air at 125 °C. Roy et al. reported that oxidation follows parabolic rate law at 110–125 °C [15]. Platzmann et al. studied copper oxidation at ambient temperature for 112 days and found that the Cu2O layer growth follows inverse logarithmic law [16]. Suzuki et al. reported logarithmic rate law at 25 °C up to 106 s and Cu(I) conversion to Cu(II) with time [17]. Iijima et al. have also reported logarithmic rate law when oxide film is growing naturally and deviation from logarithmic law happened when CuO started to form on top of Cu2O [18]. Roy and Sircar reported a logarithmic law at 75 °C and 100 °C [19]. Feng et al. reported logarithmic rate law at 30 °C and 45 °C and a power law at 60 °C to 90 °C [20].
Although previous studies provide good overviews of copper oxidation, the oxidation behavior of copper at slightly elevated temperatures, below 100 °C, and long exposure times of days to weeks has attracted less attention. Nevertheless, the oxidation behavior of copper at such temperatures is an important issue in special applications, e.g., in the context of nuclear waste management. The KBS-3 concept adopted in Finland for final deposition of spent nuclear fuel uses a copper canister overpack. After loading the canister, the outer surface temperature will rise to 50 °C, to a maximum to 100 °C, depending on the internal radiogenic heat generation and ventilation conditions [4]. The development of the oxide film may influence the copper corrosion in groundwater and bentonite pore water environments [21]. The current study focuses on studying copper oxidation before the final underground deposition. Copper oxidation behavior is investigated as a function of time at 60 °C to 100 °C in air up to 25 days. The growth rate, oxide film thickness, and the oxidation mechanism are explored.
2. Materials and Methods
Oxygen-free copper plates with 99.95% purity and size 50 mm × 25 mm × 1 mm were used in the thermogravimetric experiments. The initial weight of the samples was 9.814–11.227 g. Before the experiment, the surface of copper plate was first degreased by ethanol and then immersed in 10-wt% citric acid for 3 min at room temperature. Immersion was repeated three times and after each immersion, the plate was rinsed with Millipore purified water. After the last immersion the samples were rinsed with purified water and ethanol and dried with hot air.
The oxidation kinetics were studied first by isothermal thermogravimetric measurement carried out at 60, 80, and 100 °C in air atmosphere. Before the experiment the weight of the sample was measured by a Mettler Toledo AB204-S calibrated digital balance with accuracy of ±0.0001 g (Mettler-Toledo GmbH, Greifensee, Switzerland). The sample was then connected to the balance above the furnace by platinum wire and lowered into the preheated vertical tube furnace. The weight change of the sample was continuously recorded during the experiment by a Mettler Toledo AB104-S balance. Oxidation time was approximately 47 h at 100 °C, and 7- and 23-h experiments were also performed. Temperature was measured during experiments using a calibrated S-type thermocouple (Pt/90%Pt–10%Rh Johnson Matthey Noble Metals, London, UK, accuracy of ±3 °C), which was located just below the sample and connected to a Keithley 2000 multimeter (Keithley, Solon, OH, USA). The cold junction temperature was measured with a Pt100 resistance thermometer (SKS-Group, Vantaa, Finland, tolerance class B 1/10) connected to another Keithley 2000 multimeter. To ensure the repeatability of the result, isothermal TGA analysis was conducted at least three times at each temperature.
After the experiments the samples were examined by means of scanning electron microscope (TESCAN-MIRA3, Tescan, Brno–Kohoutovice, Czech Republic) equipped with an energy dispersive spectroscope (Thermo Fisher Scientific, Waltham, MA, USA) to study the surface morphologies of the oxidized Cu-plates and to determine the elemental composition. In addition, X-ray diffraction (Philips X’Pert Pro MRD, Malvern Pananalytical, Almelo, The Netherlands) and Raman spectroscopy using WITec alpha 300 RA equipped with a 532 nm frequency doubled Nd:YAG laser (WITec Wissenschaftliche Instrumente und Technologie GmbH, Ulm, Germany) measurements were performed to distinguish the possible oxide phases on the surface of the copper plates.
In the second test series, samples were isothermally oxidized at 60 °C to 100 °C in air using a drying oven (Pol-Eko SLW 53 Smart, Pol-Eko Aparatura, Wodzisław Śląski, Poland). In this test series, the amount of oxide was determined using massive copper samples and copper oxidation rate was measured using copper deposited on a quartz crystal microbalance (QCM) crystal. One oxidation test included always seven copper samples mounted in epoxy with sample sizes of 2.7–3.4 cm2 and one electrochemically deposited QCM crystal with area of 1.37 cm2. A Stanford Research System SRS QCM200 microbalance (Stanford Research Systems, Sunnyvale, CA, USA) and 5 MHz Cr/Au crystals were used in QCM tests. In QCM measurements, 10 s time interval was used to record the mass changes. Copper was deposited in 75 g dm−3 CuSO4, 190 g dm−3 H2SO4, and 60 ppm Cl- solution using −5 mA cm−2 for 15 min. The thickness of the copper layer was 1.6 μm. Citric acid immersion and rinsing as described above were used for sample cleaning before the oxidation. The amount of oxide was determined by galvanostatic reduction using −1 mA cm−2 in nitrogen-purged 0.1 M KCl solution as described by Seo et al. [22] and Gil and Leygraf [23]. In electrochemical tests an Autolab 31 potentiostat (Metrohm Autolab B.V., Utrecht, The Netherlands) with Nova 2.1 software (Metrohm Autolab B.V., Utrecht, The Netherlands) was used. The electrochemical setup was a standard three-electrode cell with platinum counter electrode and Ag/AgCl reference electrode. The cell volume was 0.5 dm3.
3. Results
The results include weight changes measured with a thermobalance and analysis of the formed oxides. Oxidation rates were also measured using quartz crystal microbalance and oxidation rate laws were determined from these measurements. Oxide film thicknesses and compositions were determined using electrochemical reduction.
3.1. Thermobalance Experiments
Figure 1 represents the weight change of the copper plate with time during the oxidation at 60 °C, 80 °C, and 100 °C. The weight change follows the same trend at all temperatures. Initially, the mass of the copper increases until the oxidation gradually slows down, as the "oxygen-free" areas of the surface gradually decreases and the oxide layer acting as an oxygen diffusion barrier thickens. After about 5, 10, and 15 h the weight of the sample begins to decrease at 60 °C, 80 °C, and 100 °C, respectively. The weight loss is possibly due to cracking and spalling of the oxide formed on the surface of the copper. This is supported by the fact that a small amount of scale was found on the bottom of the tube furnace after the experiments. Detachment of the oxide from the surface not only results in a reduction in the samples’ weight, but also facilitates further oxygen diffusion. Therefore, the weight of samples starts increasing again. These three steps seem to follow each other over time, and such fluctuating behavior can be expected to continue for longer than 47 h. Such weight changes have not been reported in other studies, but they have been made mainly at higher temperatures and shorter exposure times in air compared to our experiments. The weight changes at 60 °C were not as large as at 80 °C and 100 °C, indicating a strong effect of temperature on the oxidation process. As the temperature increases, diffusion energy also increases, leading to a higher degree of oxidation.
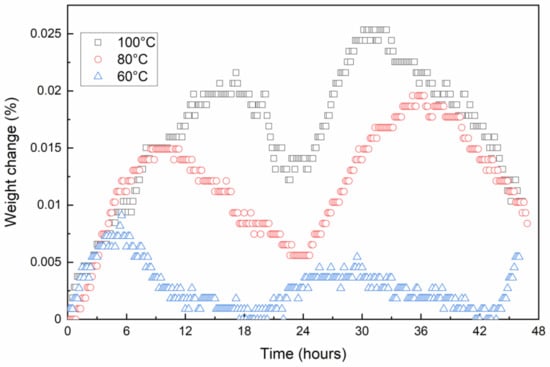
Figure 1.
Change of weight of the copper plate with time in air atmosphere at 60 °C, 80 °C, and 100 °C.
After the experiments, the surface morphologies of the copper plates were first examined visually. Oxidation at 60 °C had only little effect on the surface structure, as the surface of the copper plate was almost like that of fresh copper. At 80 °C and especially at 100 °C, light areas were observed on the surface of the copper plate (Figure 2). At 100 °C, darker areas can also be seen.
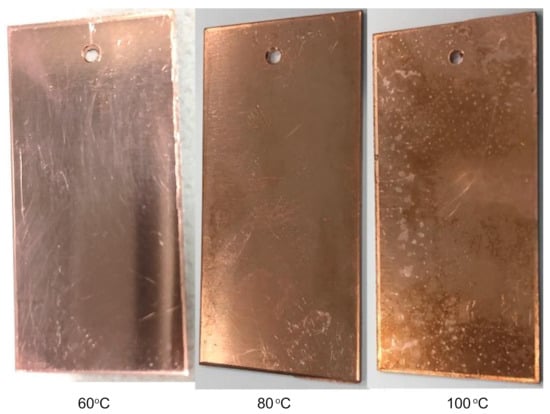
Figure 2.
Structure of the copper surface after 47 h oxidation in air at 60 °C, 80 °C, and at 100 °C.
3.2. Quartz Crystal Microbalance Experiments
Figure 3 shows the weight increase measured by QCM. Results show that at first the weight increases rapidly after which it follows a linear trend. However, the linear period is occasionally interrupted by loss of mass and therefore the weight increase rate is showing variations, such as in the test at T = 90 °C. Generally, the variations in weight change in QCM measurements were not as large as in thermobalance measurements. The reason could be that in QCM measurements the reacting material was a thin layer of electrodeposited copper that was not exposed to direct air flow as in thermobalance tube furnace.
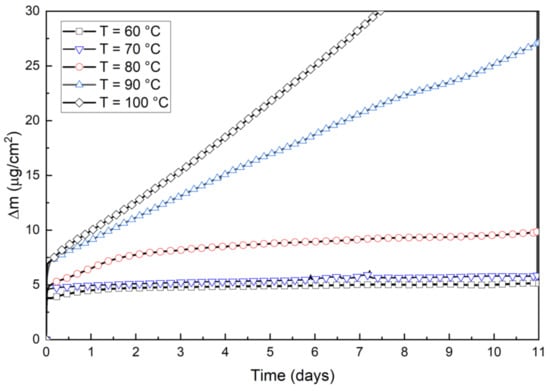
Figure 3.
Oxidation measured by copper-deposited quartz crystal.
At all temperatures there was a nearly linear period for 1–2 min. After this period, the logarithmic rate law is assumed to be applicable as the temperatures are low and oxide films are thin. Similar behavior of a short linear period followed by logarithmic growth was reported in [20]. The short linear period at the beginning was not included in the determination of oxidation mechanisms. Figure 4 shows the weight increase during the first 60 min, and Figure 5 show the plots that determine logarithmic rate constants. The logarithmic rate constant was calculated by using Equation (1):
where m is weight increase [μg cm−2], klog is logarithmic rate constant [μg cm−2 log(s−1)], t is time [s]. and Clog [μg cm−2] is the weight of the oxide at the beginning of the logarithmic growth period. The measurements at 60 °C to 80 °C follow logarithmic rate law up to 20–25 min and after that the weight increase follows linear law. The measurements at 90 °C and 100 °C follow logarithmic rate law for about 10 min but then there are changes in the weight increase and finally the weight increase follows linear law, Equation (2):
where m is weight increase [μg cm−2], klin is linear rate constant [μg cm−2 s−1], t is time [s], and Clin [μg cm−2] is the weight of the oxide at the beginning of the linear growth period.
m = klog·log(t) + Clog
m = klin·t + Clin
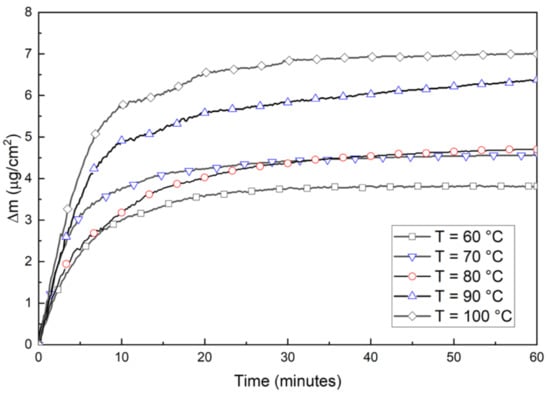
Figure 4.
Oxidation measured by copper-deposited quartz crystals for the first 60 min.
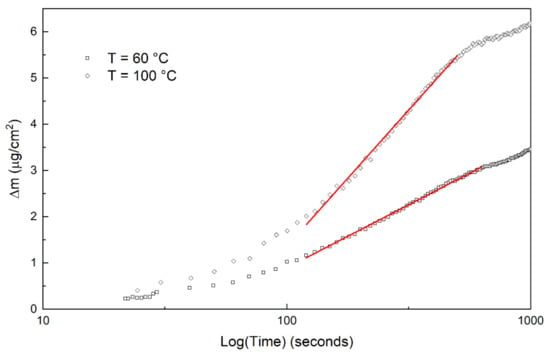
Figure 5.
Examples of determination of the logarithmic rate constants at 60 °C and 100 °C.
The amount of oxide after the initial linear period, i.e., the constant Clog in Equation (1), was estimated to 0.45–0.75 μg cm−2. The amount of oxide after the logarithmic growth period, Clin in Equation (2), was estimated to 3.5–6.2 μg cm−2. The calculated thickness of the oxide film after the initial linear period is 0.5–0.8 nm, which is slightly higher than the 0.12–0.13 nm reported in [20]. The amount of the oxide film was shown to increase with increasing temperature, as shown in Figure 6.
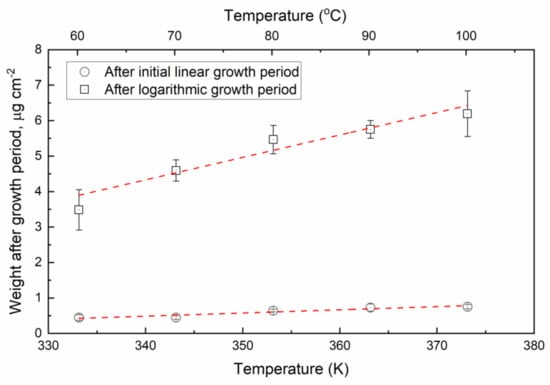
Figure 6.
Weight of the oxide after the initial linear period and after the logarithmic period as a function of temperature.
The oxidation curves measured by QCM using electrodeposited copper show the same weight increase trends as, for example, the powder samples used by Feng et al. [20]. After a short linear period, the weight increases rapidly following a logarithmic rate law, and then follows a linear rate law. The initial linear weight increase during first tens of seconds can be so small that in practice no weight change happens. Clear weight increase starts only after this short initial period following logarithmic growth law. Table 1 shows the calculated rate constants for the logarithmic growth and the main linear period after the logarithmic period. The error is calculated by using the standard deviation divided by the square root of number of replicate samples (4 or 5). The activation energies of the logarithmic and linear oxidation periods were calculated using the rate constants in Table 1. Figure 7 shows the Arrhenius plots to determine the activation energies. The activation energy of the logarithmic period was 15.9 ± 2.5 kJ mol−1 and that of the linear period was 79.4 ± 13.3 kJ mol−1. The pre-exponential factor of the logarithmic period Alog was 6.48 ± 0.89 and that of the linear period Alin was 15.79 ± 4.49.

Table 1.
Logarithmic and linear rate law coefficients determined by using QCM weight increase.
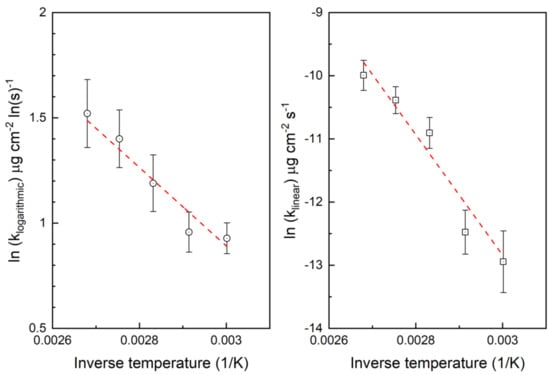
Figure 7.
Determination of the activation energies.
3.3. Electrochemical Analyses
The thickness and composition of the oxide film formed on massive copper samples and QCM crystals was determined by electrochemical reduction. The reduction of copper oxides followed the general shape shown in Figure 8. At first the sample is polarized for 10 s using 0 mA cm−2 and then the reduction current −1 mA cm−2 is switched on. At first the CuO is reduced and then Cu2O and finally the sample surface will start to evolve hydrogen gas. To determine the time ranges for reduction reactions, a first derivative of potential was calculated.
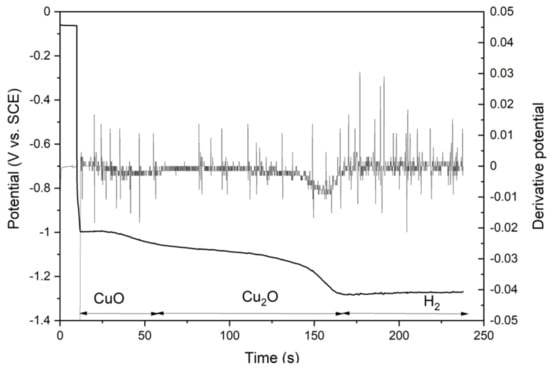
Figure 8.
Copper oxide reduction. Sample oxidized at T = 100 °C for 10 days.
The copper oxide reactions are shown in Equations (3) and (4), and both reactions require two electrons:
Cu2O + H2O + 2e− = 2Cu + 2OH−
CuO + H2O + 2e− = Cu + 2OH−
The time used in reduction of CuO or Cu2O was converted to charge by multiplying by current density −1 mA cm−2 and sample area. The reduced mass of copper oxides was then calculated using the electrochemical equivalent ekv [mg/As] = 1000·M/(z·F). The electrochemical equivalent for Cu2O was 0.7415 mg As and for CuO was 0.4122 mg As. The mass per area of Cu2O or CuO was then converted to oxide thickness using density, 6.0 g cm−3 for Cu2O and 6.315 g cm−3 for CuO. The error is calculated by using the standard deviation divided by the square root of the number of replicate samples (8). The analyses of copper oxide layers are shown in Table 2.

Table 2.
Weight changes and calculated thicknesses of oxide films at different oxidation times and temperatures.
The reduction analysis of the oxide layers show that the oxide film is mostly Cu2O. The amount of CuO is about 1–2 μg cm−2 at temperatures 60–80 °C and starts to increase at higher temperatures and longer exposure times. Analysis of the total weight increase rate μg cm−2 h−1 using data in Table 2 was done separately for tests that lasted tens of hours and tests that lasted hundreds of hours. The weight change rates of the short tests were larger than in long-term tests due to the larger relative effect of the logarithmic period with rapid weight increase. The weight increase rates for Cu2O and CuO in short-term and long-term tests are shown in Figure 9. The weight increase rate of Cu2O increases with temperature at temperatures above 80 °C. The weight increase rate of CuO increases very slowly with increasing temperature but a clear jump is seen at 100 °C in the long-term tests.
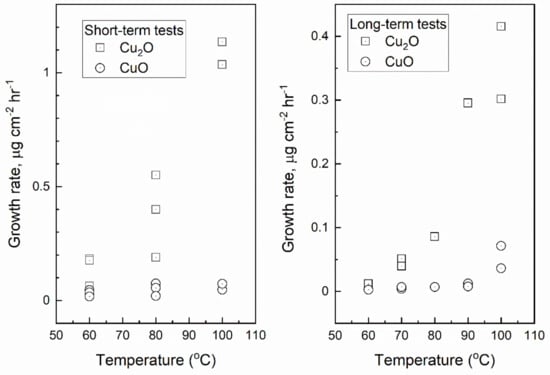
Figure 9.
Growth rate of Cu2O and CuO in the short-term (tens of hours) and long-term (hundreds of hours) oxidation tests as a function of temperature.
3.4. Morphology of the Oxide Films
To examine the surface morphologies of the Cu samples oxidized in the thermobalance experiments in more detail and to determine the elemental composition, SEM-EDS analysis were used. Figure 10 shows SEM images of copper after exposed about 47 h in air at different temperatures as well as point analyses from the sample surface.
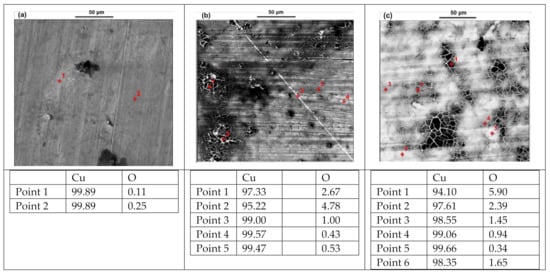
Figure 10.
SEM-EDS analyses (wt.%) of copper plates after 47 h oxidation in air at 60 °C (a), 80 °C (b), and 100 °C (c).
After oxidation at 60 °C, point analyses on the surface of the copper plate shows that it is almost pure copper. When increasing the temperature to 80 °C and especially to 100 °C, a netlike structure formed on the surface, which is probably due to cracking of the oxide film. The oxygen content of these areas seems to be higher compared to other surface areas. It appears that holes (black areas) had also formed on the surface of the sample because of spalling of some oxidation products.
To investigate the formation of the netlike structure in more detail, 7- and 23-h experiments were also performed at 100 °C. Figure 11 shows the change in microstructure over time at 100 °C. After 7 h of exposure, a small area of the netlike structure has formed on the surface of the copper plate, and as the exposure time increases, the netlike structure expands.
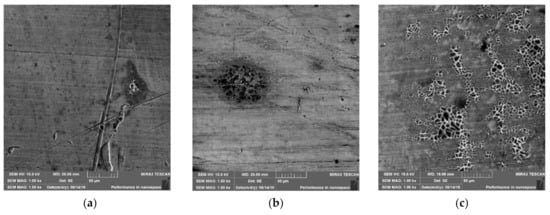
Figure 11.
SEM images taken from the surface of Cu plates after oxidation at 100 °C after 7 h (a), 23 h (b), 47 h (c).
After the SEM-EDS analyses, XRD analysis was performed to distinguish possible oxide phases on the surface of the copper plates. Because XRD is not a very surface sensitive technique and it can only detect an oxide phase after a significant amount of surface oxidation has occurred [8], Raman spectroscopy measurements were also used. Although SEM-EDS analyses indicated that oxygen was present on the copper surface, it was not enough to form detectable amounts of common copper oxides Cu2O and CuO. Neither XRD patterns nor Raman spectroscopy measurements showed Cu2O or CuO formation on the surface of the copper plates. Figure 12 shows XRD analysis of copper sample oxidized at 100 °C for 7 h. The identified peaks were peaks of copper. The unidentified peak at 2Θ = 53.4° is close to CuO (0 2 0) plane but no other CuO peaks were detected.
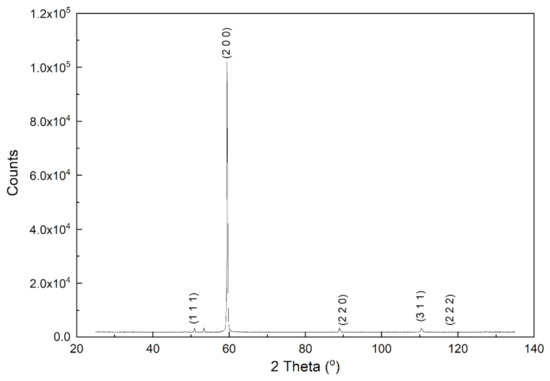
Figure 12.
XRD spectrum of copper sheet oxidized for 7 h at 100 °C.
As noted earlier, after the experiments a small amount of scale was found on the bottom of the thermobalance furnace, possibly due to spalling of the oxide formed on the surface of the copper plate. Unfortunately, no reliable analysis was obtained from the scale because the amount was too small. However, according to SEM-EDS-analyses it seems that the oxygen content of the scale is higher and copper content lower compared to measurements from the non-oxidized surface of the copper plate. This suggests that a layer with higher degree of oxidation began to crack and spall when it reached a certain thickness, exposing the less oxidized layer on the copper surface.
4. Discussion
Low-temperature oxidation of Cu to Cu2O was reported to follow linear law [13,14] or logarithmic law [18]. Oxidation of Cu2O to CuO was reported to follow parabolic [13] or logarithmic [17] rate law. The weight change results in this study with QCM indicate that oxidation at temperatures 60–100 °C follows first logarithmic rate law and after some minutes the oxidation changes to linear rate law. The weight change measured with a thermobalance shows logarithmic rate law for the first weight increase, but after the weight starts to decrease no estimates of the rate law can be done as the sample surface will no longer be homogeneous.
The oxidation of copper in air begins with formation of Cu2O, Equation (5), followed by oxidation of Cu2O to CuO (6) and reaction of CuO to Cu2O (7).
2 Cu + ½ O2 → Cu2O
Cu2O + ½ O2 → 2 CuO
Cu + CuO → Cu2O
The oxidation reactions (5)–(7) can result in an oxide film with limiting thickness of Cu2O and continuing growth of CuO [24]. The logarithmic rate law is applicable to thin oxide films at low temperatures. The oxidation rate is controlled by the movement of cations, anions, or both in the film, and the rate slows down rapidly with increasing thickness. The linear rate law occurs when the oxide layer is porous or non-continuous or when the oxide falls partly or completely away, leaving the metal for further oxidation. The varying weight change in the thermobalance measurements and surface morphologies support the claim that a non-protective oxide layer is formed. The claim that the oxide layer is not protective is confirmed by the linear increase in weight with time in the QCM measurements. The differences between TGA and QCM measurements can be explained by considering following factors. The TGA samples were made from cold-rolled Cu-OF sheet. The samples were not polished as this would result in too smooth a surface when compared to the copper canisters. The dents and scratches seen in Figure 1 and Figure 11a can act as initiation points and result in uneven oxidation. The QCM samples were made by electrodeposition. The deposited layers were thin and smooth, and no nodular growth was seen. This gives a more uniform surface compared to the thermobalance samples. The amount of oxide was larger in the thermobalance measurements than in QCM measurements. For example, in Figure 1 at T = 100 °C, the first maximum corresponds to approximately 80 μg cm−2, whereas in 22 h QCM measurements the weight increase was 23–27 μg cm−2, as shown in Table 2.
Based on Figure 6 the oxide mass after the logarithmic period can be estimated by Equation (8):
m [μg cm−2] = 0.063·T [K] − 17.12
The oxide growth during the linear period can be estimated using the temperature-dependent rate constant, Equation (9), multiplied by time [s]:
k(T) [μg cm−2 s−1] = 7.17·106·exp(−79300/RT)
The mass of oxides measured by electrochemical reduction, Table 2, is on the average about two times higher than the mass increase calculated as a sum of Equations (4) and (5). However, when copper is oxidized to copper oxides, the weight increase measured by QCM is due to incorporation of oxygen. As the mass ratio of Cu2O to oxygen is 8.94 and that of CuO is 4.97, the amount of copper oxides on the QCM crystal is higher than what its weight increase shows. The same phenomenon was documented in [23]. The mass of oxides detected by electrochemical reduction is about four times the mass measured by QCM.
The growth of the oxide film at high temperatures proceeds by formation of Cu2O that is then oxidized to CuO. Cross-cut analyses of the oxide films show two layers with Cu2O on the copper surface and CuO on top of Cu2O [25,26,27]. The oxidation at low temperatures is still not clearly understood [28]. The growth rate as well as cracking of the oxide film depend on the impurities of copper [8,29]. The use of standard laboratory air instead of purified air has resulted in 3 to 8 times thicker oxides [8]. In the experiments of the current study at low temperatures using OFHC copper with 99.95% purity and normal laboratory air, the oxide morphology showed no clear layers and a cracked surface. This can be attributed to copper and air impurities. The oxide film starts to grow as islands and later they connect forming a continuous film. This was shown by SEM analysis. The logarithmic rate law is valid at the beginning of QCM measurements and in the TGA measurements up to the first weight maximum. The linear rate law is valid in the QCM measurements where the cracking and spalling of oxides was very small or negligible. In TGA measurements the amount of oxide was larger, and cracking and spalling happened, resulting in periodic weight changes. Neither the rate laws determined by the QCM measurements nor Equations (8) and (9) are valid if oxide detachment happens.
The results of this investigation are relevant to the first stages of nuclear waste final deposition when the copper canisters start to heat in ambient air. The outer surface of the canister can reach up to 100 °C temperature and the oxide film can reach a significant thickness during the intermediate storage of weeks or months [4]. This oxide film can affect the corrosion rate of the copper canister in moist air or in immersion in ground water or bentonite clay pore water. Work is in progress on the effect of the oxide films on corrosion of copper.
5. Conclusions
The oxidation of OFHC copper in ambient air begins with logarithmic growth followed by linear growth. The logarithmic growth period results in an oxide film with a thickness of a few μm. After the logarithmic period, the oxidation follows linear law. Both oxide film thickness after the logarithmic period and oxide growth rate in the linear period increase with increasing temperature. Increase in oxide film thickness results in cracking and spalling, and when this starts the rate laws are no longer valid.
The oxide film consists mainly of Cu2O with CuO starting to form at high temperatures and long oxidation times. CuO formation was seen in QCM measurements at 90 °C and 100 °C when oxidation time was hundreds of hours. Based on TGA measurements, the oxide films started to grow as islands, and they were cracked, giving poor protection to the copper. The formation of a non-protective oxide film is supported by the linear growth in QCM measurements.
The oxidation results with QCM show that at temperatures of 70 °C and below the oxidation is low but increases with increasing temperature at 80 °C and above. Cracked and uneven oxide films that have formed at the higher temperatures can increase risk of localized corrosion. This is more likely to happen during the initial oxidizing phase of final deposition.
Author Contributions
Conceptualization, J.A. and M.K.; funding acquisition, J.A.; investigation, J.A., M.K. and M.M.; methodology, J.A. and M.K.; project administration, J.A.; resources, A.J. and M.L.; validation, J.A. and M.K.; visualization, J.A. and M.K.; writing—original draft, J.A. and M.K.; writing—review and editing, J.A., M.K., A.J. and M.L. All authors have read and agreed to the published version of the manuscript.
Funding
This research has been funded by The Ministry of Economic Affairs and Employment financed project OXCOR (The effect of oxide layer on copper corrosion in repository conditions) in the Finnish Research Programme on Nuclear Waste Management (KYT2022).
Institutional Review Board Statement
Not applicable.
Informed Consent Statement
Not applicable.
Data Availability Statement
Data available from the corresponding author upon request.
Acknowledgments
This study utilized the Academy of Finland’s RawMatTERS Finland Infrastructure (RAMI) based jointly at Aalto University, GTK, and VTT in Espoo.
Conflicts of Interest
The authors declare no conflict of interest. The funders had no role in the design of the study; in the collection, analyses, or interpretation of data; in the writing of the manuscript, or in the decision to publish the results.
References
- Davis, J.R. (Ed.) Copper and Copper Alloys; ASM International: Materials Park, OH, USA, 2001; 590p. [Google Scholar]
- Lipowsky, H.; Arpaci, E. Copper in the Automotive Industry; John Wiley & Sons: Weinheim, Germany, 2008; 177p. [Google Scholar]
- U.S. Congress, Office of Technology Assessment. Nonferrous Metals: Industry Structure Background Paper, OTA-BP-E-62; U.S. Government Printing Office: Washington DC, USA, 1990; 90p.
- King, F.; Lilja, C.; Pedersen, K.; Pitkänen, P.; Vähänen, M. An Update of the State-of-the-Art Report on the Corrosion of Copper Under Expected Conditions in a Deep Geologic Repository; Report POSIVA 2011-01; Posiva Oy: Eurajoki, Finland, 2011; 246p. [Google Scholar]
- Wan, Y.; Wang, X.; Sun, H.; Li, Y.; Zhang, K.; Wu, Y. Corrosion behavior of copper at elevated temperature. Int. J. Electrochem. Sci. 2012, 7, 7902–7914. [Google Scholar]
- Honkanen, M.; Vippola, M.; Lepisto, T. Low temperature oxidation of copper alloys—AEM and AFM characterization. J. Mater. Sci. 2007, 42, 4684–4691. [Google Scholar] [CrossRef]
- Lee, S.-K.; Hsu, H.-C.; Tuan, W.-H. Oxidation Behavior of Copper at a Temperature below 300 °C and the Methodology for Passivation. Mater. Res. 2016, 19, 51–56. [Google Scholar] [CrossRef]
- Pinnel, M.R.; Tompkins, H.G.; Heath, D.E. Oxidation of copper in controlled clean air and standard laboratory air at 50 °C to 150 °C. Appl. Surf. Sci. 1979, 2, 558–577. [Google Scholar] [CrossRef]
- Choudhary, S.; Sarma, J.V.N.; Pande, S.; Ababou-Girard, S.; Turban, P.; Lepine, B.; Gangopadhyay, S. Oxidation mechanism of thin Cu films: A gateway towards the formation of single oxide phase. AIP Adv. 2018, 8, 055114. [Google Scholar] [CrossRef]
- Zhong, C.; Jiang, Y.; Luo, Y.; Deng, B.; Zhang, I.; Li, J. Kinetics characterization of the oxidation of Cu thin films at low temperature by using sheet resistance measurement. Appl. Phys. A 2008, 90, 263–266. [Google Scholar] [CrossRef]
- Ramanandan, G.K.P.; Ramakrishnan, G.; Planken, P.C.M. Oxidation kinetics of nanoscale copper films studied by terahertz transmission spectroscopy. J. Appl. Phys. 2012, 111, 123517. [Google Scholar] [CrossRef]
- Rice, K.P.; Han, J.; Campbell, I.P.; Stoykovich, M.P. In situ Absorbance Spectroscopy for Characterizing the Low Temperature Oxidation Kinetics of Sputtered Copper Films. Oxid. Met. 2015, 83, 89–99. [Google Scholar] [CrossRef]
- Unutulmazsoy, Y.; Cancellieri, C.; Chiodi, M.; Siol, S.; Lin, L.; Jeurgens, L.P.H. In situ oxidation studies of Cu thin films: Growth kinetics and oxide phase evolution. J. Appl. Phys. 2020, 127, 065101. [Google Scholar] [CrossRef]
- Derin, H.; Kantarli, K. Optical characterization of thin thermal oxide films on copper by ellipsometry. Appl. Phys. A 2002, 75, 391–395. [Google Scholar] [CrossRef]
- Roy, S.K.; Bose, S.K.; Sircar, S.C. Pressure Dependencies of Copper Oxidation for Low and High-Temperature Parabolic Laws. Oxid. Met. 1991, 35, 1–18. [Google Scholar] [CrossRef]
- Platzman, I.; Brener, R.; Haick, H.; Tannenbaum, R. Oxidation of Polycrystalline Copper Thin Films at Ambient Conditions. J. Phys. Chem. C 2008, 112, 1101–1108. [Google Scholar] [CrossRef]
- Suzuki, S.; Ishikawa, Y.; Isshiki, M.; Waseda, Y. Native oxide layers formed on the surface of ultra high-purity iron and copper investigated by angle resolved XPS. Mater. Trans. JIM 1997, 38, 1004–1009. [Google Scholar] [CrossRef] [Green Version]
- Iijima, J.; Lim, J.-W.; Hong, S.-H.; Suzuki, S.; Mimura, K.; Isshiki, M. Native oxidation of ultra high purity Cu bulk and thin films. Appl. Surf. Sci. 2006, 253, 2825–2829. [Google Scholar] [CrossRef]
- Roy, S.K.; Sircar, S.C. A critical appraisal of the logarithmic rate law in thin-film formation during oxidation of copper and its alloys. Oxid. Met. 1981, 15, 9–20. [Google Scholar] [CrossRef]
- Feng, Z.; Marks, C.R.; Barkatt, A. Oxidation-Rate excursions during the oxidation of copper in gaseous environments at moderate temperatures. Oxid. Met. 2003, 60, 393–408. [Google Scholar] [CrossRef]
- Aromaa, J.; Chernyaev, A.; Tenitz, A.; Lundström, M. The effect of reaction product layers on copper corrosion in repository conditions. In Proceedings of the EUROCORR 2018, Krakow, Poland, 9–13 September 2018; p. 112357. [Google Scholar]
- Seo, M.; Ishikawa, Y.; Kodaira, M.; Sugimoto, A.; Nakayama, S.; Watanabe, M.; Furuya, M.; Minamitani, M.; Miyata, Y.; Nishikata, A.; et al. Cathodic reduction of the duplex oxide films formed on copper in air with high relative humidity at 60 °C. Corr. Sci. 2005, 47, 2079–2090. [Google Scholar] [CrossRef]
- Gil, H.; Leygraf, C. Quantitative In Situ Analysis of Initial Atmospheric Corrosion of Copper Induced by Acetic Acid. J. Electrochem. Soc. 2007, 154, C272–C278. [Google Scholar] [CrossRef]
- Nakayama, S.; Notoya, T.; Osakai, T. A Mechanism for the Atmospheric Corrosion of Copper Determined by Voltammetry with a Strongly Alkaline Electrolyte. J. Electrochem. Soc. 2010, 157, C289–C294. [Google Scholar] [CrossRef]
- Zhu, Y.; Mimura, K.; Isshiki, M. Oxidation Mechanism of Cu2O to CuO at 600–1050 °C. Oxid. Met. 2004, 62, 207–222. [Google Scholar] [CrossRef]
- Zhu, Y.; Mimura, K.; Lim, J.-W.; Isshiki, M.; Jiang, Q. Brief Review of Oxidation Kinetics of Copper at 350 °C to 1050 °C. Met. Mat. Trans. A 2006, 37, 1231–1237. [Google Scholar] [CrossRef]
- Han, Z.; Lu, L.; Zhang, H.W.; Yang, Z.Q.; Wang, F.H.; Lu, K. Comparison of the Oxidation Behavior of Nanocrystalline and Coarse-Grain Copper. Oxid. Met. 2005, 63, 261–275. [Google Scholar] [CrossRef]
- Gattinoni, C.; Michaelides, A. Atomistic details of oxide surfaces and surface oxidation: The example of copper and its oxides. Surf. Sci. Rep. 2015, 70, 424–447. [Google Scholar] [CrossRef] [Green Version]
- Zhu, Y.; Mimura, K.; Isshiki, M. The Effect of Impurities on the Formation of the Inner Porous Layer in the Cu2O Scale during Copper Oxidation. Oxid. Met. 2004, 61, 293–301. [Google Scholar] [CrossRef]
Publisher’s Note: MDPI stays neutral with regard to jurisdictional claims in published maps and institutional affiliations. |
© 2021 by the authors. Licensee MDPI, Basel, Switzerland. This article is an open access article distributed under the terms and conditions of the Creative Commons Attribution (CC BY) license (https://creativecommons.org/licenses/by/4.0/).