Article

Indirect Galvanostatic Pulse in Wenner Configuration: Numerical Insights into Its Physical Aspect and Its Ability to Locate Highly Corroding Areas in Macrocell Corrosion of Steel in Concrete

1
IRIS Instruments, 1 Avenue Buffon, 45100 Orléans, France
2
BRGM, 3 Avenue Claude Guillemin, CEDEX 2, 45060 Orléans, France
*
Authors to whom correspondence should be addressed.
Corros. Mater. Degrad. 2020, 1(3), 373-407; https://doi.org/10.3390/cmd1030018
Submission received: 11 November 2020 / Revised: 11 December 2020 / Accepted: 18 December 2020 / Published: 21 December 2020

Abstract

:
The use of indirect electrical techniques is gaining interest for monitoring the corrosion of steel in concrete as they do not require any connection to the rebar. In this paper, we provide insights into the physical aspects of the indirect galvanostatic pulse (GP) method in the Wenner configuration. Considering uniform corrosion, the instantaneous ohmic drop is decreased due to the presence of the rebar, which acts as a short-circuit. However, we observed that this phenomenon is independent of the electrochemical parameters of the Butler–Volmer equation. They are, however, responsible for the nonlinear decrease of the current that polarizes the rebar over time, especially for a passive rebar due to its high polarization resistance. This evolution of the resulting potential difference with time is explained by the increase of the potential difference related to concrete resistance and the global decrease of the potential difference related to the polarization resistance of the rebar. The indirect GP technique is then fundamentally different than the conventional one in three-electrode configuration, as here the steady-state potential is not only representative of polarization resistance but also of concrete resistance. Considering non-uniform corrosion, the presence of a small anodic area disturbs the current distribution in the material. This is essentially due to the different capability of anodic and cathodic areas to consume the impressed current, resulting in slowing down the evolution of the transient potential as compared to uniform corrosion. Hence, highly corroding areas have a greater effect on the transient potential than on the steady-state one. The use of this temporal evolution is thus recommended to qualitatively detect anodic areas. For the estimation of their length and position, which is one of the main current problematic issue when performing any measurement on reinforced concrete (RC) structures with conventional techniques, we suggest adjusting the probe spacing to modulate the sensitivity of the technique.

1. Introduction

Reinforced concrete (RC) is a durable material that allows the construction of safe and strong structures. Concrete has a high compressive strength and acts as a protective barrier to the steel reinforcement bar (rebar), which provides tensile strength and ductility to the structures. However, RC degrades over time, the main cause being corrosion of the steel rebars [1,2]. This is an electrochemical process that involves the anodic oxidation of iron and, generally, the cathodic reduction of oxygen, whereby the concrete pore solution acts as electrolyte to close the electrical circuit. Corrosion is generally triggered by the ingress of aggressive agents—mainly CO2 and Cl—up to the rebar, which degrade the protective layer formed on steel surface in sound and alkaline concrete [2,3]. Due to the inherent heterogeneity of concrete, all transport phenomena within the material are globally non-uniform. Hence, irrespective of the depassivation mechanism, non-uniform corrosion is expected to be the main process due to local variations in environmental exposure, or to the presence of interconnected rebars with different properties [4,5,6]. The volume expansion of the corrosion products can result in concrete cracking, spalling, and delamination, which progressively decreases the performance of the structures and can lead to their collapse. To prevent such disasters, we need monitoring devices that can detect an early stage of corrosion without altering the integrity of the structures.
Due to the electrochemical nature of corrosion, several electrical methods have been developed for monitoring the corrosion rate [2]. Conventional techniques are based on a three-electrode configuration that require a connection to the rebar. They apply an external perturbation to the system for polarizing the rebar, generally close to its natural steady state, to determine a polarization resistance Rp that can be converted into corrosion current density icorr and then into corrosion rate in terms of loss of steel cross-section (generally expressed in µm year−1). The main techniques are the linear polarization resistance (LPR), the Tafel extrapolation, the galvanostatic pulse (GP) method, and the electrochemical impedance spectroscopy (EIS). All these techniques provide an accurate estimate of the corrosion rate of actively corroding rebar under laboratory conditions [7,8,9].
However, some drawbacks affect their application to RC structures. First, determining the corrosion current density from polarization resistance is still mainly based on using the Stern–Geary equation (Equation (1)):
i corr = B A × R p = β a β c ln ( 10 ) × ( β a + β c ) × 1 A × R p ,
where icorr is the corrosion current density (A m−2), B is the Stern–Geary constant (V), A is the polarized area of steel (m2), Rp is the polarization resistance (Ω), and βa and βc are the experimentally obtained anodic and cathodic Tafel constants (V), respectively. However, this equation was defined for uniform corrosion [10] and is fundamentally non applicable to non-uniform corrosion, which is expected in RC structures [11]. Recently, a new perspective has been proposed for calculating the rate of localized corrosion from GP measurements. This considers the temporal evolution of the current in anodic areas, which reduces the error related to the use of the Stern–Geary equation [12]. Thus, this technique is robust to determine the corrosion current. However, a limitation still exists and concerns the determination of the polarized area A during the measurement, as it is required for calculating the corrosion current density. Though the use of a guard ring with modulation has been proposed for confining the polarization to a known length of rebar, many studies have shown that it often fails to achieve this goal and even contributes to additional polarization of the rebar, thus compromising the measurement [13,14,15,16,17,18,19]. Finally, the main drawback of the different techniques mentioned above is the need of an electrical connection to the rebar, often requiring breakout of local parts of the concrete to make the measurement.
In the late 1990s, Monteiro et al. proposed the use of a non-destructive method involving indirect polarization of the rebar, without any connection to it, for monitoring the corrosion of steel in RC structures. This was achieved by making indirect electrochemical impedance spectroscopy (EIS) measurements in a four-electrode configuration directly on the concrete surface [20,21,22,23,24,25]. This technique applies an alternating current between two electrodes and measures the resulting potential difference between the other two electrodes, all electrodes being generally placed in Wenner configuration, i.e., with the same probe spacing between each four electrodes. It was shown that the results obtained with this configuration were qualitatively similar to those obtained using the conventional EIS technique, with a similar capacitive loop at low frequencies [26,27,28,29,30,31,32]. In addition to this indirect EIS technique, it was also proposed that an indirect GP technique can also be used to determine the corrosion rate of steel embedded in concrete using a similar four-electrode configuration [33,34]. The main difference with the EIS technique is that a direct current is applied in GP rather than an alternating current. As for the conventional GP technique in three-electrode configuration, it was proposed to use an electrical equivalent circuit (EEC) to fit the results in order to extract the values of the EEC component and then calculate the corrosion rate [20,28,30,31,34,35]. By using an appropriate EEC, Fahim et al. have obtained similar corrosion rate values when using conventional electrochemical techniques and their patented connectionless electrical pulse (CEPRA) technology, which typically apply a current in the range of 0.5 to 2 mA on concrete surface [9,35].
Despite their great practical interest, these indirect techniques have been largely ignored in recent reviews devoted to corrosion monitoring. This lack of consideration could be related to their complexity, which can hardly be elucidated only experimentally. However, in recent years, numerical simulations have gained much interest as they can provide further insight into the mechanisms of macrocell corrosion [6,36,37,38,39,40,41] and the corrosion monitoring in three-electrode [18,42] and four-electrode configurations [26,27,31,32,35,43]. For the latter case, Keddam et al. showed that the current distribution in the material is dependent upon the measurement frequency; the steel/concrete interface behaves essentially as a capacitance at high frequencies, whereas it acts mainly as an insulator at low (zero)-frequency [26,27]. Fahim et al. investigated numerically the effect of concrete resistivity, cover depth, and rebar diameter in uniform corrosion and showed that an increase in concrete resistivity, a decrease in cover depth and a decrease in rebar diameter result in an increase in the total current reaching the rebar [35].
As shown by Fahim et al., one advantage of the indirect polarization in Wenner configuration is its ability to naturally confine the polarization current to a well-defined and similar length of the rebar, irrespective of concrete resistivity, cover thickness, and rebar diameter [35,43]. Thus, it appears possible to more precisely estimate the polarized area than with the three-electrode configuration because the guard ring is not adapted, which is required for converting the corrosion current in effective corrosion rate. However, the authors did not systematically analyze the evolution of the potential response with time and did not address the sensitivity of the potential probes, which can be different than the polarized area. Alexander and Orazem have shown the ability of the indirect EIS technique to locate highly corroding areas of external post-tensioned tendons in a macrocell system using Wenner and Wenner-Schlumberger configurations [31,32]. They showed that the presence of an anodic area disturbs the signal, depending on its position relative to the monitoring device, as two distinct time constants can be observed for non-uniform corrosion, whereas only one time constant is observed in the case of uniform corrosion. This effect essentially occurs when the anode is located below one of the current-injecting electrodes. The sensitivity of the technique depends upon the length of the actively corroding area, the magnitude of corrosion rate, and the resistivity of the cement-based material [32]. However, they believe that methods based on the DC-limit response may not be adapted for detecting localized corrosion, as the value obtained at low-frequencies in non-uniform corrosion is very similar to the one observed in uniform corrosion.
The objective of this preliminary study was to provide insights into the ability of indirect GP for locating highly corroding areas in non-uniform rebar corrosion, as well as to determine the sensitivity of this technique. In this paper, we first provide experimental evidences on the ability of the technique for indirect polarization of the rebar and corrosion monitoring. We then provide numerical insights on the physical aspects of this technique, considering both uniform and non-uniform corrosion.

2. Materials and Methods

2.1. Experiments

Experiments were done on a CEM I 52.5R (Lafarge, France) mortar sample (≃55 × 34 × 13 cm3, w/c = 0.4) with one ribbed carbon steel horizontal rebar (L = 60 cm, Φ = 12 mm) embedded at a cover depth of 33 mm. The sample was air-dried cured to be more representative of conditions encountered on field. Measurements were first done on the passive rebar and after introducing Cl (C = 0.5 M) by the upper part of the sample through wetting (2 days)/drying (5 days) cycles for 3 months. The sample was then allowed to equilibrate back to the laboratory environment for 1 month, so all measurements were done in comparable conditions, at constant relative humidity (≈30–40% RH) and room temperature (≈22 °C).
A potentiostat-galvanostat (Princeton Applied Research PMC-2000, HTDS, Massy, France) was used to perform electrical measurements with VersaStudio software (version 2.59). For the indirect GP technique, a device with 10 electrodes made in stainless-steel or brass electrodes (Φi = 3 mm, Φe = 5 mm), with a probe spacing of a = 5 cm, was placed on concrete surface and parallel to the rebar (Figure 1a). A spring present in each electrode allows a good physical contact with concrete even if irregularities are present on its surface. The electrolytic contact was made with sponges wet beforehand with a highly conductive solution (0.5 M NaCl) and placed inside the probes.
Measurements were done in Wenner configuration, in which the two external probes are the current probes and the two internal probes are the potential probes. All the results represent the average value obtained by 10 consecutive measurements when the self-potential variation was small (Figure 1c). The impressed current between C1 and C2 varied between 50 and 1000 µA, while the probe spacing varies between 5 and 15 cm. It was not possible to use properly a higher sampling rate due to the presence of some filters in the potentiostat-galvanostat. Hence, the instantaneous ohmic drop was here evaluated at 0.1 s (10 Hz), so errors are expected in the calculation of the apparent concrete resistivity.
Supplementary experiments were also done and are presented in Figure S1. Measurements were done in the conventional three-electrode configuration using the GP technique to compare qualitatively the results obtained with the two techniques. A mercury/mercurous sulphate located at the center of the sample was used as reference electrode, and a stainless-steel counter electrode (55 × 10 cm2) was placed on moist sponges on the sample surface directly above the rebar. The impressed current was 10 µA between the rebar and the counter electrode. Experiments were also done with the indirect EIS technique, from 10 to ≃10−2–10−3 Hz with 10 points per decade and an AC perturbation of 200 µA, using a similar device.

2.2. Simulations

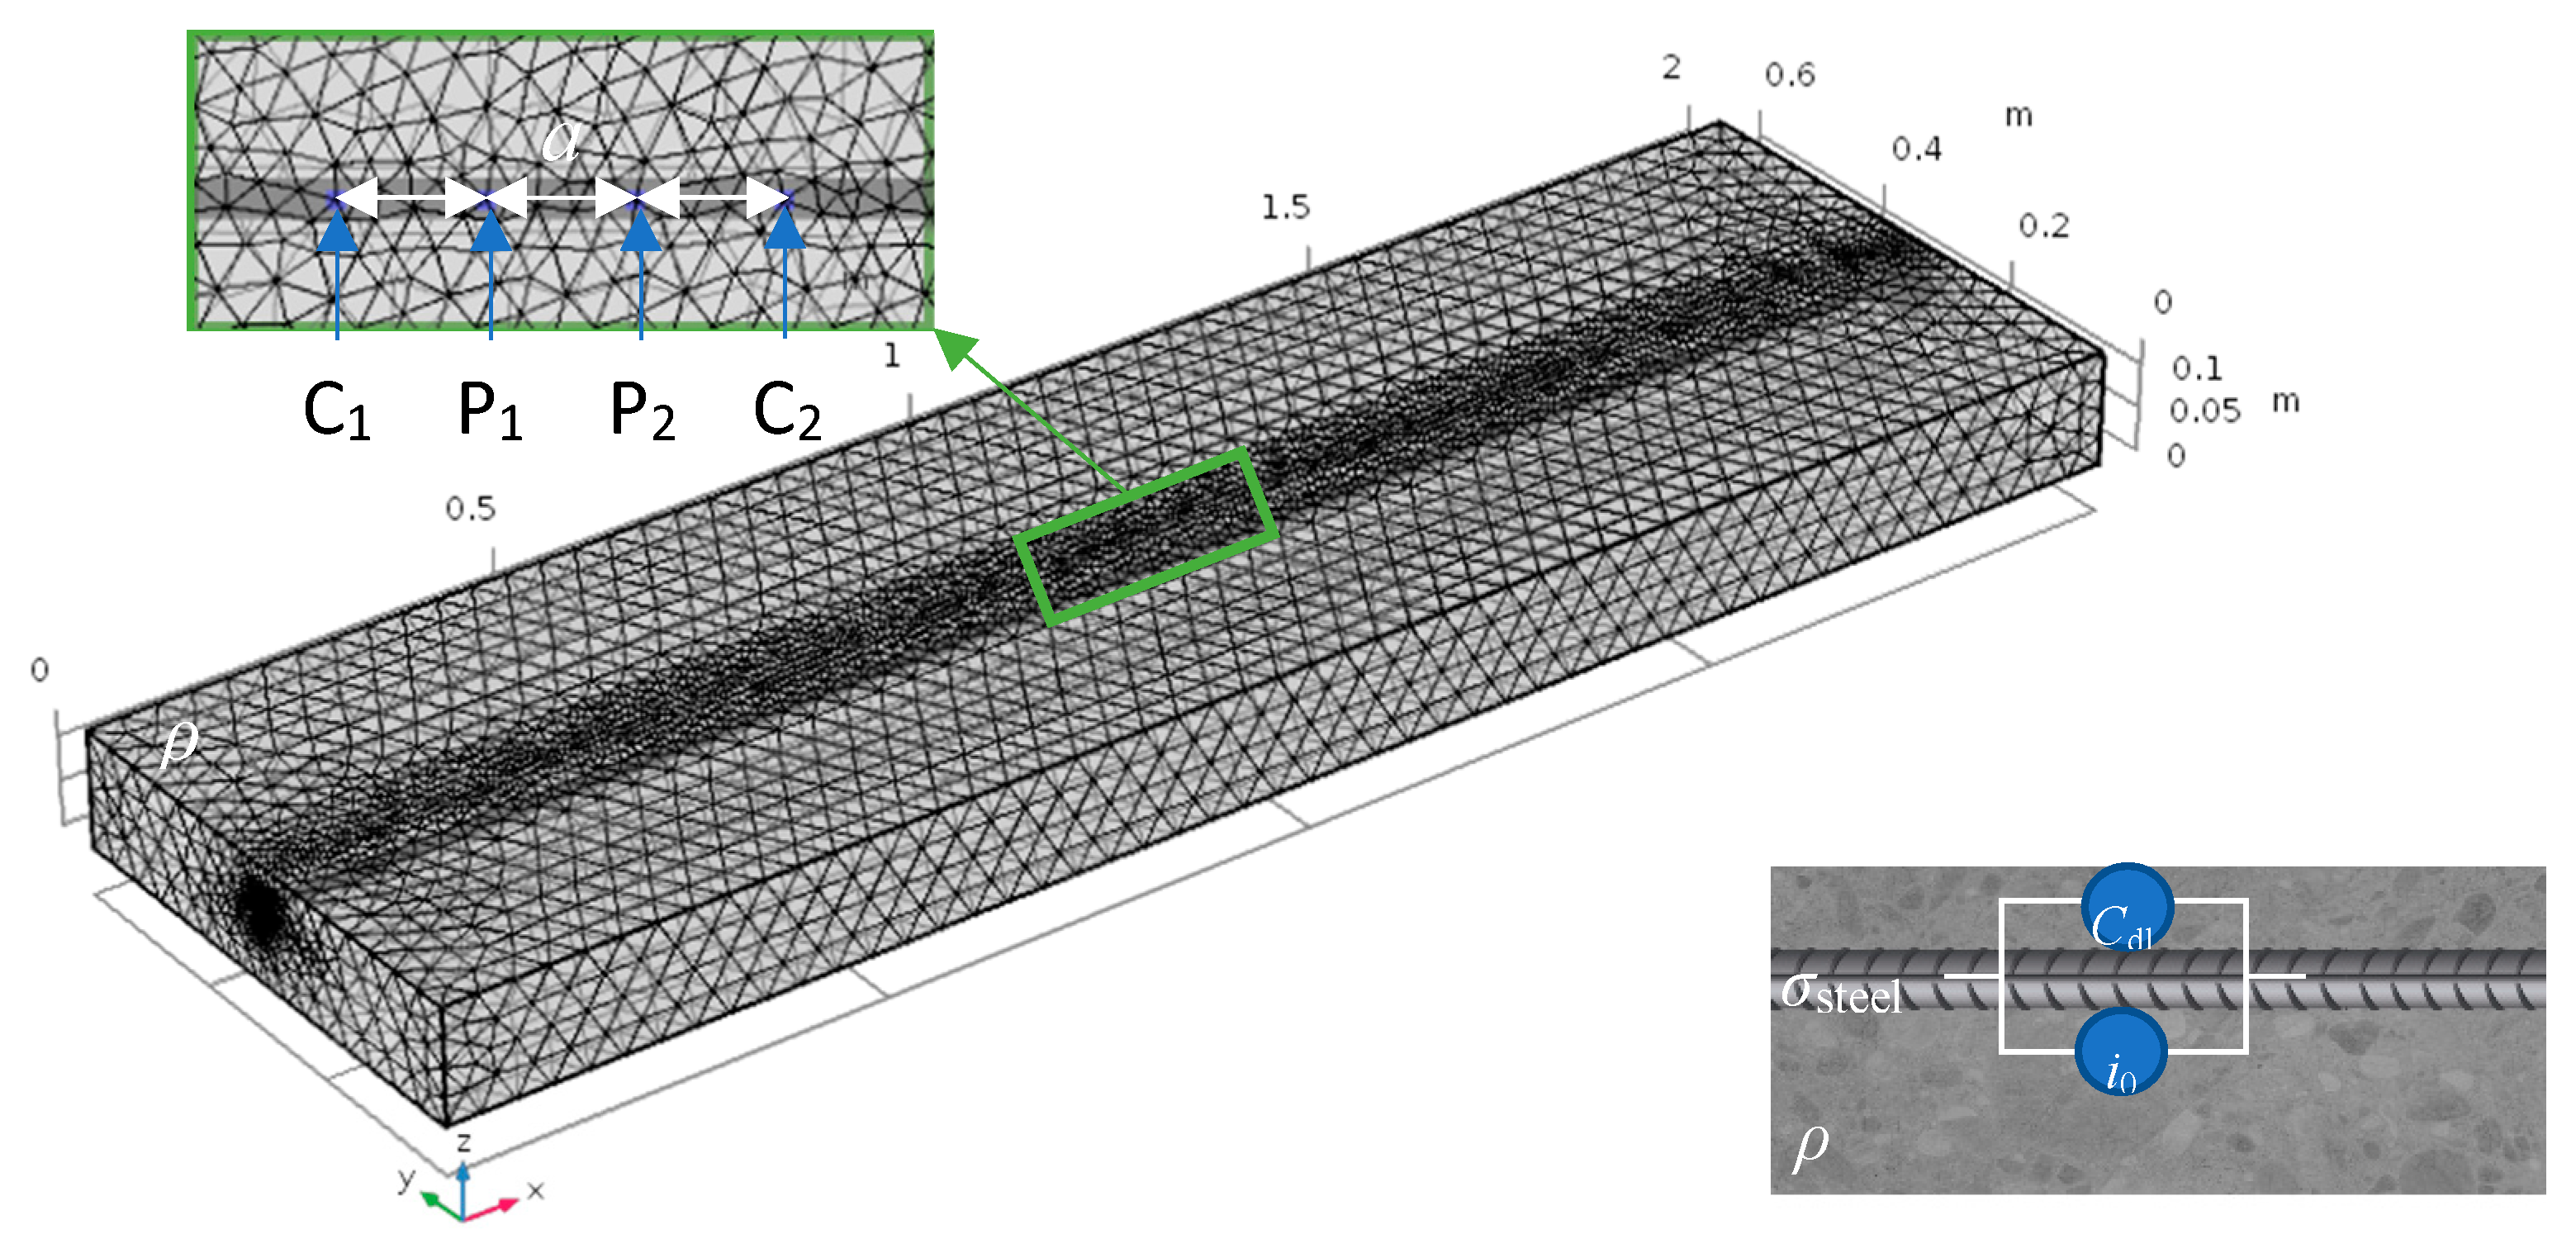
All finite-element simulations used COMSOL Multiphysics software (version 5.3). The 3D dimension of the concrete domain was 200 × 60 × 13 cm3. This length was selected in order to observe the supposed self-confinement of the current [35,43] when varying the probe spacing, which was not possible using the same size as the experimental sample. The first numerical simulations used the AC/DC module on an unreinforced specimen in order to determine the geometric factor for considering the finite size of the element. The secondary-current distribution module was then selected for modeling the distribution of the current in the entire domain (concrete and steel/concrete interface). The rebar was modeled as a 2-m carbon steel cylinder (diameter Φ = 6–25 mm, electrical conductivity σsteel ≃ 107 S m−1) centered in the xy-plane (Figure 2).
The concrete cover depth varied between 20 and 60 mm in uniform corrosion, whereas it was fixed at 40 mm in non-uniform corrosion. The concrete domain acts as the electrolyte with uniform resistivity ρ and electrical isolation at the external boundaries of the domain. Concrete resistivity varies between 100 and 1000 Ω m to consider different binder types, w/c ratios (concrete quality), and degree of water saturation [44]. If the complexity of concrete, such as its porosity or the distribution of coarse aggregates, is not considered, the concrete is commonly simplified to a resistance with the use of the Randles circuit in three-electrode configuration. Here, it is simplified as one global resistance that considers the resistance of the continuously and discontinuously connected porosity but neglects all capacitive elements of the concrete matrix [45]. This simplification is possible as the capacitive loops associated to concrete are mainly observed at high frequencies (>10 kHz), while we only focused on the low-frequency response of the steel/concrete interface when the reactance and phase shift associated to concrete are generally small (<50 mrad) [46,47].
In the concrete volume, Ohm’s law (Equation (2)) and charge conservation (Equation (3)) govern the electrical phenomena:
i = 1 ρ E ,
· i = 0 ,
where i is the local current density (A m−2), ρ is the concrete resistivity (Ω m, reciprocal of electrical conductivity σ), and E is the electrical potential (V). The corrosion reaction was modeled as a boundary condition at the steel/concrete interface using the general Butler–Volmer equation in COMSOL (Equation (4)):
i tot = i 0 { exp [ α a F R T ( E E eq ) ] exp [ α c F R T ( E E eq ) ] } ,
where i is the total current density (A m−2), i0 is the exchange current density or corrosion rate (A m−2), αa and αc are the anodic and cathodic charge transfer coefficients, respectively, F is the Faraday constant (96,485 C mol−1), R is the universal gas constant (8.314 J mol−1 K−1), T is the absolute temperature (K), E is the rebar potential (V), and Eeq is the equilibrium potential (V). Three main parameters are thus required for modeling the corrosion of steel in concrete: the exchange current density i0, the Tafel slopes (i.e., the charge transfer coefficients αa and αc, α F R T = ln ( 10 ) β ), and the rebar potential E [48,49]. The oxygen concentration was not implemented in the Butler–Volmer equation as its reduction is suspected to be the rate-determining step only when all dissolved and gaseous O2 is depleted within concrete, which occurs only after a long period under permanent saturation [50,51]. In addition, oxygen reduction is not the only possible cathodic reaction as water (or protons, depending on the pH) and rust can also act as depolarizing agents [52,53].
Simulations were first run considering uniform corrosion under active or passive conditions. A same electrochemical state was thus imposed on the entire rebar. Generally, the rebar is considered to be in passive state when i0 < 0.1 µA cm−2 (10−3 A m−2) and in active state when i0 >1 µA cm−2 (10−2 A m−2) [54]. Here, i0 was fixed at 10−5 A m−2 for the passive rebar and at 0.1 A m−2 for the active rebar. We must remember that, experimentally, the corrosion rate is highly dependent upon the water content at the steel/concrete interface [51]. Maximum values are generally observed at high relative humidity when the material is wet. For carbonation-induced corrosion, values up to 30 µm year−1 (i.e., ≃2.5 µA cm−2) are expected in outdoor exposure, even if values up to 20 µA cm−2 have been reported under laboratory conditions [55]. For chloride-induced corrosion, values can be up to 1 mm year−1 (i.e., ≃86 µA cm−2) [56]. In this study, the maximum value for the active state was set at 10 µA cm−2. Hence, higher effects than those simulated in this study are expected for highly corroding areas in wet conditions in chloride-induced corrosion.
To simulate non-uniform corrosion, two different conditions were imposed on the rebar: a small part along the entire circumference of the rebar acts as the corroding area, with the remainder acting as the passive area. Table 1 lists typical values of electrochemical parameters of the Butler–Volmer equation found in the literature for modeling non-uniform corrosion of steel in concrete. The reported parameters are quite different, especially concerning the difference in the exchange current density and in corrosion potential between anodic and cathodic sites. Here, the exchange current density of the passive area was fixed at 10−5 A m−2, while that of the active area was 10−4 A m−2 (same order of magnitude, as in References [43,44,57]), or 0.1 A m−2 (same order of magnitude as in References [18,58,59]). If these values affect any quantitative determination, they do not affect the qualitative insight obtained with numerical simulations.
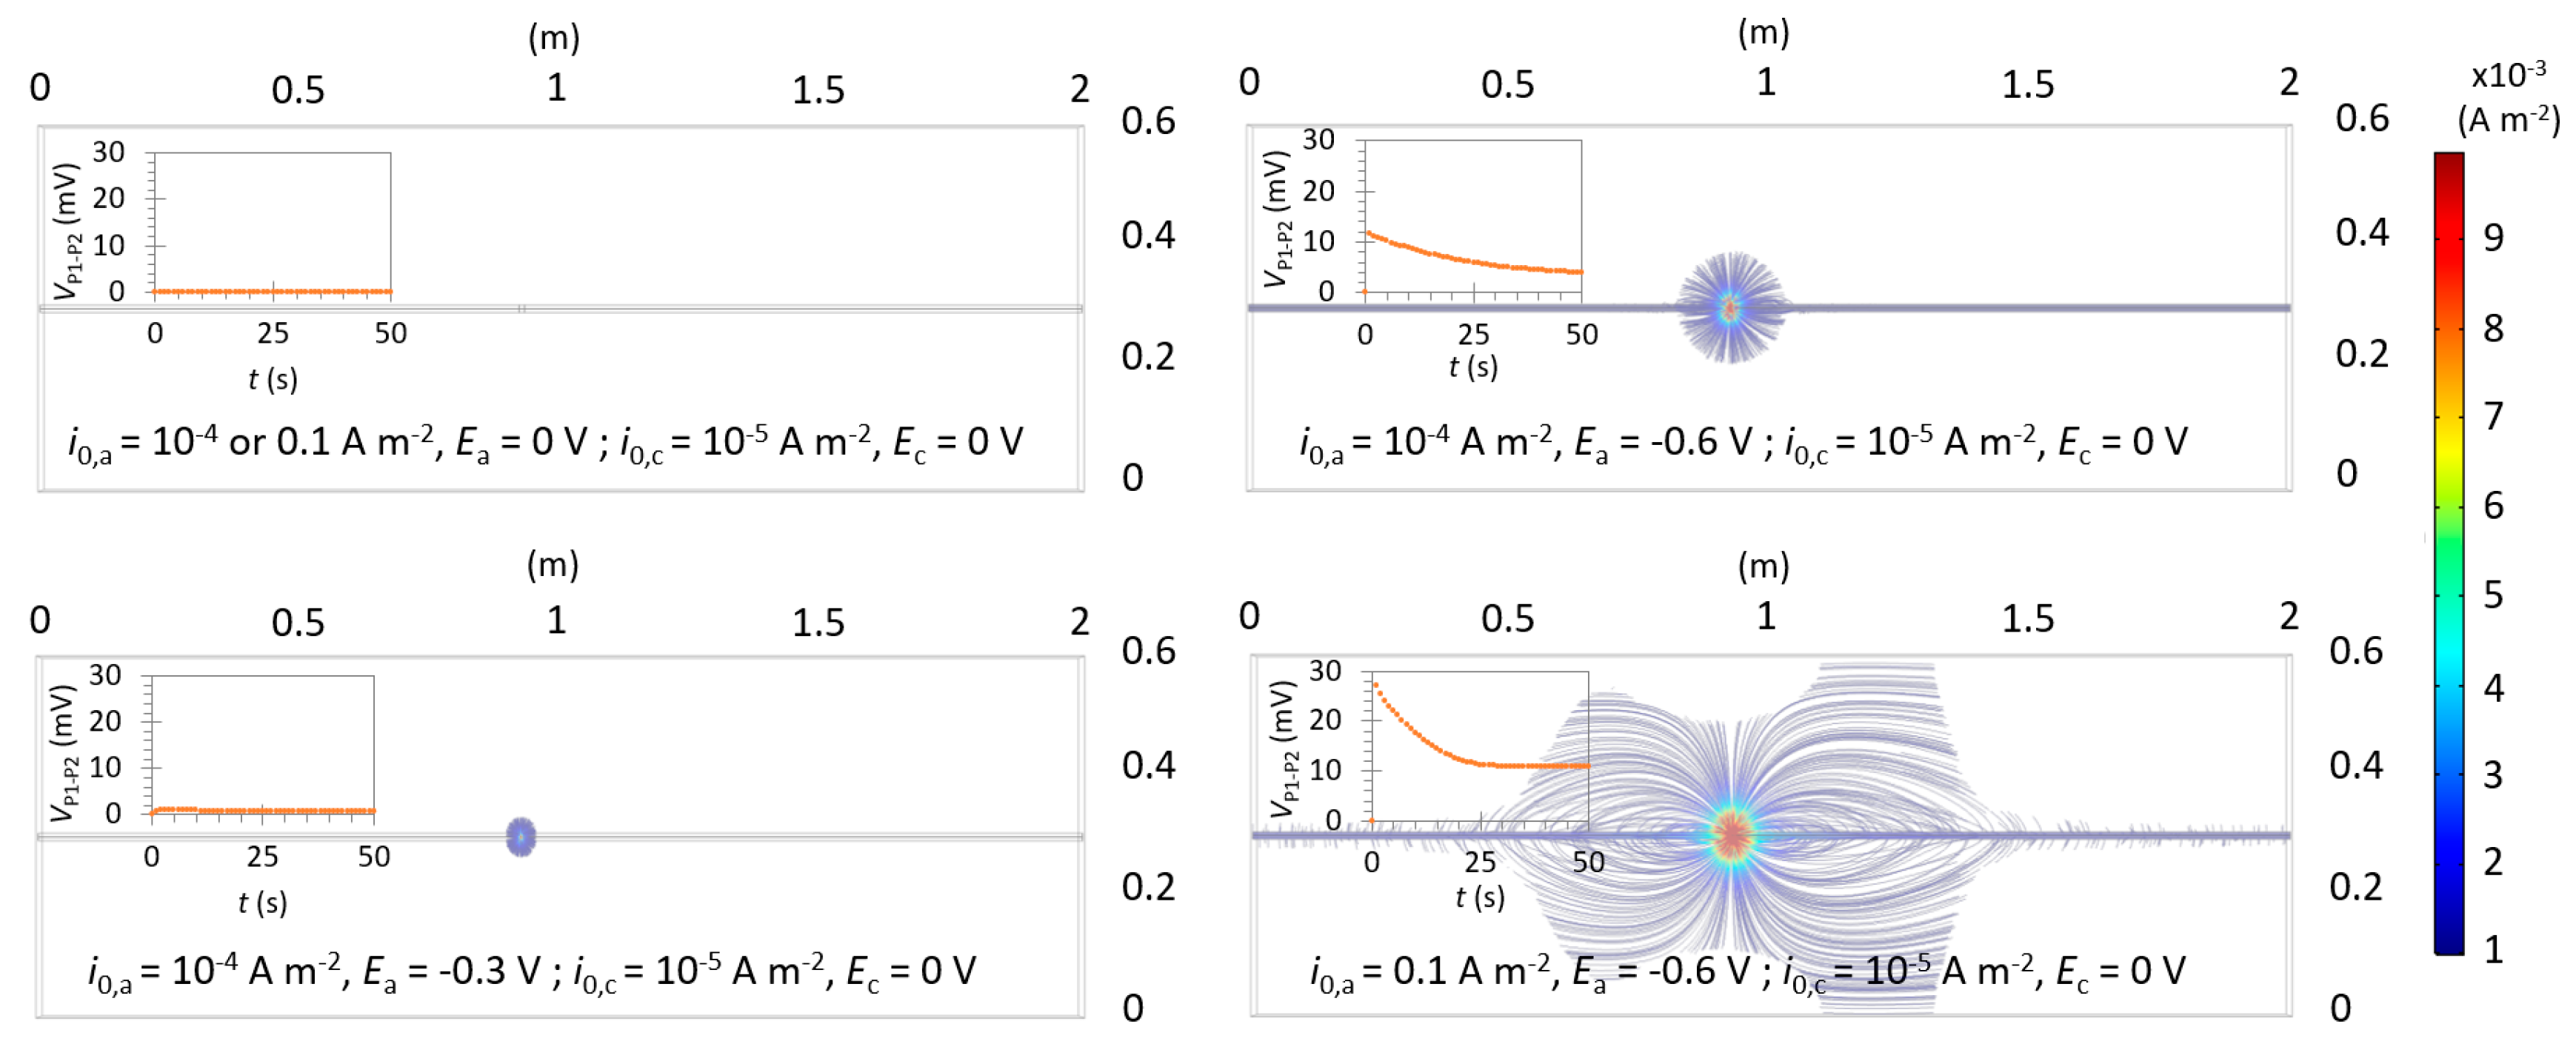
When modeling non-uniform corrosion, an important parameter is the free macrocell current that flows spontaneously between anodic and cathodic sites without external polarization [18]. It depends upon the parameter of the Butler–Volmer equation, mainly the exchange current density and the corrosion potential difference between anode and cathode (Figure 3). The objective of our study was to assess the influence of the monitoring technique on an established corrosion cell. However, in the modeling, the distribution of the macrocell current lines in the domain is not initially established. Hence, the simulation results considered both the effect of the impressed current for corrosion monitoring and the establishment of a free macrocell current. Irrespective of the exchange current density of the anode, the free macrocell current lines are removed when Eeq,a = Eeq,c = 0 V. For the other conditions, the current varies with time but gradually tends towards a constant value, indicating that a steady state is reached (surface potential). Hence, to eliminate the influence of these spontaneous current lines on corrosion monitoring, both anodic and cathodic potentials were fixed at 0 V in this study. Even though this value is not representative of a real macrocell process and can affect any quantitative determination, it does not affect the qualitative insights obtained by our study. To use representative values for anodic and cathodic potentials, it would have been possible to use the steady-state obtained without external polarization as initial conditions to the simulations with external polarization to remove the effect of the free macrocell current of the potential difference.
We also used a corrosion potential value of 0 V for modeling uniform corrosion as the results are used as reference states for determining the difference between microcell and macrocell corrosion. The input parameters of the Butler–Volmer equation used in this study are summarized in Table 2. The α values were selected in order to obtain B values (Stern–Geary constant, see Equation (1)) close to 26 mV for active corrosion and close to 52 mV for passive corrosion, which are the common recommended values [60]. In each section, we input one Tafel slope for the anodic reaction and one Tafel slope for the cathodic one, as both microcell and macrocell components are non-negligible values in the total current density [61,62,63].
Another input parameter for considering the time-dependency of corrosion is the double-layer capacitance Cdl [31,35], which notably influences the time required to reach the steady-state potential. This parameter was implemented as a boundary condition at the steel/concrete interface for both anodic and cathodic areas. Typical values of Cdl for steel in concrete range from 1 to 150 µF cm−2 [64], even if greater ranges have also been reported from laboratory work [65]. Some differences between Cdl values for active and passive states are expected because of variation in electrolyte concentration or changes in exposed metal surface. Here, to separate the contribution of each parameter, we first considered a same value for both active and passive areas, investigating first the effect of the exchange current density alone. Then, we investigated the effect of Cdl by increasing its value in the anodic area.
To model the indirect GP measurements, the four electrodes were modeled as perfect point objects on the concrete surface in Wenner configuration, i.e., with the same probe spacing between each electrode and aligned right above and parallel to the rebar. The assumption of point-shaped electrodes is suitable as the geometry of a four-point probe has only a limited effect on calculating the concrete resistivity [66]. The two outer electrodes C1 and C2 act as current electrodes to inject 100 µA and −100 µA, respectively, in order to virtually create their connection to the current generator, while the two inner electrodes P1 and P2 act as potential electrodes; probe spacing a varies between 2.5 and 15 cm. To determine the sensitivity of the technique, the electrodes remain fixed at the center of the element, while the anodic site is moved along the rebar. Thus, the distribution of the current in the material is not affected by changes in border effects, which allows the comparison of all simulations. An extremely fine mesh, with 2.99 million tetrahedral elements ranging from 0.0004 to 0.04 m, was used for evaluating the temporal evolution (without further indication from 0 to 30 s, with time steps of 0.2 s) with MUMPS (multifrontal massively parallel sparse direct solver) and a relative tolerance of 0.001 in order to obtain an accurate solution.
From the simulations, we derived the potential difference between P1 and P2 (VP1−P2), and the current that polarizes the rebar Irebar and the anode Ianode, by integrating for each time step the absolute normal current density over the total rebar surface or over the anode surface, respectively. The integrated current was divided by two to account for the two different currents impressed on the concrete surface. The results obtained for the non-uniform corrosion were then compared to the relevant passive state to investigate the sensitivity of the indirect GP technique for detecting localized corrosion.

3. Experimental Results

The experimental results are presented in Figure 4. Figure 4a and Figure S1C represent the influence of the probes position with respect to the rebar (0–12 cm; 0 cm indicates that measurements are done above and parallel to the rebar). Irrespective of the position of the device, a clear polarization is observed. This polarization is related to the rebar and not to the concrete, as only an ohmic drop is observed on unreinforced specimens (Figure S1A). Results indicate that the further the monitoring device is from the rebar, the higher the apparent concrete resistance (i.e., VP1−P2 at 0.1 s) and the lower the apparent polarization resistance (i.e., VP1−P2 at steady-state). Indeed, more current flows in the rebar at 0 cm, whereas more current flows in the concrete at 6 and 12 cm. This result can in part be comparable to what is expected when increasing the cover depth; increasing the cover depth increases the distance between the probes and the rebar, decreasing the part of the current that polarizes the rebar.
The influence of the impressed current (I = 50–1000 µA) is presented in Figure 4b. Results indicate that an increase in the impressed current increases VP1−P2 for each time. Visually, it appears that a longer time is required to reach the steady state when increasing the impressed current. However, a linear evolution of VP1−P2 with the impressed current is obtained at t = 0.1 s or t = 30 s (Figure 4c). Hence, comparable results are obtained irrespective of the impressed current and increasing the current can help to obtain a more significant variation on VP1−P2. Even if the injected current values appear to be high as compared to the values traditionally used in three-electrode configuration (generally a few µA), we must recall that only a fraction of the current applied on concrete surface will polarize the rebar in this configuration [35]. As discussed later in Section 4.2, this fraction decreases with time in the case of a passive rebar, so the polarization of the rebar is not as strong as expected from the values of VP1−P2.
Figure 4d and Figure S1D show the influence of the probe spacing (a = 5–15 cm) for the passive rebar. The initial value obtained at 0.1 s decreases when increasing the probe spacing. However, as the current distribution is impacted by the finite size of the sample, only a small difference is observed between 10 cm and 15 cm at 0.1 s. The results also indicate that increasing the probe spacing increases the value of VP1−P2 on the steady-state potential. Irrespective of the probe spacing, the time required to reach the quasi-steady state is largely reduced as compared to the results obtained in the three-electrode configuration (Figure S1B), which is in agreement with References [22,28,35].
The results obtained after the local introduction of Cl through wetting and drying cycles (Figure 4e) indicate that a longer time is required to reach the steady state as compared to the passive rebar, for each probe spacing. We then calculated the difference in VP1−P2 between the passive rebar and the rebar after Cl introduction for each time (Equation (5)):
Δ V ( t ) = V P 1 P 2 ( t )   for   passive   rebar V P 1 P 2 ( t )   for   rebar   after   Cl   introduction .
The results are presented in Figure 4f. An increase in ΔV is observed before it reaches a maximum value. Increasing the probe spacing increases the time required to reach this maximum, but it is observed in less than 30 s in all cases. The magnitude is also higher when a = 15 cm (ΔVmax = 20.2 mV) as compared to a = 5 cm (ΔVmax = 10.2 mV). After this maximum value, ΔV decreases progressively, indicating that the difference between the two electrochemical state is less important at the steady state. Hence, as stated by Reference [32], the DC-limit seems not adapted for detecting localized corrosion. However, it appears that comparing the evolution of the transient potential can provide insights on the different corrosion states of the rebar.
To sum up, the experimental results demonstrate that (i) the rebar can effectively be polarized without any connection by applying a direct current between two probes located on concrete surface, (ii) the distance of the probes from the rebar affects VP1−P2, (iii) the size of the specimen affects the current distribution in the material, and (iv) the time required to reach the steady state appears related to the corrosion state of the rebar.

4. Numerical Results

4.1. Unreinforced Specimen: Geometric Factor

The geometric factor k (m) is required for converting concrete resistance R (Ω) into concrete resistivity ρ (Ω m), as indicated in Equation (6).
ρ = k R = k V P 1 P 2 I C 1 .
In Wenner configuration, the geometric factor is calculated according to Equation (7):
k Wenner = 2 π a ,
where a (m) is the probe spacing. However, this equation was defined for homogeneous and isotropic material with a semi-infinite geometry, which in practice is not true for RC structures [66]. Hence, the applicability of Equation (7) was verified by calculating the geometric factor obtained with the input resistivity and the results of simulations (Equation (8)):
k COMSOL = ρ input R without   rebar = ρ input ( V P 1 P 2 I C 1 ) without   rebar .
The results obtained for five probe spacings are presented in Table 3. The conventional geometric factor kWenner is quite similar to the calculated kCOMSOL one when a = 2.5 or 5 cm. However, increasing a up to 15 cm gives quite different values, with lower values obtained by the numerical simulations. This difference may be related to edge effects due to the finite size of the element. Hence, as already shown in other studies [67,68,69,70], the sample geometry is an important parameter when running experiments and numerical simulations, and an accurate geometric factor must be determined case by case, depending on specimen size and probe spacing.

4.2. Uniform Corrosion: Parametric Study

The input parameters investigated for uniform corrosion are listed in Table 4.

4.2.1. Instantaneous Ohmic Drop

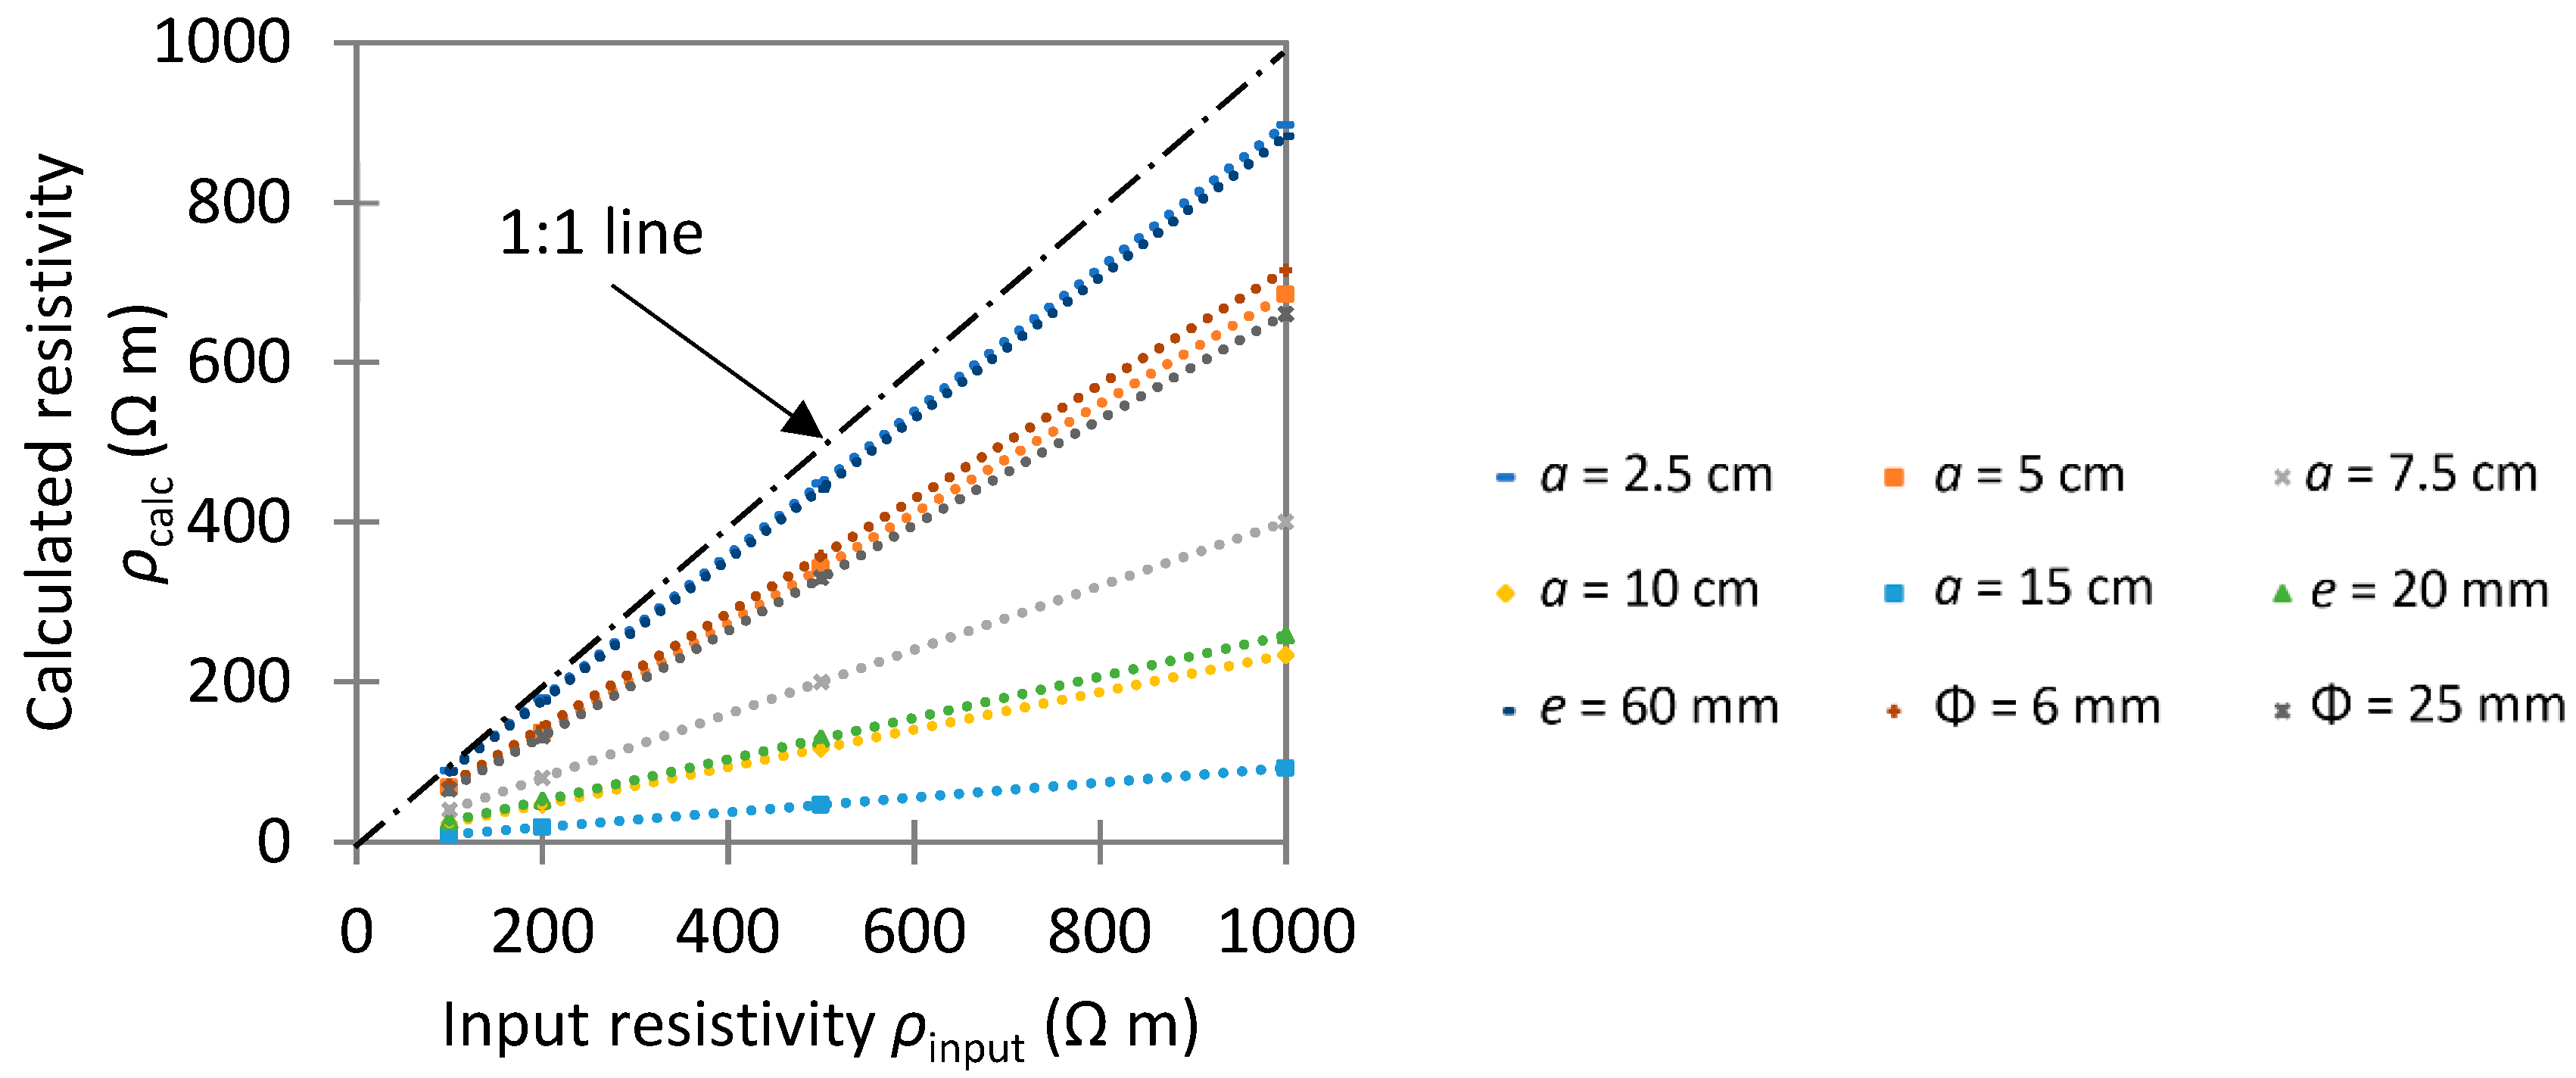
We first focused on the instantaneous potential difference obtained at t0. All the values reported in Table S1 were obtained considering both active and passive corrosion. Hence, the instantaneous ohmic drop appears independent of the electrochemical state of the steel/concrete interface (i.e., Butler–Volmer input parameters). For each resistivity, VP1−P2 decreases nonlinearly when increasing the probe spacing a (Figure 5a), decreasing the cover depth e (Figure 5b), or increasing the rebar diameter Φ (Figure 5c).
Only a fraction of the current impressed on the concrete surface polarizes the rebar. As shown in Table S1, this value is almost independent of concrete resistivity. However, higher values are observed when the probe spacing is increased, as more current penetrates deeper into the concrete volume. Higher values are also observed when the cover depth is decreased and when increasing the rebar diameter, in agreement with Reference [35]. Though the value of the impressed current IC1 also influences the instantaneous ohmic drop, it has no effect on the calculated resistance, in agreement with Ohm’s law and the experimental results. As the total injected current at the concrete surface remains constant, the other fraction of the current flows in the concrete without polarizing the rebar. For each input resistivity, the highest VP1−P2 values are observed when this fraction is maximum. The instantaneous potential difference was used for calculating concrete resistivity using the geometric factor kCOMSOL determined numerically that accounts for potential border effects (see Table 3). This value was then compared to the different input resistivities (100, 200, 500, or 1000 Ω m). In all cases, the resistivity calculated using the total impressed current was lower than the input resistivity (Figure 6).
A percentage of underestimation was calculated as (Equation (9)):
%   of   underestimation = ρ input ρ calc ρ input × 100 .
As shown in Table S1, this percentage increases when increasing a, decreasing e and increasing Φ, though it is independent from the input resistivity. The underestimation is related to the presence of rebar that acts as a short-circuit due to its very low electrical resistivity at high frequencies. Hence, the instantaneous ohmic drop results from the contribution of concrete resistivity but also of the rebar. This is known as the rebar effect and is discussed in Section 5.1.

4.2.2. Transient Potential

We then focused on the transient potential. Some examples of the results are presented in Figure 7, and all the results are presented on Figure S2. The ohmic drop is not shown on these figures as the first point of the potential difference VP1−P2 at t0 was normalized to 0 mV for easier comparison of the different simulations.
For active corrosion, the current polarizing the rebar slightly decreases before reaching a constant value, which is highest for the highest resistivity (Figure 7, left). As there is more resistance to current flow in the concrete in this condition, it becomes easier for the current to polarize the rebar. Compared to the conventional GP technique in the three-electrode configuration, only a fraction of the injected current polarizes the rebar in the indirect GP technique.
In parallel, VP1−P2 rapidly increases before reaching a constant value (Figure 7, middle). The time required to reach this steady-state potential depends upon the double-layer capacitance Cdl: for Cdl = 0.2 F m−2, the steady-state potential is reached in less than 1 s, whereas more than 4 s are required for Cdl = 2 F m−2. Though this steady-state potential value is independent of Cdl, it depends upon the exchange current density i0, and on concrete resistivity ρ, probe spacing a, cover depth e, and rebar diameter Φ (Figure 7 and Figure S2).
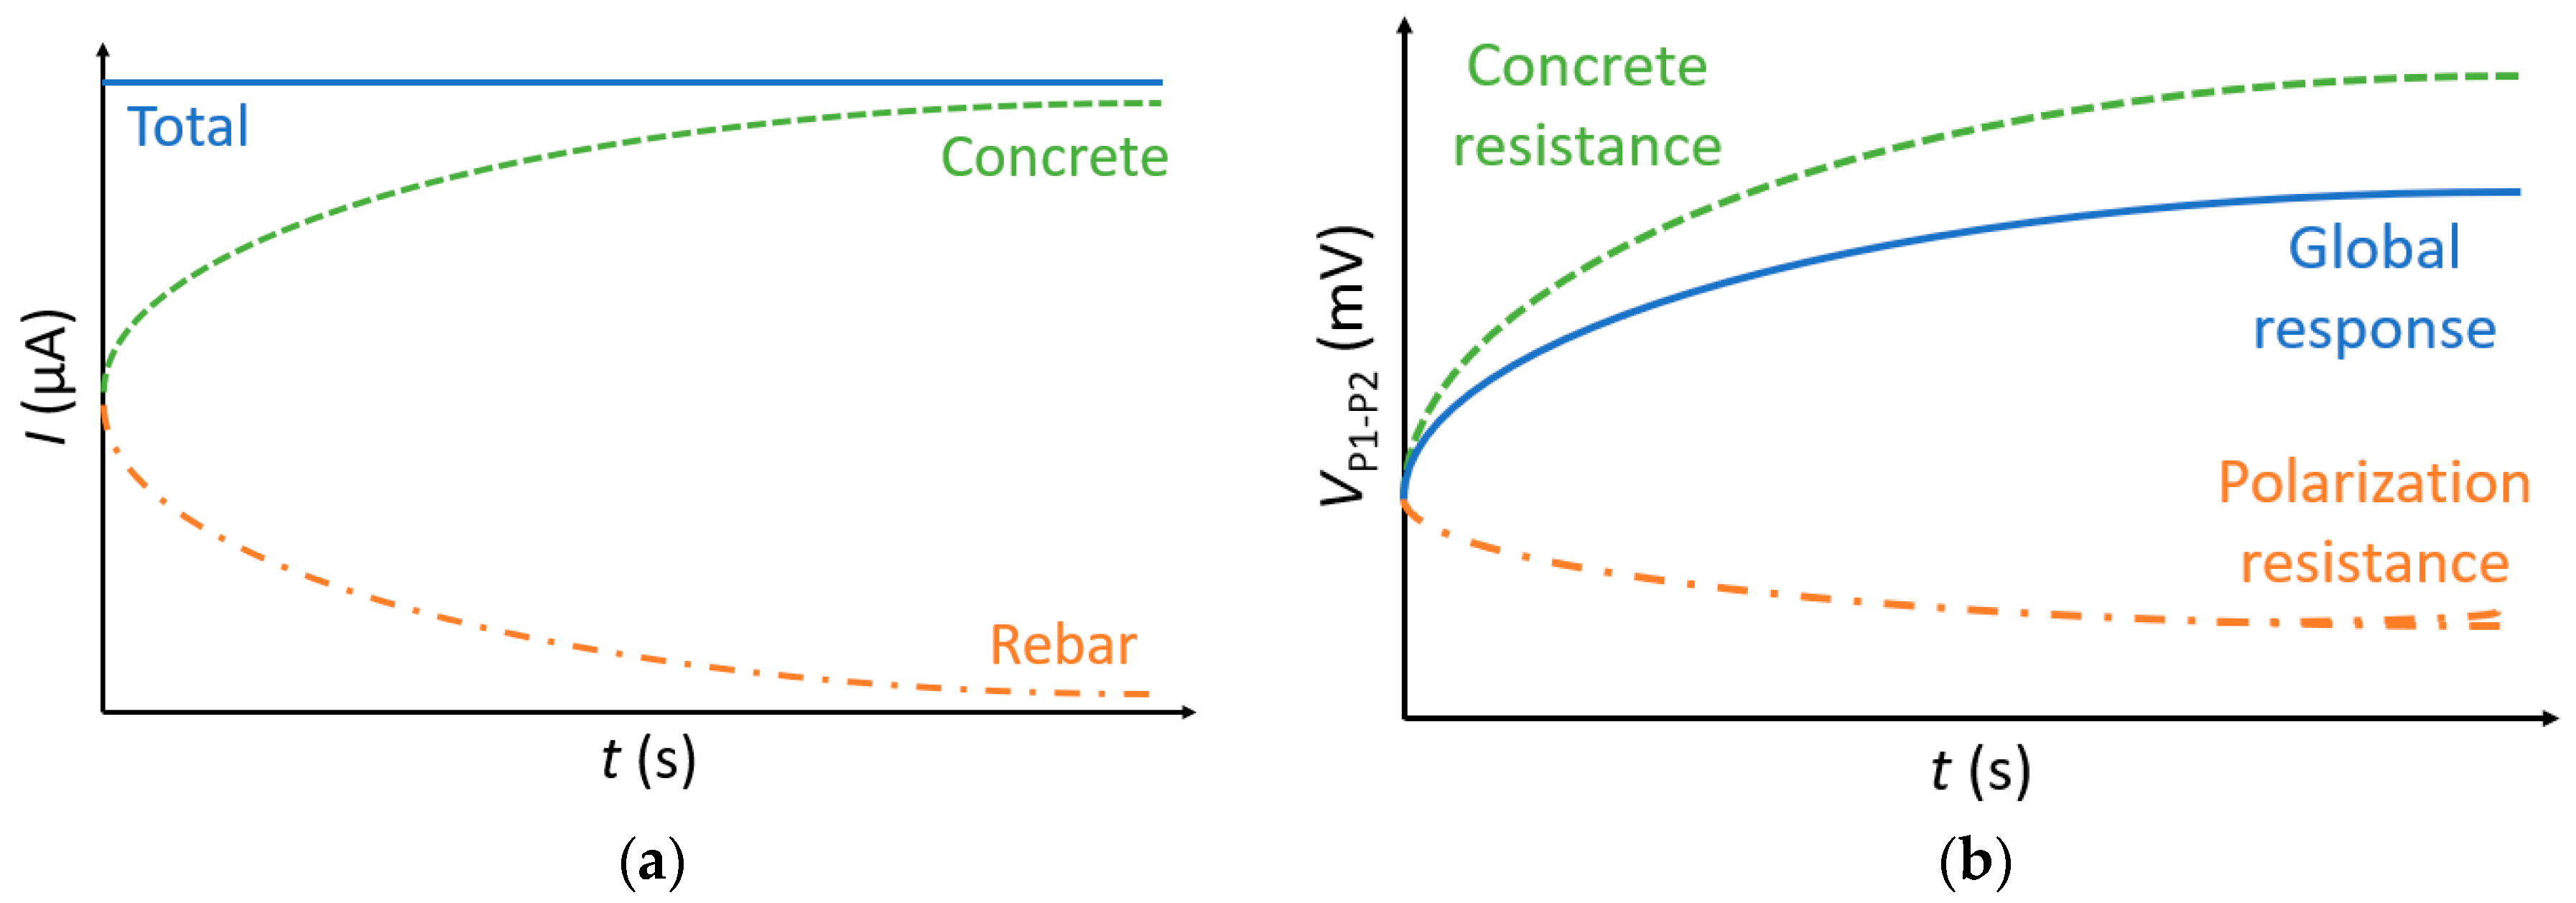
For passive corrosion, the current polarizing the rebar decreases nonlinearly over time before reaching very low values at the end of the simulations (Figure 7 left and Figure S2). After 30 s, the total current on the rebar is less than 1 µA for ρ = 100 Ω m, irrespective of probe spacing, but it remains higher than 5 µA for ρ = 1000 Ω m. As concrete resistivity decreases, the current decreases more rapidly. This is related to the high polarization resistance of the rebar and the different behavior of a capacitor at high and low frequencies [26]. Theoretically, a capacitor acts as a short-circuit at high frequencies (i.e., over very short times), whereas it acts as an open circuit at low frequencies (i.e., over a long period of time) [35]. Between these two opposite behaviors, the current polarizing the capacitor decreases at a velocity that is dependent on the time constant of the system (τ = RC). This means that at the start of injection, the current can easily flow through the rebar capacitance. In the conventional three-electrode GP technique, as the rebar is the only current sink in the system, the entire impressed current polarizes it each time, either in its capacitive or its resistance component, and the current flows progressively through the polarization resistance when increasing the duration of the injection. However, in the indirect GP technique, the current can simply flow between C1 and C2 through the concrete without polarizing the rebar. In passive condition, due to the high polarization resistance, the concrete progressively becomes the less resistive path in the system as the duration of the injection increases, especially for low resistive concrete. This behavior explains the very low current in the rebar after 30 s when ρ = 100 Ω m. As the total injected current remains constant in the system, the fraction of the current that flows in the concrete without polarizing the rebar increases over time.
In parallel to the decrease in the current on the rebar, VP1−P2 increases nonlinearly over time (Figure 7 right). A decrease in the probe spacing a decreases VP1−P2, while a decrease in the cover depth e increases VP1−P2. In fact, the higher the initial current on the rebar, the higher will be the potential difference VP1−P2, as it was observed experimentally. Increasing concrete resistivity also increases VP1−P2. If the transient potential was only related to the polarization resistance, a decrease in VP1−P2 would have been expected as the current that polarizes the rebar decreases over time. In fact, for each time, there is an increase in VP1−P2 related to the concrete resistivity—as more current flows in the concrete—and a decrease in VP1−P2 related to the polarization resistance of the rebar, as less current flows in the rebar. Overall, this results in an increase in VP1−P2 (Figure 8). This means that the indirect GP technique is fundamentally different from the conventional GP technique in three-electrode configuration, for which the transient potential is not dependent on concrete resistance.
A “quasi-steady-state” is reached after only 30 s for ρ = 100 Ω m. Indeed, as the polarizing current is already very low at this time, variations in VP1−P2 are almost insignificant. This is considerably shorter than the time required to reach the steady state in the conventional three-electrode configuration for passive rebar, as already noted in References [22,28,35]. However, the higher the concrete resistivity, the slower the current that polarizes the rebar decreases and the longer it takes to reach the quasi-steady-state potential. Hence, for highly resistive concrete, a longer polarization time is required to reach the steady state, though a quasi-steady-state is reached in about 300 s (Figure S3).
By comparing the values of VP1−P2 at steady state or “quasi-steady-state”, some practical recommendations can be formulated. For a highly corroding rebar, as VP1−P2 is low irrespective of concrete resistivity, the impressed current must be higher than 100 µA to improve the signal-to-noise ratio. For a passive rebar in highly resistive concrete, VP1−P2 values seem to indicate a strong polarization of the rebar as VP1−P2 > 20 mV. However, as already stated, this is not the case as most of VP1−P2 is mainly related to concrete resistivity. As the current polarizing the rebar decreases over time, the strongest rebar polarization is obtained shortly after injection of the current. Hence, when the rebar condition is unknown, one can impress a high current (e.g., 300 or 500 µA) for improving the signal-to-noise ratio without causing irreversible changes to the steel rebar. If the resulting VP1−P2 value is high enough, the value of the impressed current can be decreased to reduce potential damage to the concrete microstructure if the measurements will be repeated several times.

4.3. Non-Uniform Corrosion: Detection of the Actively Corroding Area

The input parameters for non-uniform corrosion are summarized in Table 5. In this section, we only focus on the transient potential and not on the instantaneous ohmic drop obtained at t0.

4.3.1. Influence of an Anode with a Low Anodic Exchange Current Density

The effect of the anodic exchange current density was first studied with i0,a = 10−4 A m−2. To compare the results obtained for non-uniform corrosion with those for uniform corrosion in passive state, we calculated the potential difference ΔV obtained at each time with Equation (5). The greater this difference, the more important is the effect of the anode on potential and current distribution. This equation can be used if the impressed current is similar for all measurements and if the concrete resistivity profile is uniform in the investigated area.
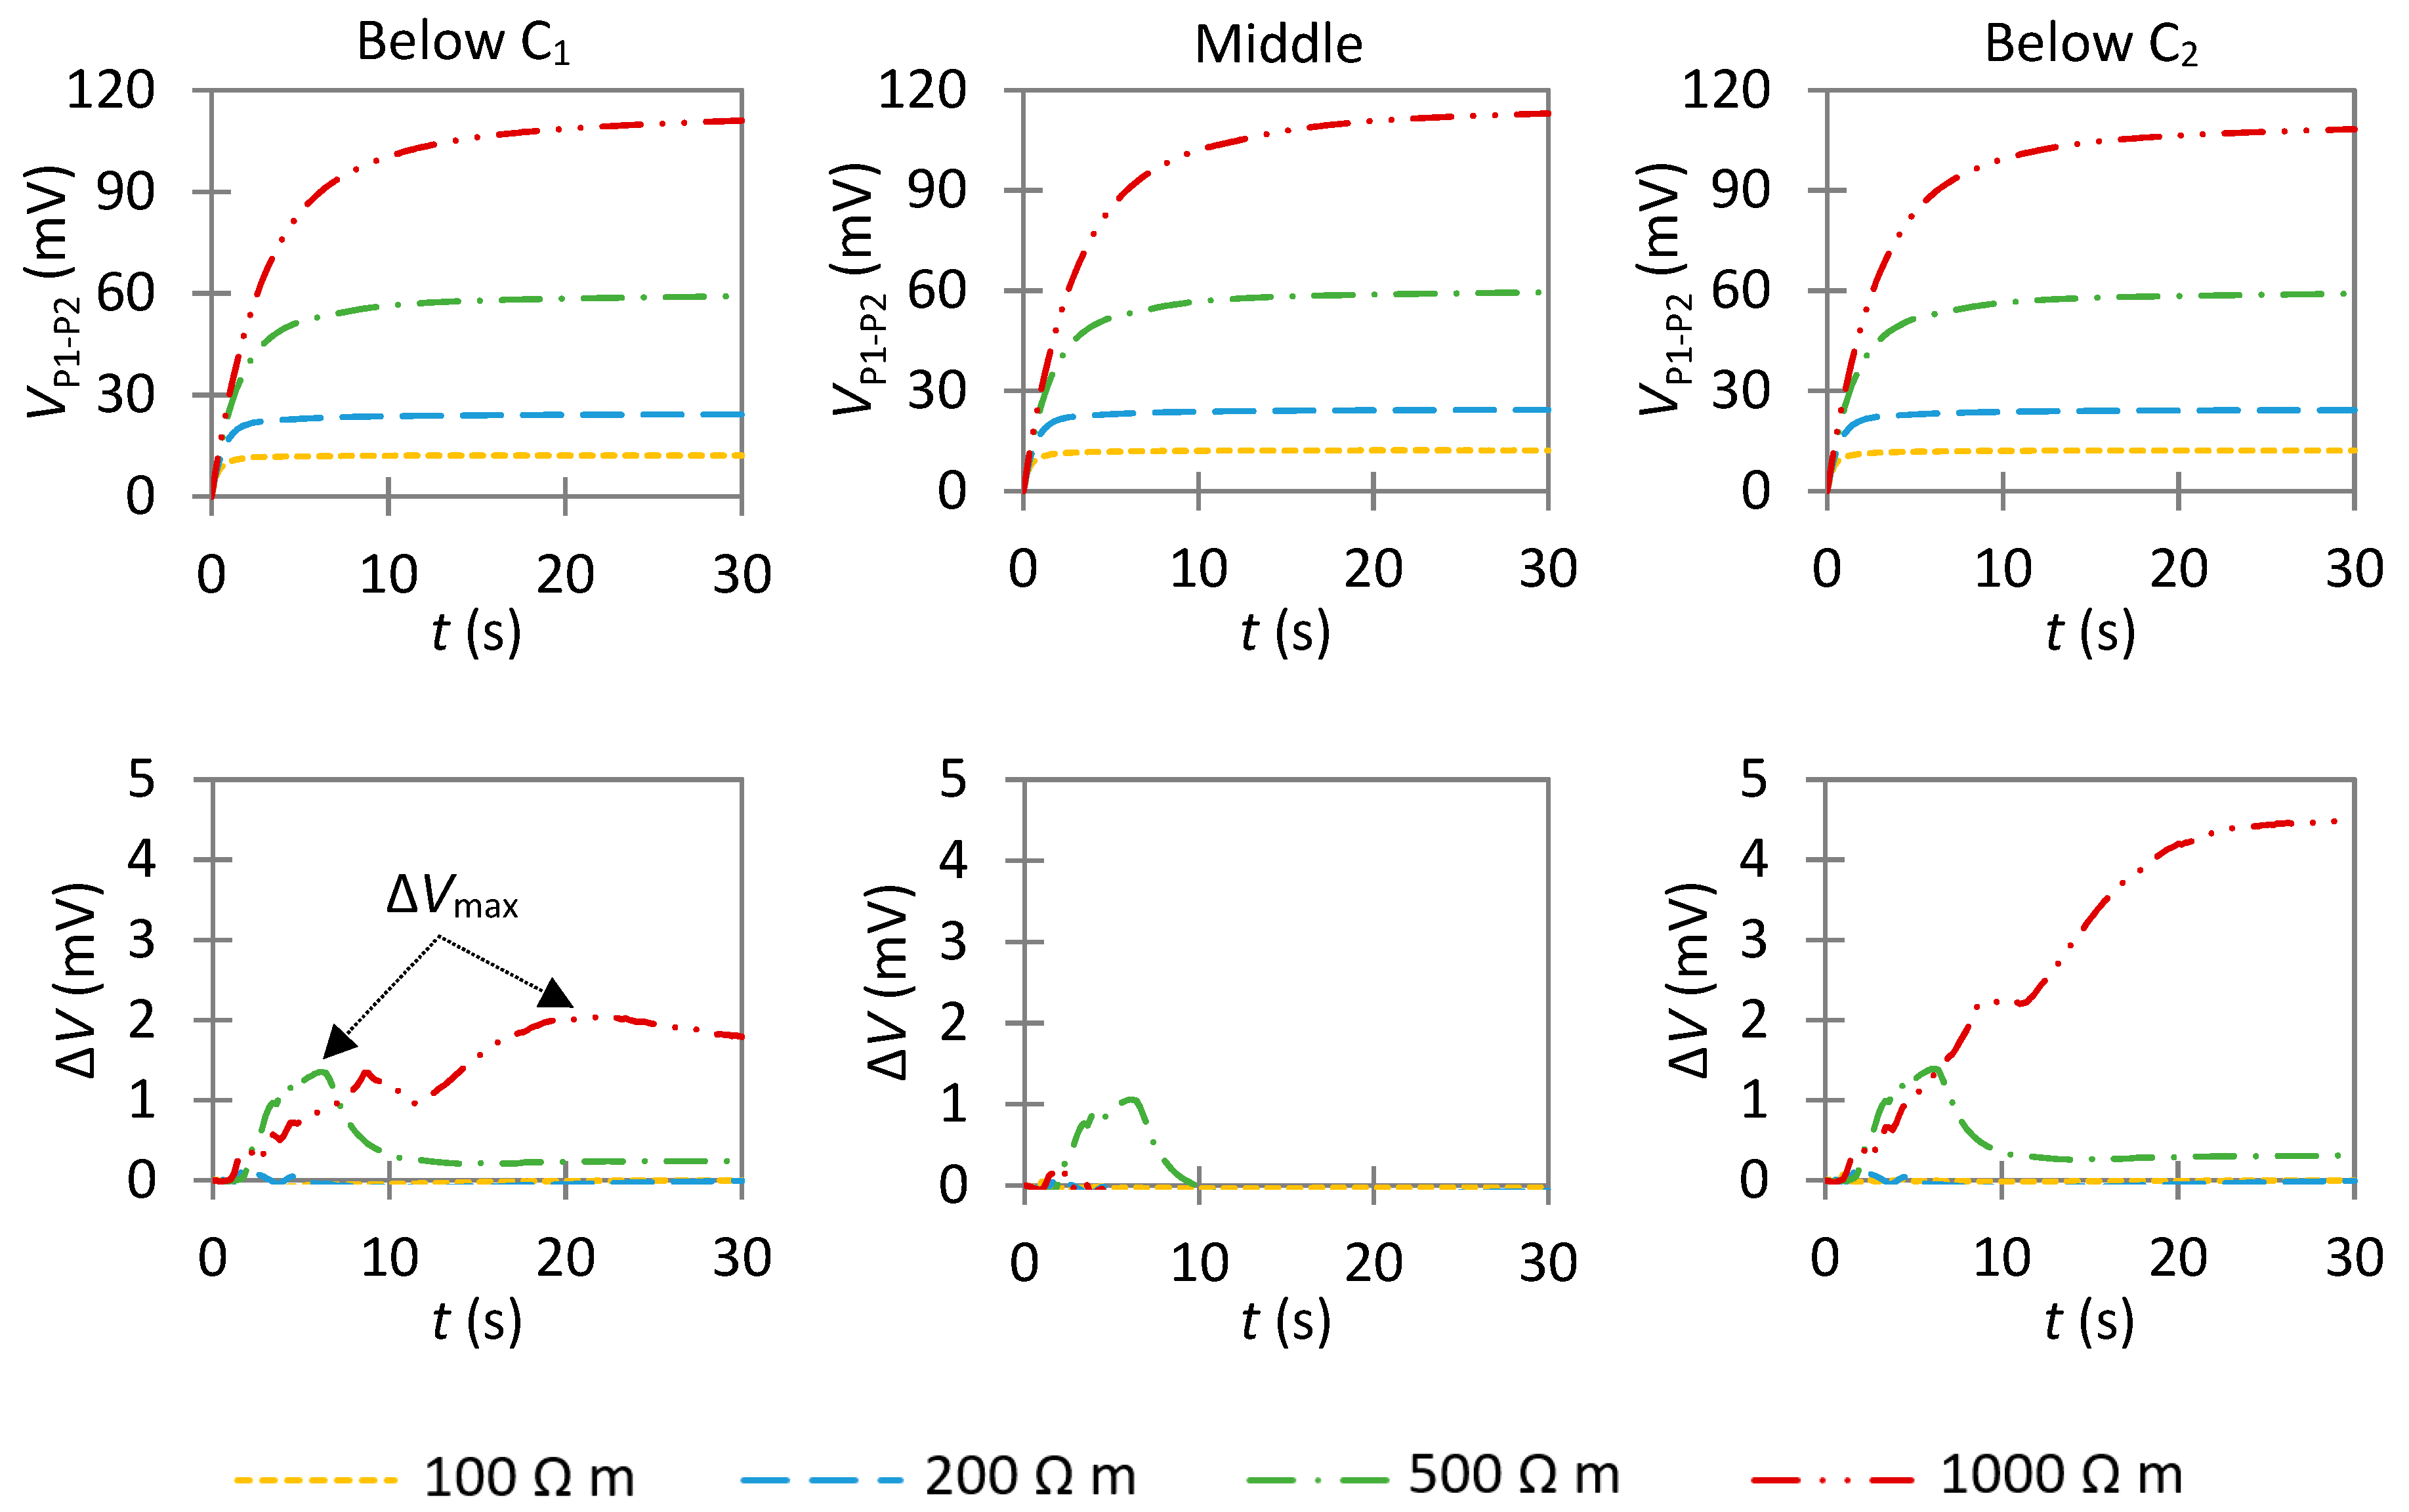
Probe spacing was set at 5 cm, which is an industry standard for concrete resistivity meters. The anode length La was first set at 1 cm (Sa = 3.77 cm2), and the results are shown on Figure 9. Almost no difference with the reference state is observed when the anode in located at the center of P1 and P2 or at 7.5 cm and more from C1 or C2, as ΔV remains close to 0, especially when ρ = 100 or 200 Ω m. Only small differences are observed when the anode is below the current electrodes when ρ = 500 or 1000 Ω m, but ΔVmax remains lower than 5 mV in these cases.
In concrete and other porous media, the growth of anodic sites is more rapid close to anode/cathode boundaries than deeper down in the pit due to the non-uniform distribution of current densities [71]. Hence, the size of a pit is greater on surface than at depth. Thus, it is expected that anodes over 1-cm long can develop at the steel/concrete interface. However, even when the anode length is increased to 3 cm (Sa = 11.3 cm2, Figure S4), the difference with a fully passive rebar remains very small and only significant for the highest resistivity (ρ = 1000 Ω m), for which ΔV can be up to 9 mV.
We must note that the exchange current density used in this first case for the anodic area is very low and is sometimes used for cathodic areas (as indicated in Table 1). A rebar is generally considered in the passive state if the corrosion current density is less than 0.1 µA cm−2 [54], i.e., 10−3 A m−2. Hence, the results of this simulation may rather represent a passive rebar with different electrochemical properties due to the heterogeneity of the passive film at the steel/concrete interface [72]. Considering this case, the low sensitivity of the indirect GP technique cannot be seen as a drawback as it seems non-essential to differentiate these two states as corrosion remains in passive conditions. Further studies are required to determine if this small difference can still have a practical interest, for example, for locating areas with higher susceptibility to corrosion initiation [73].

4.3.2. Influence of an Anode with a High Anodic Exchange Current Density

To represent a highly corroding area, the anodic-exchange current density was increased to 0.1 A m−2 [18,32,58,59]. Even if this value is mainly expected in a low-resistive concrete with a high water-saturation level, we investigated the effects for all resistivity values as they depend on concrete composition. It has been shown that a steel rebar can corrode at relative similar rates when embedded in a low-resistive mortar prepared only with Portland cement, or in a high-resistive mortar prepared with a mix of Portland cement and fly ash [74].
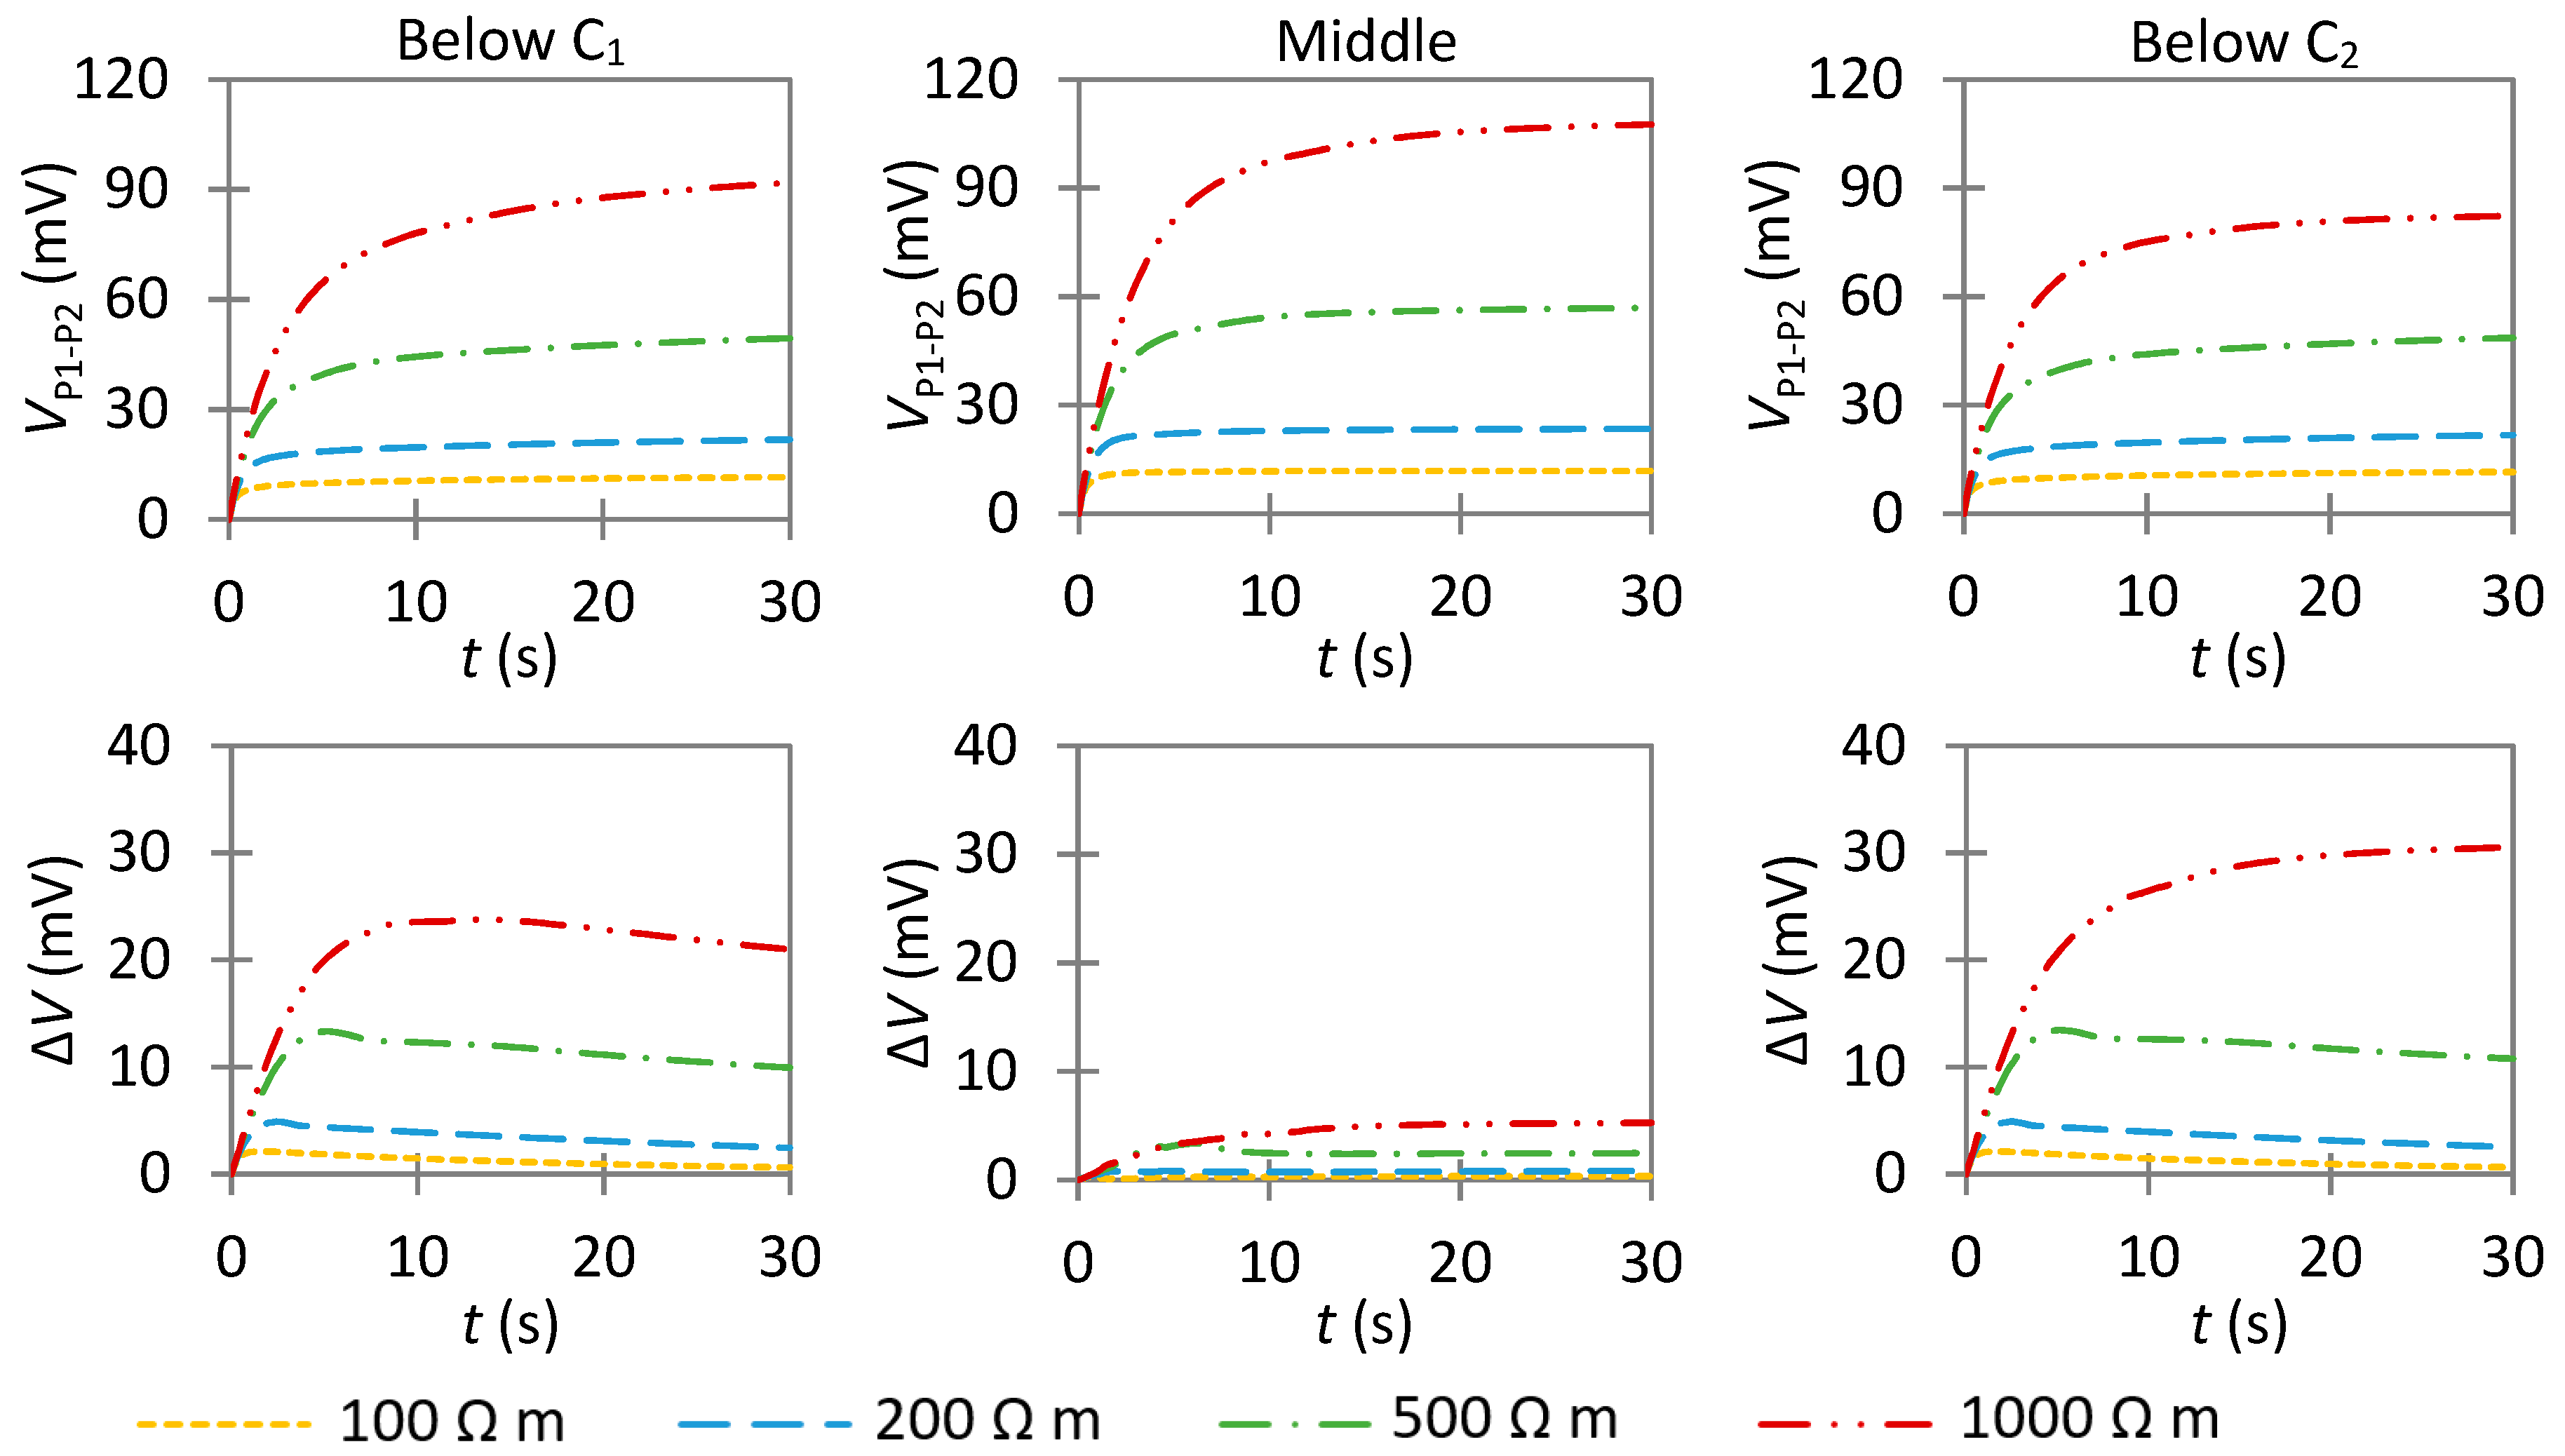
The anode length was first set at 1 cm (Figure 10). When the anode is perfectly centered between P1 and P2, the difference with a fully passive rebar is small (ΔVmax < 1.1 mV). This is similar to the observation made with a low anodic-exchange current density (Figure 9), but, when the anode is below C1 or C2, the anode has a significant effect on the measured potential. In this position, the anode receives a higher part of the injected current and, thus, is more polarized, and the anodic area will have a significant effect on the evolution of VP1−P2 over time. The strongest effect on VP1−P2 is observed for the highest resistivity, as ΔVmax ≃ 14 mV.
It is important to note that the time required to reach ΔVmax increases with increased concrete resistivity. After this maximum, ΔV slowly decreases before reaching a constant value when the steady-state potential is reached. Hence, the maximum is not observed at the steady state but at the transient potential. The only exception is when the anode is located below C2 for ρ = 1000 Ω m, as ΔVmax is observed at the steady-state potential.
The difference with passive rebar becomes small again when gradually moving the anode away from the current electrodes as shown by a decrease in ΔV values (Figure S5A): ΔVmax < 2.6 mV at 7.5 cm from C1 and ΔVmax < 1.3 mV at 15 cm from C1 when ρ = 1000 Ω m, which is close to the value observed when the anode is centered between P1 and P2. The sensitivity of the monitoring device is thus spatially limited as the anode is mainly observed when it is located below or close to one of the current electrodes. These results show that it is possible to estimate the position of such a small but highly corroding anode if the measurement is repeated at several positions along the rebar.
For practical considerations, it is important to note that, when the total current injected is 100 µA, ΔVmax is only 1.2 mV for ρ = 100 Ω m in the best case, i.e., when the anode is below one of the current electrodes. It is questionable whether this difference is experimentally significant because of the noise or of the variation in self-potential, which are expected during any measurement. To guarantee the ability of the technique to locate highly corroding areas, it is necessary to impress a higher current (300 or 500 µA) on the concrete surface to increase the signal for a low-resistive concrete (Figure S6).
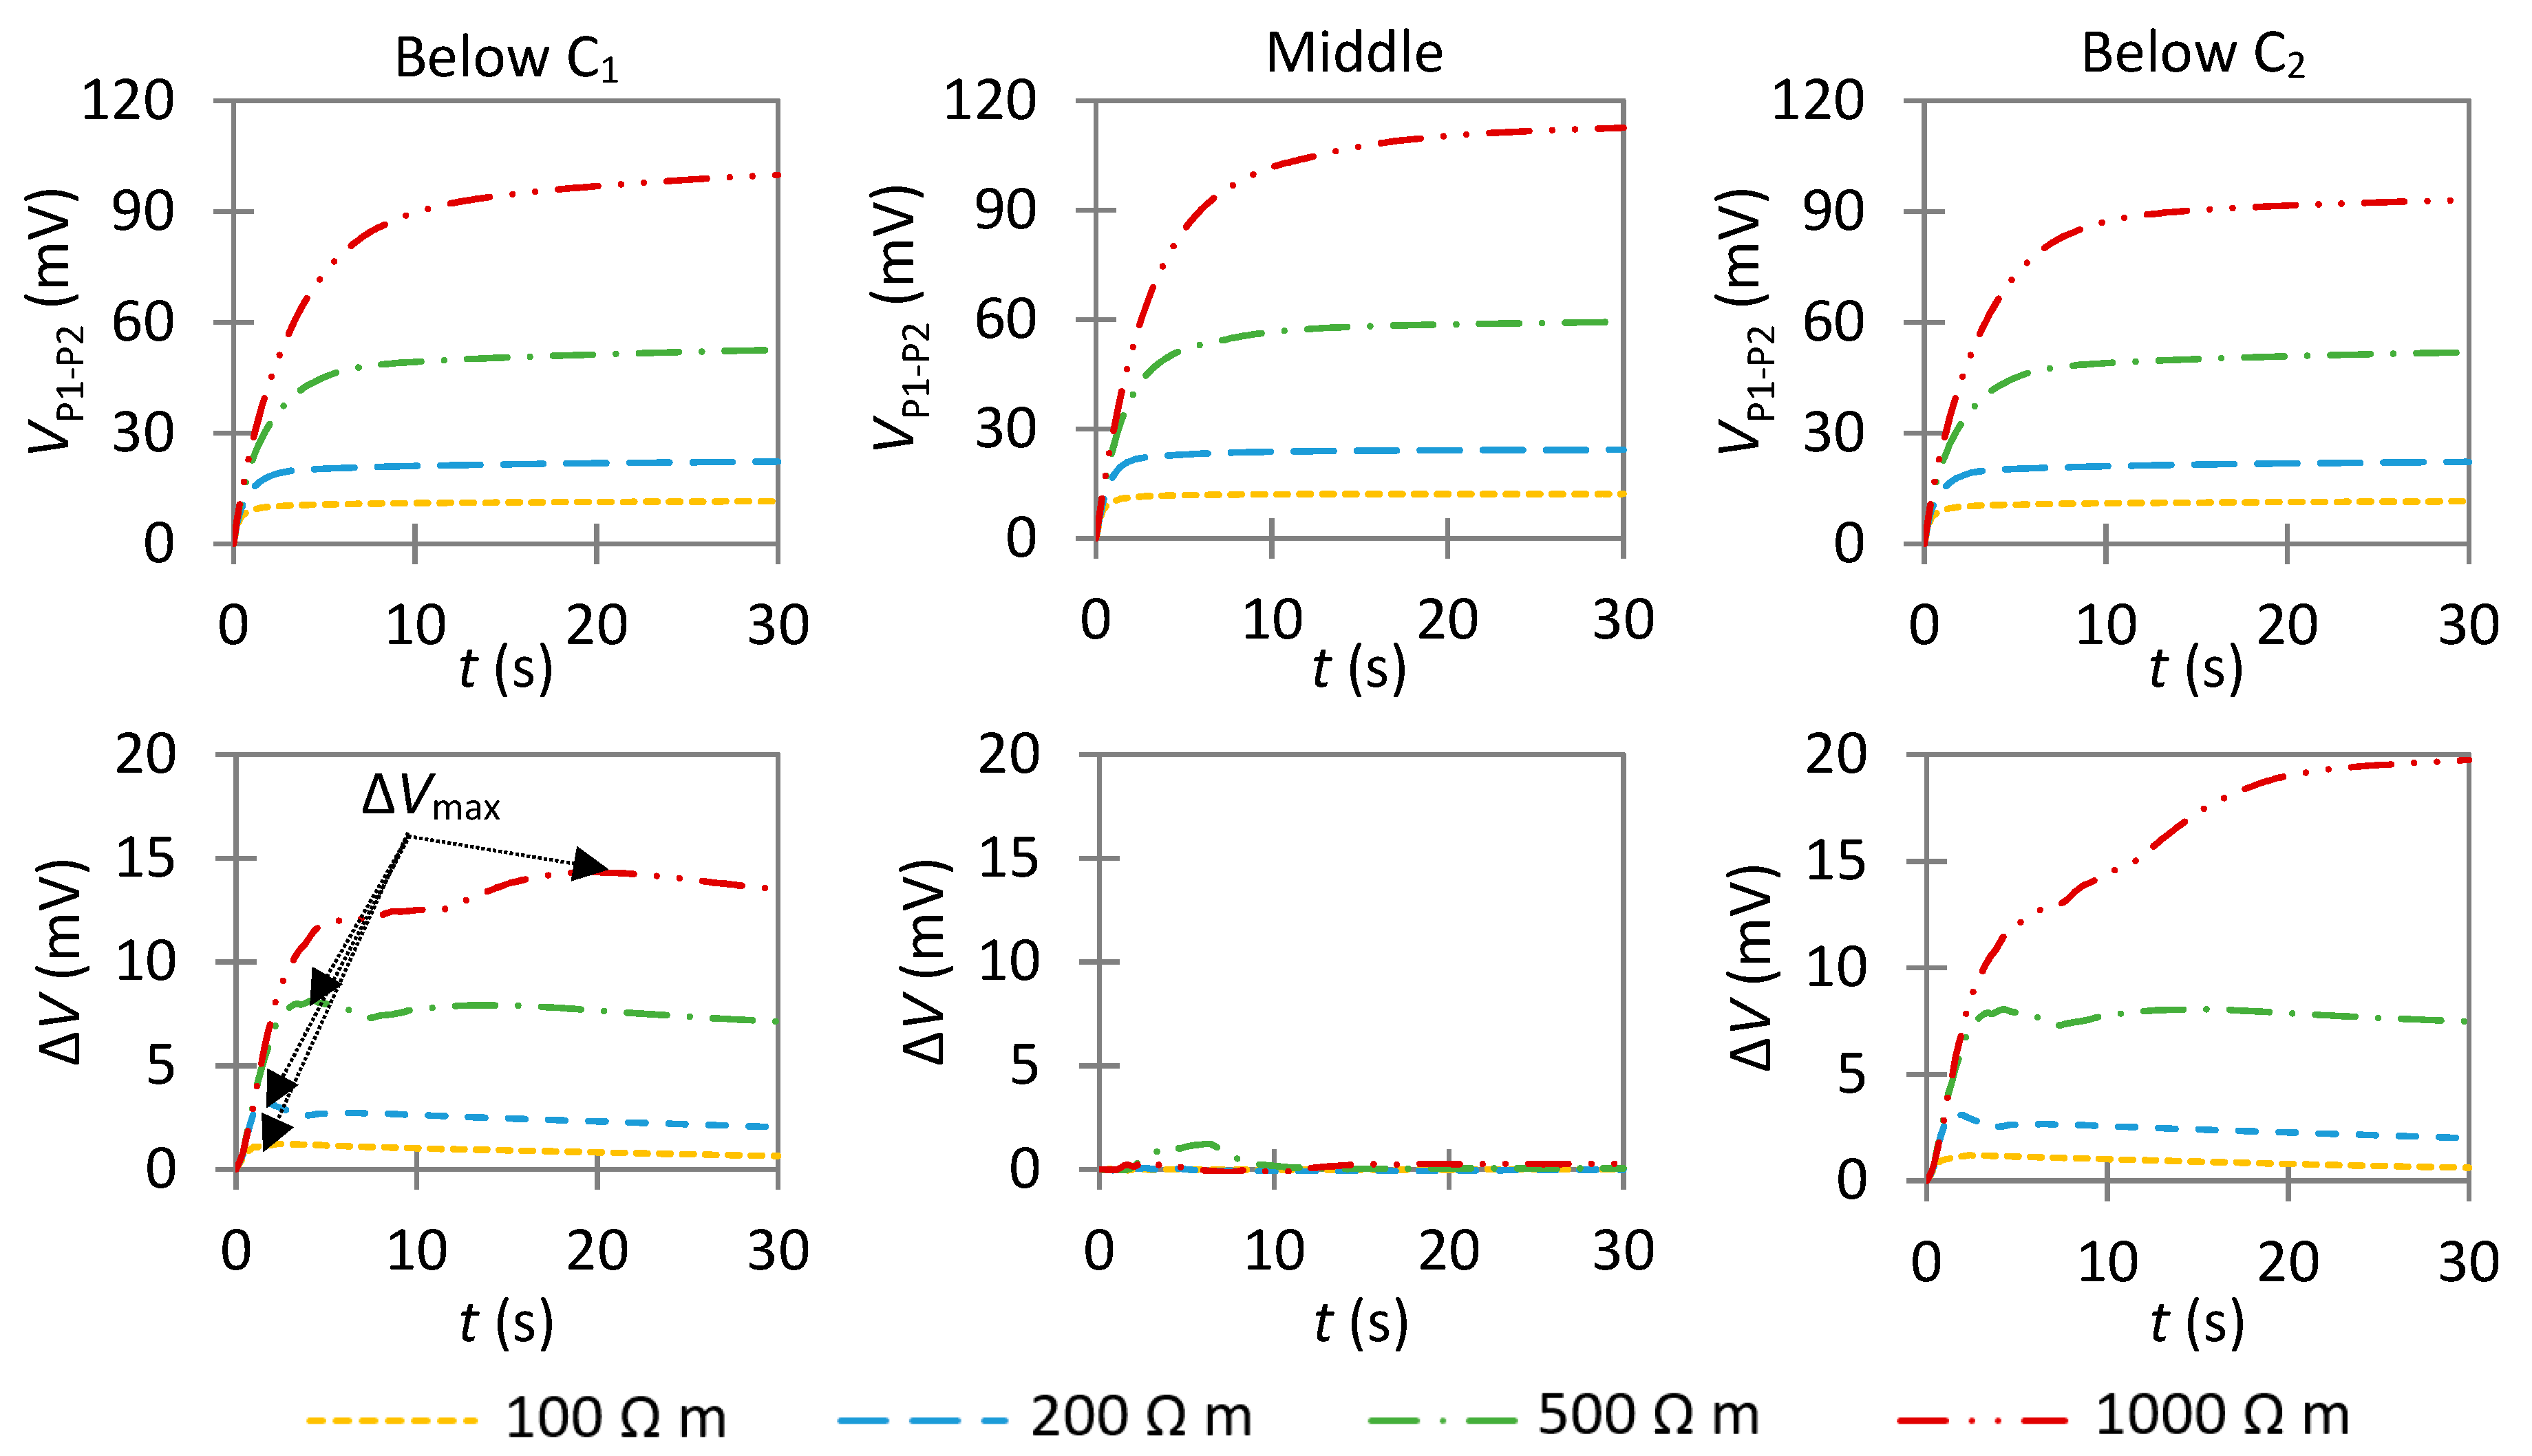
The anode length was then increased to 3 cm (Figure 11). The stronger effect of the anode on VP1−P2 is still observed for the highest resistivity, for which VP1−P2 is clearly lower than the reference state. This is the case when the anode is below C1Vmax ≃ 23 mV) or below C2Vmax ≃ 31 mV at 30 s). The main difference with the small anode is observed when the anode is centered between P1 and P2, as significant value of ΔV are observed. The effect of the anode is, however, still lower than that observed when it is located below one of the current electrodes, as ΔVmax < 6 mV when ρ = 1000 Ω m.
The middle of the current probes (and of the potential probes in Wenner configuration) corresponds to a point where the total current on the rebar is null (Figure S7 and Reference [35]). As a result, if a small anode is in this area, only a small part of the current will flow in it, as it was already observed for La = 1 cm in Figure 10, so the potential difference VP1−P2 is almost as if there was no anode. With increasing anode length, more current will flow through it, so the presence of the anode has a significant effect on VP1−P2.
It must be noted that ΔV remains constant close to its maximum values at the steady-state potential when the anode is centered between P1 and P2, which is different than what it is observed when the anode is below one of the current electrodes (C1). It is thus possible to estimate the position of the highly corroding area by comparing both ΔVmax values and ΔV at the steady-state potential for each measurement position.
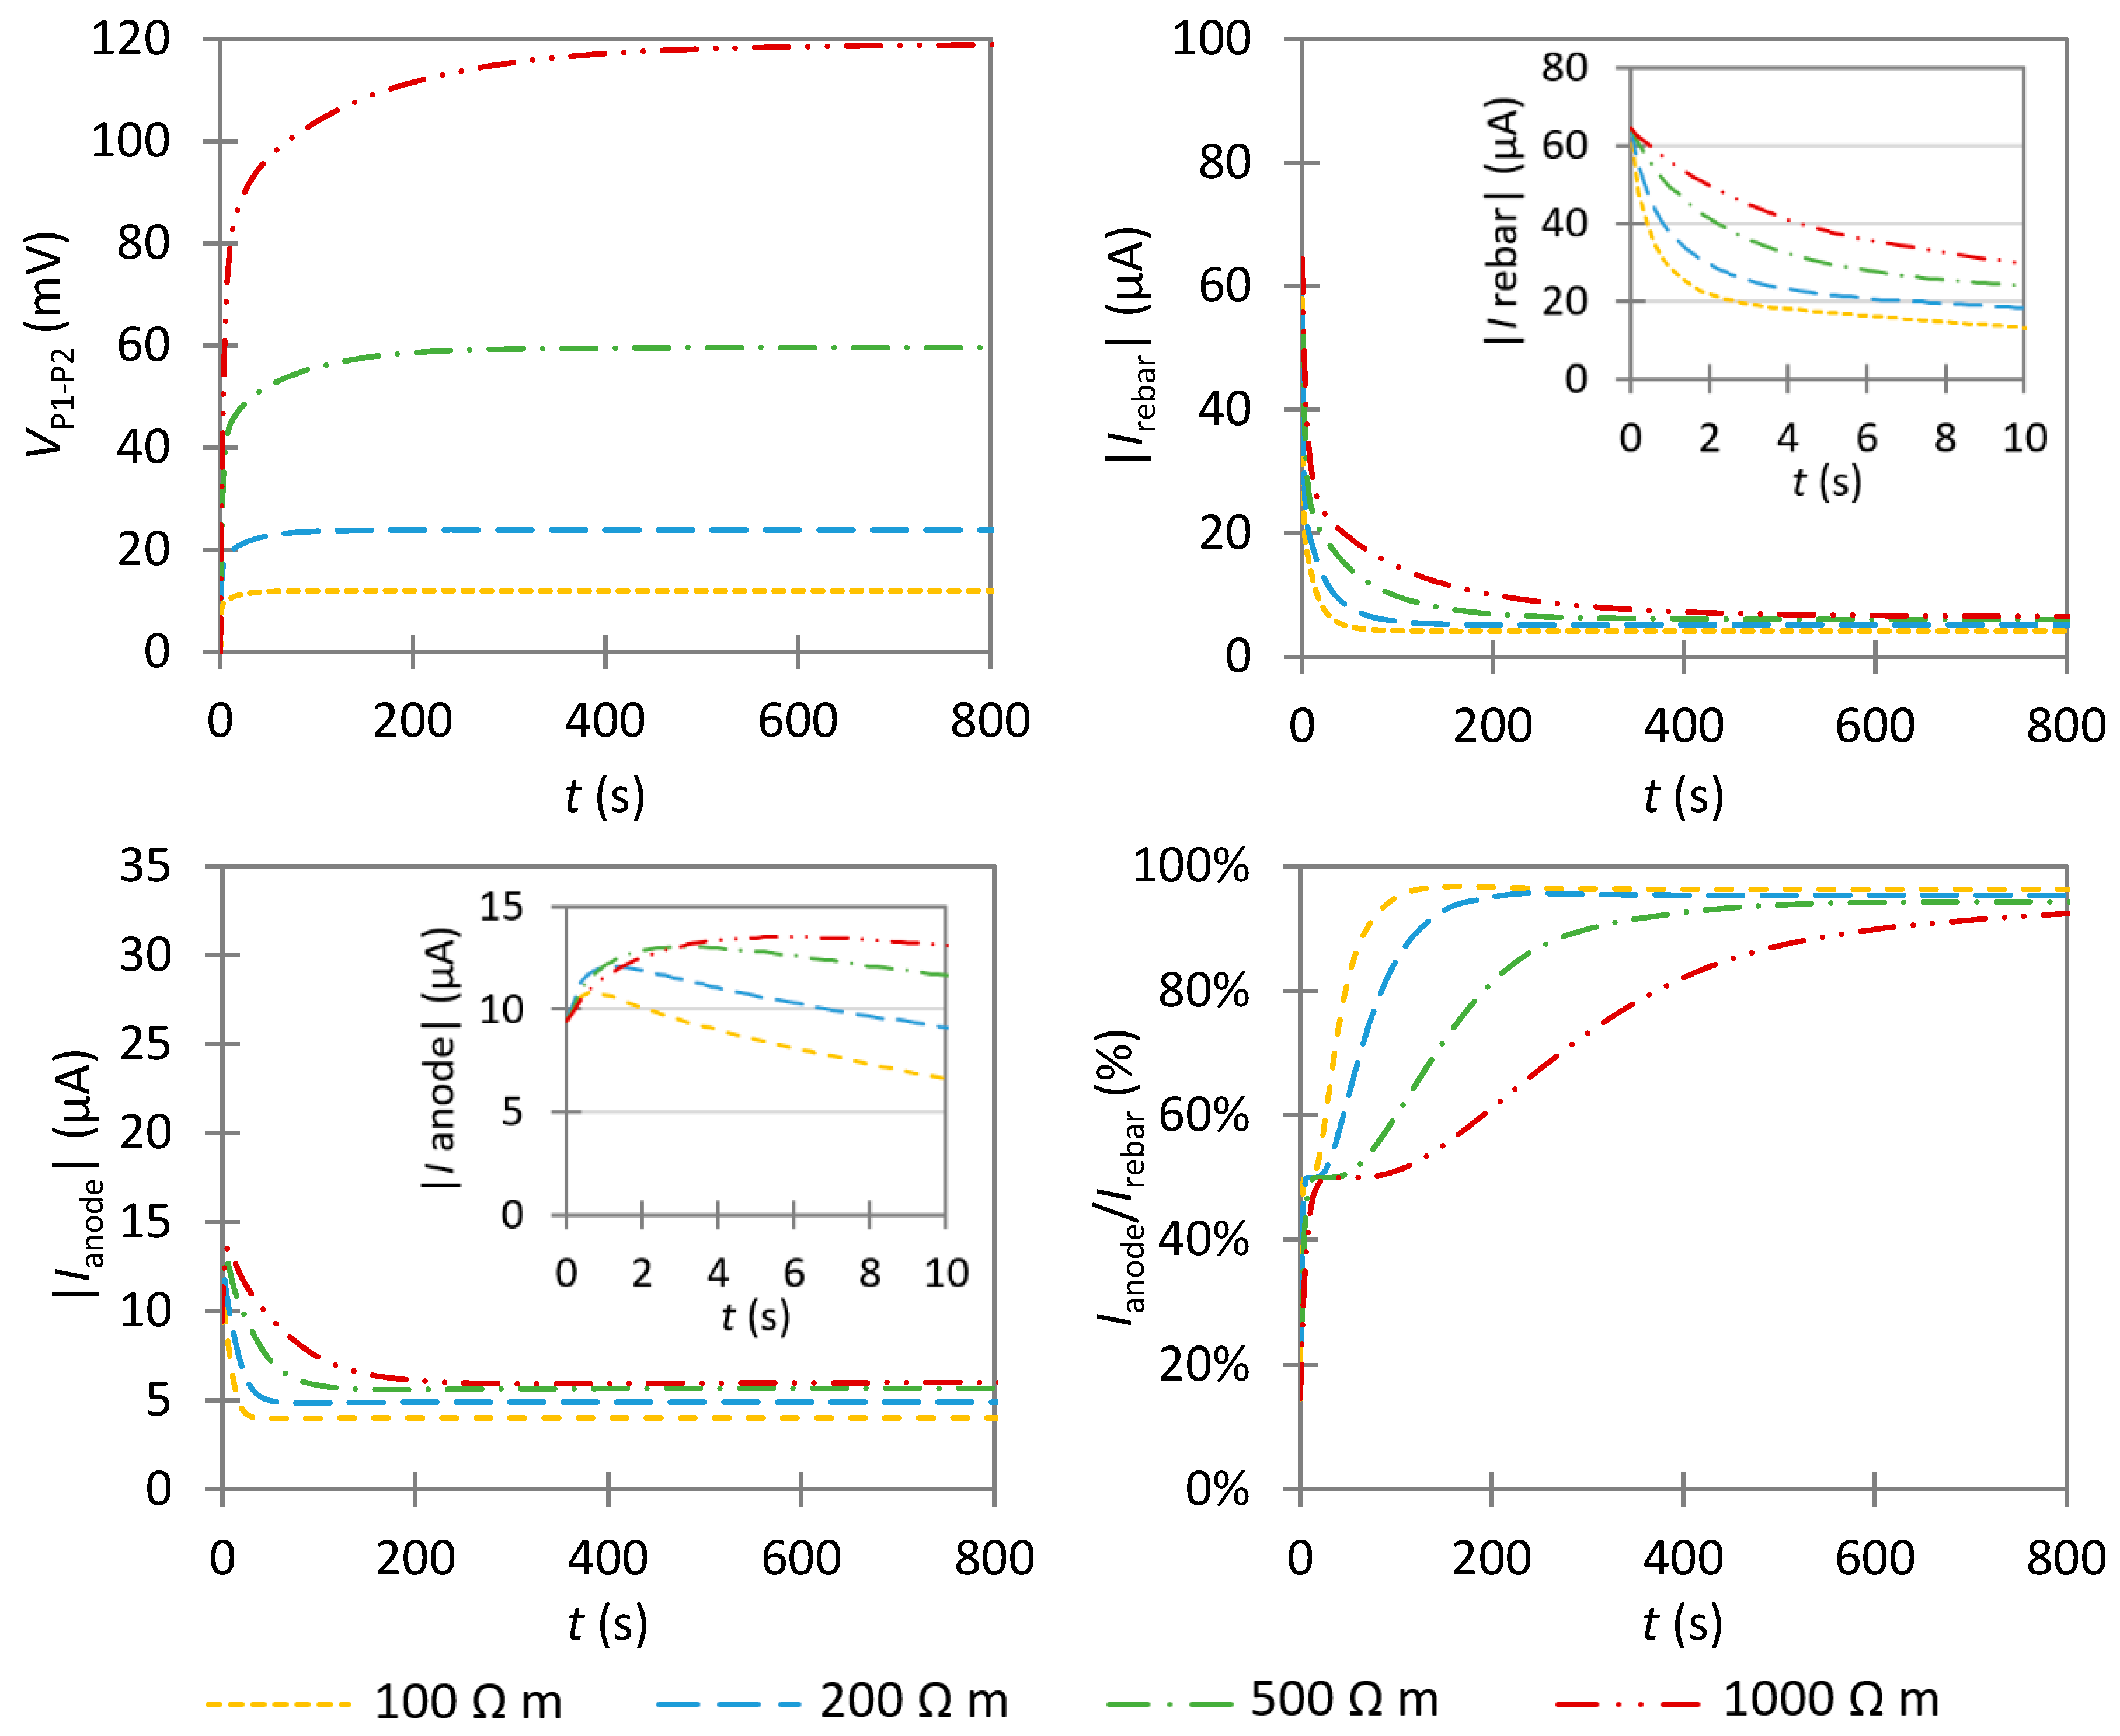
To obtain further insight into the physical aspects of monitoring non-uniform corrosion, the simulations were continued up to 800 s. We focused on the results obtained when the anode is below C1 (Figure 12). The results show that the time to reach the steady state when the anode is below one of the current electrodes increases with increasing concrete resistivity. Especially when the anode is below C1, it increases from about 50 s for ρ = 100 Ω m to over 600 s for ρ = 1000 Ω m. In this last case, this is longer than the time needed for reaching the steady state for a passive rebar (Figure S3). Hence, the experimental results presented in Figure 4e indicate the non-uniform corrosion of the rebar, which is expected after locally introducing chlorides through wetting/drying cycles.
The presence of the highly corroding area disturbs the current distribution in the entire material. Right after the instantaneous ohmic drop, the total current in the rebar rapidly decreases, whereas the current at the anode slightly increases. The higher the concrete resistivity, the longer and the more the current in the anode increases. After reaching a maximum value, the current in the anode progressively decreases before reaching a constant value. With increasing injection time, it becomes easier for the current to flow within the concrete than in the rebar, especially when concrete resistivity is low, which explains the decrease of the current in the anodic area.
Hence, it seems that a fraction of the current polarizing the cathodic areas is first redirected to the anodic area, as the latter has the lowest resistance in the system, before being partly redirected to concrete domain, with a magnitude that depends on concrete resistivity. This behavior slows down the current decrease in the anodic area and in the entire rebar, which explains why the time required for reaching the steady-state potential is higher for non-uniform corrosion. Even when the current in the anode is stable, the current that polarized the rebar is still slowly decreasing. As indicated by the Ianode/Irebar ratio, over 90% of the current polarizes the anode in the steady state, with the highest values being obtained for ρ = 100 Ω m.
To support this hypothesis, the anodic area was divided into six identical areas of 5-mm length each, to analyze the current distribution in each section. The results obtained for ρ = 100 Ω m and 1000 Ω m are shown on Figure 13. At t0, the current is slightly higher for the central anodes (anodes 3 and 4) as they lie below C1, but the current increase in the first seconds is more important for the two external anodes (anodes 1 and 6), in agreement with a redirection of the current from adjacent cathodes. In addition, the decrease in current is slower for the most eccentric anode relative to the device (anode 1).
Another interesting result observed in Figure 10 and Figure 11 is the difference in VP1−P2 evolution obtained when the anode is below C1 or C2, notably when ρ = 1000 Ω m. This signal dissymmetry can be related to the difference in current distribution. It is shown that a higher current, in absolute values, flows in the anode when it is located below C2. This effect is attributed to the difference in the anodic charge-transfer coefficient αa between the anode and the cathode, as the system is symmetric when the same αa value is input in both anodic and cathodic areas (Figure S8). The current distribution at the steel/concrete interface is affected by the current direction, as both anode and cathode have a different capability for consuming anodic or cathodic current, depending on the value of this charge-transfer coefficient. Notably, as indicated by the Ianode/Irebar ratio, the percentage of the current on the anode is clearly lower when the anode is below C2. Reversing the polarity during the measurement may thus help in differentiating the electrochemical parameters of the rebar: the greater the dissymmetry, the more the charge-transfer coefficients are different between anode and cathode. However, this behavior is mainly observed for ρ = 500 and 1000 Ω m, which limits its interest for highly resistive concrete. For the lowest resistivities, as there is less resistance to current flow in the concrete, the total current polarizing the rebar decreases rapidly to values below 6 µA. Hence, irrespective of the polarity direction, there is almost no difference between the two sides as the potential difference induced by anode polarization rapidly becomes insignificant.

4.3.3. Influence of the Probe Spacing

If the sensitivity of the technique to localized corrosion was assessed by modifying the anode length, this parameter is in fact unknown in RC structures. In practice, only the probe spacing can be adjusted as the other parameters, such as cover depth, rebar diameter, or electrochemical condition of the rebar, are the main characteristics of the investigated structures. Thus, we had to determine if varying the probe spacing will modify the sensitivity of the technique.
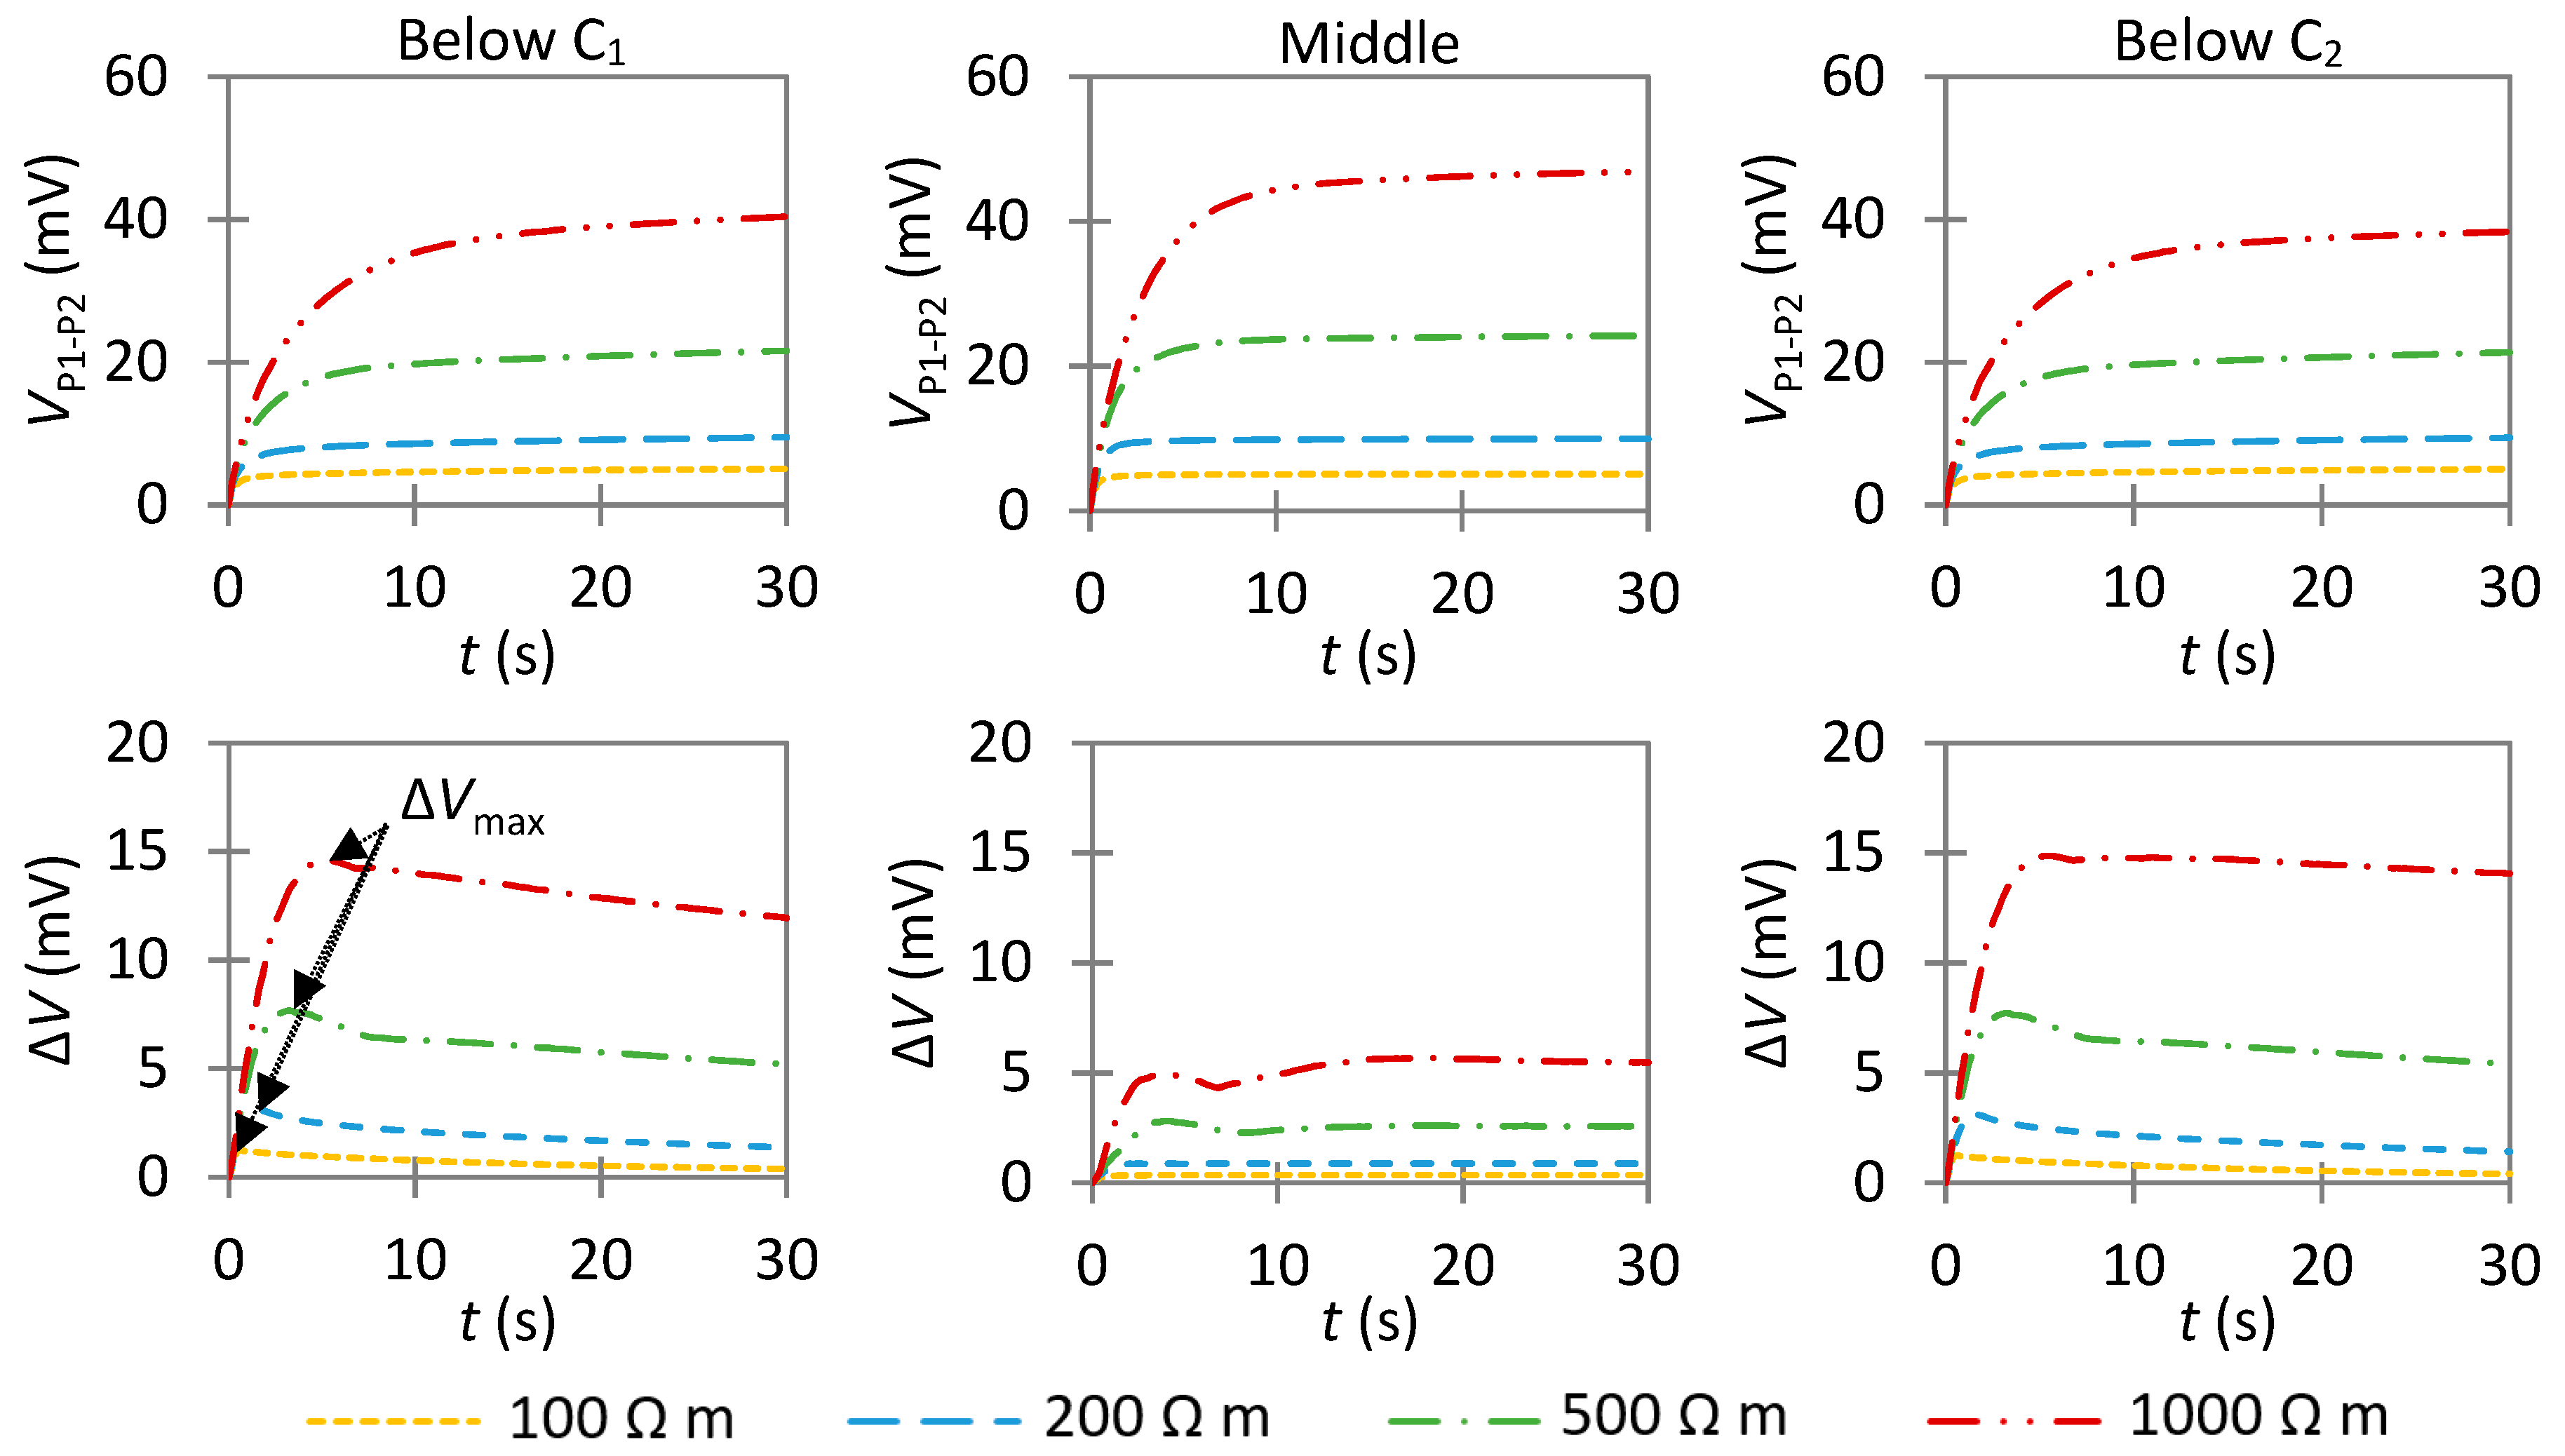
The probe spacing was first reduced to 2.5 cm (Figure 14). The values of ΔVmax are less important when the anode is below C1 or C2 than those obtained for a = 5 cm, as ΔVmax ≃14.7 mV here. This can be explained by a decrease of the current that polarizes the rebar at t0 when decreasing the probe spacing. The evolution of ΔV over time when the anode below C1 or C2 is also more similar, irrespective of concrete resistivity, indicating that the system is more symmetric.
As observed for a = 5 cm, the difference with the passive rebar becomes small again when gradually moving the anode away from the current probes (Figure S5C). But, here, ΔV is lower at 7.5 cm from C1 as the anode is less polarized. Hence, reducing the probe spacing increases the “internal” sensitivity but also decreases the “external” sensitivity of the indirect GP technique.
The probe spacing was then increased to 15 cm (Figure 15). The results obtained with this probe spacing show some similarities with those obtained for e = 5 cm and La = 1 cm (Figure 10), despite that a longer time is required to reach the quasi-steady-state here. There is almost no difference from the reference passive state when the anode is centered between P1 and P2, notably for the lowest resistivities. In this case, the technique is not sensitive to the presence of a highly corroding area of 3 cm. A small difference is still observed for ρ = 500 or 1000 Ω m, but it remains lower than 1.2 mV. As shown on Figure S9, the anode length must be higher than 5 cm to observe a significant effect when the anode is centered between C1 and C2.
The distribution of the current density along the rebar can help defining the sensitivity of the device according to probe spacing. As shown on Figure S7, there is a point of zero-current density on the rebar at the center of C1 and C2, which corresponds to the point of sign inversion of the current density, and to two points of maximum current density just below the current electrodes. In between, the current density increases from zero to its maximum value at a rate that increases with decreasing probe spacing. As a result, the current fraction that polarizes the central area under the device decreases when increasing the probe spacing. Conversely, polarization is important away from the current electrodes as a longer part of the rebar is polarized; even when the anode is 7.5, 15, or even 30 cm distant from C1, it still has a significant effect on the measured VP1−P2 (Figure S5D).
To sum up, an increase in the probe spacing decreases the “internal” sensitivity and increases the “external sensitivity” of the technique, as well as increases the time required to reach the steady-state potential. Nevertheless, irrespective of probe spacing, the most important difference with the reference passive state is observed when the anode lies below one of the current probes as it is the main polarized area.

4.3.4. Influence of the Double-Layer Capacitance of the Anode

The effect of the double-layer capacitance was investigated by considering a hypothetical case in which the exchange current density of the anodic and cathodic areas is equal (i0 = 10−5 A m−2). The objective was to separate the contribution of Cdl from the other input parameters. We considered only one anodic length of 3 cm and one probe spacing of 5 cm. Cdl was fixed at 0.2 F m−2 for the cathode and at 2 F m−2 for the anode, and the results were compared to the reference state at 0.2 F m−2. As Cdl is higher, a longer time to reach the steady-state potential is expected when the anode is polarized in the sensitivity area of the device.
The results for a = 5 cm are presented on Figure 16. The most pronounced effect is observed when the anode is below one of the current electrodes, confirming once again that this corresponds to the area of maximum sensitivity. Irrespective of concrete resistivity, the maximum difference ΔVmax is observed before 10 s, when Cdl,a = 2 F m−2. The difference is lower for ρ = 100 Ω m (ΔVmax < 2 mV) than for ρ = 1000 Ω m (ΔVmax > 15 mV). After this maximum value, the difference progressively tends to 0, in agreement with the similar exchange current densities between anodic and cathodic areas.
In practice, both the exchange current density and the double-layer capacitance of the anodic area can be different than those of the passive areas. Thus, we verified the combined effect of i0 and Cdl on VP1−P2 (Figure 17). These results are compared to those obtained in Figure 11 and Figure 16. There is only a small increase in ΔVmax (<1 mV) as compared to the results obtained with the same value of Cdl in the entire rebar (Figure 11). Thus, increasing Cdl by one order of magnitude has a limited effect on VP1−P2 for a small anode in highly corroding state.
Hence, a similar value of Cdl can be applied in the entire rebar without causing a significant error in the determination of ΔVmax. We do not exclude that another conclusion can be drawn in other conditions, for example, for a more uniform corrosion morphology in which the anode can be several centimeters long, with a lower exchange current density, as it can be expected for carbonation-induced corrosion.

5. Discussion

5.1. Rebar Effect on the Instantaneous Ohmic Drop

As shown in Section 4.2.1, the instantaneous ohmic drop obtained on reinforced concrete is not only related to concrete resistivity but also results from a rebar effect [75,76]. The latter originates from the fact that the measured resistivity in a four-probe configuration corresponds to an apparent resistivity, which is an integrated value of local resistivities from the concrete surface to a set depth. In the presence of rebar, the apparent resistivity represents a weighted contribution of concrete and steel rebar, the latter being much more conductive than concrete at high frequencies. Expressed as percentages, we showed that the rebar effect is not affected by changes in the injected current or in concrete resistivity. However, it is stronger when there is an increase in probe spacing a or in rebar diameter Φ or a decrease in cover depth e. This agrees with other studies that showed that measurements of concrete resistivity in Wenner configuration are affected by cover depth, probe direction, probe spacing, and rebar spacing [77,78,79,80,81,82,83]. Concrete thickness is also a major factor affecting measurement in the case of thin slabs [80]. However, rebar diameter has only a limited impact.
Each measurement made in front of a rebar in four-electrode configuration must then be corrected to determine the true concrete resistivity ρcor from the apparent resistivity ρcalc. Garzon et al. [70] proposed to correct the conventional geometric factor used in Wenner configuration (Equation (7)) by adding two correction factors: a shape factor fs that accounts for the finite size of the element and a rebar factor fb that accounts for the presence of rebar (Equation (10)):
k = f s f b 2 π a .
They defined the values of fs and fb for some geometries, i.e., prismatic, cylindrical, and slab specimens with specific dimensions, in the absence and presence of one rebar. For other configurations, their parameters cannot be used, and the general procedure presented in our study must be reproduced. First, one must accurately evaluate the specimen size by determining the geometric factor. This is done by a numerical simulation of unreinforced concrete with the accurate dimension and probe spacing. Then, the percentage of underestimation in the presence of rebar must be determined by a numerical simulation of reinforced concrete with the accurate dimension, cover depth, rebar diameter, and probe spacing. The input values for concrete resistivity and electrochemical parameters do not matter as they do not influence this percentage. Finally, Equation (11) determines the corrected apparent resistivity:
ρ corr = ρ calc 1 %   of   underestimation 100 .
We also observed in uniform corrosion that the instantaneous ohmic drop is independent of the electrochemical state of the steel/concrete interface, i.e., of i0, Eeq, α, and Cdl values. This aspect is important as it allows calculating the concrete resistivity without knowing the electrochemical condition of the rebar, which is the case when making measurements on RC structures. This finding is quite opposite from the results in Reference [84], where Nguyen et al. concluded, from both numerical simulations and experiments, that the electrochemical state of rebar affects the resistivity drop. Concerning their simulations, the time at which they evaluated the ohmic drop is not specified. As they observed almost no resistivity drop for a passive rebar in low-resistive concrete (100 Ω m), we believe that their study was done in stationary mode, i.e., at steady state. Consequently, they considered not only the ohmic drop but also the temporal evolution of the current distribution related to the polarization of the rebar. Hence, the absence of resistivity drop can be related to the fact that almost all the current polarizes the concrete at steady state, as shown in Figure 7, as a passive rebar acts mainly as a current insulator at low frequencies. Still, it can be possible to differentiate active and passive corrosion by using an intermediate frequency (5 Hz in their study) as the current distribution is already different between the two cases, but the measured potential does not correspond only to the instantaneous ohmic drop.
Experimentally, the measurement frequency is a major parameter that must be defined for a correct determination of concrete resistance. Impedance spectroscopy is necessary for determining the frequency at which the imaginary part of the impedance (reactance) is least for correctly assessing the concrete resistance. When measurements are done with a direct current, further investigations must determine if this minimum reactance can be defined by analyzing the temporal evolution of VP1−P2 acquired at high sampling rate.

5.2. Ability of Indirect GP to Detect Localized Corrosion in Wenner Configuration

The numerical simulations done in this study have demonstrated the ability of the indirect GP method to detect localized corrosion of steel in concrete with a uniform resistivity, by considering the difference in variation of the transient potential over time. Based on all results, we can estimate the length of a localized corroding area by considering the difference in “internal” sensitivity of this probe configuration depending on probe spacing. As for the half-cell potential technique [85], it seems more appropriate to consider the potential gradients and not the absolute values. Here, we propose using the maximum difference value observed over the injection time, ΔVmax, for each position of the monitoring device.
For this, we must first determine the evolution of ΔV with time for each measurement position using Equation (5), which can be used if the impressed current is similar for all measurements and if the concrete resistivity profile is (almost) uniform in the investigated area. Otherwise, the data must be normalized by concrete resistivity to make them comparable. In practice, the reference state used in this study for calculating ΔV, i.e., a fully passive rebar, will be unknown in most cases. Nonetheless, it is possible to use the signal with the highest values of VP1−P2 for each measurement time as the reference value for calculating ΔVmax. Afterwards, ΔVmax can be reported as a function of measurement position. Different scenarios are then expected from the different patterns obtained for ΔVmax along the rebar (Figure 18):
  • Case A: If ΔVmax is close to 0 in the middle of two well-defined—but not necessarily symmetric—peaks, it is the result of a much smaller anode than the probe spacing (La << a);
  • Case B: As La increases, the value of ΔVmax in the middle of the two peaks also increases. As indicated by further simulations (Figure S10), it becomes similar to the value of the peaks when La ≃ 1.5–2a for e = 40 mm;
  • Case C: If ΔVmax is high over a large section with a maximum value close to its center, it is the result of an anode larger than the probe spacing (La > 2a). This indicates a large actively corroding section of the rebar; and
  • Case D: If ΔVmax remains around 0, it is the result of uniform corrosion along the investigated area. It can either represent a fully passive rebar, a passive rebar with an anode with a low exchange current density, or an actively corroding rebar if the considered reference state also corresponds to active corrosion. If ΔVmax is similar along the rebar and different than 0, this indicates an actively corroding rebar with a passive reference state.
These scenarios only consider the presence of one anode in the investigated area, and different results are expected in the case of multiple anodes, depending on their relative positions. If they are far away from the current electrodes, they will not have any influence on VP1−P2. If they are located below or near the current probes, all of them will influence VP1−P2. However, it will not be possible to differentiate each anode as the results will only reflect an average value of the contributions of each anode. It will not be possible to estimate the length of each anode, but it will always be possible to locate highly corroding areas and to classify them according to the values of ΔVmax and, thus, to their relative corrosion state. It is expected that comparing the results obtained with several probe spacings will yield further insight into the distribution of the anodic areas along the rebar.

5.3. Comparison of Indirect GP with Indirect EIS

Alexander and Orazem showed the ability of indirect EIS to detect localized corrosion in post-tensioned tendons with uniform resistivity [31,32]. They concluded that highly corroding areas can be located if they are below the current-injecting electrodes or directly adjacent to an electrode array. In this case, two distinct time constants can be observed for non-uniform corrosion instead of only one time constant for uniform corrosion [32], attributing the high-frequency response to the corroding section and the low-frequency one to passive regions. Otherwise, almost no sign of active corrosion was detected, especially when the corroding area lay below the potential probes in Wenner configuration. With the indirect GP technique, we cannot draw such a conclusion from only one measurement as there is no reactance for this DC method. However, even with indirect EIS, several measurements are needed to determine the corrosion rate along rebar as the system is heterogeneous. Hence, this aspect cannot be considered as a drawback of the pulse technique for the monitoring of RC structures.
As already stated, Alexander and Orazem also concluded that the sensitivity of the indirect EIS method for localizing non-uniform corrosion depends upon the length of the highly corroding area, the magnitude of the exchange current density, and the resistivity of the cement-based material [32]. These conclusions also are valid for the indirect GP technique, showing the similarity of the results obtained with these two techniques (also shown by comparing Figure 4 and Figure S1C,D). The indirect GP method has the advantage of being less time consuming than the indirect EIS one, which seems more practical for the monitoring of RC structures. However, in the conventional three-electrode configuration, EIS is a powerful technique for mechanistic investigations of the corrosion process [86,87]. It is then expected that more information could be obtained from the indirect EIS method that might improve our understanding of the macrocell corrosion mechanism. The development of both techniques is then important for improving the monitoring of corrosion of steel in concrete.

5.4. Towards a Quantification of the Corrosion Rate in Non-Uniform Corrosion?

Though our study aimed at determining the ability of indirect GP to qualitatively detect localized corrosion, this technique may also be useful for a quantitative determination of the corrosion rate from the steady-state potential value. Most of the previous studies have proposed the use of an equivalent electrical circuit (EEC) for modeling the system in the four-electrode configuration [20,28,30,31,34,35]. For example, one EEC considers several resistances in series and parallel for representing the contact resistances, the resistance to current flow from the concrete alone (parallel to the rebar, i.e., the bulk resistance), and the resistance in the path through the concrete perpendicular to the rebar (i.e., the surface resistance) [30,35]. The steel/concrete interface is represented by one resistance and one capacitance in parallel, as is traditionally done for modeling Rp and Cdl, respectively, using the traditional Randles circuit. In this case, only an average value of the polarization resistances of the rebar can be obtained. This approach is then suitable for uniform corrosion as only one time constant is observed, as shown in References [31,32] and in Figure S1C,D on a passive rebar.
However, in the case of non-uniform corrosion, it should be more appropriate to consider a Randles circuit with at least two time constants for differentiating the two different areas, in agreement with the results from the indirect EIS technique [31,32]. This approach can be helpful for the qualitative location of highly corroding areas, depending on which EEC better fits the results. If it is the Randles circuit with only one time constant, then the anode has no influence on the potential response and cannot be detected. Conversely, if a Randles circuit with more than one time constant better fits the results, this indicates that the anode has an influence on the potential response and could be detected.
One of the main difficulties in assessing the corrosion rate is related to the importance of the charge-transfer coefficient α on the current distribution at the steel/concrete interface over time and on the conversion of the corrosion current density. This aspect is not specific to the four-electrode configuration as it already exists in the three-electrode one. Here, we considered only one value of α for the anode and one for the cathode, based on the recommended B values (26 mV for active corrosion and 52 mV for passive corrosion) [60]. However, the βa and βc values reported in the literature can be inconsistent with this recommendation [88]. Thus, we considered hypothetical cases of uniform corrosion with different i0, ranging from 10−5 to 0.1 A m−2, either with αa = 0.5 (B = 26 mV) or αa = 0.012 (B = 50 mV). As shown on Figure S11, the anodic-charge coefficient also influences the steady-state potential in uniform corrosion. This is especially the case when i0 and ρ are increased, as a greater part of the current polarizes the rebar. Without knowing the charge-transfer coefficients, an error will be introduced during calculation of the corrosion rate. However, according to experimental values of βa and βc in the literature [5,48,49,88,89], this error should be a factor of 10 at most when the charge-transfer coefficients are unknown.

5.5. Implication for Practical Applications on RC Structures

This study provides theoretical insights on the indirect GP technique based on numerical simulations, but some perspectives for its application on existing structures can be defined. The indirect GP technique could be included in a general procedure aiming at evaluating corrosion [2]. First, a visual inspection is required for defining the locations for testing. Before making any measurements, the position and diameter of the rebar must be determined for determining the position of the electrical measuring device. This is generally done with ground-penetrating radar (GPR) or other electromagnetic techniques [90,91]. In addition to the rebar position, it is possible to estimate simultaneously the rebar diameter and cover thickness with high accuracy [92].
Currently, the most common electrical methods used for the assessment of corrosion are based on measuring the half-cell potential and concrete resistivity. It has been shown the good ability of using both techniques in combination for assessing the probability of corrosion [93,94]. However, these techniques do not provide a direct quantification of the effective corrosion rate. If commercial devices and recommendation exist for measuring the polarization resistance in real structures [54], its determination is still very rare in practice, mainly because it requires sophisticated equipment [95]. The indirect GP technique could thus be integrated in the overall monitoring strategy as (i) it allows the detection of anodic areas without any connection to the rebar, (ii) it provides surface potential and concrete resistivity, and (iii) it can provide quantitative information on the corrosion rate, as already demonstrated for uniform corrosion [9,35].
However, some parameters must be accurately defined as they must affect the measurement. First, two types of fluctuation can be expected when using electrical methods. The first are related to self-potential, i.e., electrochemical potential and streaming potential generated by the movement of ions in concrete. Ideally, the potential electrodes should be non-polarizable (solid-state Ag/AgCl or Cu/CuSO4 electrodes) with a small diameter to limit such disturbances. The self-potential variation must be considered accurately as, otherwise, it could be difficult to differentiate a steady state from a ‘quasi-steady-state’. The second type of fluctuation is related to electrochemical noise, causing stochastic pulses associated with the corrosion process, but its effect is more limited as the associated signal amplitude generally is low. To evaluate experimental noise and increase data quality, measurements must be repeated several times in the same place to obtain an average value.
Contact resistances between the electrodes and the concrete surface may also influence the measurement [66]. This parameter must be evaluated before any measurement by determining the imposed voltage between C1 and C2. To reduce theses resistances, a good electrolytic contact is required, but special attention must be paid to ensure that all measurements are performed under comparable conditions. Otherwise, additional errors may be introduced in the measured potential difference because of variation in water and ionic content.
Finally, we only considered the presence of one rebar, and we defined the “longitudinal” sensitivity of the potential probes according to probe spacing. However, RC structures are composed of a rebar mesh. As several rebars can be polarized simultaneously, the “lateral” sensitivity of the potential probes must be assessed, by investigating the effect of the rebar spacing, to define the distance at which a highly corroding area on an adjacent rebar can influence the measurement over another rebar. As proposed above, it will be appropriate to analyze the results by comparing the relative values of ΔVmax, in three dimensions, to gain more insight into the position and distribution of the anodic areas along the different rebars.

5.6. Necessity of Electrical/Electrochemical Tomography

As shown in the different simulations, concrete resistivity has a major influence on the current distribution within the concrete volume and at the steel/concrete interface. An accurate determination of concrete resistivity is thus needed for correctly interpreting the results for assessing steel corrosion. Though, in our study, concrete resistivity is assumed homogeneously distributed in the concrete domain, we must recall that concrete is inherently heterogeneous by nature. To consider this point, an electrical resistivity tomography (ERT) is necessary [96,97]. Such measurements are generally done with a multi-electrode device for determining first the apparent resistivities at specific depths in the concrete volume. Pseudo-sections of the true resistivities are obtained with an inversion algorithm, which is not presented here. Several commercially available geophysical software systems exist for determining true resistivity values from apparent ones. However, as many reconstruction algorithms exist in electrical tomography, further investigations of RC structures are required so that inversion models will converge toward realistic pseudo-sections of true resistivities [98].
Still, many advances have been done for characterizing transport properties in cement-based materials, as highlighted in details in Reference [98]. For example, ERT can be used for determining the ingress of water and aggressive ions into concrete [99,100,101,102,103], which can be helpful for assessing both initiation and propagation stages of corrosion. However, as many phenomena are susceptible to occur simultaneously on RC structures, further studies are required to determine first the influence of each phenomenon separately in order to separate the contribution of each parameter on the resistivity profile. Notably, the influence of the variability in the degree of water saturation needs to be elucidated as it would theoretically lead to an infinite number of solutions obtained from Wenner data. One advantage that has been highlighted recently is the fact that ERT directly accounts for the rebar effect as this is no longer observed on true resistivity values [68]. Hence, the correcting factors presented in Section 5.1 are no longer required with this approach, and concrete resistivity can be determined irrespective of the sample geometry.
A similar inverse method must be developed to quantify the corrosion rate from the surface potential VP1−P2. This would allow to spatially distribute the variation of the corrosion rate to consider accurately the localized aspect of corrosion of steel in concrete. As concrete resistivity can be determined with the instantaneous ohmic drop using the indirect GP technique, a single multi-electrode device can be used for determining the distribution of both resistivity in concrete and of polarization resistance along the rebar. Considering the inherent heterogeneities of both concrete and steel will improve the diagnosis of the service life of RC structures. The use of a multi-electrode device has other advantages for monitoring the corrosion rate. For example, when large RC structures must be investigated, measurements can be very time-consuming, and a multi-electrode device can simultaneously measure the potential difference between pairs of electrodes to reduce the total duration of measurement and to limit the variation of environmental factors. In addition, as shown previously, varying the probe spacing and position may help in locating small anodes and their position and estimating their length.
In this study, we only considered the Wenner configuration for locating highly corroding areas as this is the conventional configuration for measuring concrete resistivity. Though this configuration has a good sensitivity to vertical changes, it has a low sensitivity to horizontal changes [104]. In that case, a dipole-dipole array can be a useful alternative due to its good lateral resolution; this configuration is especially interesting for decreasing the rebar effect observed on the apparent resistivity when the measurement is done parallel to the rebar, as the potential probes are not directly located in the effectively polarized area. The obtained potential difference will then be attenuated compared to the one obtained in Wenner configuration, which will provide further insight into the size and position of highly corroding areas. In addition to these traditional electrode arrays, recent studies (e.g., References [105,106]) have shown the interest of optimizing electrode positions to control the image resolution, in order to improve the reliability of the measurements and the quality of the reconstruction process. Hence, by using several probe configurations and spacings, complementary data will be obtained for increasing the data quality and spatial resolution of the results.

6. Conclusions

The main conclusions are summarized as follows:
(1)
Sample geometry is an important parameter when performing any experiments or numerical simulations. An accurate geometric factor must be determined case-by-case, depending on specimen size and probe spacing, to convert concrete resistance into concrete resistivity.
(2)
The instantaneous ohmic drop is largely affected by the presence of rebar that acts initially as a short-circuit. This rebar effect decreases the value of concrete resistivity, especially when the measurement is done right above the rebar. It mainly depends on the probe spacing, the cover depth, and the geometry of the slab. It was also shown that the electrochemical state of the rebar has no influence on the rebar effect; thus, it is possible to calculate a corrective factor for an accurate determination of concrete resistivity irrespective of the corrosion state, which is the case when making measurements on RC structures.
(3)
Contrary to the conventional GP technique in three-electrode configuration, the steady-state potential obtained with the indirect GP technique is not only representative of the polarization resistance but also of concrete resistance.
(4)
In non-uniform corrosion, VP1−P2 increases slower as compared to passive corrosion. This is essentially due to the different capability of anodic and cathodic areas of consuming the impressed current. Hence, the anode has a greater effect on the transient potential than on the steady-state potential. Thus, it is preferable to examine the temporal evolution of VP1−P2 to qualitatively detect the presence of a highly corroding area.
(5)
The effect of the anode differs depending on its position relative to the monitoring device. It was shown that (i) corroding areas can mainly be located when they are below or in the vicinity of the current electrodes, and (ii) the area below the center of the device is almost not polarized irrespective of concrete resistivity. Hence, by adjusting the probe spacing, highly corroding areas will be either detected or not, depending on their position. This specificity should be helpful for estimating the position and length of highly corroding areas, which is one of the main problems when making any measurements on RC structures.
Further experiments are required to confirm the different scenarios observed numerically in this study and to determine the applicability and efficiency of the technique for everyday practice in real structures. Future studies should also be focused on the development of electrical tomography with inverse methods to quantify the corrosion rates from the surface potential VP1−P2 in non-uniform corrosion, in order to spatially distribute both concrete resistivities and corrosion rates in the material to improve the diagnosis of RC structures.

Supplementary Materials

Supplementary data are available online at https://www.mdpi.com/2624-5558/1/3/18/s1. Table S1: Initial values of the current that polarizes the rebar and the potential difference VP1−P2, corresponding to the ohmic drop, for each input parameters, and the resistivity calculated from VP1−P2 and the total impressed current (IC1 = 100 µA) using Equation (6), considering the accurate geometric factor. Similar results were obtained in both active corrosion (i0 = 0.1 A m−2) and passive corrosion (i0 = 10−5 A m−2), which indicates that the instantaneous ohmic drop is independent on the electrochemical state of the rebar. However, a small difference between the two electrochemical states (3.3%) was observed for a = 2.5 cm, Table S1bis: Effect of the impressed current on the ohmic drop and the calculated concrete resistivity. Initial values of the current that polarizes the rebar and the potential difference VP1−P2, corresponding to the ohmic drop, for each input parameters, and the resistivity calculated from VP1−P2 and the total impressed current using Equation (6), considering the accurate geometric factor. In agreement with Ohm’s law, there is no effect of the value of the impressed current on concrete resistance, and thus on concrete resistivity, Figure S1: (A) Evolution of VP1−P2 with time in the case of a small unreinforced specimen showing only an ohmic drop, indicating that the polarization observed on reinforced specimen is related to the rebar. (B) Evolution of V with time obtained in the three-electrode configuration using the GP technique for the passive rebar with I = 5 µA. The results indicate that the quasi-steady-state is far from being reached after 100 s in this configuration. (C) Influence of the distance of the monitoring device from the rebar with a = 15 cm using indirect EIS technique for the passive rebar. 0 cm = measurements above and parallel to the rebar. The further the monitoring device is from the rebar, the higher the measured apparent concrete resistivity and the lower the measured apparent polarization resistance. (D) Influence of the probe spacing on the potential response using the indirect EIS technique for the passive rebar. The increase in the probe spacing decreases the measured apparent resistivity (at high frequency) and increases the measured polarization resistance (at low frequency). Only a small difference is observed between 10 cm and 15 cm for the apparent resistivity due to the small size of the element, which affects the distribution of the current in the material (border effects), Figure S2: Evolution of Irebar and VP1−P2 when considering uniform corrosion, in active (i0,a = 0.1 A m−2) or passive states (i0,c = 10−5 A m−2) with Cdl = 0.2 F m−2, Figure S3: Evolution of VP1−P2 and Irebar during 800 s for a passive rebar. Input parameters: i0 = 10−5 A m−2, a = 5 cm, e = 40 mm, Φ = 12 mm, Cdl = 0.2 F m−2, IC1 = 100 µA. The time required to reach the steady state increases when increasing concrete resistivity, Figure S4: Evolution of VP1−P2 and ΔV over time in the presence of a slightly corroding area at different positions relative to the monitoring device. Input parameters: i0,a = 10−4 A m−2, i0,c = 10−5 A m−2, La = 3 cm, a = 5 cm, e = 40 mm, Cdl = 0.2 F m−2, IC1 = 100 µA, Figure S5: (A) Evolution of VP1−P2 and ΔV over time in the presence of a highly corroding area at different positions relative to the monitoring device. Input parameters: i0,a = 0.1 A m−2, i0,c = 10−5 A m−2, La = 1 cm, a = 5 cm, e = 40 mm, Cdl,a = Cdl,c = 0.2 F m−2, IC1 = 100 µA, (B) Evolution of VP1−P2 and ΔV over time in the presence of a highly corroding area at different positions relative to the monitoring device. Input parameters: i0,a = 0.1 A m−2, i0,c = 10−5 A m−2, La = 3 cm, a = 5 cm, e = 40 mm, Cdl,a = Cdl,c = 0.2 F m−2, IC1 = 100 µA, (C) Evolution of VP1−P2 and ΔV over time in the presence of a highly corroding area at different positions relative to the monitoring device. Input parameters: i0,a = 0.1 A m−2, i0,c = 10−5 A m−2, La = 3 cm, a = 2.5 cm, e = 40 mm, Cdl,a = Cdl,c = 0.2 F m−2, IC1 = 100 µA, (D) Evolution of VP1−P2 and ΔV over time in the presence of a highly corroding area at different positions relative to the monitoring device. Input parameters: i0,a = 0.1 A m−2, i0,c = 10−5 A m−2, La = 3 cm, a = 15 cm, e = 40 mm, Cdl,a = Cdl,c = 0.2 F m−2, IC1 = 100 µA, Figure S6: Influence of the impressed current IC1 on ΔV when the anode is below C1 for ρ = 100 or 200 Ω m. ΔVmax increases when increasing IC1, which allows a better detection of the highly corroding area, Figure S7: Effect of the probe spacing on the distribution of the normal current density, evaluated here at 0.2 s, along the upper ridge of the rebar (the most polarized ridge). Input parameters: i0,a = 0.1 A m−2, i0,c = 10−5 A m−2, ρ = 200 Ω m, La = 3 cm, e = 40 mm, Cdl,a = Cdl,c = 0.2 F m−2, IC1 = 100 µA. The figure (b) is a zoom on the central part of the rebar, where the length La and position of the anode are indicated, Figure S8: (A) Evolution of VP1−P2, Irebar, Ianode, and Ianode/Irebar over time when the anode is below C2. Input parameters: i0,a = 0.1 A m−2, i0,c = 10−5 A m−2, La = 3 cm, a = 5 cm, e = 40 mm, Cdl,a = Cdl,c = 0.2 F m−2, IC1 = 100 µA. (B) Evolution of VP1−P2, Ianode and ΔV over time when the anode is below C1 or below C2, considering the same anodic charge transfer coefficient for anodic and cathodic areas (αa = 0.012). Input parameters: i0,a = 0.1 A m−2, La = 3 cm, a = 5 cm, e = 40 mm, Cdl = 0.2 F m−2, IC1 = 100 µA; (C) Evolution of VP1−P2, Ianode and ΔV over time when the anode is below C1 or C2, considering the same anodic charge transfer coefficient for anodic and cathodic areas (αa = 0.5). Input parameters: i0,a = 0.1 A m−2, La = 3 cm, a = 5 cm, e = 40 mm, Cdl = 0.2 F m−2, IC1 = 100 µA, Figure S9: Evolution of VP1−P2 and ΔV over time in the presence of a highly corroding area centred between P1 and P2, for several length La. Input parameters: i0,a = 0.1 A m−2, i0,c = 10−5 A m−2, a = 15 cm, e = 40 mm, Cdl,a = Cdl,c = 0.2 F m−2, IC1 = 100 µA, Figure S10: (A) Evolution of VP1−P2 and ΔV over time in the presence of a highly corroding area at different positions relative to the monitoring device. Input parameters: i0,a = 0.1 A m−2, i0,c = 10−5 A m−2, La = 5 cm, a = 5 cm, e = 40 mm, Cdl = 0.2 F m−2, IC1 = 100 µA; (B) Evolution of VP1−P2 and ΔV over time in the presence of a highly corroding area at different positions relative to the monitoring device. Input parameters: i0,a = 0.1 A m−2, i0,c = 10−5 A m−2, La = 7.5 cm, a = 5 cm, e = 40 mm, Cdl = 0.2 F m−2, IC1 = 100 µA, (C) Evolution of VP1−P2 and ΔV over time in the presence of a highly corroding area at different positions relative to the monitoring device. Input parameters: i0,a = 0.1 A m−2, i0,c = 10−5 A m−2, La = 10 cm, a = 5 cm, e = 40 mm, Cdl = 0.2 F m−2, IC1 = 100 µA. Here, ΔVmax is greater when the anode is at the middle of the device, (D) Evolution of VP1−P2 and ΔV over time in the presence of a highly corroding area at different positions relative to the monitoring device. Input parameters: i0,a = 0.1 A m−2, i0,c = 10−5 A m−2, La = 15 cm, a = 5 cm, e = 40 mm, Cdl = 0.2 F m−2, IC1 = 100 µA, Figure S11: (A) Influence of the anodic charge transfer coefficient of the cathode αa,c on the evolution of VP1−P2 over time in uniform corrosion. Left: αa,c = 0.012; right: αa,c = 0.5. Input parameters: i0 = 10−5 A m−2, a = 5 cm, e = 40 mm, Cdl = 0.2 F m−2, IC1 = 100 µA. (B) Influence of the anodic charge transfer coefficient of the cathode αa,c on the evolution of VP1−P2 over time in uniform corrosion. Left: αa,c = 0.012; right: αa,c = 0.5. Input parameters: i0 = 10−4 A m−2, a = 5 cm, e = 40 mm, Cdl = 0.2 F m−2, IC1 = 100 µA, (C) Influence of the anodic charge transfer coefficient of the cathode αa,c on the evolution of VP1−P2 over time in uniform corrosion. Left: αa,c = 0.012; right: αa,c = 0.5. Input parameters: i0 = 10−3 A m−2, a = 5 cm, e = 40 mm, Cdl = 0.2 F m−2, IC1 = 100 µA, (D) Influence of the anodic charge transfer coefficient of the cathode αa,c on the evolution of VP1−P2 over time in uniform corrosion. Left: αa,c = 0.012; right: αa,c = 0.5. Input parameters: i0 = 10−2 A m−2, a = 5 cm, e = 40 mm, Cdl = 0.2 F m−2, IC1 = 100 µA, (E) Influence of the anodic charge transfer coefficient of the cathode αa,c on the evolution of VP1−P2 over time in uniform corrosion. Left: αa,c = 0.012; right: αa,c = 0.5. Input parameters: i0 = 0.1 A m−2, a = 5 cm, e = 40 mm, Cdl = 0.2 F m−2, IC1 = 100 µA.

Author Contributions

Conceptualization, R.R., S.G., J.G., I.I., and S.B.; Methodology, R.R.; Software, R.R.; Formal Analysis, R.R.; Investigation, R.R.; Resources, S.G., J.G., I.I., and S.B.; Data Curation, R.R.; Writing—Original Draft Preparation, R.R., S.B.; Writing—Review & Editing, R.R., S.G., J.G., I.I., and S.B.; Visualization, R.R.; Supervision, S.G., J.G., I.I., and S.B.; Project Administration, J.G. and S.B.; Funding Acquisition, J.G. and S.B. All authors have read and agreed to the published version of the manuscript.

Funding

This research was funded by IRIS Instruments and BRGM as part of the IRIS Béton project.

Acknowledgments

H.M. Kluijver edited the English version of an intermediate version of this manuscript.

Conflicts of Interest

The authors declare no conflict of interest.

References

  1. Angst, U.M. Challenges and opportunities in corrosion of steel in concrete. Mater. Struct. 2018, 51, 4. [Google Scholar] [CrossRef] [Green Version]
  2. Rodrigues, R.; Gaboreau, S.; Gance, J.; Ignatiadis, I.; Betelu, S. Reinforced concrete structures: A review of corrosion mechanisms and advances in electrical methods for corrosion monitoring. Constr. Build. Mater. 2021, 121240. [Google Scholar] [CrossRef]
  3. Ahmad, S. Reinforcement corrosion in concrete structures, its monitoring and service life prediction—A review. Cem. Concr. Compos. 2003, 25, 459–471. [Google Scholar] [CrossRef]
  4. Nasser, A.; Clément, A.; Laurens, S.; Castel, A. Influence of steel—Concrete interface condition on galvanic corrosion currents in carbonated concrete. Corros. Sci. 2010, 52, 2878–2890. [Google Scholar] [CrossRef]
  5. Sohail, M.G.; Laurens, S.; Deby, F.; Balayssac, J.P. Significance of macrocell corrosion of reinforcing steel in partially carbonated concrete: Numerical and experimental investigation. Mater. Struct. 2015, 48, 217–233. [Google Scholar] [CrossRef]
  6. Warkus, J.; Raupach, M. Modelling of reinforcement corrosion—Geometrical effects on macrocell corrosion. Mater. Corros. 2009, 61, 494–504. [Google Scholar] [CrossRef]
  7. González, J.A.; Molina, A.; Escudero, M.L.; Andrade, C. Errors in the electrochemical evaluation of very small corrosion rates—I. Polarization resistance method applied to corrosion of steel in concrete. Corros. Sci. 1985, 25, 917–930. [Google Scholar] [CrossRef]
  8. Pereira, E.V.; Salta, M.M.; Fonseca, I.T.E. On the measurement of the polarisation resistance of reinforcing steel with embedded sensors: A comparative study. Mater. Corros. 2015, 66, 1029–1038. [Google Scholar] [CrossRef]
  9. Fahim, A.; Ghods, P.; Isgor, O.B.; Thomas, M.D.A. A critical examination of corrosion rate measurement techniques applied to reinforcing steel in concrete. Mater. Corros. 2018, 69, 1784–1799. [Google Scholar] [CrossRef]
  10. Stern, M.; Geary, A.L. Electrochemical polarization. J. Electrochem. Soc. 1957, 104, 56. [Google Scholar] [CrossRef]
  11. Angst, U.; Büchler, M. On the applicability of the Stern-Geary relationship to determine instantaneous corrosion rates in macro-cell corrosion. Mater. Corros. 2015, 66, 1017–1028. [Google Scholar] [CrossRef]
  12. Angst, U.; Büchler, M. A new perspective on measuring the corrosion rate of localized corrosion. Mater. Corros. 2020, 71, 808–823. [Google Scholar] [CrossRef]
  13. Wojtas, H. Determination of corrosion rate of reinforcement with a modulated guard ring electrode; analysis of errors due to lateral current distribution. Corros. Sci. 2004, 46, 1621–1632. [Google Scholar] [CrossRef]
  14. Feliu, S.; González, J.A.; Miranda, J.M.; Feliu, V. Possibilities and problems of in situ techniques for measuring steel corrosion rates in large reinforced concrete structures. Corros. Sci. 2005, 47, 217–238. [Google Scholar] [CrossRef]
  15. Poursaee, A.; Hansson, C.M. Galvanostatic pulse technique with the current confinement guard ring: The laboratory and finite element analysis. Corros. Sci. 2008, 50, 2739–2746. [Google Scholar] [CrossRef]
  16. Nygaard, P.V.; Geiker, M.R.; Elsener, B. Corrosion rate of steel in concrete: Evaluation of confinement techniques for on-site corrosion rate measurements. Mater. Struct. 2009, 42, 1059–1076. [Google Scholar] [CrossRef]
  17. Clément, A.; Laurens, S.; Arliguie, G.; Deby, F. Numerical study of the linear polarisation resistance technique applied to reinforced concrete for corrosion assessment. Eur. J. Environ. Civ. Eng. 2012, 16, 491–504. [Google Scholar] [CrossRef]
  18. Laurens, S.; Hénocq, P.; Rouleau, N.; Deby, F.; Samson, E.; Marchand, J.; Bissonnette, B. Steady-State polarization response of chloride-induced macrocell corrosion systems in steel reinforced concrete—Numerical and experimental investigations. Cem. Concr. Res. 2016, 79, 272–290. [Google Scholar] [CrossRef]
  19. Gepraegs, O.; Hansson, C. A comparative evaluation of three commercial unstruments for field measurements of reinforcing steel corrosion rates. J. ASTM Int. 2005, 2. [Google Scholar] [CrossRef]
  20. Monteiro, P.J.M.; Morrison, F.; Frangos, W. Non-Destructive measurement of corrosion state of reinforcing steel in concrete. ACI Mater. J. 1998, 95, 704–709. [Google Scholar] [CrossRef]
  21. Zhang, J.; Monteiro, P.J.M.; Morrison, H.F. Experimental and theoretical study of reinforced concrete corrosion using impedance measurements. Long Term Durab. Struct. Mater. 2001, 71–84. [Google Scholar] [CrossRef]
  22. Zhang, J.; Monteiro, P.J.M.; Morrison, H.F. Noninvasive surface measurement of corrosion impedance of reinforcing bar in concrete—Part 1: Experimental results. ACI Mater. J. 2001, 98, 116–125. [Google Scholar] [CrossRef]
  23. Zhang, J.; Monteiro, P.J.M.; Morrison, H.F. Noninvasive surface measurement of corrosion impedance of reinforcing bar in concrete—Part 2: Forward modeling. ACI Mater. J. 2002, 99, 242–249. [Google Scholar] [CrossRef]
  24. Hubbard, S.S.; Zhang, J.; Monteiro, P.J.M.; Peterson, J.E.; Rubin, Y. Experimental detection of reinforcing bar corrosion using nondestructive geophysical techniques. ACI Mater. J. 2003, 100, 501–510. [Google Scholar] [CrossRef]
  25. Zhang, J.; Monteiro, P.J.M.; Morrison, H.F.; Mancio, M. Noninvasive surface measurement of corrosion impedance of reinforcing bar in concrete—Part 3: Effect of geometry and material properties. ACI Mater. J. 2004, 101, 273–280. [Google Scholar]
  26. Keddam, M.; Nóvoa, X.R.; Vivier, V. The concept of floating electrode for contact-less electrochemical measurements: Application to reinforcing steel-bar corrosion in concrete. Corros. Sci. 2009, 51, 1795–1801. [Google Scholar] [CrossRef]
  27. Keddam, M.; Nóvoa, X.R.; Puga, B.; Vivier, V. Impedance based method for non-contact determination of the corrosion rate in buried metallic structures. Eur. J. Environ. Civ. Eng. 2011, 15, 1097–1103. [Google Scholar] [CrossRef]
  28. Lim, Y.-C.; Noguchi, T.; Shin, S.-W. Formulation of a nondestructive technique for evaluating steel corrosion in concrete structures. ISIJ Int. 2009, 49, 275–283. [Google Scholar] [CrossRef] [Green Version]
  29. Lim, Y.-C.; Noguchi, T.; Shin, S. Corrosion evaluation by estimating the surface resistivity of reinforcing bar. J. Adv. Concr. Technol. 2010, 8, 113–119. [Google Scholar] [CrossRef]
  30. Yu, J.; Sasamoto, A.; Iwata, M. Wenner method of impedance measurement for health evaluation of reinforced concrete structures. Constr. Build. Mater. 2019, 197, 576–586. [Google Scholar] [CrossRef]
  31. Alexander, C.L.; Orazem, M.E. Indirect electrochemical impedance spectroscopy for corrosion detection in external post-tensioned tendons: 1. Proof of concept. Corros. Sci. 2020, 164, 108331. [Google Scholar] [CrossRef]
  32. Alexander, C.L.; Orazem, M.E. Indirect impedance for corrosion detection of external post-tensioned tendons: 2. Multiple steel strands. Corros. Sci. 2020, 164, 108330. [Google Scholar] [CrossRef]
  33. Andrade, C.; Martínez, I.; Castellote, M. Feasibility of determining corrosion rates by means of stray current-induced polarisation. J. Appl. Electrochem. 2008, 38, 1467–1476. [Google Scholar] [CrossRef]
  34. Andrade, C.; Sanchez, J.; Martinez, I.; Rebolledo, N. Analogue circuit of the inductive polarization resistance. Electrochimica Acta 2011, 56, 1874–1880. [Google Scholar] [CrossRef]
  35. Fahim, A.; Ghods, P.; Alizaded, R.; Salehi, M.; Decarufel, S. CEPRA: A new test method for rebar corrosion rate measurement. Adv. Electrochem. Tech. Corros. Monit. Lab. Corros. Meas. 2019, STP1609, 59–80. [Google Scholar] [CrossRef]
  36. Warkus, J.; Raupach, M.; Gulikers, J. Numerical modelling of corrosion—Theoretical backgrounds. Mater. Corros. 2006, 57, 614–617. [Google Scholar] [CrossRef]
  37. Warkus, J.; Raupach, M. Modelling of reinforcement corrosion—Corrosion with extensive cathodes. Mater. Corros. 2006, 57, 920–925. [Google Scholar] [CrossRef]
  38. Otieno, M.B.; Beushausen, H.D.; Alexander, M.G. Modelling corrosion propagation in reinforced concrete structures—A critical review. Cem. Concr. Compos. 2011, 33, 240–245. [Google Scholar] [CrossRef]
  39. Isgor, O.B.; Razaqpur, A.G. Modelling steel corrosion in concrete structures. Mater. Struct. 2006, 39, 291–302. [Google Scholar] [CrossRef]
  40. Chalhoub, C.; François, R.; Garcia, D.; Laurens, S.; Carcasses, M. Macrocell corrosion of steel in concrete: Characterization of anodic behavior in relation to the chloride content. Mater. Corros. 2020. [Google Scholar] [CrossRef]
  41. Ožbolt, J.; Oršanić, F.; Balabanić, G.; Kušter, M. Modeling damage in concrete caused by corrosion of reinforcement: Coupled 3D FE model. Int. J. Fract. 2012, 178, 233–244. [Google Scholar] [CrossRef]
  42. Samson, G.; Deby, F.; Garciaz, J.-L.; Lassoued, M. An alternative method to measure corrosion rate of reinforced concrete structures. Cem. Concr. Compos. 2020, 112, 103672. [Google Scholar] [CrossRef]
  43. Fahim, A. Corrosion of Reinforcing Steel in Concrete: Monitoring Techniques and Mitigation Strategies. Master’s Thesis, University of New Brunswick, Fredericton, NB, Canada, 2018. [Google Scholar]
  44. Ožbolt, J.; Balabanić, G.; Kušter, M. 3D numerical modelling of steel corrosion in concrete structures. Corros. Sci. 2011, 53, 4166–4177. [Google Scholar] [CrossRef]
  45. Hu, X.; Shi, C.; Liu, X.; Zhang, J.; de Schutter, G. A review on microstructural characterization of cement-based materials by AC impedance spectroscopy. Cem. Concr. Compos. 2019, 100, 1–14. [Google Scholar] [CrossRef]
  46. Leroy, P.; Hördt, A.; Gaboreau, S.; Zimmermann, E.; Claret, F.; Bücker, M.; Stebner, H.; Huisman, J.A. Spectral induced polarization of low-pH cement and concrete. Cem. Concr. Compos. 2019, 104, 103397. [Google Scholar] [CrossRef]
  47. Khajehnouri, Y.; Chouteau, M.; Rivard, P.; Bérubé, C.L. Measuring electrical properties of mortar and concrete samples using the spectral induced polarization method: Laboratory set-up. Constr. Build. Mater. 2019, 210, 1–12. [Google Scholar] [CrossRef]
  48. Ge, J.; Isgor, O.B. Effects of Tafel slope, exchange current density and electrode potential on the corrosion of steel in concrete. Mater. Corros. 2007, 58, 573–582. [Google Scholar] [CrossRef]
  49. Duprat, F.; Larrard, T.; Vu, N.T. Quantification of Tafel coefficients according to passive/active state of steel carbonation-induced corrosion in concrete. Mater. Corros. 2019, 70, 1934–1963. [Google Scholar] [CrossRef]
  50. Stefanoni, M.; Angst, U.M.; Elsener, B. Electrochemistry and capillary condensation theory reveal the mechanism of corrosion in dense porous media. Sci. Rep. 2018, 8, 7407. [Google Scholar] [CrossRef] [Green Version]
  51. Stefanoni, M.; Angst, U.M.; Elsener, B. Kinetics of electrochemical dissolution of metals in porous media. Nat. Mater. 2019, 18, 942–947. [Google Scholar] [CrossRef] [Green Version]
  52. Ji, Y.; Wu, M.; Tan, Z.; Gao, F.; Liu, F. Process control of reinforcement corrosion in concrete. Part 2: Time-Dependent dominating factors under different environmental conditions. Constr. Build. Mater. 2014, 73, 214–221. [Google Scholar] [CrossRef]
  53. Ji, Y.; Zhan, G.; Tan, Z.; Hu, Y.; Gao, F. Process control of reinforcement corrosion in concrete. Part 1: Effect of corrosion products. Constr. Build. Mater. 2015, 79, 214–222. [Google Scholar] [CrossRef]
  54. Andrade, C.; Alonso, C.; Gulikers, J.; Polder, R.; Cigna, R.; Vennesland, Ø.; Salta, M.; Raharinaivo, A.; Elsener, B. Test methods for on-site corrosion rate measurement of steel reinforcement in concrete by means of the polarization resistance method. Mater. Struct. 2004, 37, 623–642. [Google Scholar] [CrossRef]
  55. Stefanoni, M.; Angst, U.; Elsener, B. Corrosion rate of carbon steel in carbonated concrete—A critical review. Cem. Concr. Res. 2018, 103, 35–48. [Google Scholar] [CrossRef]
  56. Angst, U.M. Durable concrete structures: Cracks & corrosion and corrosion & cracks. In Proceedings of the 10th International Conference on Fracture Mechanics of Concrete and Concrete Structures (FraMCoS-X), Bayonne, France, 24–26 June 2019; pp. 1–10. [Google Scholar]
  57. Kranc, S.C.; Sagüés, A.A. Detailed modeling of corrosion macrocells on steel reinforcing in concrete. Corros. Sci. 2001, 43, 1355–1372. [Google Scholar] [CrossRef]
  58. Marchand, J.; Laurens, S.; Protière, Y.; Samson, E. A numerical study of polarization tests applied to corrosion in reinforced concrete. Spec. Publ. 2016, 312, 1–12. [Google Scholar]
  59. Chalhoub, C.; François, R.; Carcasses, M. Effect of cathode-anode distance and electrical resistivity on macrocell corrosion currents and cathodic response in cases of chloride induced corrosion in reinforced concrete structures. Constr. Build. Mater. 2020, 245, 118337. [Google Scholar] [CrossRef]
  60. Andrade, C.; Martínez, I. Techniques for measuring the corrosion rate (polarization resistance) and the corrosion potential of reinforced concrete structures. Non Destruct. Eval. Reinf. Concr. Struct. 2010, 284–316. [Google Scholar] [CrossRef]
  61. Hansson, C.M.; Poursaee, A.; Laurent, A. Macrocell and microcell corrosion of steel in ordinary Portland cement and high performance concretes. Cem. Concr. Res. 2006, 36, 2098–2102. [Google Scholar] [CrossRef]
  62. Poursaee, A.; Hansson, C.M. Potential pitfalls in assessing chloride-induced corrosion of steel in concrete. Cem. Concr. Res. 2009, 39, 391–400. [Google Scholar] [CrossRef]
  63. Revert, A.B.; Hornbostel, K.; De Weerdt, K.; Geiker, M.R. Macrocell corrosion in carbonated Portland and Portland-fly ash concrete—Contribution and mechanism. Cem. Concr. Res. 2019, 116, 273–283. [Google Scholar] [CrossRef] [Green Version]
  64. González, J.A.; Cobo, A.; González, M.N.; Feliu, S. On-Site determination of corrosion rate in reinforced concrete structures by use of galvanostatic pulses. Corros. Sci. 2001, 43, 611–625. [Google Scholar] [CrossRef]
  65. Glass, G.K.; Page, C.L.; Short, N.R.; Zhang, J.Z. The analysis of potentiostatic transients applied to the corrosion of steel in concrete. Corros. Sci. 1997, 39, 1657–1663. [Google Scholar] [CrossRef]
  66. Angst, U.M.; Elsener, B. On the applicability of Wenner method for resistivity measurements of concrete. ACI Mater. J. 2014, 111, 661–672. [Google Scholar] [CrossRef]
  67. Sengul, O.; Gjorv, O.E. Electrical resistivity measurements for quality control during concrete construction. ACI Mater. J. 2008, 105, 541–547. [Google Scholar] [CrossRef]
  68. Alhajj, M.A.; Palma-Lopes, S.; Villain, G. Accounting for steel rebar effect on resistivity profiles in view of reinforced concrete structure survey. Constr. Build. Mater. 2019, 223, 898–909. [Google Scholar] [CrossRef]
  69. Chen, C.-T.; Chang, J.-J.; Yeih, W. The effects of specimen parameters on the resistivity of concrete. Constr. Build. Mater. 2014, 71, 35–43. [Google Scholar] [CrossRef]
  70. Garzon, A.J.; Sanchez, J.; Andrade, C.; Rebolledo, N.; Menéndez, E.; Fullea, J. Modification of four point method to measure the concrete electrical resistivity in presence of reinforcing bars. Cem. Concr. Compos. 2014, 53, 249–257. [Google Scholar] [CrossRef]
  71. François, R.; Laurens, S.; Deby, F. Steel Corrosion in Reinforced Concrete. In Corrosion and Its Consequences for Reinforced Concrete Structures; Elsevier: London, UK, 2018; pp. 1–41. ISBN 978-1-78548-234-2. [Google Scholar]
  72. Angst, U.M.; Geiker, M.R.; Michel, A.; Gehlen, C.; Wong, H.; Isgor, O.B.; Elsener, B.; Hansson, C.M.; François, R.; Hornbostel, K.; et al. The steel-concrete interface. Mater. Struct. 2017, 50, 143. [Google Scholar] [CrossRef]
  73. Angst, U.M.; Geiker, M.R.; Alonso, M.C.; Polder, R.; Isgor, O.B.; Elsener, B.; Wong, H.; Michel, A.; Hornbostel, K.; Gehlen, C.; et al. The effect of the steel-concrete interface on chloride-induced corrosion initiation in concrete: A critical review by RILEM TC 262-SCI. Mater. Struct. 2019, 52, 88. [Google Scholar] [CrossRef]
  74. Hornbostel, K.; Elsener, B.; Angst, U.M.; Larsen, C.K.; Geiker, M.R. Limitations of the use of concrete bulk resistivity as an indicator for the rate of chloride-induced macro-cell corrosion. Struct. Concr. 2017, 18, 326–333. [Google Scholar] [CrossRef] [Green Version]
  75. Sadowski, Ł. New non-destructive method for linear polarisation resistance corrosion rate measurement. Arch. Civ. Mech. Eng. 2010, 10, 109–116. [Google Scholar] [CrossRef]
  76. Azarsa, P.; Gupta, R. Electrical resistivity of concrete for durability evaluation: A review. Adv. Mater. Sci. Eng. 2017, 2017, 8453095. [Google Scholar] [CrossRef] [Green Version]
  77. Gowers, K.R.; Millard, S.G. Measurement of concrete resistivity for assessment of corrosion severity of steel using Wenner technique. ACI Mater. J. 1999, 96, 536–541. [Google Scholar] [CrossRef]
  78. Sengul, O.; Gjorv, O.E. Effect of embedded steel on electrical resistivity measurements on concrete structures. ACI Mater. J. 2009, 106, 11–18. [Google Scholar] [CrossRef]
  79. Presuel-Moreno, F.; Liu, Y.; Wu, Y.-Y. Numerical modeling of the effects of rebar presence and/or multilayered concrete resistivity on the apparent resistivity measured via the Wenner method. Constr. Build. Mater. 2013, 48, 16–25. [Google Scholar] [CrossRef]
  80. Salehi, M.; Ghods, P.; Burkan Isgor, O. Numerical investigation of the role of embedded reinforcement mesh on electrical resistivity measurements of concrete using the Wenner probe technique. Mater. Struct. 2016, 49, 301–316. [Google Scholar] [CrossRef]
  81. Nguyen, A.Q.; Klysz, G.; Deby, F.; Balayssac, J.-P. Evaluation of water content gradient using a new configuration of linear array four-point probe for electrical resistivity measurement. Cem. Concr. Compos. 2017, 83, 308–322. [Google Scholar] [CrossRef]
  82. Ghosh, P.; Tran, Q. Influence of parameters on surface resistivity of concrete. Cem. Concr. Compos. 2015, 62, 134–145. [Google Scholar] [CrossRef]
  83. Lim, Y.C.; Kim, T.S.; Hwang, C.S. Modeling for apparent resistivity estimation along direction of electrode array above rebar in electrical resistivity measurement. J. Build. Eng. 2020, 31, 101417. [Google Scholar] [CrossRef]
  84. Nguyen, A.Q.; Klysz, G.; Deby, F.; Balayssac, J.P. Assessment of the electrochemical state of steel reinforcement in water saturated concrete by resistivity measurement. Constr. Build. Mater. 2018, 171, 455–466. [Google Scholar] [CrossRef]
  85. Elsener, B.; Andrade, C.; Gulikers, J.; Polder, R.; Raupach, M. Half-cell potential measurements—Potential mapping on reinforced concrete structures. Mater. Struct. 2003, 36, 461–671. [Google Scholar] [CrossRef]
  86. Orazem, M.E.; Tribollet, B. Electrochemical Impedance Spectroscopy; John Wiley & Sons: Hoboken, NJ, USA, 2011; ISBN 111820994X. [Google Scholar]
  87. Chakri, S.; Frateur, I.; Orazem, M.E.; Sutter, E.M.M.; Tran, T.T.M.; Tribollet, B.; Vivier, V. Improved EIS analysis of the electrochemical behaviour of carbon steel in alkaline solution. Electrochimica Acta 2017, 246, 924–930. [Google Scholar] [CrossRef]
  88. Nguyen, W.; Duncan, J.F.; Devine, T.M.; Ostertag, C.P. Electrochemical polarization and impedance of reinforced concrete and hybrid fiber-reinforced concrete under cracked matrix conditions. Electrochimica Acta 2018, 271, 319–336. [Google Scholar] [CrossRef] [Green Version]
  89. Yu, B.; Yang, L.; Wu, M.; Li, B. Practical model for predicting corrosion rate of steel reinforcement in concrete structures. Constr. Build. Mater. 2014, 54, 385–401. [Google Scholar] [CrossRef]
  90. Wai-Lok Lai, W.; Dérobert, X.; Annan, P. A review of ground penetrating radar application in civil engineering: A 30-year journey from locating and testing to imaging and diagnosis. NDT E Int. 2018, 96, 58–78. [Google Scholar] [CrossRef]
  91. Tosti, F.; Ferrante, C. Using ground penetrating radar methods to investigate reinforced concrete structures. Surv. Geophys. 2019, 1–46. [Google Scholar] [CrossRef]
  92. Zhou, F.; Chen, Z.; Liu, H.; Cui, J.; Spencer, B.; Fang, G. Simultaneous estimation of rebar diameter and cover thickness by a GPR-EMI dual sensor. Sensors 2018, 18, 2969. [Google Scholar] [CrossRef] [Green Version]
  93. Sadowski, L. Methodology for assessing the probability of corrosion in concrete structures on the basis of half-cell potential and concrete resistivity measurements. Sci. World J. 2013, 2013, 714501. [Google Scholar] [CrossRef] [Green Version]
  94. Kušter Marić, M.; Mandić Vlašić, A.; Ivanković, A.M.; Bleiziffer, J.; Srbić, M.; Skokandić, D. Assessment of reinforcement corrosion and concrete damage on bridges using non-destructive testing. Gradjevinar 2019, 71, 843–862. [Google Scholar] [CrossRef]
  95. Andrade, C. Electrochemical methods for on-site corrosion detection. Struct. Concr. 2020, 21, 1385–1395. [Google Scholar] [CrossRef]
  96. Karhunen, K.; Seppänen, A.; Lehikoinen, A.; Monteiro, P.J.M.; Kaipio, J.P. Electrical resistance tomography imaging of concrete. Cem. Concr. Res. 2010, 40, 137–145. [Google Scholar] [CrossRef]
  97. Reichling, K.; Raupach, M.; Klitzsch, N. Determination of the distribution of electrical resistivity in reinforced concrete structures using electrical resistivity tomography. Mater. Corros. 2015, 66, 763–771. [Google Scholar] [CrossRef]
  98. Smyl, D. Electrical tomography for characterizing transport properties in cement-based materials: A review. Constr. Build. Mater. 2020, 244, 118299. [Google Scholar] [CrossRef]
  99. Smyl, D.; Hallaji, M.; Seppänen, A.; Pour-Ghaz, M. Quantitative electrical imaging of three-dimensional moisture flow in cement-based materials. Int. J. Heat Mass Transf. 2016, 103, 1348–1358. [Google Scholar] [CrossRef] [Green Version]
  100. Smyl, D.; Rashetnia, R.; Seppänen, A.; Pour-Ghaz, M. Can electrical resistance tomography be used for imaging unsaturated moisture flow in cement-based materials with discrete cracks? Cem. Concr. Res. 2017, 91, 61–72. [Google Scholar] [CrossRef] [Green Version]
  101. Fares, M.; Villain, G.; Bonnet, S.; Palma Lopes, S.; Thauvin, B.; Thiery, M. Determining chloride content profiles in concrete using an electrical resistivity tomography device. Cem. Concr. Compos. 2018, 94, 315–326. [Google Scholar] [CrossRef] [Green Version]
  102. Bonnet, S.; Balayssac, J.-P. Combination of the Wenner resistivimeter and Torrent permeameter methods for assessing carbonation depth and saturation level of concrete. Constr. Build. Mater. 2018, 188, 1149–1165. [Google Scholar] [CrossRef] [Green Version]
  103. Rymarczyk, T.; Kłosowski, G.; Kozłowski, E. A Non-Destructive System Based on Electrical Tomography and Machine Learning to Analyze the Moisture of Buildings. Sensors 2018, 18, 2285. [Google Scholar] [CrossRef] [Green Version]
  104. Loke, M.H. Tutorial: 2-D and 3-D Electrical Imaging Surveys; Geotomo Software: Penang, Malaysia, 2004. [Google Scholar]
  105. Udosen, N.; Potthast, R. Automated optimization of electrode locations for electrical resistivity tomography. Model. Earth Syst. Environ. 2018, 4, 1059–1083. [Google Scholar] [CrossRef]
  106. Smyl, D.; Liu, D. Optimizing electrode positions in 2D Electrical Impedance Tomography using deep learning. IEEE Trans. Instrum. Meas. 2020, 69, 6030–6044. [Google Scholar] [CrossRef] [Green Version]
Figure 1. (a) Pictures of the mortar sample with the monitoring device and of the stainless-steel probes. (b) Schematic representation of the sample with the connection to the potentiostat-galvanostat; WE = working electrode, SE = sense electrode, RE = reference electrode, and CE = counter-electrode. (c) Example of typical raw data obtained in this study, showing the evolution of VP1−P2 with time when applying 10 consecutive galvanostatic pulses of 30 s at 500 µA or −500 µA.
Cmd 01 00018 g001
Figure 2. Geometry and mesh of the finite-element model used in this study (200 × 60 × 13 cm3). The two outer electrodes C1 and C2 act as current-injection electrodes, while the two inner electrodes P1 and P2 act as potential electrodes. Probe spacing a varies between 2.5 and 15 cm. The steel-concrete interface was modeled with a parallel contribution of the exchange current density and the double-layer capacitance using the Butler–Volmer equation.
Cmd 01 00018 g002
Figure 3. Illustration of the free macrocell current (evaluated at 50 s) that flows spontaneously between anodic and cathodic areas without applying any external polarization (IC1 = 0 µA) for ρ = 100 Ω m. The cover depth e was set at 40 mm and the anode length La at 1 cm. The inserts show the temporal evolution of the potential difference between P1 and P2.
Cmd 01 00018 g003
Figure 4. Experimental results obtained on the mortar sample using the indirect galvanostatic pulse (GP) technique. (a) Influence of the distance of the probe from the rebar on the evolution of VP1−P2 with I = 100 µA and a = 15 cm, all electrodes being parallel to the rebar, (b) influence of the injected current (50–1000 µA) on the evolution of VP1−P2 with a = 15 cm, (c) evolution of VP1−P2 as a function of the impressed current for a = 15 cm at t = 0.1 s and 30 s, (d) influence of the probe spacing on VP1−P2 with I = 200 µA for the passive rebar (reproduced from Reference [2]), (e) influence of the probe spacing on VP1−P2 with I = 200 µA after the introduction of chlorides from the concrete surface through wetting/drying cycles, and (f) evolution of ΔV with time for each probe spacing, showing the difference between the passive rebar and the rebar after Cl introduction.
Cmd 01 00018 g004
Figure 5. Evolution of the instantaneous ohmic drop observed at t0 for both active and passive conditions, for IC1 = 100 µA as a function of: (a) probe spacing a, for each concrete resistivity, e = 40 mm and Φ = 12 mm, (b) cover depth e, for each concrete resistivity, a = 5 cm and Φ = 12 mm; (c) rebar diameter Φ for each concrete resistivity, a = 5 cm and e = 40 mm.
Cmd 01 00018 g005
Figure 6. Comparing input concrete resistivity with the concrete resistivity calculated with Equation (6), considering the accurate geometric factor kCOMSOL for each simulation. The calculated resistivity decreases when increasing a, decreasing e or increasing Φ as more current reaches the rebar.
Cmd 01 00018 g006
Figure 7. Example of results showing the temporal evolution of Irebar and VP1−P2 obtained when considering uniform corrosion in both active (i0,a = 0.1 A m−2) or passive states (i0,c = 10−5 A m−2). (a) a = 5 cm, e = 40 mm and Φ = 12 mm; (b) a = 15 cm, e = 40 mm and Φ = 12 mm; (c) a = 5 cm, e = 60 mm and Φ = 12 mm; (d) a = 5 cm, e = 40 mm and Φ = 25 mm. The complete results from this parametric study are presented in Figure S2.
Cmd 01 00018 g007
Figure 8. Schematic representation of the physical aspect of the indirect GP technique in Wenner configuration. (a) Evolution of the distribution of the current in the concrete and in the rebar; (b) evolution of the potential difference attributed to concrete resistance, polarization resistance, and the global response.
Cmd 01 00018 g008
Figure 9. Evolution of VP1−P2 and ΔV over time in the presence of a slightly corroding area at different positions relative to the monitoring device. Input parameters: i0,a = 10−4 A m−2, i0,c = 10−5 A m−2, La = 1 cm, a = 5 cm, e = 40 mm, Cdl,a = Cdl,c = 0.2 F m−2, IC1 = 100 µA.
Cmd 01 00018 g009
Figure 10. Evolution of VP1−P2 and ΔV over time in the presence of a highly corroding area at different positions relative to the monitoring device. Input parameters: i0,a = 0.1 A m−2, i0,c = 10−5 A m−2, La = 1 cm, a = 5 cm, e = 40 mm, Cdl,a = Cdl,c = 0.2 F m−2, IC1 = 100 µA.
Cmd 01 00018 g010
Figure 11. Evolution of VP1−P2 and ΔV over time in the presence of a highly corroding area at different positions relative to the monitoring device. Input parameters: i0,a = 0.1 A m−2, i0,c = 10−5 A m−2, La = 3 cm, a = 5 cm, e = 40 mm, Cdl,a = Cdl,c = 0.2 F m−2, IC1 = 100 µA.
Cmd 01 00018 g011
Figure 12. Evolution of VP1−P2, Irebar, Ianode, and Ianode/Irebar over time when the anode is below C1. Input parameters: i0,a = 0.1 A m−2, i0,c = 10−5 A m−2, La = 3 cm, a = 5 cm, e = 40 mm, Cdl,a = Cdl,c = 0.2 F m−2, IC1 = 100 µA.
Cmd 01 00018 g012
Figure 13. Evolution of the current in the different parts of the anode for ρ = 100 Ω m (left) and ρ = 1000 Ω m (right) when the anode is below C1. The current probe C1 is located just above the intersection of Anode 3 and Anode 4. Anode 6 is closest to P1.
Cmd 01 00018 g013
Figure 14. Evolution of VP1−P2 and ΔV over time in the presence of a highly corroding area at different positions relative to the monitoring device. Input parameters: i0,a = 0.1 A m−2, i0,c = 10−5 A m−2, La = 3 cm, a = 2.5 cm, e = 40 mm, Cdl,a = Cdl,c = 0.2 F m−2, IC1 = 100 µA.
Cmd 01 00018 g014
Figure 15. Evolution of VP1−P2 and ΔV over time in the presence of a highly corroding area at different positions relative to the monitoring device. Input parameters: i0,a = 0.1 A m−2, i0,c = 10−5 A m−2, La = 3 cm, a = 15 cm, e = 40 mm, Cdl,a = Cdl,c = 0.2 F m−2, IC1 = 100 µA.
Cmd 01 00018 g015
Figure 16. Evolution of VP1−P2 and ΔV over time in the presence of an anode with a high double-layer capacitance at different positions relative to the monitoring device. Input parameters: i0,a = i0,c = 10−5 A m−2, La = 3 cm, a = 5 cm, e = 40 mm, Cdl,a = 2 F m−2, Cdl,c = 0.2 F m−2, IC1 = 100 µA.
Cmd 01 00018 g016
Figure 17. Evolution of VP1−P2 and ΔV over time in the presence of a highly corroding area with a high double-layer capacitance at different positions relative to the monitoring device. Input parameters: i0,a = 0.1 A m−2, i0,c = 10−5 A m−2, La = 3 cm, a = 5 cm, e = 40 mm, Cdl,a = 2 F m−2, Cdl,c = 0.2 F m−2, IC1 = 100 µA.
Cmd 01 00018 g017
Figure 18. Schematic representation of the main scenarios expected when monitoring a rebar with one highly corroding area in concrete with uniform resistivity for e = 40 mm. The figure shows the evolution of ΔVmax values as a function of the measurement position. Depending on the charge transfer coefficients, the two peaks observed in cases A, B, and C can either be symmetric or not. Case A can be expected even if concrete resistivity is not uniform, as the anode effect is almost insignificant irrespective of concrete resistivity when La << a.
Cmd 01 00018 g018
Table 1. Typical values of electrochemical parameters found in the literature for modeling non-uniform corrosion of steel in concrete.
Active Area (Anode)Passive Area (Cathode)References
i0,a (A m−2)Eeq,a (V)βa,a (V)βc,a (V)i0,c (A m−2)Eeq,c (V)βa,c (V)βc,c (V)
1.875 × 10⁻⁴−0.780.06-6.25 × 10−60.16-0.16[44,57]
3 × 10⁻⁴−0.780.090.1810−50.1650.18[43]
5 × 10⁻³−0.650.090.152.5 × 10−4−0.150.40.15[5]
0.1−0.70.060.1610−4−0.10.40.16[18,58]
0.3−0.5760.0460.36 × 10−5−0.110.240.3[59]
Table 2. List of the Butler–Volmer parameters used in this study for uniform (lines 1 and 2) and non-uniform corrosion (line 3).
Active CorrosionPassive Corrosion
i0,a (A m−2)Eeq,a (V)αa,a (V)αc,a (V)i0,c (A m−2)Eeq,c (V)αa,c (V)αc,c (V)
0.100.50.5----
----10−500.0120.5
0.1 or 10−400.50.510−500.0120.5
Table 3. Comparison of the conventional geometric factor in Wenner configuration kWenner (Equation (7)) and the geometric factor calculated in COMSOL kCOMSOL, which considers the sample geometry (Equation (8)).
a (cm) kWenner = 2πa (m)kCOMSOL (m)
2.50.1570.149
50.3140.304
7.50.4710.387
100.6280.424
150.9420.405
Table 4. List of input parameters used for the case of uniform corrosion.
Input ParametersValues
Current impressed on C1 IC1 (µA)100, 300 or 500
Concrete resistivity ρ (Ω m)100, 200, 500 or 1000
Probe spacing a (cm)2.5, 5, 7.5, 10 or 15
Cover depth e (mm)20, 40 or 60
Rebar diameter Φ (mm)6, 12 or 25
Table 5. List of input parameters used for the non-uniform corrosion of steel in concrete.
Input ParametersValues
Current impressed on C1 IC1 (µA)100
Concrete resistivity ρ (Ω m)100, 200, 500 or 1000
Anode length La (cm)1 or 3 (5, 7.5, 10, or 15 in SI)
Probe spacing a (cm)2.5, 5 or 15
Cover depth e (mm)40
Rebar diameter Φ (mm)12
Double-layer capacitance Cdl (F m−2)0.2 or 2
Publisher’s Note: MDPI stays neutral with regard to jurisdictional claims in published maps and institutional affiliations.