Socioeconomic Position and Excessive Daytime Sleepiness: A Systematic Review of Social Epidemiological Studies


Abstract
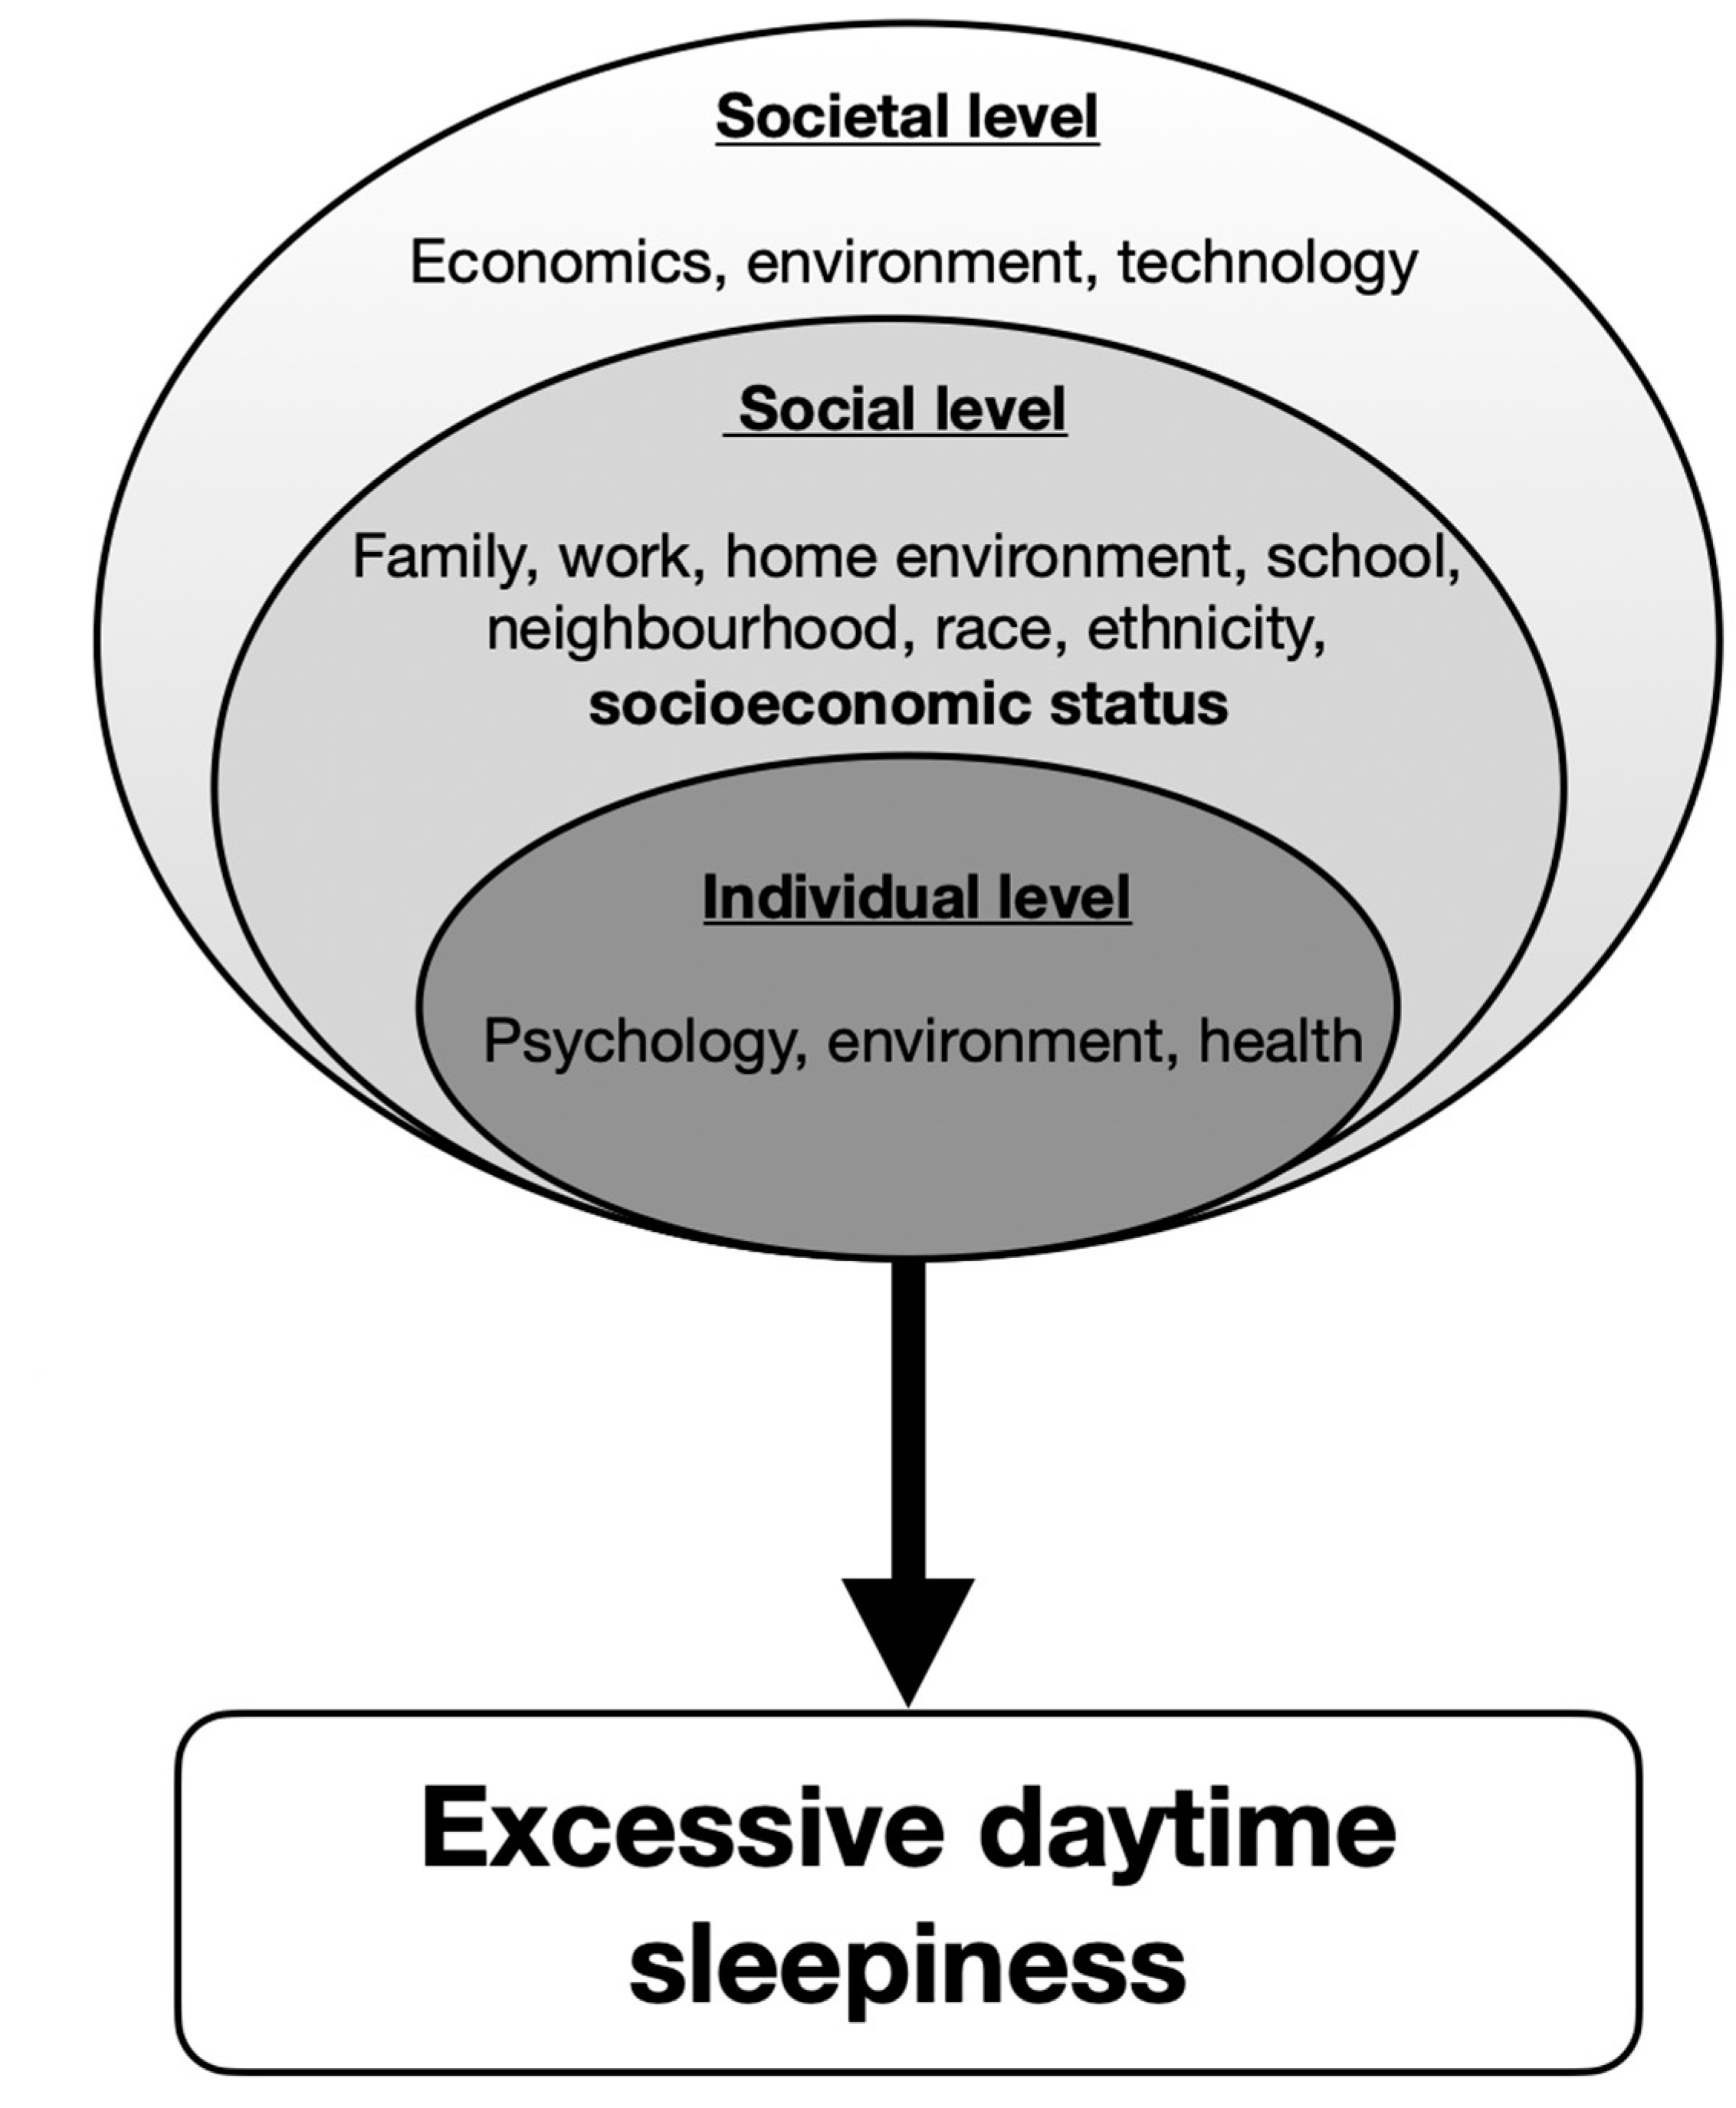
:1. Introduction
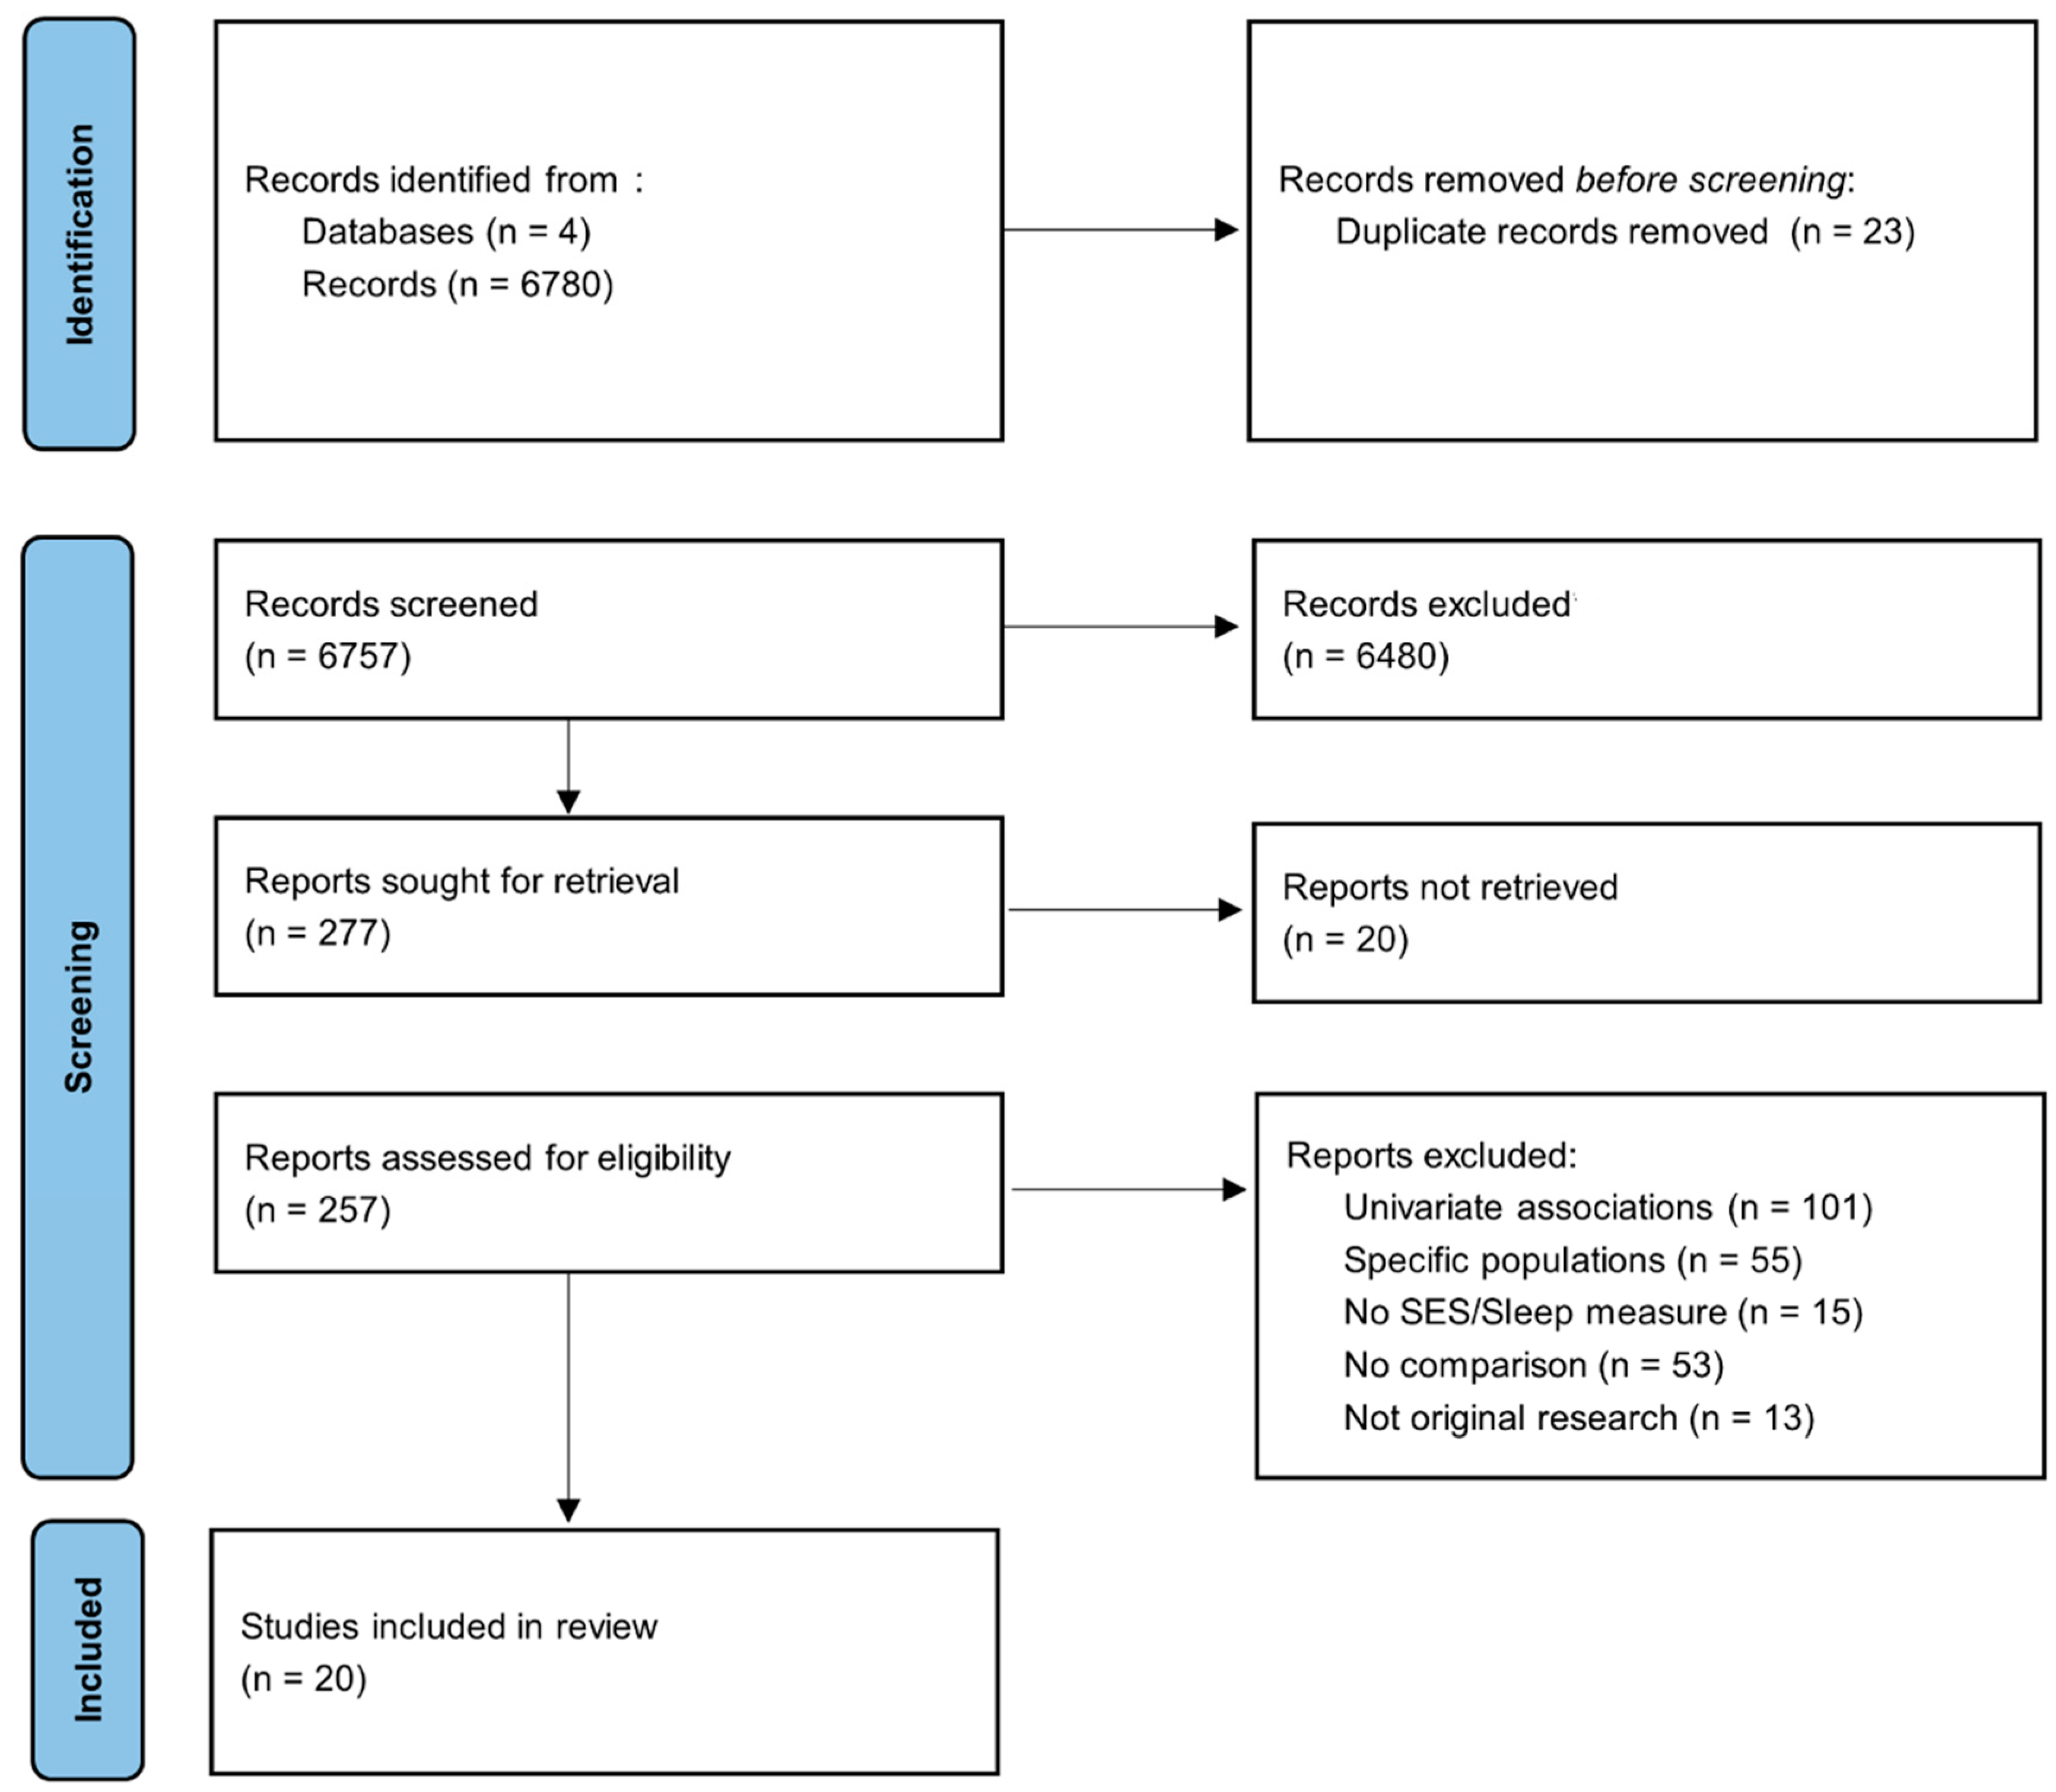
2. Materials and Methods
2.1. Literature Review
2.2. Inclusion and Exclusion Criteria
2.3. Data Extraction and Quality Rating of Studies
3. Results
3.1. Characteristics of Studies
3.2. Synthesis of the Main Results
- Education: Lower education was related to increased perceived sleepiness [22]. Having lower education was associated with more daytime sleepiness [21]. Higher educational attainment was associated with less excessive daytime sleepiness [37]. Men with a low educational level were more likely to suffer from poor sleep quality and short sleep duration [35]. One study reported that higher level of maternal education was negatively related to EDS [20] and another one reported that EDS was not associated with educational status [40].
- Income: Lower income-to-needs ratio INR was related to increased sleepiness [27]. Lower INR was associated with greater daytime sleepiness [33,41]. Lower family income was associated with EDS [23]. Lower income was associated with difficulty falling asleep and having no private insurance was associated with sleep latency >30 min and non-restorative sleep [28]. The prevalence of EDS was lower in adults with a higher family income [7].
- Employment: Individuals employed full-time had more sleepiness than those employed part time or not employed [18]. Men with a low occupational position were more likely to suffer from poor sleep quality and short sleep duration [35]. Men with a low occupational position were also more likely to have long sleep latency [35]. Women with a low occupational position were more likely to have long sleep latency, excessive daytime sleepiness and short sleep duration [35]. One study reported that office workers had lower EDS scores than line workers [13], and another one reported that there is no association between EDS and employment status [7].
- Perceived/subjective SES: In children, higher subjective SES predicted less daytime sleepiness in adolescents [41], higher subjective SES was associated with fewer sleep disturbances [19]. Being in the highest deprivation quintile was a significant independent predictor of EDS [41], compared to being in the lowest deprivation quintile [24]. Lower household food security was associated with poor sleep quality, short sleep duration and excessive daytime sleepiness [36]. Subjective SES better predicted daytime sleepiness than objective SES [39]. Lower SES was also associated with more excessive daytime sleepiness [36]. One study reported that higher SES was associated with less daytime sleepiness [39] and another one reported that there was no association between SES and EDS [38].

| Children and Adolescents < 18 Years Old | ||||||||||
|---|---|---|---|---|---|---|---|---|---|---|
| Author | Country | Population | Sample Size | Mean or Range Age (Years) | % Women | Study Design | SES Measures | Sleep Measures | Findings | Odds Ratio, p Value, r |
| Pallesen 2011 [20] | Norway | 11th–13th grade adolescents from high schools in Hordaland county | 1279 | N/A | 62.4 | Cross-sectional | Parental education (primary school, vocational/high school, college/university) | Behaviorally induced insufficient sleep syndrome (excessive daytime sleepiness, short habitual sleep duration and sleeping considerably longer than usual during weekend/vacations) | Higher level of maternal education was negatively related to EDS | * Maternal education—EDS: OR = 0.51 * Urban living—EDS: OR= 1.52 * Grade average—EDS: p < 0.01 |
| Jarrin 2014 [19] | Canada | Children and adolescents recruited from schools and neighbourhoods in Montreal | 239 | 8–17 (12.6 ± 1.9) | 45.6 | Cross-sectional | Objective SES: household income (17 categories) and highest parental education (9 categories) Subjective SES: Subjective Social Status Scale-Youth Version (two 10-rung ladders: school and society, youth reported) | Sleep quality (youth-rated, 10-point scale) Daytime sleepiness (youth-rated, Pediatric Daytime Sleepiness Scale) Sleep disturbances (parent-rated, Children’s Sleep Habits Questionnaire) Sleep duration (youth- and parent-reported) | In children, higher subjective SES predicted less daytime sleepiness in adolescents, higher subjective SES was associated with fewer sleep disturbances. | Subjective SES was associated with daytime sleepiness (p < 0.01) |
| Bagley 2015 [27] | USA | Children recruited from semirural public schools in the southeastern US | 271 | 11.33 ± 7.74 | 47 | Cross-sectional | Income-to-needs ratio (computed by dividing family income by the federal poverty threshold for the same family size) | One-week actigraphy (sleep duration, night waking duration, variability in sleep schedule) School Sleep Habits Survey (Sleep/Wake Problems Scale, Sleepiness Scale) | Lower income-to-needs ratio was related to increased sleepiness. | A lower income-to-needs ratio was moderately related to increased sleepiness (p = 0.01) |
| Tomaso 2020 [33] | USA | Adolescents members of a cohort recruited from advertisements in a small city in the Midwest US | 184 | 11–14 (12) | 50.5 | Cross-sectional | Family income-to-needs ratio (dividing family income by year’s federal poverty level for a specific family size) | Sleep wake problems (Sleep–Wake Problems Behavior Scale of the Sleep Habits Survey) Daytime sleepiness (Epworth Sleepiness Scale–Revised for Children) | Lower income-to-needs ratio was associated with greater daytime sleepiness | SES significantly predicted daytime sleepiness (p = 0.009) |
| Philbrook2020 [41] | USA | Adolescents recruited through flyers distributed at local elementary schools in semirural areas and small towns in Alabama US | 252 | 16 (Mage = 15.79 years, SD ± 0.81), 17 (Mage = 16.79 years, SD ± 0.81), 18 (Mage = 17.73 years, SD ± 1.00) years across the three waves | 53 | 3-wave longitudinal | Income-to-needs-ratio (INR) derived from familial income range and reported house- hold size Perceived economic well-being | Sleep–wake processes—sleep quality and daytime sleepiness (Two scales of the well-established School Sleep Habits Survey) | Family chaos is an intervening or mediator variable in longitudinal associations between indicators of lower SES and poor quality of sleep or greater daytime sleepiness | * Lower INR and poor quality of sleep (p < 0.01) and higher levels of chaos (p < 0.05) in which it acts as a mediator * Lower INR and daytime sleepiness (p = 0.350) where chaos is an intervening variable (p < 0.05) * Chaos is an intervening variable between economic well-being and both poor quality of sleep and daytime sleepiness (p < 0.01; p < 0.05) |
| Adults and Old People ≥ 18 Years Old | ||||||||||
| Author | Country | Sample Characteristics | Sample Size | Mean or Range Age (Years) | % Women | Type of Study | SES Measures | Sleep Measures | Findings | Odds Ratio, p Value, r |
| Breslau 1997 [18] | USA | Adults insured in a health maintenance organization in southeast Michigan | 973 | 26–36 | 62.4 | Cross-sectional | Education (<high school, high school, some college, college) Employment status (employed full-time vs. employed part time or unemployed) | Daytime sleepiness (five items from the Sleep–Wake Activity Inventory) | Those employed full-time had more sleepiness than those employed part time or not employed | N/A |
| Doi 2003 [40] | Japan | Workers of a telecommunications company in Tokyo | 4722 | 20–59 | 17.8 | Cross-sectional | Education (< or >high school) | Excessive daytime sleepiness (ESS score >10) | EDS was not associated with educational status | * Education-EDS: OR=1.47, p = 0.001 * Marital status-EDS: OR = 1.61, p = 0.001 |
| Hara 2004 [23] | Brazil | 1066 adults from the general population in Bambui | 1066 | NR | 55.7 | Cross-sectional | Years of education (0, 1–3, 4–7, 8+). Monthly personal income (none, <1, 1.0–1.9, ≥2.0 Brazilian minimum wages); Monthly family income (<2.0, ≥2.0 Brazilian minimum wages); Current employment situation (student, working, unemployed, retired) | Excessive daytime sleepiness three or more times per week with consequent impairment of daily activities | Lower family income was associated with EDS | * Marital status-EDS: p = 0.559 * Education-EDS: p = 0.138 * Employment status-EDS: p = 0.001 * Income-EDS: p = 0.001 |
| Gander 2005 [24] | New Zealand | Adults from the general population | 5441 | 30–60 | 54 | Cross-sectional | Area deprivation index (divided in quintiles) | EDS (Epworth Sleepiness Scale score > 10) | Being in the highest deprivation quintile was a significant independent predictor of EDS, compared to being in the lowest deprivation quintile | Ethnicity-EDS: OR = 1.55, p < 0.0001 |
| Kim 2005 [22] | USA | Adults part of a cohort of employees in five state agencies in Wisconsin | 2913 | 35–65 (46.6 ± 7.9) | 53.6 | Cross-sectional | Education (some college or less, college graduate or higher) | Excessive daytime sleepiness (13-item questionnaire subjected to factor analysis) | Lower education was related to worse perceived sleepiness | Education-EDS: p = 0.002 |
| Baker 2009 [21] | USA | Women from the general US population | 959 | 18–64 (45 ± 11.7) | 100 | Cross-sectional | Employment status (working full-time, working more than one job, working part time, student, homemaker, unemployed, retired or disabled) Education (high school or less, graduated from high school, some vocational or college courses, graduated from college) Household income (<$35,000, $35,000–$75,000, >$75,000) | Sleep quality (single question, dichotomous) Daytime sleepiness (single question, dichotomous) | Having lower education was associated with more daytime sleepiness | Education-EDS: p = 0.001 |
| Grandner 2013 [28] | USA | Adults from the general US population | 4081 | 46.54 ± 16.55 | 48.05 | Cross-sectional | Household income (above vs. below $20,000) Education level (<9th grade, 9th to 11th grade, high school graduate, some college, college graduate) Access to private health insurance (yes vs. no) Household food security (combination of 18 items and categorised as full, marginal, low, very low) | Sleep latency >30 min (yes vs. no) Insomnia symptoms (never, rarely, sometimes, often, almost always) Daytime sleepiness (never, rarely, sometimes, often, almost always) Sleep apnea symptoms (never, rarely, sometimes, frequently) | Lower income was associated with difficulty falling asleep, lower education with sleep latency > 30 min, non-restorative sleep, snorting/gasping and snoring, no private insurance with sleep latency >30 min and non-restorative sleep and lower household food security with all symptoms | * Education-EDS: OR = 1.04 * Income-EDS: OR = 1.11 *Marital status-EDS: OR = 1.24, p < 0.05 * Ethnicity/Race-EDS: OR = 0.8, p < 0.05 |
| Jarrin 2013 [39] | Canada | Adults recruited from advertisements in Montreal | 177 | 30–65 (45.3 ± 6.3) | 81.4 | Cross-sectional | Objective SES: household income, years of education, employment status (employed vs. unemployed) Subjective SES: MacArthur Scale of Subjective Social Status (scale 1-10) | Sleep quality (PSQI Global score) Sleep latency (PSQI sleep latency subscale) Weekday sleep duration Weekend oversleep (difference between weekend and weekday total sleep duration) Daytime sleepiness (ESS) | Higher SES was associated with less daytime sleepiness. Subjective SES better predicted daytime sleepiness than objective SES. | * Household income—SES: r = 0.50, p < 0.01 * Years of education—SES: r = 0.26, p < 0.01 |
| Liviya NG2014 [38] | Australia | Adults recruited from 10 workplaces in Melbourne | 707 | 40.2 ± 10.4 | 60 | Cross-sectional | Education (nontertiary vs. tertiary) Occupation (manager, professional, associate professional, clerical or service) Income per week (≥$2000, $1600–$1999, $1000–$1599, $0–$999) | Excessive daytime sleepiness (ESS score >10) | There was no association between SES and EDS | R = 0 |
| Cunningham 2015 [37] | USA | Adults from the general US population | NR | NR | Cross-sectional | Educational attainment (years of completed schooling) | Sleep duration (<7, 7–8, >8 h) Fatigue (yes vs. no) Excessive daytime sleepiness (yes vs. no) Insomnia (yes vs. no) | Higher educational attainment was associated with less excessive daytime sleepiness | * Education-EDS: p = 0.0001 | |
| Schwartz 2015 [36] | Peru | 2682 adults from the general population of four Peruvian settings | 2682 | >35 (54.1 ± 18.8) | 49.4 | Cross-sectional | Wealth index (based on current occupation, household income, assets and household facilities) | SDB symptoms: habitual snoring (self-reported snoring at least 3 nights per week); observed apneas (pauses in breathing or choking during sleep reported by a spouse or bed partner); excessive daytime sleepiness (modified ESS score > 6) | Lower SES was associated with more excessive daytime sleepiness. | * SES-EDS: OR = 1.41, p = 0.006 |
| Stringhini 2015 [35] | Switzerland | Adults from the general population in Lausanne | 3391 | 40–81 | 47.4 | Cross-sectional | Educational level (high, middle, low) Occupational position (high, middle, low) | Subjective sleep assessment: sleep quality (PSQI global score > 5), sleep latency (>30 min), daytime sleepiness (ESS score > 10), sleep duration (<5 h), insomnia (from 2 items in PSQI) Objective sleep assessment: total sleep time, sleep latency, slow wave sleep, sleep efficiency, stage shifts (in-home 1-night * PSG in a subsample of 1569 participants) | Men with a low educational level or occupational position were more likely to suffer from poor sleep quality, short sleep duration and insomnia. Men with a low occupational position were also more likely to have long sleep latency. Women with a low educational level were more likely to have long sleep latency and short sleep duration. Women with a low occupational position were more likely to have long sleep latency, excessive daytime sleepiness and short sleep duration. Participants with low SES had lower sleep efficiency and higher stage shifts in PSG. | * Men with low educational and occupational position—ESS: p < 0.001 * Men with low occupational position have long sleep latency: OR = 4.90 * Women with low education have long sleep latency and short sleep duration: OR = 2.09; OR = 2.26 * Sleep efficiency—low SES: p < 0.05 * Low SES—higher stage shifts: p < 0.05 |
| Miner 2018 [34] | USA | Community-dwelling elderly persons | 357 | 78–102 (84.2 ± 4.4) | 67.8 | Cross-sectional | Education (high school vs. higher) | Epworth Sleepiness Scale (≥10) | No association between education and EDS | R = 0 |
| Kolla 2020 [7] | USA | Community-dwelling adults | 5692 | 18–60 | 27.4 | Cross-sectional | Family income (low, low-average, high-average, high) Employment status (working, student, homemaker, retired) | Interview | The prevalence of EDS was lower in adults with a higher family income No association between EDS and employment status | * EDS—low income: OR: 1.21 * Low average income: OR = 1.36 * High average income: OR: 1.24 * EDS—workers, students, homemakers or retired: OR = 0.88–0.89 |
| Mokarami 2020 [13] | Iran | Workers in a brick factory | 90 | 22–68 (35.6 ± 4.3) | 0 | Cross-sectional | Education (elementary, diploma, university) Occupational title (office vs. line workers) | Epworth Sleepiness Scale | No association between education and EDS Office workers had lower ESS scores than line workers | Occupation-EDS: p = 0.0001 |
| Study | Q1 | Q2 | Q3 | Q4 | Q5 | Q6 | Q7 | Q8 | Q9 | Q10 | Q11 | Q12 | Q13 | Q14 | Quality Rating |
|---|---|---|---|---|---|---|---|---|---|---|---|---|---|---|---|
| Breslau 1997 [18] | Y | Y | Y | Y | N | N | N | Y | Y | N | N | NA | NA | Y | Fair |
| Doi 2003 [40] | Y | Y | Y | Y | N | N | N | N | Y | N | N | NA | NA | Y | Fair |
| Hara 2004 [23] | Y | Y | Y | Y | N | N | N | Y | Y | N | N | NA | NA | N | Fair |
| Gander 2005 [24] | Y | Y | Y | Y | N | N | N | Y | N | N | N | NA | NA | Y | Fair |
| Kim 2005 [22] | Y | Y | NR | Y | N | N | N | N | Y | N | N | NA | NA | Y | Poor |
| Baker 2009 [21] | Y | Y | N | Y | N | N | N | Y | Y | N | N | NA | NA | Y | Fair |
| Pallesen 2011 [20] | Y | N | Y | Y | N | N | N | Y | Y | N | Y | NA | NA | Y | Fair |
| Ansarin 2013 [42] | Y | Y | Y | Y | N | N | N | Y | Y | N | N | NA | NA | Y | Fair |
| Grandner 2013 [28] | Y | Y | Y | Y | N | N | N | Y | Y | N | N | NA | NA | Y | Fair |
| Jarrin 2013 [39] | Y | N | NA | Y | N | N | N | Y | Y | N | N | NA | NA | Y | Poor |
| Jarrin 2014 [19] | Y | N | NA | Y | N | N | N | Y | Y | N | N | NA | NA | Y | Poor |
| Liviya NG 2014 [38] | Y | Y | NR | Y | N | N | N | Y | Y | N | N | NA | NA | Y | Fair |
| Bagley 2015 [27] | Y | Y | Y | Y | N | N | N | Y | Y | N | Y | Y | NA | Y | Good |
| Cunningham 2015 [37] | Y | Y | Y | Y | N | N | N | Y | Y | N | N | NA | NA | Y | Fair |
| Schwartz 2015 [36] | Y | Y | N | Y | N | N | N | Y | Y | N | N | NA | NA | Y | Fair |
| Stringhini 2015 [35] | Y | Y | Y | Y | N | N | N | Y | Y | N | Y | NR | NA | Y | Fair |
| Miner 2018 [34] | Y | Y | Y | Y | N | N | N | N | Y | N | N | NA | NA | Y | Fair |
| Tomaso 2018 [33] | Y | N | Y | Y | N | N | N | N | Y | N | N | NA | NA | Y | Poor |
| Kolla 2020 [7] | Y | Y | Y | Y | N | N | N | Y | Y | N | Y | Y | NA | Y | Good |
| Mokarami 2020 [13] | Y | Y | Y | Y | N | N | N | Y | Y | N | Y | Y | NA | Y | Good |
| Philbrook 2020 [41] | Y | Y | Y | Y | N | N | N | Y | Y | N | Y | Y | NA | Y | Good |
4. Discussion
- Association between EDS and SEP in children and minors
- Association between EDS and SEP in adults
- Association between EDS and SEP in people with mental, physical and functional disability
- Association between EDS and SEP in the elderly
- Recommendation for future sleep research
5. Conclusions
Author Contributions
Funding
Conflicts of Interest
References
- Ma, Y.; Hu, Z.; Qin, X.; Chen, R.; Zhou, Y. Prevalence and socio-economic correlates of insomnia among older people in Anhui, China. Australas. J. Ageing 2018, 37, E91–E96. [Google Scholar] [CrossRef] [PubMed]
- Berhanu, H.; Mossie, A.; Tadesse, S.; Geleta, D. Prevalence and Associated Factors of Sleep Quality among Adults in Jimma Town, Southwest Ethiopia: A Community-Based Cross-Sectional Study. Sleep Disord. 2018, 2018, 1–10. [Google Scholar] [CrossRef] [PubMed] [Green Version]
- Foroughi, M.; Malekmohammad, M.; Sharafkhaneh, A.; Emami, H.; Adimi, P.; Khoundabi, B. Prevalence of Obstructive Sleep Apnea in a High-Risk Population Using the Stop-Bang Questionnaire in Tehran, Iran. Tanaffos 2017, 16, 217–224. [Google Scholar]
- Seyedmehdi, S.M.; Rahnama, N.; Yazdanparast, T.; Jamaati, H.; Attarchi, M.; Naghan, P.A.; Hassani, S. Prevalence of snoring and the risk of sleep apnea in hospital staff. Work 2016, 55, 765–772. [Google Scholar] [CrossRef] [PubMed]
- Safak, E.D.; Gocer, S.; Mucuk, S.; Ozturk, A.; Akin, S.; Arguvanli, S.; Mazicioglu, M.M. The prevalence and related factors of restless leg syndrome in the community dwelling elderly; in Kayseri, Turkey: A cross-sectional study. Arch. Gerontol. Geriatr. 2016, 65, 29–35. [Google Scholar] [CrossRef] [PubMed]
- Papadopoulos, D.; Sosso, F.E.; Khoury, T.; Surani, S.R. Sleep Disturbances Are Mediators Between Socioeconomic Status and Health: A Scoping Review. Int. J. Ment. Health Addict. 2020, 20, 480–504. [Google Scholar] [CrossRef]
- Kolla, B.P.; He, J.-P.; Mansukhani, M.; Frye, M.A.; Merikangas, K. Excessive sleepiness and associated symptoms in the U.S. adult population: Prevalence, correlates, and comorbidity. Sleep Health 2019, 6, 79–87. [Google Scholar] [CrossRef]
- Rodriguez, J.M.; Karlamangla, A.S.; Gruenewald, T.L.; Miller-Martinez, D.; Merkin, S.S.; Seeman, T.E. Social stratification and allostatic load: Shapes of health differences in the MIDUS study in the United States. J. Biosoc. Sci. 2019, 51, 627–644. [Google Scholar] [CrossRef]
- Lei, W.-Y.; Chang, W.-C.; Wong, M.-W.; Hung, J.-S.; Wen, S.-H.; Yi, C.-H.; Liu, T.-T.; Chen, J.-H.; Hsu, C.-S.; Hsieh, T.-C.; et al. Sleep Disturbance and Its Association with Gastrointestinal Symptoms/Diseases and Psychological Comorbidity. Digestion 2019, 99, 205–212. [Google Scholar] [CrossRef]
- Peltzer, K.; Pengpid, S. Self-Reported Sleep Duration and Its Correlates with Sociodemographics, Health Behaviours, Poor Mental Health, and Chronic Conditions in Rural Persons 40 Years and Older in South Africa. Int. J. Environ. Res. Public Health 2018, 15, 1357. [Google Scholar] [CrossRef] [Green Version]
- Wang, S.; Li, B.; Wu, Y.; Ungvari, G.S.; Ng, C.H.; Fu, Y.; Kou, C.; Yu, Y.; Sun, H.Q.; Xiang, Y.T. Relationship of Sleep Duration with Sociodemographic Characteristics, Lifestyle, Mental Health, and Chronic Diseases in a Large Chinese Adult Population. J. Clin. Sleep Med. Off. Publ. Am. Acad. Sleep Med. 2017, 13, 377–384. [Google Scholar] [CrossRef] [PubMed] [Green Version]
- Canuto, R.; Garcez, A.S.; Olinto, M.T. Metabolic syndrome and shift work: A systematic review. Sleep Med. Rev. 2013, 17, 425–431. [Google Scholar] [CrossRef] [PubMed]
- Mokarami, H.; Gharibi, V.; Kalteh, H.O.; Kujerdi, M.F.; Kazemi, R. Multiple environmental and psychosocial work risk factors and sleep disturbances. Int. Arch. Occup. Environ. Health 2020, 93, 623–633. [Google Scholar] [CrossRef] [PubMed]
- Etindele-Sosso, F.A. Insomnia, excessive daytime sleepiness, anxiety, depression and socioeconomic status among customer service employees in Canada. Sleep Sci. 2020, 13, 54–64. [Google Scholar]
- Wong, K.; Chan, A.H.S.; Ngan, S.C. The Effect of Long Working Hours and Overtime on Occupational Health: A Meta-Analysis of Evidence from 1998 to 2018. Int. J. Environ. Res. Public Health 2019, 16, 2102. [Google Scholar] [CrossRef] [Green Version]
- McWhirter, D.; Bae, C.; Budur, K. The assessment, diagnosis, and treatment of excessive sleepiness: Practical considerations for the psychiatrist. Psychiatry 2007, 4, 26–35. [Google Scholar]
- American Psychiatric Association. Diagnostic and Statistical Manual of Mental Disorders, 5th ed.; American Psychiatric Association: Washington, DC, USA, 2013. [Google Scholar]
- Breslau, N.; Roth, T.; Rosenthal, L.; Andreski, P. Daytime sleepiness: An epidemiological study of young adults. Am. J. Public Health 1997, 87, 1649–1653. [Google Scholar] [CrossRef] [Green Version]
- Jarrin, D.C.; McGrath, J.J.; Quon, E.C. Objective and subjective socioeconomic gradients exist for sleep in children and adolescents. Health. Psychol. Off. J. Div. Health Psychol. Am. Psychol. Assoc. 2014, 33, 301–305. [Google Scholar] [CrossRef] [Green Version]
- Pallesen, S.; Saxvig, I.W.; Molde, H.; Sørensen, E.; Wilhelmsen-Langeland, A.; Bjorvatn, B. Brief report: Behaviorally induced insufficient sleep syndrome in older adolescents: Prevalence and correlates. J. Adolesc. 2011, 34, 391–395. [Google Scholar] [CrossRef]
- Baker, F.C.; Wolfson, A.R.; Lee, K.A. Association of sociodemographic, lifestyle, and health factors with sleep quality and daytime sleepiness in women: Findings from the 2007 National Sleep Foundation “Sleep in America Poll”. J. Women’s Health 2009, 18, 841–849. [Google Scholar] [CrossRef]
- Kim, H.; Young, T. Subjective Daytime Sleepiness: Dimensions and Correlates in the General Population. Sleep 2005, 28, 625–634. [Google Scholar] [CrossRef] [PubMed] [Green Version]
- Hara, C.; Rocha, F.L.; Lima-Costa, M.F. Prevalence of excessive daytime sleepiness and associated factors in a Brazilian community: The Bambui study. Sleep Med. 2004, 5, 31–36. [Google Scholar] [CrossRef] [PubMed]
- Gander, P.H.; Marshall, N.S.; Harris, R.; Reid, P. The Epworth Sleepiness Scale: Influence of Age, Ethnicity, and Socioeconomic Deprivation. Epworth Sleepiness Scores of Adults in New Zealand. Sleep 2005, 28, 249–254. [Google Scholar] [CrossRef] [PubMed] [Green Version]
- Sosso, F.E.; Matos, E. Socioeconomic disparities in obstructive sleep apnea: A systematic review of empirical research. Sleep Breath. 2021, 25, 1729–1739. [Google Scholar] [CrossRef] [PubMed]
- Petrovic, D.; Haba-Rubio, J.; Carmeli, C.; Vollenweider, P.; Heinzer, R.; Stringhini, S. Social inequalities in sleep-disordered breathing: Evidence from the CoLaus|HypnoLaus study. J. Sleep Res. 2019, 28, e12799. [Google Scholar] [CrossRef] [Green Version]
- Bagley, E.J.; Kelly, R.J.; Buckhalt, J.A.; El-Sheikh, M. What keeps low-SES children from sleeping well: The role of presleep worries and sleep environment. Sleep Med. 2014, 16, 496–502. [Google Scholar] [CrossRef] [Green Version]
- Grandner, M.A.; Petrov, M.E.; Rattanaumpawan, P.; Jackson, N.; Platt, A.; Patel, N.P. Sleep symptoms, race/ethnicity, and socioeconomic position. J. Clin. Sleep Med. Off. Publ. Am. Acad. Sleep Med. 2013, 9, 897–905. [Google Scholar] [CrossRef] [Green Version]
- Adams, J. Socioeconomic position and sleep quantity in UK adults. J. Epidemiol. Community Health 2006, 60, 267–269. [Google Scholar] [CrossRef] [Green Version]
- Silva-Perez, L.J.; Gonzalez-Cardenas, N.; Surani, S.; Sosso, F.E.; Surani, S.R. Socioeconomic Status in Pregnant Women and Sleep Quality During Pregnancy. Cureus 2019, 11, e6183. [Google Scholar] [CrossRef] [Green Version]
- Hale, L.; Troxel, W.; Buysse, D.J. Sleep Health: An Opportunity for Public Health to Address Health Equity. Annu. Rev. Public Health 2020, 41, 81–99. [Google Scholar] [CrossRef] [Green Version]
- Page, M.J.; McKenzie, J.E.; Bossuyt, P.M.; Boutron, I.; Hoffmann, T.C.; Mulrow, C.D.; Shamseer, L.; Tetzlaff, J.M.; Akl, E.A.; Brennan, S.E.; et al. The PRISMA 2020 statement: An updated guideline for reporting systematic reviews. BMJ 2021, 372, 105906. [Google Scholar] [CrossRef]
- Tomaso, C.C.; Nelson, J.M.; Espy, K.A.; Nelson, T.D. Associations between different components of executive control in childhood and sleep problems in early adolescence: A longitudinal study. J. Health Psychol. 2018, 25, 2440–2452. [Google Scholar] [CrossRef] [PubMed]
- Miner, B.; Gill, T.M.; Yaggi, H.K.; Redeker, N.S.; Van Ness, P.H.; Han, L.; Fragoso, C.A.V. Insomnia in Community-Living Persons with Advanced Age. J. Am. Geriatr. Soc. 2018, 66, 1592–1597. [Google Scholar] [CrossRef] [PubMed]
- Stringhini, S.; Haba-Rubio, J.; Marques-Vidal, P.; Waeber, G.; Preisig, M.; Guessous, I.; Bovet, P.; Vollenweider, P.; Tafti, M.; Heinzer, R. Association of socioeconomic status with sleep disturbances in the Swiss population-based CoLaus study. Sleep Med. 2015, 16, 469–476. [Google Scholar] [CrossRef] [PubMed]
- Schwartz, N.G.; Rattner, A.; Schwartz, A.R.; Mokhlesi, B.; Gilman, R.H.; Bernabe-Ortiz, A.; Miranda, J.J.; Checkley, W. Sleep Disordered Breathing in Four Resource-Limited Settings in Peru: Prevalence, Risk Factors, and Association with Chronic Diseases. Sleep 2015, 38, 1451–1459. [Google Scholar] [CrossRef] [Green Version]
- Cunningham, T.J.; Ford, E.S.; Chapman, D.P.; Liu, Y.; Croft, J.B. Independent and joint associations of race/ethnicity and educational attainment with sleep-related symptoms in a population-based US sample. Prev. Med. 2015, 77, 99–105. [Google Scholar] [CrossRef] [Green Version]
- Ng, W.L.; Freak-Poli, R.; Peeters, A. The Prevalence and Characteristics Associated With Excessive Daytime Sleepiness Among Australian Workers. J. Occup. Environ. Med. 2014, 56, 935–945. [Google Scholar] [CrossRef]
- Jarrin, D.C.; McGrath, J.J.; Silverstein, J.E.; Drake, C. Objective and Subjective Socioeconomic Gradients Exist for Sleep Quality, Sleep Latency, Sleep Duration, Weekend Oversleep, and Daytime Sleepiness in Adults. Behav. Sleep Med. 2013, 11, 144–158. [Google Scholar] [CrossRef] [Green Version]
- Doi, Y.; Minowa, M.; Tango, T. Impact and Correlates of Poor Sleep Quality in Japanese White-Collar Employees. Sleep 2003, 26, 467–471. [Google Scholar] [CrossRef]
- Philbrook, L.E.; Saini, E.K.; Fuller-Rowell, T.E.; Buckhalt, J.A.; El-Sheikh, M. Socioeconomic status and sleep in adolescence: The role of family chaos. J. Fam. Psychol. 2020, 34, 577–586. [Google Scholar] [CrossRef]
- Ansarin, K.; Sahebi, L.; Sabur, S. Obstructive sleep apnea syndrome: Complaints and housing characteristics in a population in the United States. Sao Paulo Med. J. 2013, 131, 220–227. [Google Scholar] [CrossRef] [PubMed] [Green Version]
- Stamatakis, K.A.; Kaplan, G.A.; Roberts, R.E. Short Sleep Duration Across Income, Education, and Race/Ethnic Groups: Population Prevalence and Growing Disparities During 34 Years of Follow-Up. Ann. Epidemiol. 2007, 17, 948–955. [Google Scholar] [CrossRef] [PubMed] [Green Version]
- Lindberg, E.; Janson, C.; Gislason, T.; Björnsson, E.; Hetta, J.; Boman, G. Sleep Disturbances in a Young Adult Population: Can Gender Differences Be Explained by Differences in Psychological Status? Sleep 1997, 20, 381–387. [Google Scholar] [CrossRef] [PubMed] [Green Version]
- Benca, R.M.; Obermeyer, W.H.; Thisted, R.A.; Gillin, J.C. Sleep and psychiatric disorders. A meta-analysis. Arch. Gen. Psychiatry 1992, 49, 651–670. [Google Scholar] [CrossRef]
- Arber, S.; Bote, M.; Meadows, R. Gender and socio-economic patterning of self-reported sleep problems in Britain. Soc. Sci. Med. 2009, 68, 281–289. [Google Scholar] [CrossRef] [Green Version]
- El-Sheikh, M.; Buckhalt, J.A.; Cummings, E.M.; Keller, P. Sleep disruptions and emotional insecurity are pathways of risk for children. J. Child Psychol. Psychiatry 2006, 48, 88–96. [Google Scholar] [CrossRef]
- Foley, D.; Ancoli-Israel, S.; Britz, P.; Walsh, J. Sleep disturbances and chronic disease in older adults: Results of the 2003 National Sleep Foundation Sleep in America Survey. J. Psychosom. Res. 2004, 56, 497–502. [Google Scholar] [CrossRef]
- Andrew, M.K. CHAPTER 33—Social Vulnerability in Old Age. In Brocklehurst’s Textbook of Geriatric Medicine and Gerontology, 7th ed.; Fillit, H.M., Rockwood, K., Woodhouse, K., Eds.; W.B. Saunders: Philadelphia, PA, USA, 2010; pp. 198–204. [Google Scholar]
- Hoyos, C.M.; Gordon, C.; Terpening, Z.; Norrie, L.; Lewis, S.J.G.; Hickie, I.B.; Naismith, S.L. Circadian rhythm and sleep alterations in older people with lifetime depression: A case-control study. BMC Psychiatry 2020, 20, 1–9. [Google Scholar] [CrossRef]
- Li, J.; Vitiello, M.V.; Gooneratne, N.S. Sleep in Normal Aging. Sleep Med. Clin. 2018, 13, 1–11. [Google Scholar] [CrossRef]
- Etindele Sosso, F.A.; Holmes, S.D.; Weinstein, A.A. Influence of socioeconomic status on objective sleep measurement: A systematic review and meta-analysis of actigraphy studies. Sleep Health 2021, 74, 417–428. [Google Scholar] [CrossRef]
- Etindele Sosso, F.A. Measuring Sleep Health Disparities with Polysomnography: A Systematic Review of Preliminary Findings. Clocks&Sleep 2022, 4, 80–87. [Google Scholar]

| Articles | Included | Kappa | Articles | Included | Kappa | Articles | Included | Kappa | Articles | Included | Kappa | |||
|---|---|---|---|---|---|---|---|---|---|---|---|---|---|---|
| 1 | Y | 0.82 | 36 | N | 0.82 | 71 | N | 0.76 | 106 | N | 0.72 | |||
| 2 | N | 0.72 | 37 | N | 0.72 | 72 | N | 0.72 | 107 | Y | 0.76 | |||
| 3 | N | 0.9 | 38 | N | 0.72 | 73 | N | 0.73 | 108 | N | 0.74 | |||
| 4 | N | 0.77 | 39 | N | 0.79 | 74 | N | 0.80 | 109 | N | 0.78 | |||
| 5 | N | 0.80 | 40 | N | 0.81 | 75 | N | 0.86 | 110 | N | 0.83 | |||
| 6 | N | 0.74 | 41 | N | 0.65 | 76 | N | 0.74 | 111 | N | 0.82 | |||
| 7 | N | 0.84 | 42 | N | 0.89 | 77 | N | 0.69 | 112 | N | 0.81 | |||
| 8 | N | 0.67 | 43 | N | 0.84 | 78 | N | 0.72 | 113 | N | 0.78 | |||
| 9 | N | 0.80 | 44 | N | 0.78 | 79 | N | 0.74 | 114 | N | 0.74 | |||
| 10 | N | 0.67 | 45 | N | 0.83 | 80 | N | 0.81 | 115 | N | 0.76 | |||
| 11 | N | 0.85 | 46 | N | 0.68 | 81 | N | 0.76 | 116 | N | 0.83 | |||
| 12 | N | 0.79 | 47 | N | 0.67 | 82 | N | 0.74 | 117 | N | 0.74 | |||
| 13 | N | 0.78 | 48 | N | 0.76 | 83 | N | 0.72 | 118 | N | 0.68 | |||
| 14 | Y | 0.86 | 49 | N | 0.85 | 84 | N | 0.74 | 119 | N | 0.62 | |||
| 15 | N | 0.92 | 50 | N | 0.84 | 85 | N | 0.73 | 120 | N | 0.68 | |||
| 16 | N | 0.68 | 51 | N | 0.80 | 86 | N | 0.74 | 121 | N | 0.72 | |||
| 17 | N | 0.81 | 52 | N | 0.70 | 87 | N | 0.75 | 122 | Y | 0.76 | |||
| 18 | N | 0.81 | 53 | Y | 0.92 | 88 | N | 0.76 | 123 | N | 0.74 | |||
| 19 | N | 0.64 | 54 | Y | 0.84 | 89 | N | 0.82 | 124 | N | 0.82 | |||
| 20 | N | 0.69 | 55 | N | 0.83 | 90 | N | 0.63 | 125 | N | 0.74 | |||
| 21 | N | 0.82 | 56 | N | 0.78 | 91 | N | 0.68 | 126 | N | 0.71 | |||
| 22 | N | 0.81 | 57 | N | 0.71 | 92 | N | 0.71 | 127 | N | 0.62 | |||
| 23 | N | 0.76 | 58 | N | 0.82 | 93 | N | 0.74 | 128 | N | 0.78 | |||
| 24 | N | 0.74 | 59 | N | 0.79 | 94 | N | 0.75 | 129 | N | 0.81 | |||
| 25 | N | 0.79 | 60 | N | 0.71 | 95 | N | 0.82 | 130 | N | 0.72 | |||
| 26 | N | 0.75 | 61 | N | 0.84 | 96 | N | 0.68 | 131 | N | 0.73 | |||
| 27 | N | 0.81 | 62 | N | 0.86 | 97 | N | 0.74 | 132 | N | 0.76 | |||
| 28 | N | 0.86 | 63 | N | 0.90 | 98 | N | 0.76 | 133 | Y | 0.85 | |||
| 29 | N | 0.90 | 64 | N | 0.76 | 99 | N | 0.82 | 134 | N | 0.74 | |||
| 30 | N | 0.68 | 65 | N | 0.78 | 100 | N | 0.86 | 135 | N | 0.67 | |||
| 31 | N | 0.75 | 66 | Y | 0.74 | 101 | N | 0.81 | 136 | N | 0.64 | |||
| 32 | N | 0.88 | 67 | N | 0.90 | 102 | Y | 0.78 | 137 | N | 0.72 | |||
| 33 | N | 0.65 | 68 | N | 0.75 | 103 | N | 0.74 | 138 | Y | 0.74 | |||
| 34 | N | 0.78 | 69 | N | 0.76 | 104 | N | 0.76 | 139 | N | 0.76 | |||
| 35 | N | 0.74 | 70 | N | 0.81 | 105 | N | 0.82 | 140 | N | 0.74 | |||
| 141 | N | 0.71 | 176 | N | 0.74 | 194 | N | 0.76 | 229 | N | 0.75 | |||
| 142 | N | 0.87 | 177 | N | 0.74 | 195 | Y | 0.78 | 230 | N | 0.81 | |||
| 143 | N | 0.74 | 178 | N | 0.82 | 196 | N | 0.74 | 231 | Y | 0.86 | |||
| 144 | N | 0.64 | 179 | Y | 0.74 | 197 | N | 0.90 | 232 | N | 0.76 | |||
| 145 | N | 0.74 | 180 | N | 0.71 | 198 | N | 0.75 | 233 | N | 0.74 | |||
| 146 | N | 0.69 | 181 | N | 0.62 | 199 | N | 0.76 | 234 | N | 0.71 | |||
| 147 | N | 0.72 | 182 | N | 0.78 | 200 | N | 0.81 | 235 | N | 0.87 | |||
| 148 | N | 0.71 | 183 | N | 0.81 | 201 | N | 0.76 | 236 | N | 0.74 | |||
| 149 | N | 0.74 | 184 | N | 0.72 | 202 | N | 0.72 | 237 | N | 0.64 | |||
| 150 | N | 0.67 | 185 | N | 0.73 | 203 | N | 0.73 | 238 | N | 0.74 | |||
| 151 | N | 0.82 | 186 | N | 0.76 | 204 | N | 0.80 | 239 | N | 0.69 | |||
| 152 | N | 0.67 | 187 | N | 0.71 | 205 | N | 0.86 | 240 | N | 0.72 | |||
| 153 | N | 0.64 | 188 | N | 0.82 | 206 | N | 0.90 | 241 | N | 0.71 | |||
| 154 | Y | 0.90 | 189 | N | 0.79 | 207 | N | 0.77 | 242 | N | 0.74 | |||
| 155 | Y | 0.76 | 190 | N | 0.71 | 208 | N | 0.80 | 243 | N | 0.74 | |||
| 156 | Y | 0.82 | 191 | N | 0.84 | 209 | N | 0.74 | 244 | N | 0.82 | |||
| 157 | N | 0.74 | 192 | N | 0.86 | 210 | N | 0.84 | 245 | N | 0.74 | |||
| 158 | N | 0.76 | 176 | N | 0.74 | 211 | N | 0.67 | 246 | N | 0.71 | |||
| 159 | N | 0.68 | 177 | N | 0.74 | 212 | N | 0.80 | 247 | N | 0.62 | |||
| 160 | N | 0.85 | 178 | N | 0.82 | 213 | N | 0.67 | 248 | N | 0.78 | |||
| 161 | N | 0.74 | 179 | Y | 0.74 | 214 | N | 0.85 | 249 | Y | 0.81 | |||
| 162 | N | 0.67 | 180 | N | 0.71 | 215 | N | 0.79 | 250 | N | 0.62 | |||
| 163 | N | 0.64 | 181 | N | 0.62 | 216 | N | 0.78 | 229 | N | 0.75 | |||
| 164 | N | 0.72 | 182 | N | 0.78 | 217 | N | 0.86 | 230 | N | 0.81 | |||
| 165 | N | 0.74 | 183 | N | 0.81 | 218 | N | 0.92 | 231 | Y | 0.86 | |||
| 166 | N | 0.76 | 184 | N | 0.72 | 219 | Y | 0.68 | 232 | N | 0.76 | |||
| 167 | N | 0.74 | 185 | N | 0.73 | 220 | N | 0.81 | 233 | N | 0.74 | |||
| 168 | N | 0.71 | 186 | N | 0.76 | 221 | N | 0.81 | 234 | N | 0.71 | |||
| 169 | N | 0.87 | 187 | N | 0.71 | 222 | N | 0.64 | 235 | N | 0.87 | |||
| 170 | N | 0.74 | 188 | N | 0.82 | 223 | N | 0.69 | 236 | N | 0.74 | |||
| 171 | N | 0.64 | 189 | N | 0.79 | 224 | N | 0.82 | 237 | N | 0.64 | |||
| 172 | Y | 0.74 | 190 | N | 0.71 | 225 | N | 0.81 | 238 | N | 0.74 | |||
| 173 | N | 0.69 | 191 | N | 0.84 | 226 | N | 0.76 | 239 | N | 0.69 | |||
| 174 | N | 0.72 | 192 | N | 0.86 | 227 | N | 0.74 | 240 | N | 0.72 | |||
| 175 | Y | 0.71 | 193 | N | 0.90 | 228 | N | 0.79 | 241 | N | 0.71 | |||
| 242 | N | 0.74 | 246 | N | 0.71 | 250 | N | 0.62 | 254 | N | 0.68 | |||
| 243 | N | 0.74 | 247 | N | 0.62 | 251 | N | 0.75 | 255 | N | 0.74 | |||
| 244 | N | 0.82 | 248 | N | 0.78 | 252 | N | 0.68 | 256 | N | 0.76 | |||
| 245 | N | 0.74 | 249 | Y | 0.81 | 253 | N | 0.75 | 257 | N | 0.78 |
Publisher’s Note: MDPI stays neutral with regard to jurisdictional claims in published maps and institutional affiliations. |
© 2022 by the authors. Licensee MDPI, Basel, Switzerland. This article is an open access article distributed under the terms and conditions of the Creative Commons Attribution (CC BY) license (https://creativecommons.org/licenses/by/4.0/).
Share and Cite
Bendaoud, I.; Etindele Sosso, F.A. Socioeconomic Position and Excessive Daytime Sleepiness: A Systematic Review of Social Epidemiological Studies. Clocks & Sleep 2022, 4, 240-259. https://doi.org/10.3390/clockssleep4020022
Bendaoud I, Etindele Sosso FA. Socioeconomic Position and Excessive Daytime Sleepiness: A Systematic Review of Social Epidemiological Studies. Clocks & Sleep. 2022; 4(2):240-259. https://doi.org/10.3390/clockssleep4020022
Chicago/Turabian StyleBendaoud, Imene, and Faustin Armel Etindele Sosso. 2022. "Socioeconomic Position and Excessive Daytime Sleepiness: A Systematic Review of Social Epidemiological Studies" Clocks & Sleep 4, no. 2: 240-259. https://doi.org/10.3390/clockssleep4020022
APA StyleBendaoud, I., & Etindele Sosso, F. A. (2022). Socioeconomic Position and Excessive Daytime Sleepiness: A Systematic Review of Social Epidemiological Studies. Clocks & Sleep, 4(2), 240-259. https://doi.org/10.3390/clockssleep4020022