Article

Differential Gene Expression in Brain and Liver Tissue of Wistar Rats after Rapid Eye Movement Sleep Deprivation

1
School of Biotechnology, Jawaharlal Nehru University, New Delhi 110067, India
2
Department of Ecology, Evolution, and Behavior, The Alexander Silberman Institute of Life Sciences, The Hebrew University of Jerusalem, Jerusalem 91904, Israel
3
Nano Herb Research Laboratory, Kalinga Institute of Industrial Technology (KIIT) Technology Bio Incubator, Campus-11, KIIT Deemed to be University, Bhubaneswar, Odisha 751024, India
*
Authors to whom correspondence should be addressed.
Clocks & Sleep 2020, 2(4), 442-465; https://doi.org/10.3390/clockssleep2040033
Submission received: 10 September 2020 / Revised: 13 October 2020 / Accepted: 21 October 2020 / Published: 23 October 2020
(This article belongs to the Section Animal Basic Research)

Abstract

:
Sleep is essential for the survival of most living beings. Numerous researchers have identified a series of genes that are thought to regulate “sleep-state” or the “deprived state”. As sleep has a significant effect on physiology, we believe that lack of total sleep, or particularly rapid eye movement (REM) sleep, for a prolonged period would have a profound impact on various body tissues. Therefore, using the microarray method, we sought to determine which genes and processes are affected in the brain and liver of rats following nine days of REM sleep deprivation. Our findings showed that REM sleep deprivation affected a total of 652 genes in the brain and 426 genes in the liver. Only 23 genes were affected commonly, 10 oppositely, and 13 similarly across brain and liver tissue. Our results suggest that nine-day REM sleep deprivation differentially affects genes and processes in the brain and liver of rats.

1. Introduction

Sleep is a universal phenomenon but still we lack fundamental knowledge of its overall functions and purpose. However, most comparative sleep data exist for terrestrial vertebrates, with much less known about sleep in invertebrates [1]. Though, recently the scientific community has sought to characteristic sleep in non-mammalian species like the fruit fly (Drosophila melanogaster) [2,3,4], the zebrafish (Danio rerio) [5,6,7], the nematode (Caenorhabditis elegans) [8], and bees (Apis mellifera, and Bombus terrestris) [9,10,11,12]. Prolonged sleep deprivation is fatal in many of the animals studied, except for pigeons, and several studies have sought to address how sleep promotes survival in rodents and primates [13,14,15,16]. Despite the lack of general knowledge regarding the functions of sleep, loss of sleep has been shown to drastically alter the physiology of many of the animals studied thus far [17,18,19]. The degree of physiological changes and the fatality that sleep loss brings about often vary depending upon the nature and duration of sleep deprivation [20,21]. Many theories have been proposed to explain the evolutionary significance and functions of sleep, which includes “null” and “synaptic plasticity” theories [22,23]. Recent advancements in sleep research has shed light on two major functions of sleep-reducing synaptic potentiation and waste clearance mediated by glymphatic system [24,25,26]. Thus, sleep seems to have specific, overarching functions for all species that depend on it [19]. While a single characterization cannot be ascribed to sleep, numerous studies link its loss to detrimental effects on metabolism, behavior, immunity, cellular functions, and hormonal regulations across species [27,28,29,30]. Thus, we may suggest that sleep is generally necessary, and most living beings cannot be deprived of it for a long time. There are some mechanisms that are associated with behavioral plasticity that are dependent on sociality or physiological state regarding sleep regulation [12,31]. Additionally, in Drosophila, not all stages of sleep are necessary for basic survival, but questions relating to the critical functions of sleep, plasticity, and its overall importance are still being explored [31].
Rapid eye movement (REM) sleep is an essential part of sleep and is present only in avians and mammals, with the exception of reptiles, in which REM sleep has only been recently discovered [32]. Unearthed thus far, the functional aspects of REM sleep includes mainly memory consolidation, brain maturation, muscle re-aeration, special memory acquisition, and maintenance of general physiological mechanisms of the body [33,34,35,36,37,38,39]. In the brain, REM sleep is involved in the reorganization of hippocampal excitability, pruning and maintenance of new synapses during development, and learning and memory consolidation [40,41,42]. Some recent studies also suggest that lack of REM sleep may cause cell death of somatic cells and neurons [43,44,45]. Outside of the brain, deprivation of the REM sleep was found to be associated with acute phase response in the liver, increased synthesis of pro-inflammatory cytokines such as IL1β, IL-6, and IL-12, and an increase in liver enzymes, alanine transaminase and aspartic transaminase [46]. In addition, REM sleep deprivation induces the production of reactive oxygen species (ROS) and causes inflammation [47] and an increase in nitric oxide (NO) in hepatocytes, along with an increase in sensitivity to oxidative stress by the hepatocytes [48]. REM loss also affected the weight and content of nucleic acid in the liver [49]. REM loss was also found to be further associated with oxidative stress and liver circadian clock gene expression [50]. An elevated increase in metabolic rate and UCP1 gene expression is reported in response to chronic REM sleep loss in the brown adipose tissue of rats [51]. Recently, REM sleep loss has been found to be associated with blood-brain barrier function regulation and metabolic changes [52,53].
On the genomic level, the reduction of gene expression related to energy metabolism (e.g., glucose type I transporter (Glut1)), growth (e.g., Bdnf), vesicle fusion, and many other metabolic processes has been found to be affected by sleep [54,55]. Another study detected a decrease in GluR1-containing α-amino-3-hydroxy-5-methyl-4-isoxazolepropionic acid receptor (AMPAR) levels during sleep, as well as a decrease in AMPAR, CamKII, and GSK3 beta phosphorylation [56]. The Synaptic Homeostasis Hypothesis (SHY), which postulates that wakefulness and sleep are linked to a net increase and decrease in synaptic strength, is supported by these findings [57,58]. In rodents, synaptic plasticity-related expression levels of immediate early genes (IEG), such as Egr1, Arc, and Fos, were found to decrease from wakefulness to sleep [55,59,60,61,62,63,64,65,66,67]. Some of the genes related to synaptic plasticity theory, e.g., Arc, Bdnf, Creb1, Egr1, Fos, Nr4a1, Camk4, Ppp2ca, and Ppp2r2d, were studied in detail for slow-wave sleep and REM sleep [68]. It has been proposed that some of these genes, such as Arc and Egr1, play a key role in long term potentiation (LTP) [59,60,62,63,64,66,69,70,71,72]. It is suspected that other genes are also important for long-term depression, such as Ppp2ca and Ppp2r2d, which code for subunits of PP2A [73], while REM sleep deprivation in the rat dorsal hippocampus has been shown to decrease LTP, synaptic transmission, protein levels of the glutamate receptor, and activation of ERK/MAPK [74].
In the present study, we compared the effect of prolonged REM sleep loss in the brain and liver in order to compare and contrast the effects that occur simultaneously on these vital organs, as previous studies have indicated that REM sleep may have drastic effects on the liver [44,46,48]. To address this, we used a microarray technique to compare gene expression and identify the processes affected in the brain and liver of a given subject after REM sleep deprivation for nine days. Microarray is a valuable tool for measuring the dynamics of gene expression in a biological system and can be used to measure the differences in the gene expression profile of different tissues under the same physiological conditions [19,75,76]. Most sleep studies that involved microarray analysis have been performed in the brain, although recently research has indicated that other organs may also play a crucial role [54,77,78,79,80,81,82]. We first hypothesized that prolonged REM sleep loss will differentially affect genes and associated processes in the brain and liver. Secondly, we hypothesized that REM sleep loss would affect functions related to synaptic potentiation and maintenance in the brain and metabolism and immune response to infection related mechanisms in the liver.
Previous studies involving analysis of microarray returned many genes that were associated with the gene ontology (GO) term (potentiation of synaptic plasticity), which largely supports the ‘synaptic homeostasis theory’ [54,83]. In the cerebral cortex of the mouse and, to a lesser degree, hypothalamus, gene encoding proteins of various biosynthetic pathways for heme, protein, and lipid are up-regulated throughout sleep [80]. During sleep, a significant number of genes encoding the structural constituents of the ribosomes, translation-regulation activity, and formation of transfer RNA (tRNA) and ribosome biogenesis are also up-regulated. Genes whose expression gradually increases during sleep include those that encode for several cholesterol-synthesis pathway enzymes, proteins involved in the uptake of cholesterol, the transport of transcription factors, and chaperones that regulated the transcription of genes associated with cholesterol [80]. Prolonged wakefulness effects in the fruit fly resulted in the down-regulation of several genes involved in protein production [82]. Sleep deprivation in mice causes a decrease in the expression of genes in the cerebral cortex and hypothalamus, which encode proteins that are involved in key pathways of carbohydrate metabolism, energy production, tricarboxylic acid (TCA) anabolism, and various metabolic pathways (lipid, aldehyde, amine synthesis) [80]. Further, microarrays have shown that there are transcript level variations in many genes involved in the regulation of reactive oxygen species (ROS), including heme oxygenase, superoxide dismutase, and catalase in patients with obstructive sleep apnea [84]. The dopamine receptor-signaling pathway regulating sleep, learning, and its plasticity are well known [85,86]. Sleep disorders and sleep deprivation have been correlated with the dopaminergic, cholinergic, and GABAergic regulation of synaptic transmission, each of which are terms that were significantly enriched for genes that were down-regulated in our study [55,87,88,89,90]. A recent microarray analysis involving mice shows that Hspa5 gene expression increases not only in the brain but also in the liver as sleep deprivation increases [81]. Overall, currently, however, there is little knowledge available about how sleep including REM, its loss, and the prolonged wakefulness affects expression of genes in peripheral tissues, an area that is open for future research. Our current study fits nicely here to answer many REM sleep loss related questions comparing microarray dataset between brain and liver and provide a unique dataset for future research.

2. Material and Methods

Male Wistar rats, weighing between 220–260 g, were used for this study. Animals were housed with a 12:12 hr. L:D cycle (7:00 a.m. lights on) and provided with food and water ad libitum. All experiments were carried out in compliance with the Institutional Animal Ethics Committee (IAEC-2010-11) of the Jawaharlal Nehru University, New Delhi, India.

2.1. REM Sleep Deprivation Procedure

Rats were REM sleep-deprived for nine consecutive days by using the flower pot method [91,92]. Subjects were kept on a relatively small, raised platform (6.5 cm in diameter) and surrounded by water. While, for the sham control (large platform control (LPC)), animals were kept on a larger platform (12.5 cm in diameter) under similar conditions to the experimental group. REM sleep-deprived animals could sit, crouch, and have a NREM-related sleep on this platform. However, due to muscle atonia during REM sleep, they were unable to have REM sleep on the small platform. Upon entering REM sleep, subjects fell into the water in order to disrupt the entirety of its cycle. Throughout our previous studies, there were no differences between the cage control (animals kept in cages) and the LPC control group of rats, and thus in this study only the LPC group included and referred to as the “control” throughout manuscript [46,48]. Rats were sacrificed between 10 a.m. and 12 p.m. on day nine, and the complete brain and liver were harvested and flash-frozen in liquid nitrogen for further analysis.

2.2. RNA Extraction and Quality Analysis

Total RNA was isolated from the entire brain and liver samples using standard protocol. Rats were anesthetized with isoflurane, and brain and liver samples were immediately dissected and frozen in liquid nitrogen. We isolated total RNA from the whole brain and liver of each animal using Trizol methods (Gibco-BRL, Gaithersburg, MD, USA), as directed by the manufacturer. The concentration of total RNA was measured using Nanodrop (Thermo fisher Scientific, Waltham, MA, USA) and quality analyzed using Bioanalyzer (Agilent, Santa Clara, CA, USA).

2.3. Microarray: Labeling, Hybridization, and Data Analysis

An equal amount of total RNA from the brain and liver were collected and sent to the Ocimum Biosolutions Ltd. (Hyderabad, Andhra Pradesh, India) subsidiary branch of Ocimum Biosolutions (Gaithersburg, MD, USA) genomics facility for microarray analysis. Affymetrix Rat Gene 1.0 ST Arrays containing more than 7000 annotated sequences and 18,000 expressed sequence tags (ESTs) were used. The Affymetrix Gene Chip Expression Technical Manual (Affymetrix Inc., Santa Clara, CA, USA) was used for marking, hybridization, and expression analysis of microarrays, according to previous methods [78]. The data analysis was performed using Affymetrix Expression Console and Programming Language-R [93,94].

2.4. Gene Ontology Analysis

Functional annotations of differentially expressed genes were obtained from the Gene Ontology Consortium database, based on their respective biological process, molecular functions, and cellular components [95]. Overrepresentation analysis, using a single-tailed Fisher exact probability test, based on the hypergeometric distribution, was used, and significant GO terms were stored (p < 0.05).

2.5. Pathway Analysis

Pathway analysis of microarray data was performed using the Kyoto Encyclopedia of Genes and Genomes (KEGG) software (Release 60.0 and 96.0, Kanehisa Laboratories, Japan). Several biochemical pathways are identified by physiological processes documented in the KEGG databank. Because rat species-specific functional gene annotations are still rare for several biological processes, general pathways, pathways of other organisms, and species-specific pathways were combined for a comprehensive analysis. We used the KEGG map pathway to visualize the maximal impact of REM sleep loss on the highly up-regulated genes involved in the protein translation processes [96,97,98]. We took KEGG copyright permission-200692, to represents and map the important gene on KEGG maps (ribosome pathway, neuroactive ligand-receptor interaction pathway, cancer pathway and glycerophospholipid metabolism pathway).

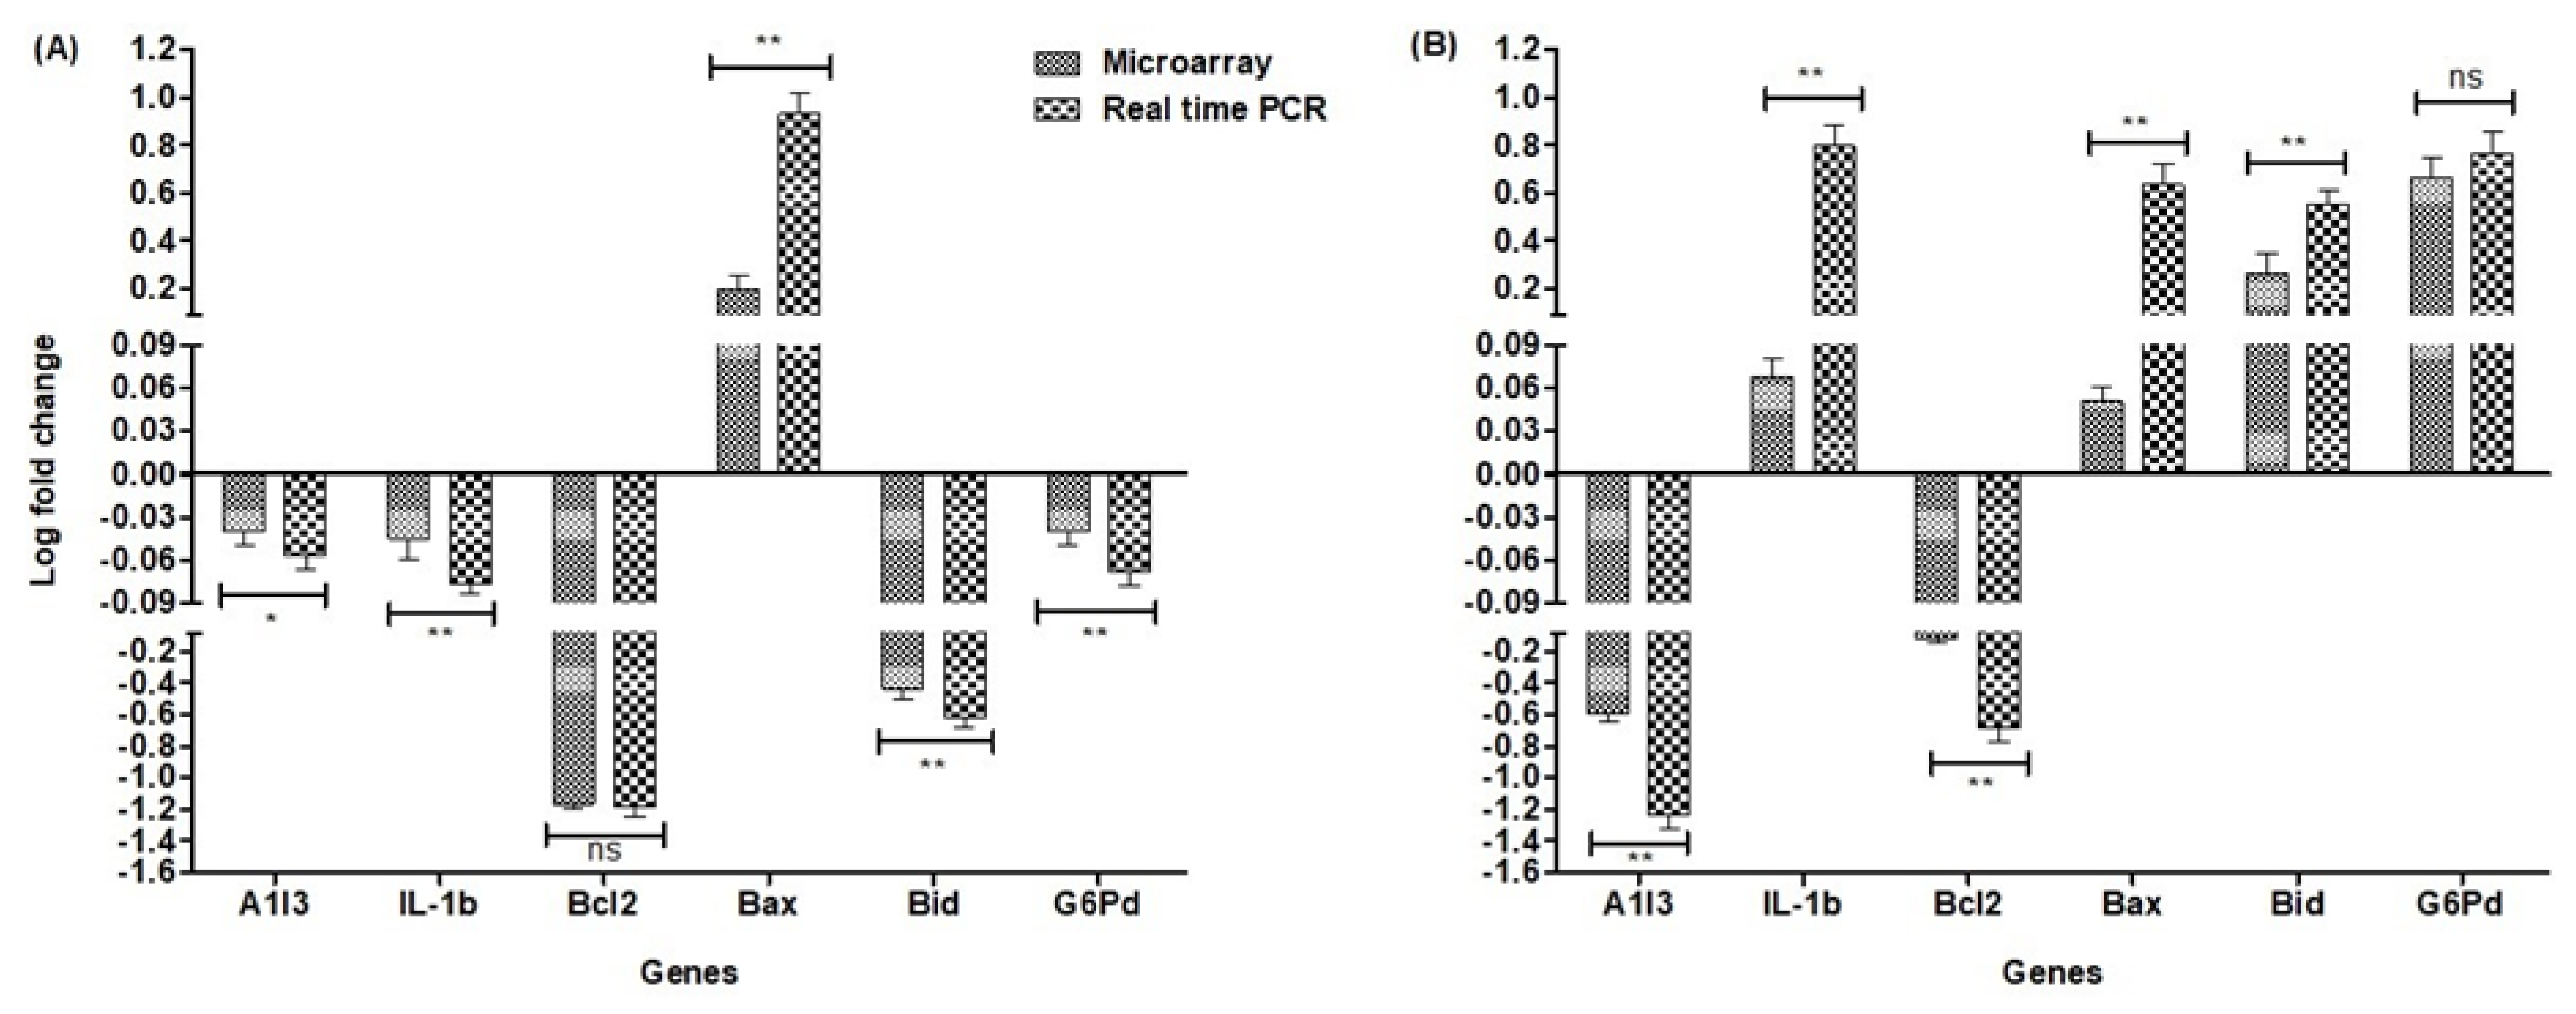
2.6. Validation of Array Expression with Real-Time Quantitative qPCR

Following analysis of the microarray, a group of genes were selected for validation by qPCR, based on their degree of change in expression. We tested for correlation between the effects of the microarray and qPCR, and the statistical significance was calculated (Figure 1). The microarray data used for the correlation was input as the Log2 ratio of the weighted average of each gene per composite array for all subjects. For qPCR, we used the mean Log2 ratio value stated by the qPCR of each subject. Six transcripts were selected for validation of microarray analysis using RT-PCR (Table S1). Controls were used to rule out the effect of any confounding variables. We tested the respective mRNA levels with RT-PCR. Samples obtained from liver and brain tissue were frozen and stored separately at −80 °C before mRNA was quantified. Total RNA was isolated using Trizol methods and re-transcribed using the ABI reverse transcription kit (Applied Biosystems, Catalog number: 4368814). TaqMan gene expression Master Mix (Applied Biosystems, Catalog Number: 4369016) and probes (Applied Biosystems, Table S1) were used for quantitative analysis of mRNA. Each cDNA sample was analyzed in triplicate. The RT-PCR reactions for all focal genes and Glyceraldehyde 3-phosphate dehydrogenase (GAPDH) were measured from the same cDNA sample and loaded onto the same 96-well analysis plate. We quantified the gene levels using 2−ΔΔCt methods, and GAPDH was used as a reference control gene for expression level normalization. Expression validation experiments were performed on the basis of five rats per group.

2.7. Statistics

The results of qRT-PCR are presented as a mean of ±SE. We used the Kolmogorov–Smirnov normality test to estimate the normality of the data. The Mann-Whitney U test was used to compare the pairwise expression of the microarray and RT-PCR expression for the respective genes used for liver and brain validation. The array experiments were analyzed, maintaining a p < 0.5 significance level. The KEGG bioinformatics map and diagrams were built based on an analysis of semantic similarity of terms using Wang’s method. Visualization of connectivity in network plots were designed in R using the cluster Profiler package [99,100]. All statistical analyzes considered p < 0.05 to be significant and were performed and plotted using software’s, namely Sigma plot (version 8.0 & 12.0 San Jose, CA 95131, USA), Graph Pad (version 5.1, San Diego, CA, USA) and Origin (version 6.0, OriginLab Corporation, Northampton, MA, USA).

3. Results

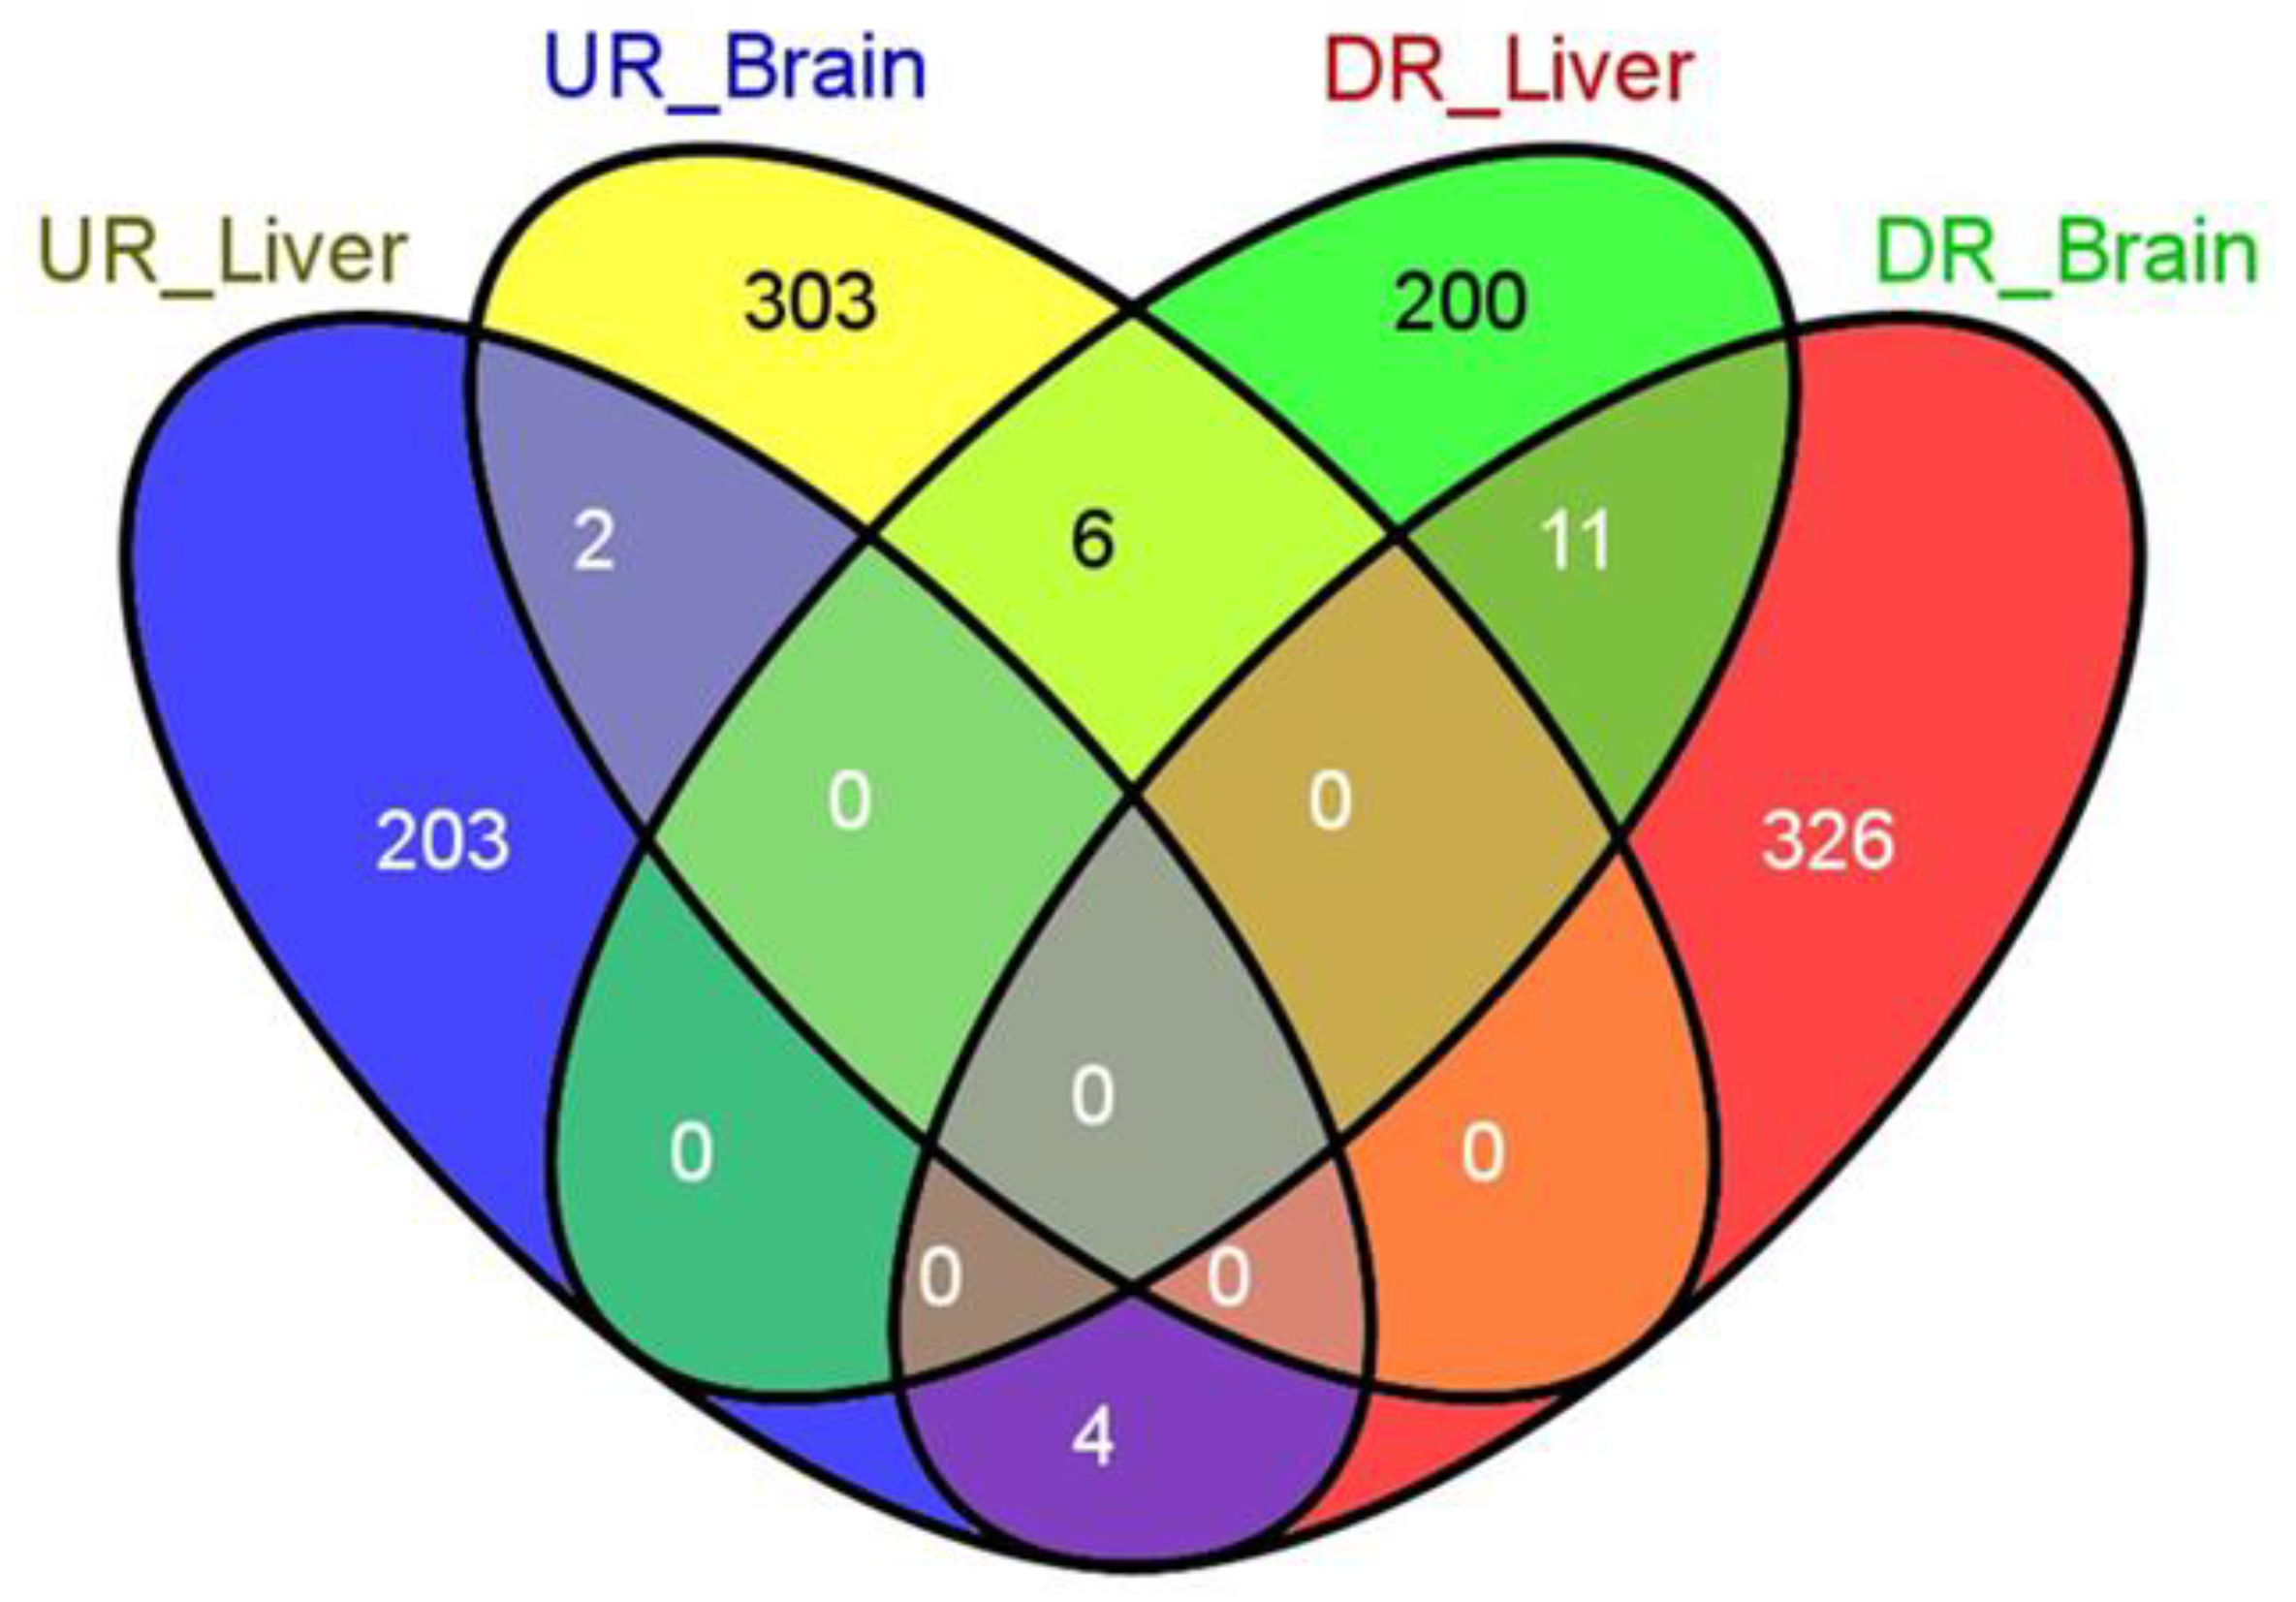
3.1. General Results

In the current analysis, we used the Affymetrix Rat Gene 1.0 ST Array, and data analysis was performed using Affymetrix Expression Console and R-software. A total of 311 up-regulated genes (Table S2A) and 341 down-regulated genes (Table S2B) were found in the brain. In contrast, 209 up-regulated genes (Table S2C) and 217 genes were down-regulated (Table S2D) in the liver (Figure 2).
Out of this pool, we found a set of genes that were commonly affected, either in the same or opposite direction, between the brain and the liver. For example, four of the eleven genes identified (Table S3A); namely WEE1 G2 Checkpoint Kinase (Wee1), Solute Carrier Family 2 Member 12 (Slc2a12), Harakiri, BCL2 Interacting Protein (Hrk), and Family With Sequence Similarity 110 Member B (Fam 110b) were negatively affected in both the brain and liver tissues (Figure 2). Similarly, only three of the six genes identified (Table S3B); namely Hemoglobin Subunit Alpha 1 (Hba-a1) and Major urinary protein 5 (Mup5) were up-regulated in the brain and down-regulated in the liver (Figure 2). In addition, we identified three genes (Table S3C); namely Histocompatibility 2, class II DR alpha (RT1-Da), Zinc Finger and BTB Domain Containing 6 (Zbtb6), and Transmembrane protein 106B (Tmem 106a) out of a total of four genes that were up-regulated in the liver and down-regulated in the brain (Figure 2). In order to deepen our analysis, we moved forward with gene ontology and KEGG pathway analysis.

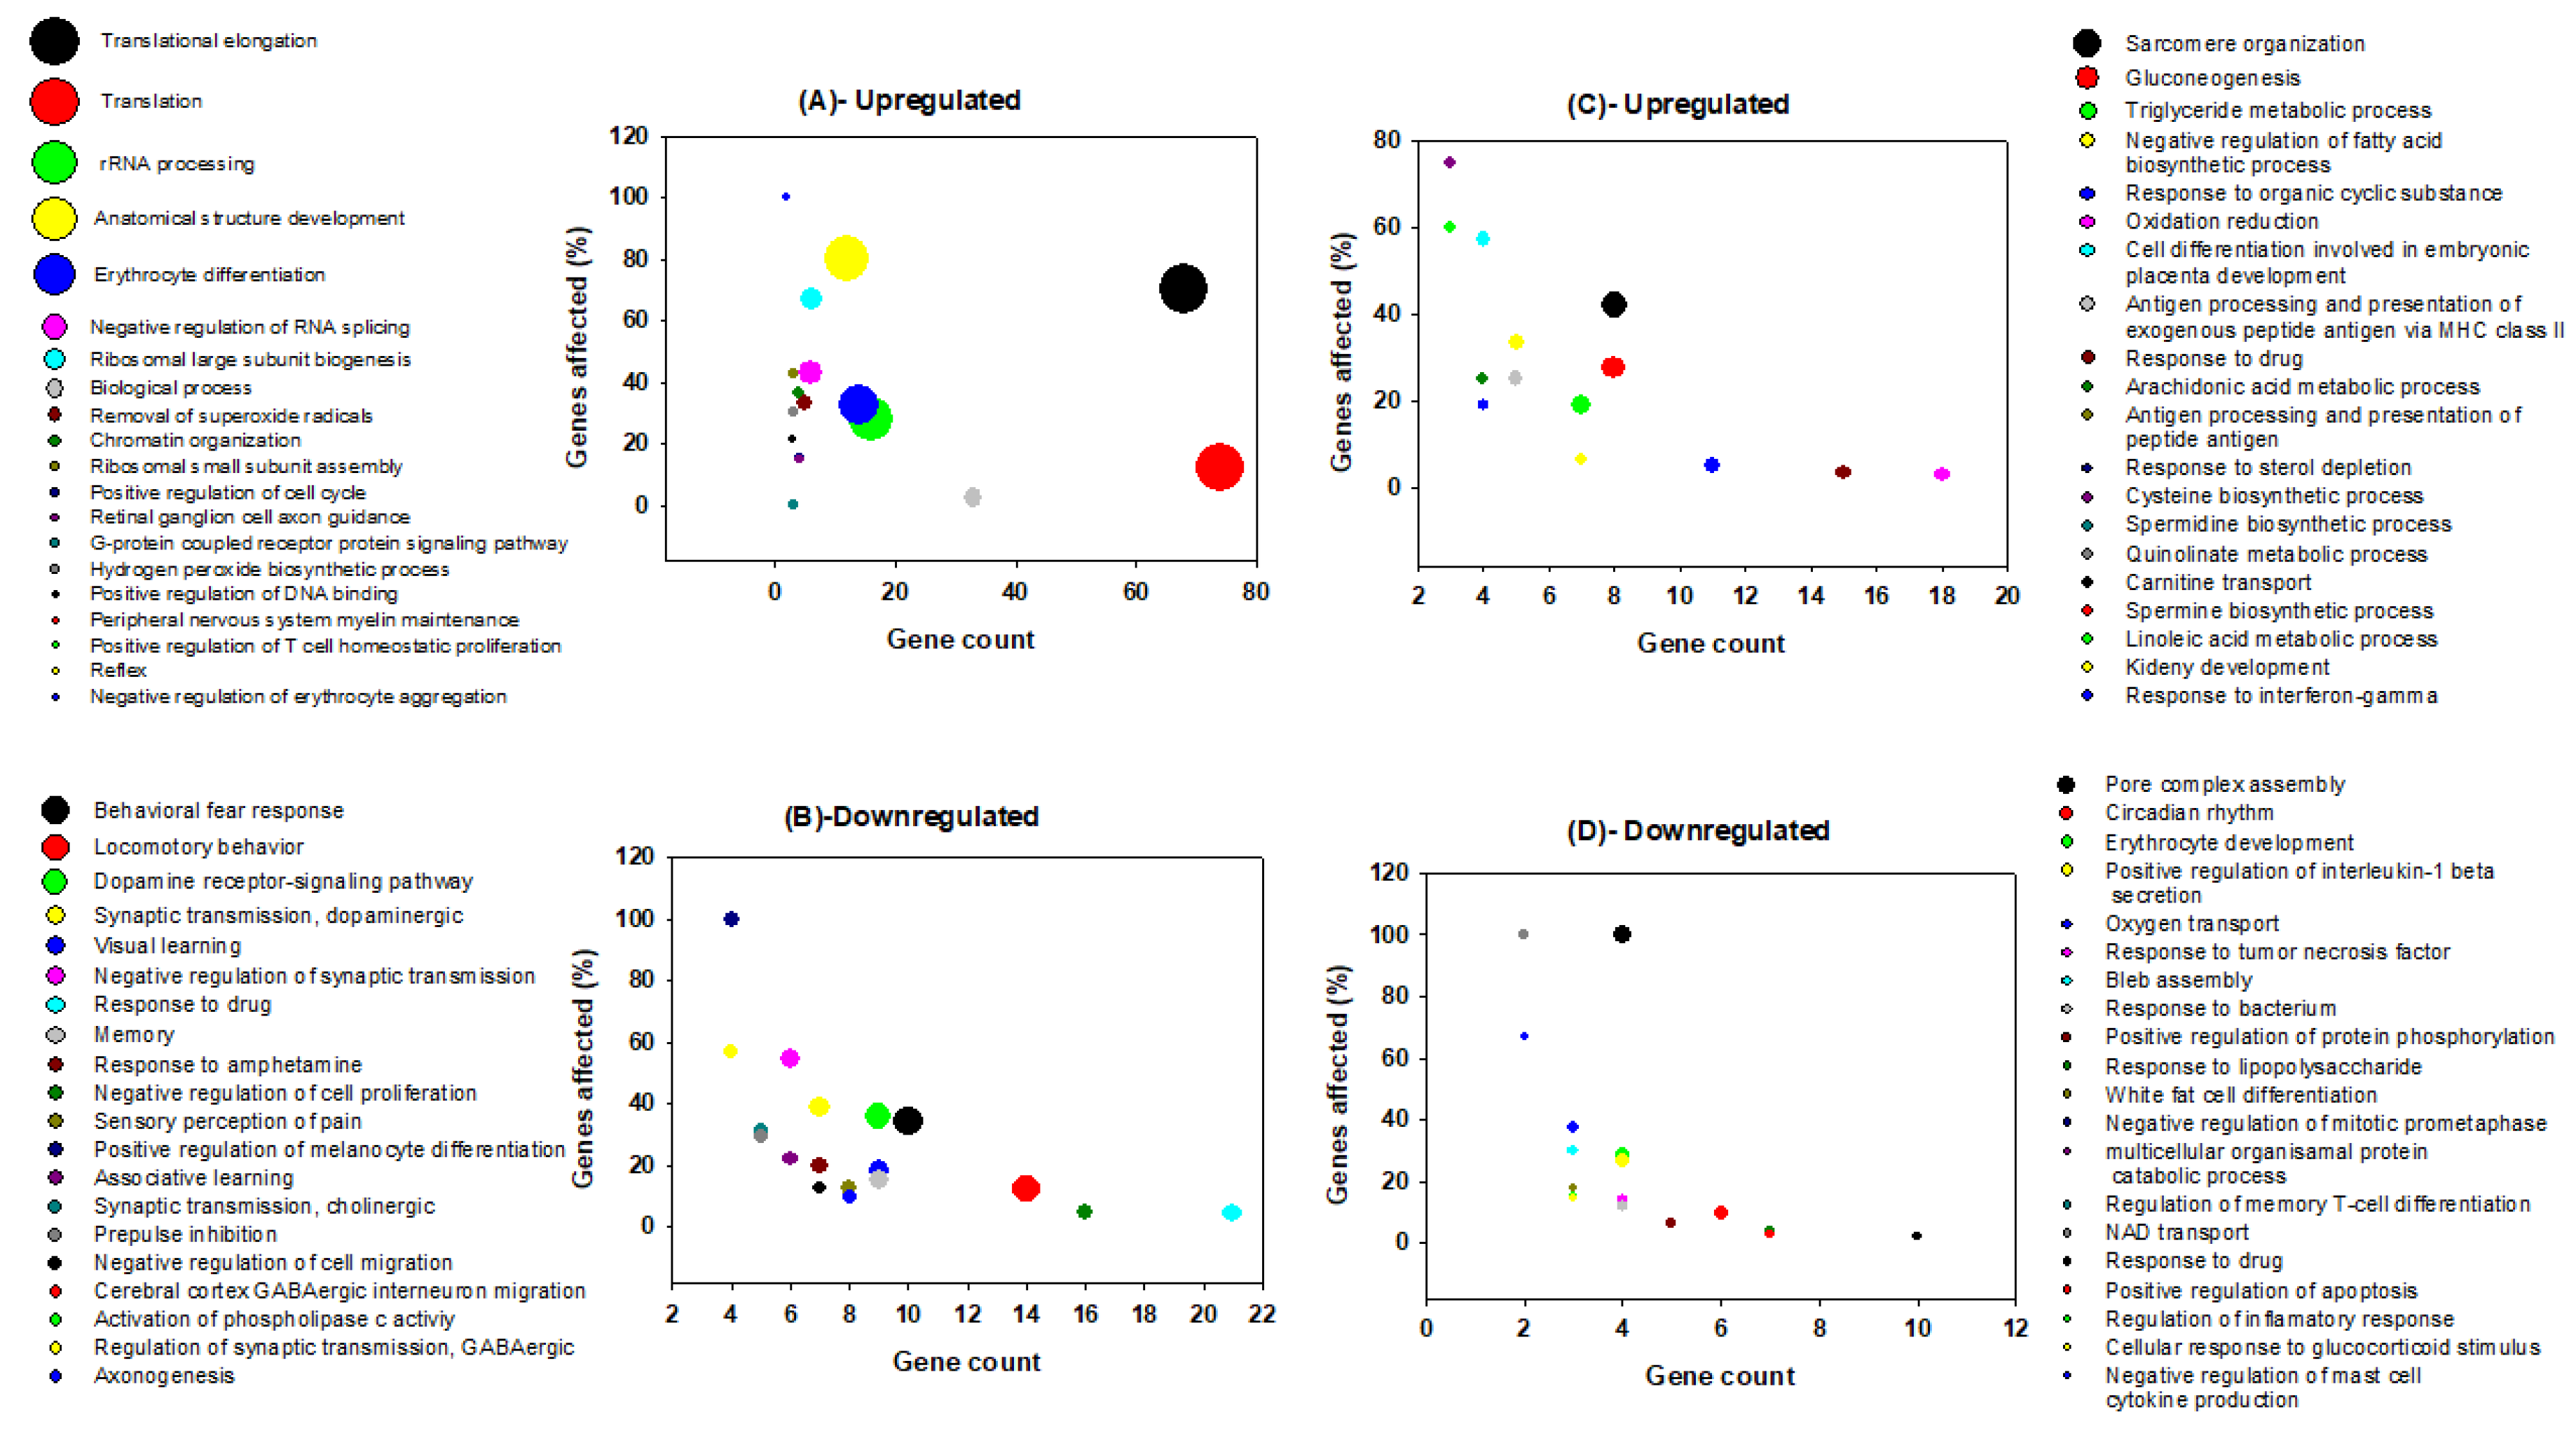
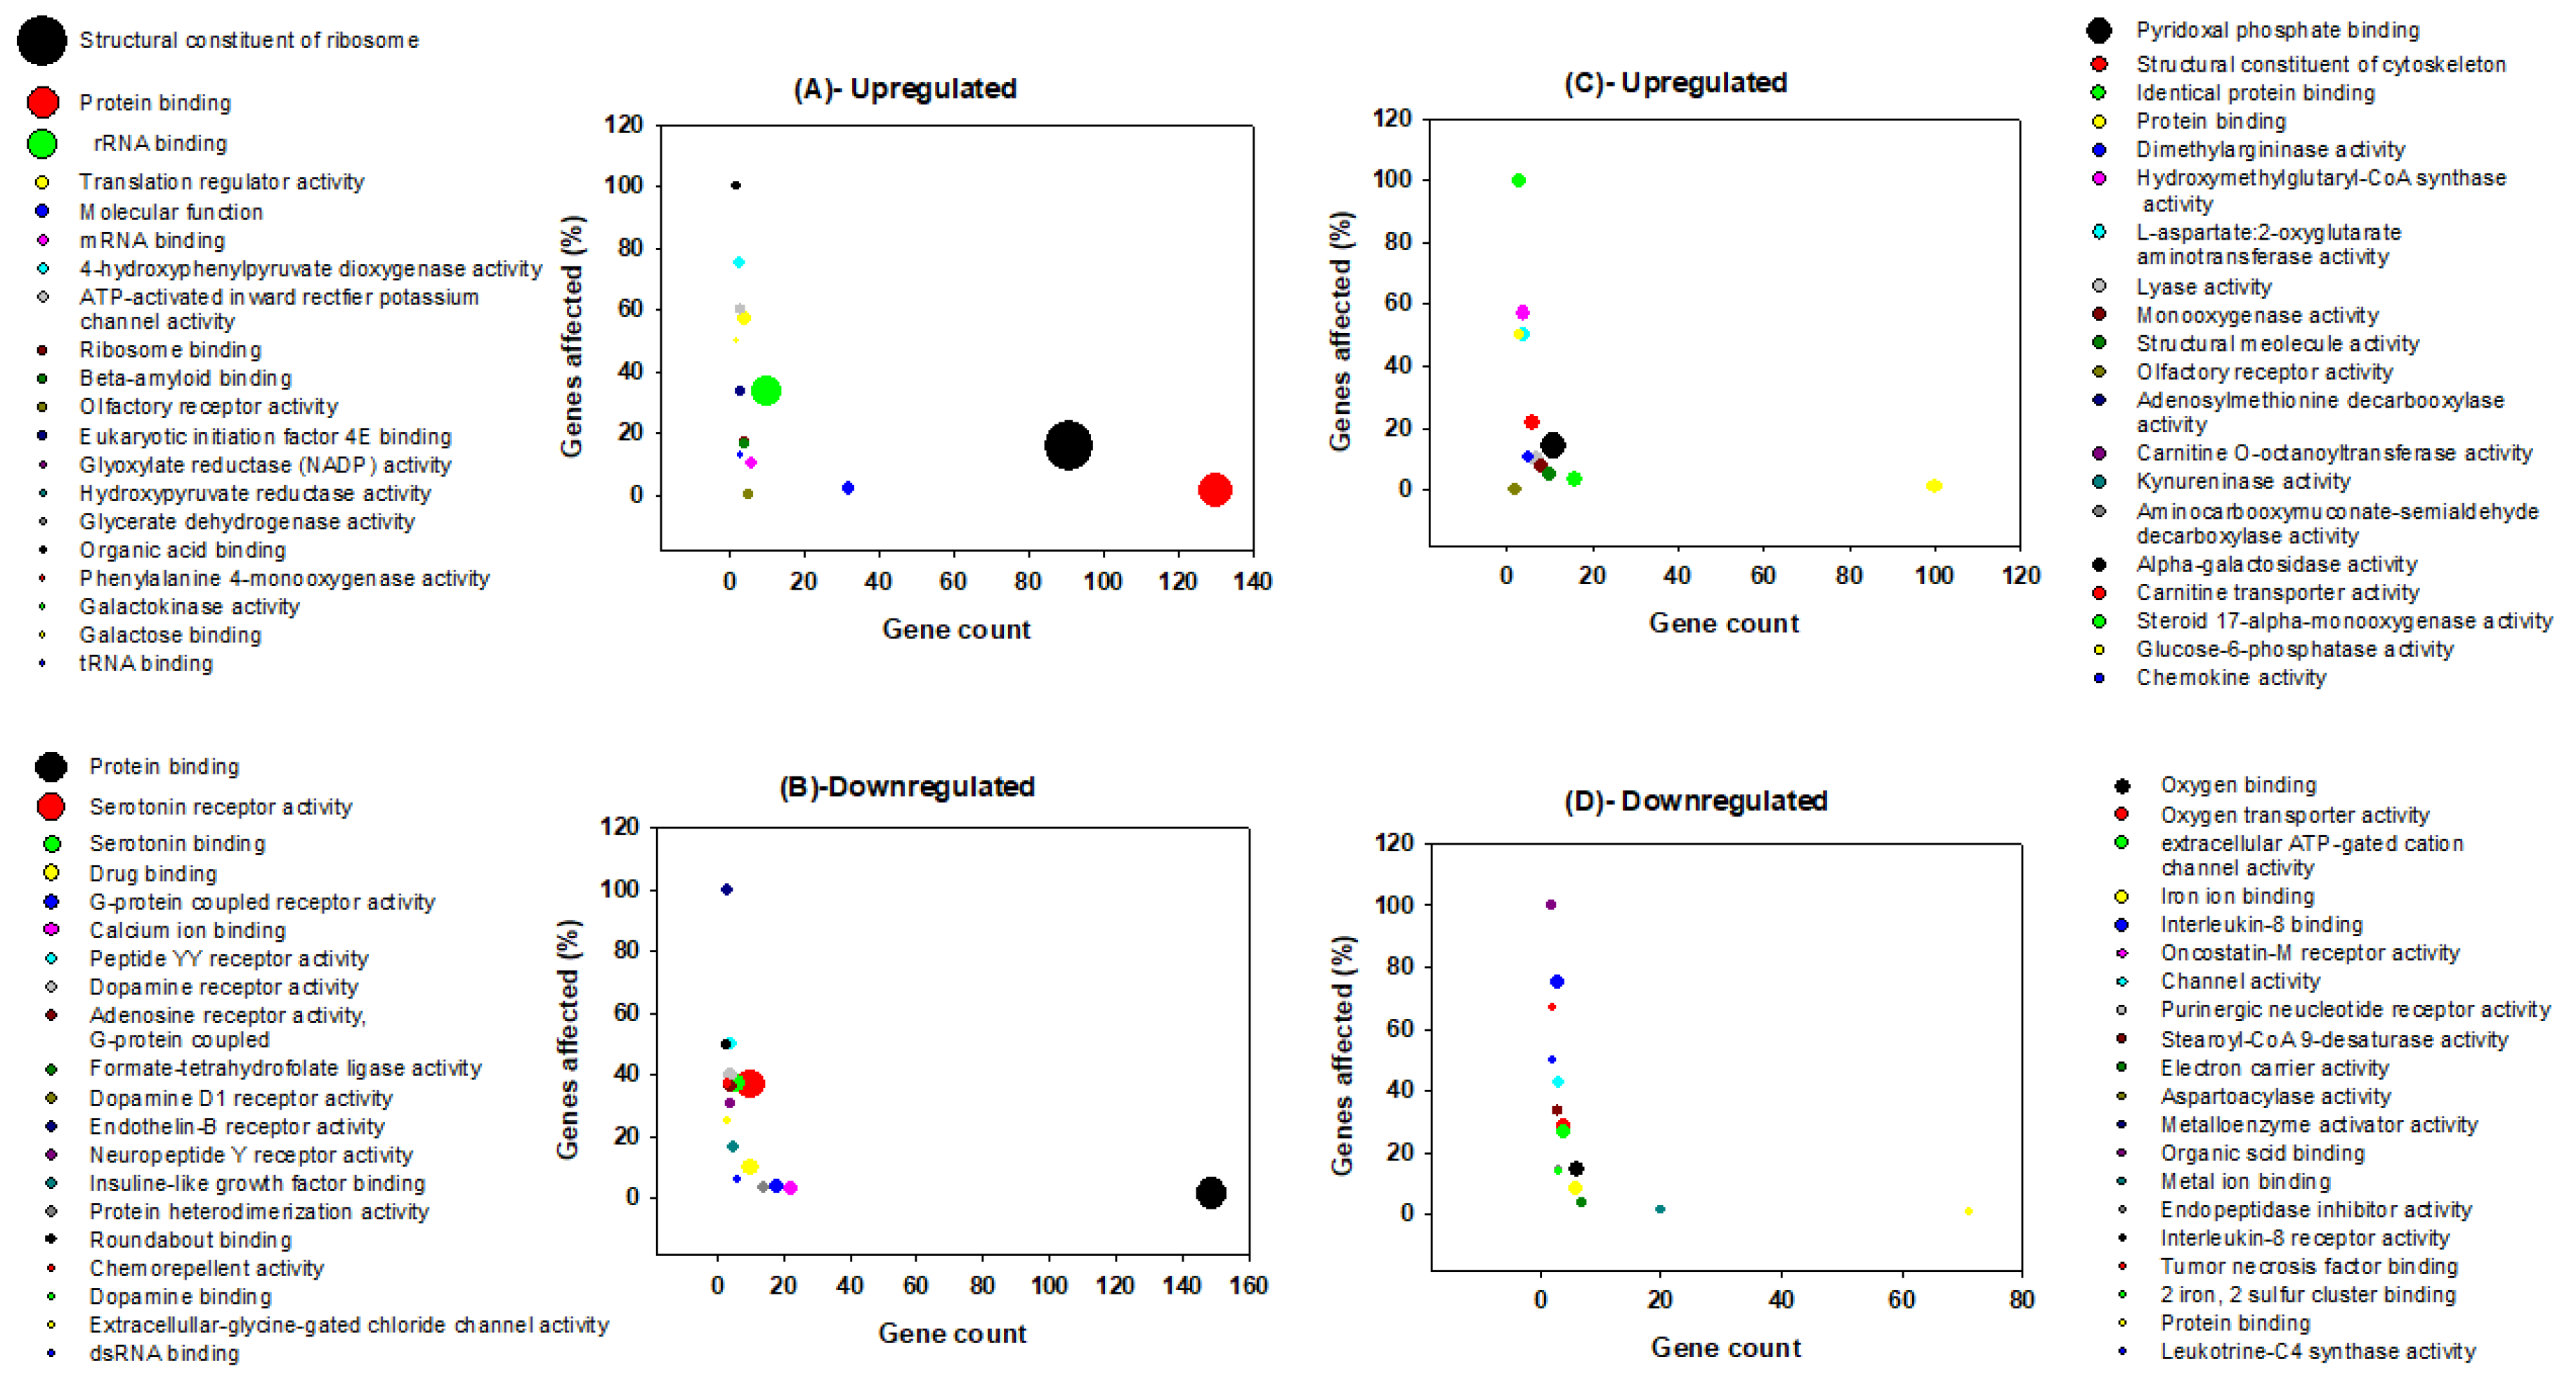
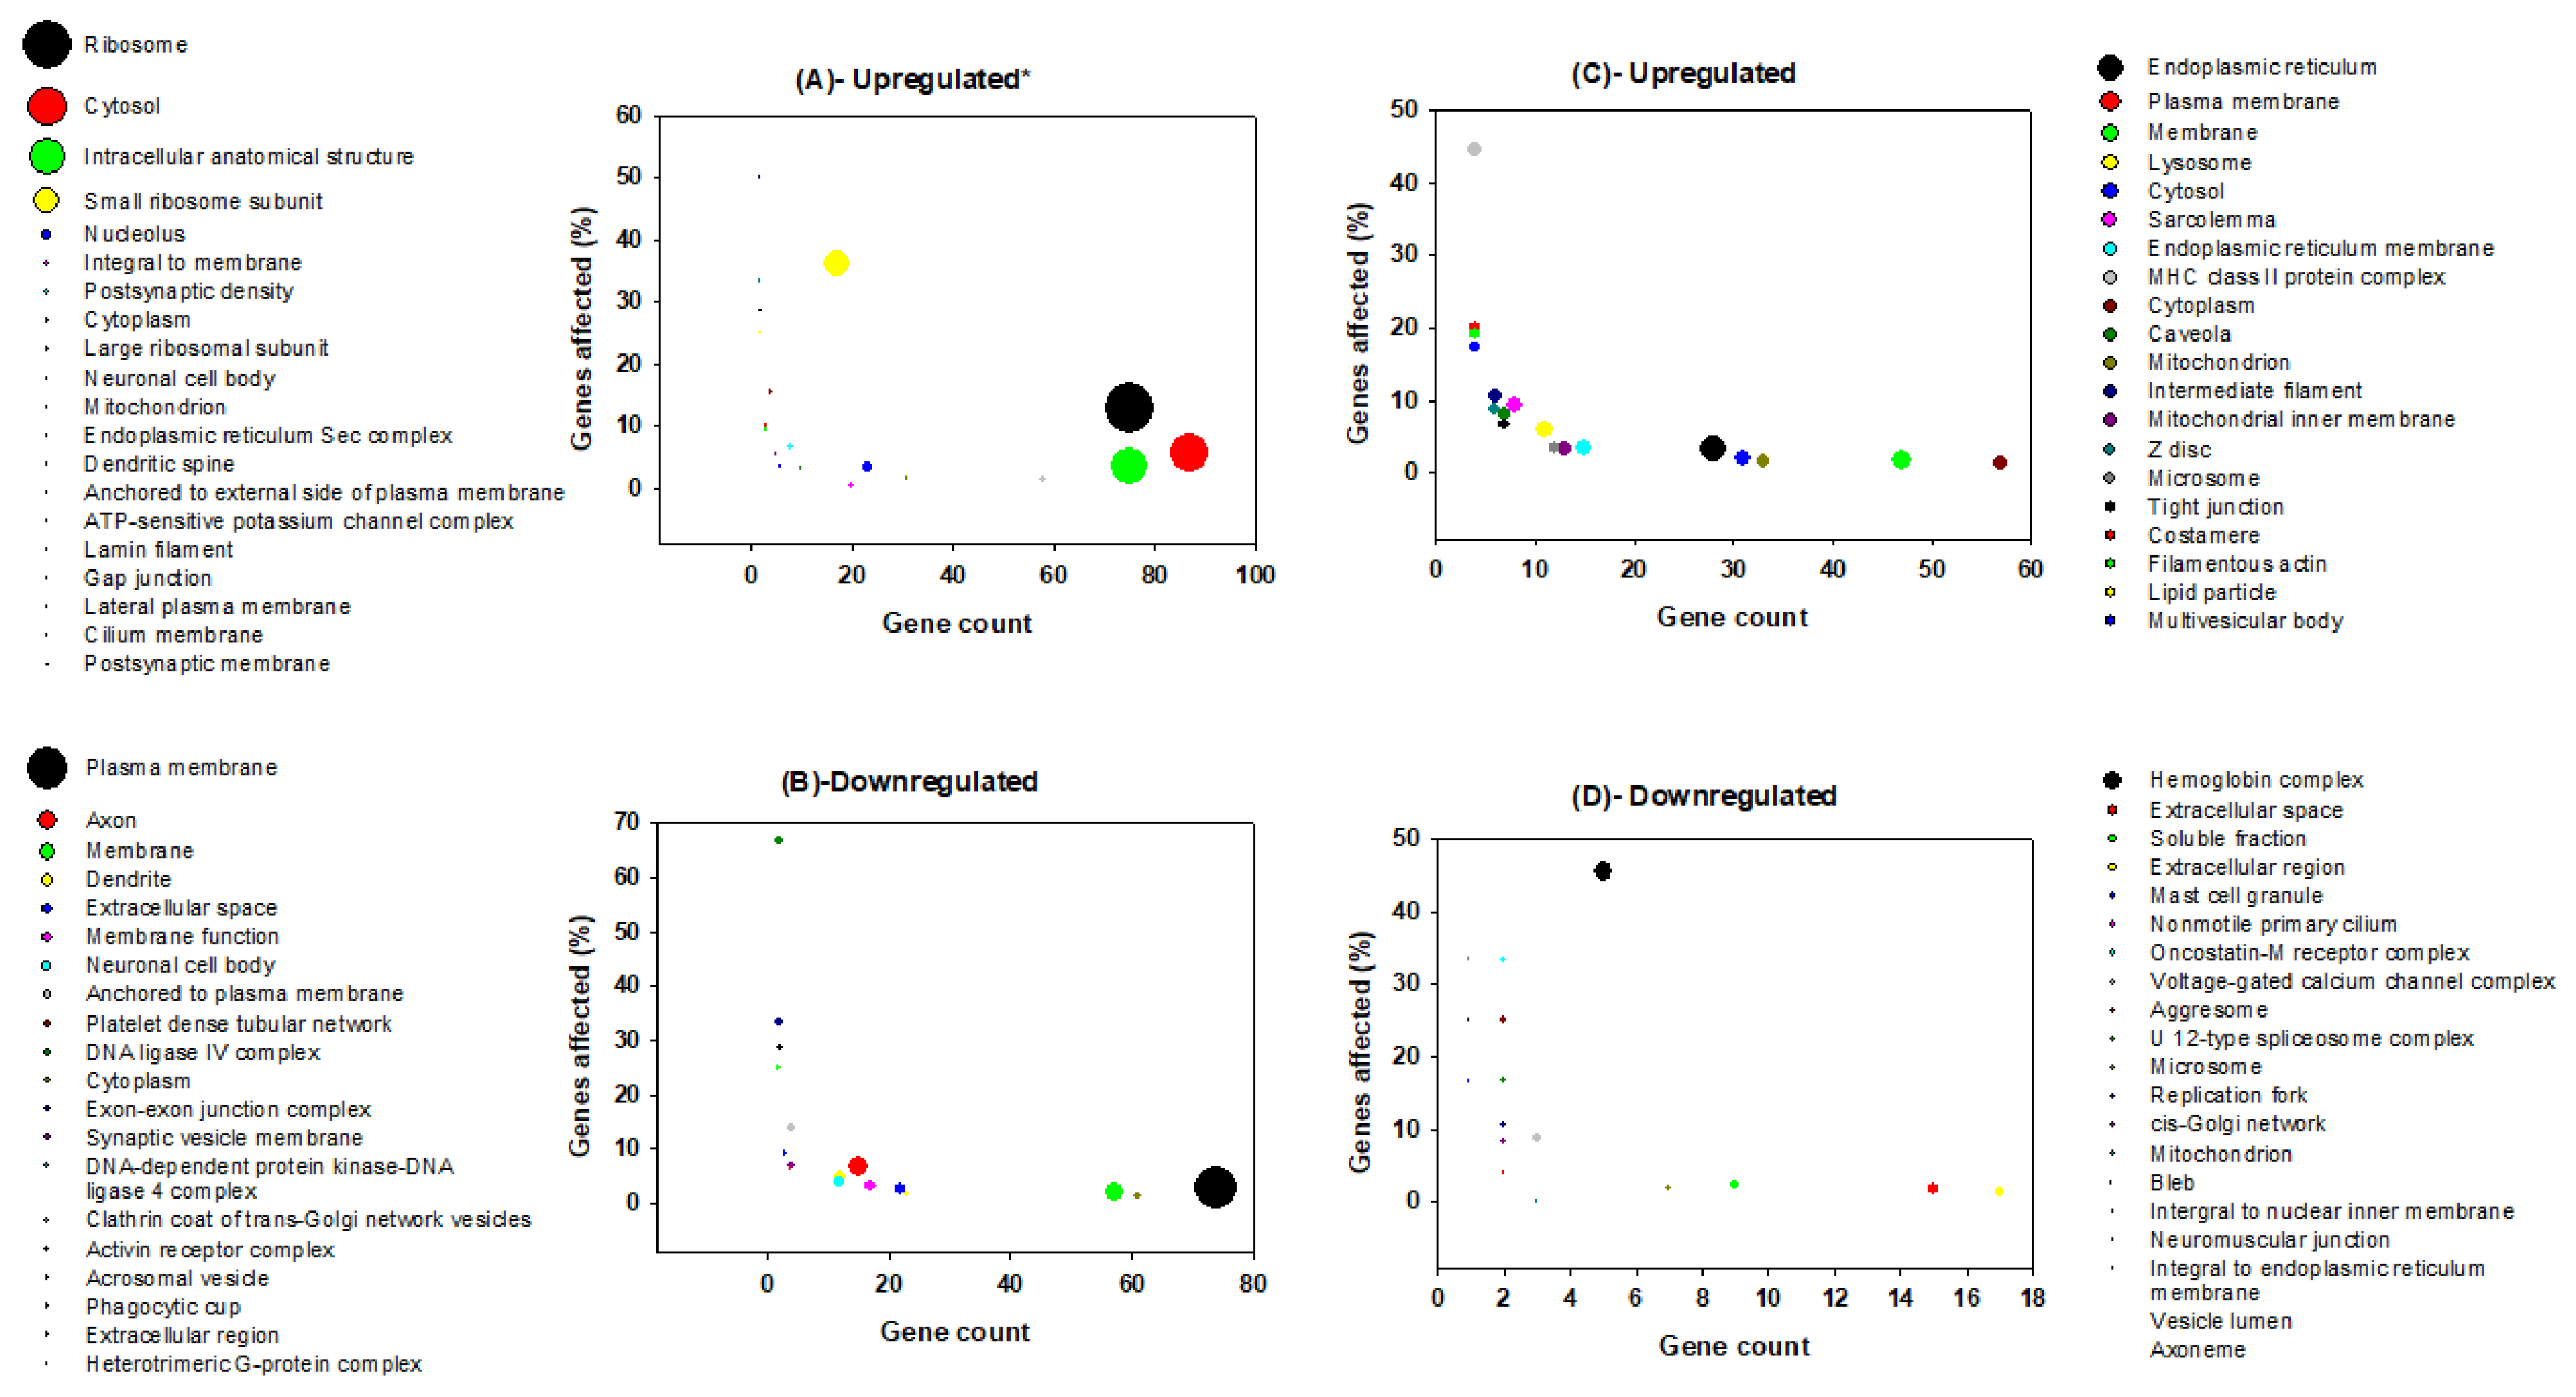
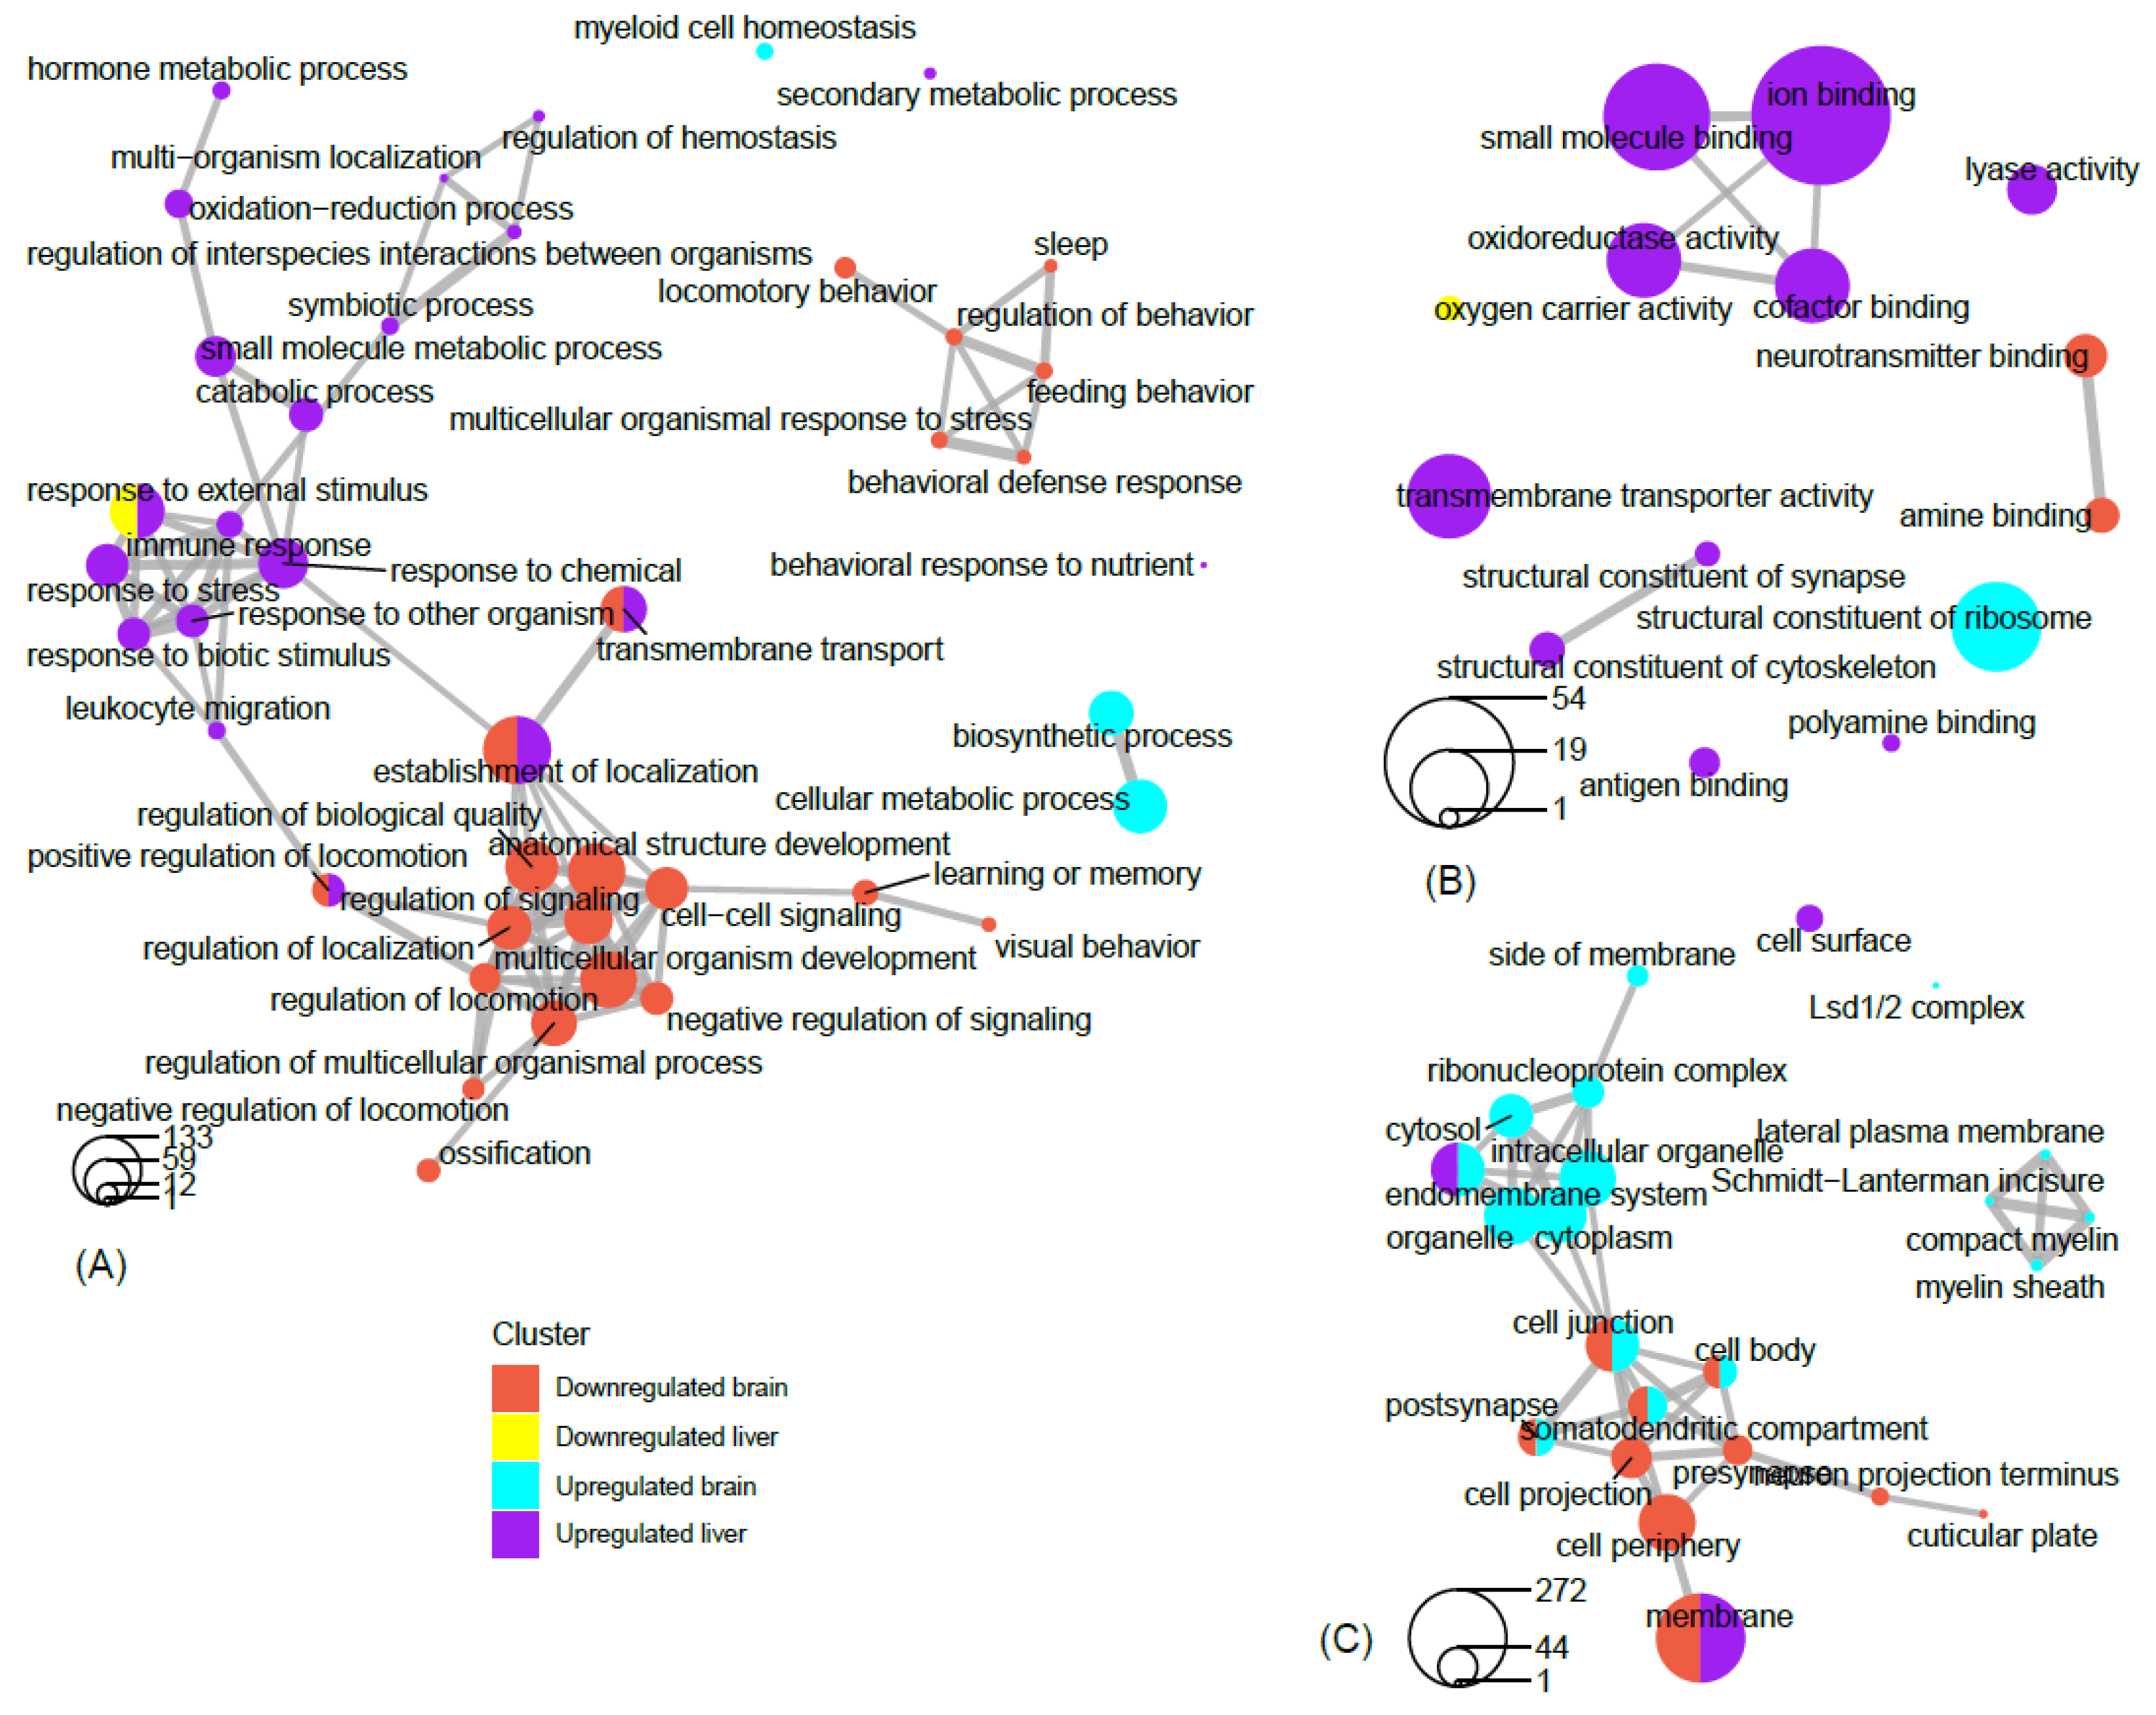
3.2. Gene Ontology Analysis

Functional categories of genes that vary in their regulation between brain and liver upon REM sleep deprivation have been categorized. All processes and components were separated according to three main groups: namely, biological processes, molecular functions, and cellular components (Figure 3, Figure 4 and Figure 5). In addition, we classified each group into two subcategories based on their direction of change (up-regulation and down-regulation); e.g., biological processes (Figure 3A–D), molecular functions (Figure 4A–D), and cellular components (Figure 5A–D).
Among the 208 significant GO terms of biological processes for genes that are up-regulated in the brain, the top five are translational elongation, translation, rRNA processing, anatomical structure development, and erythrocyte differentiation (Figure 3A). Among the 77 significant GO terms of molecular functions for genes which are up-regulated in the brain, the top five are structural components of ribosomes, protein binding, rRNA binding, translation regulator activity, and mRNA (Figure 4A). Among the 57 significant GO terms of cellular components for genes that are up-regulated in the brain, the top five include ribosomes, cytosol, intracellular anatomical structure, small ribosomal subunits, and nucleolus (Figure 5A). REM sleep loss negatively affected 544 biological processes in the brain, of which the top five were behavioral fear response, locomotory behavior, dopamine receptor signaling pathways, dopaminergic synaptic transmission, and visual learning (Figure 3B). A total of 140 significant molecular function terms were returned for genes that were negatively affected in the brain, and the top five were protein binding, serotonin receptor activity, serotonin binding, drug binding, and G-protein coupled receptor activity (Figure 4B). A total of 57 cellular component terms were returned for genes that are negatively affected in the brain, of which the top five were plasma membrane, axon, membrane, dendrite, and extracellular space (Figure 5B).
The top five of the 355 significant biological processes terms for genes that were positively affected in the liver are Sarcomere organization, Gluconeogenesis, triglyceride metabolic process, negative regulation of fatty acid biosynthetic process, and response to an organic cyclic substance (Figure 3C). The top five of the 150 significant molecular function terms for genes that were positively affected in the liver are pyridoxal phosphate binding, structural constituents of the cytoskeleton, identical protein binding, protein binding, and dimethyl arginase activity (Figure 4C). The top five of the 64 significant cellular component terms for genes that were positively affected in the liver are endoplasmic reticulum, plasma membrane, membrane, lysosome, and cytosol (Figure 5C). Pore complex assembly, circadian rhythm, erythrocyte development, positive regulation of interleukin-1 beta secretion, and oxygen transport were the top five of the 219 significant biological processes terms (Figure 3D) for genes that were down-regulated in the liver. Oxygen binding, oxygen transport activity, extracellular ATP-gated cation channel activity, Iron-ion binding, and Interleukin-8 binding were the top five of the 86 significant molecular function terms for genes that were down-regulated in the liver (Figure 4D). Hemoglobin complex, extracellular space, soluble fraction, extracellular region, and mast cell granules were the top five of the 27 significant cellular component terms for genes that were down-regulated in the liver (Figure 5D).

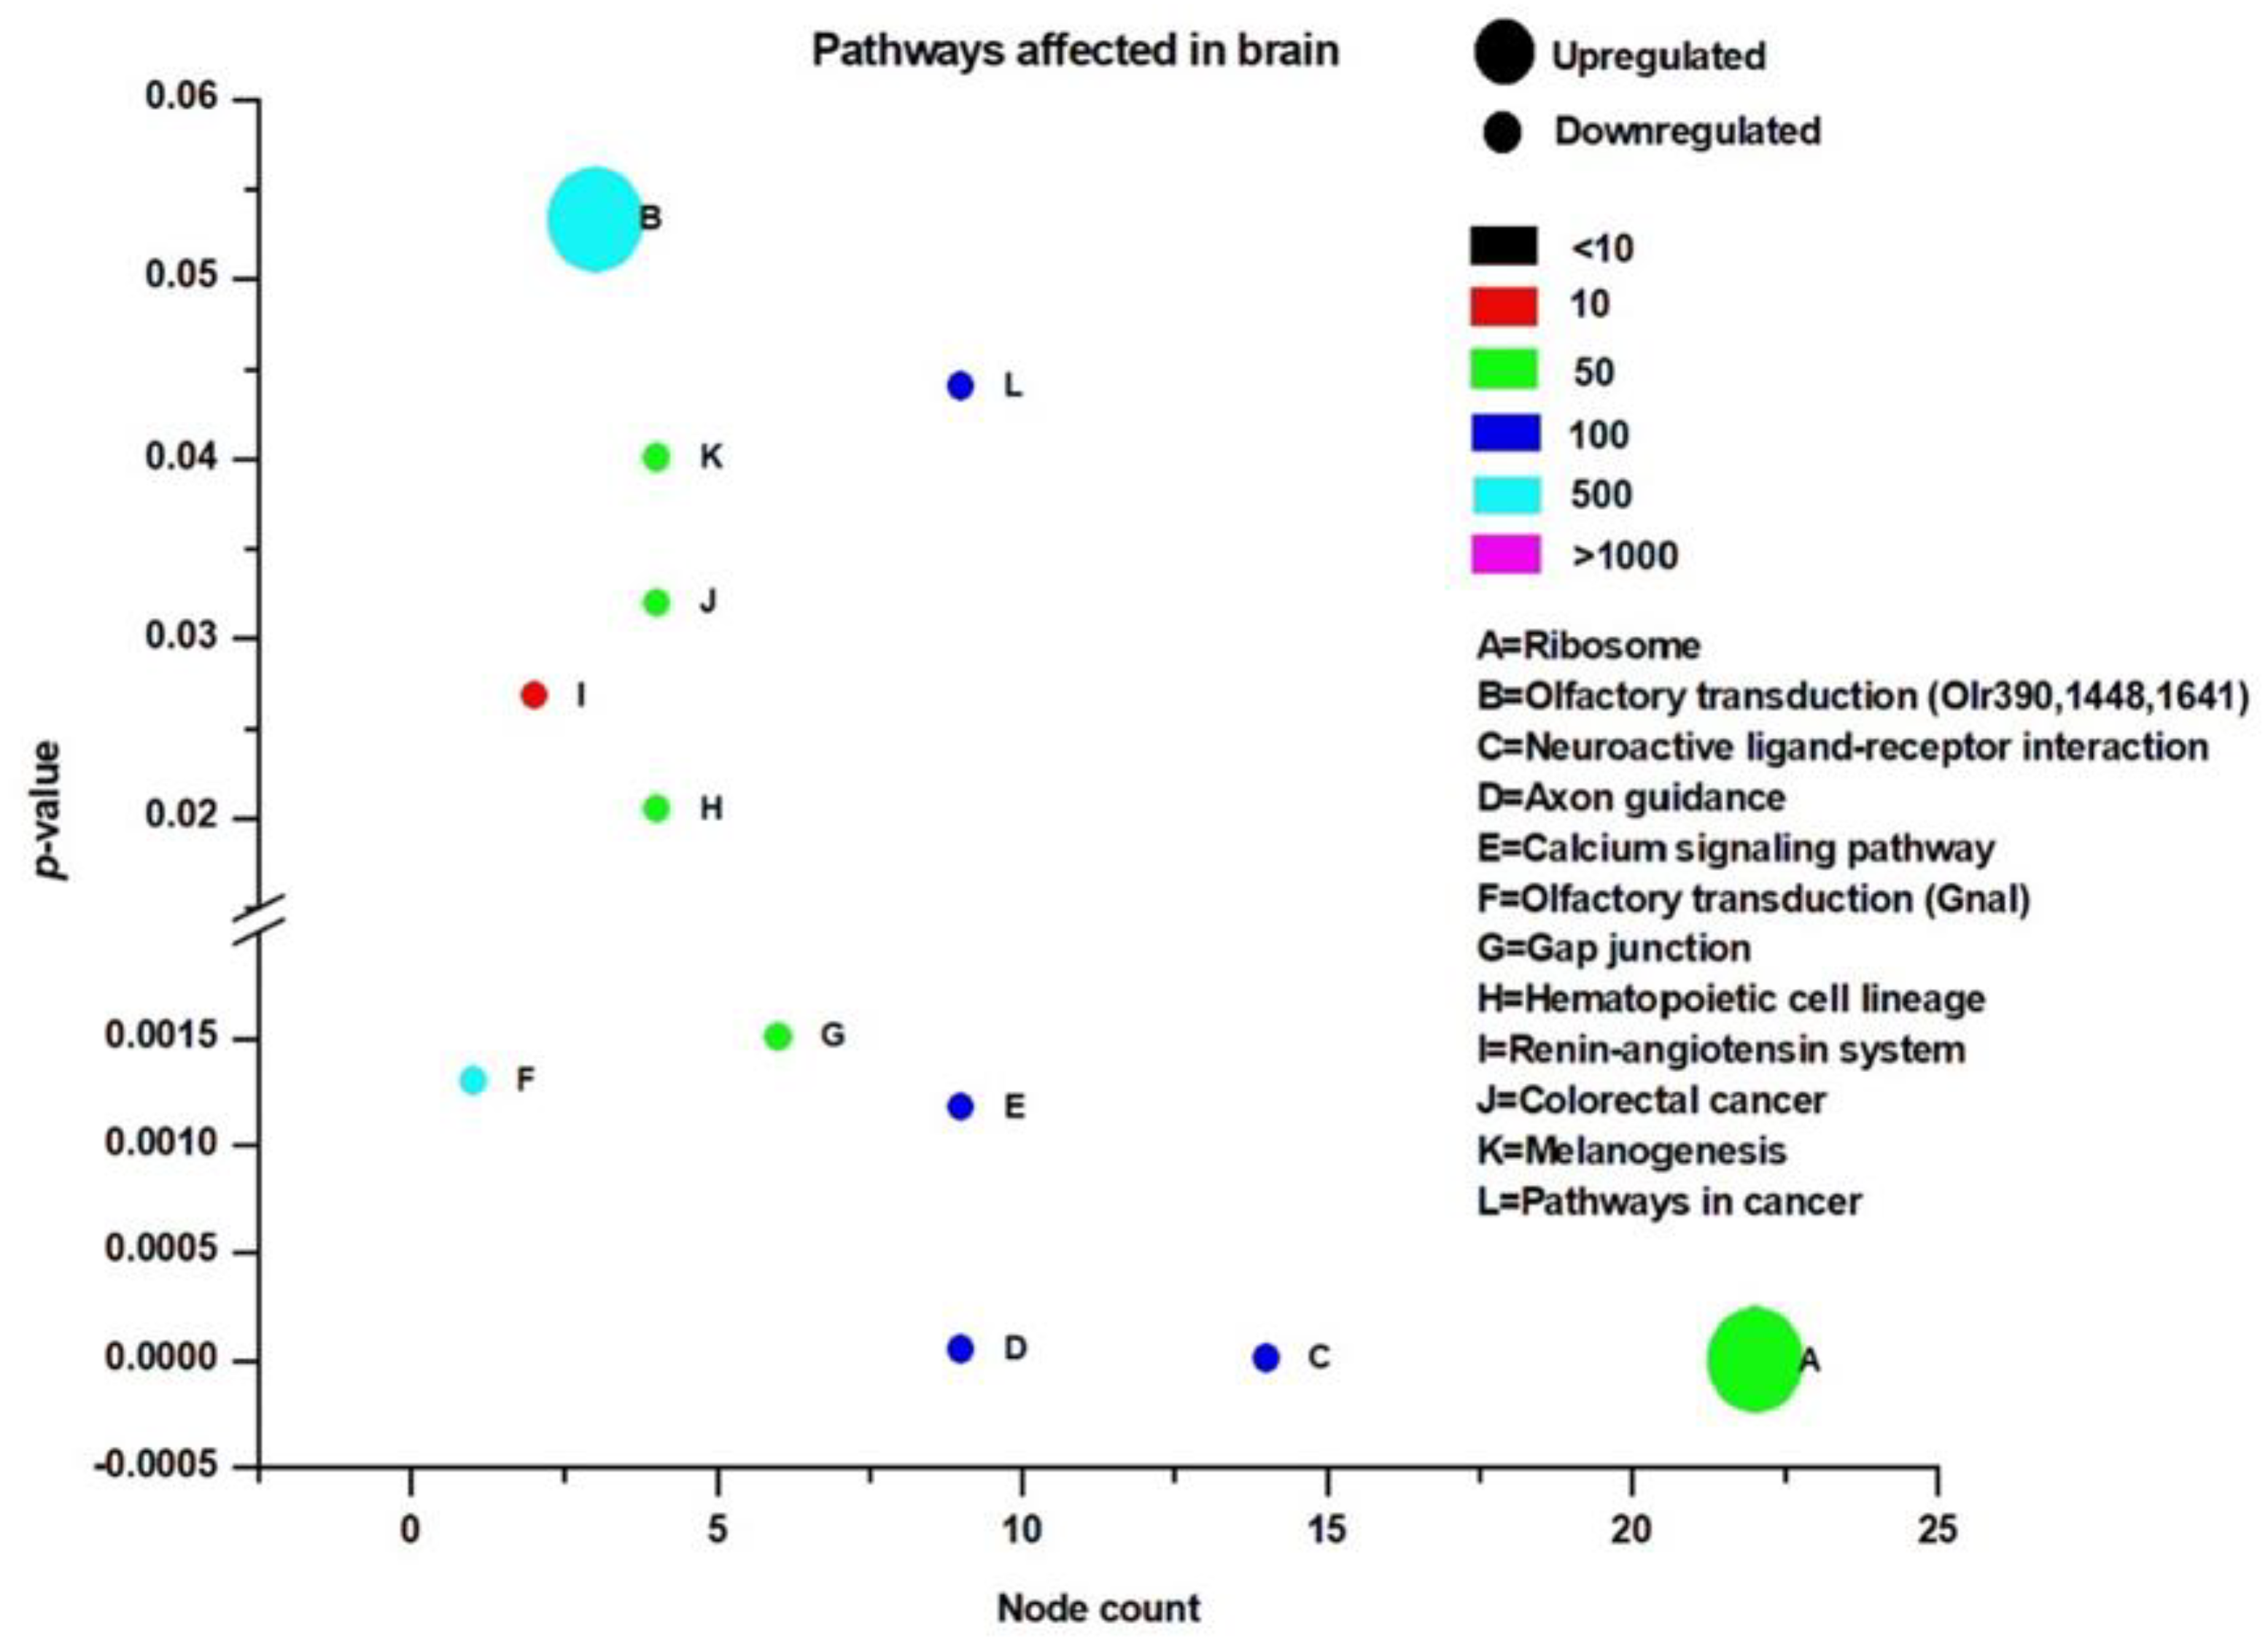
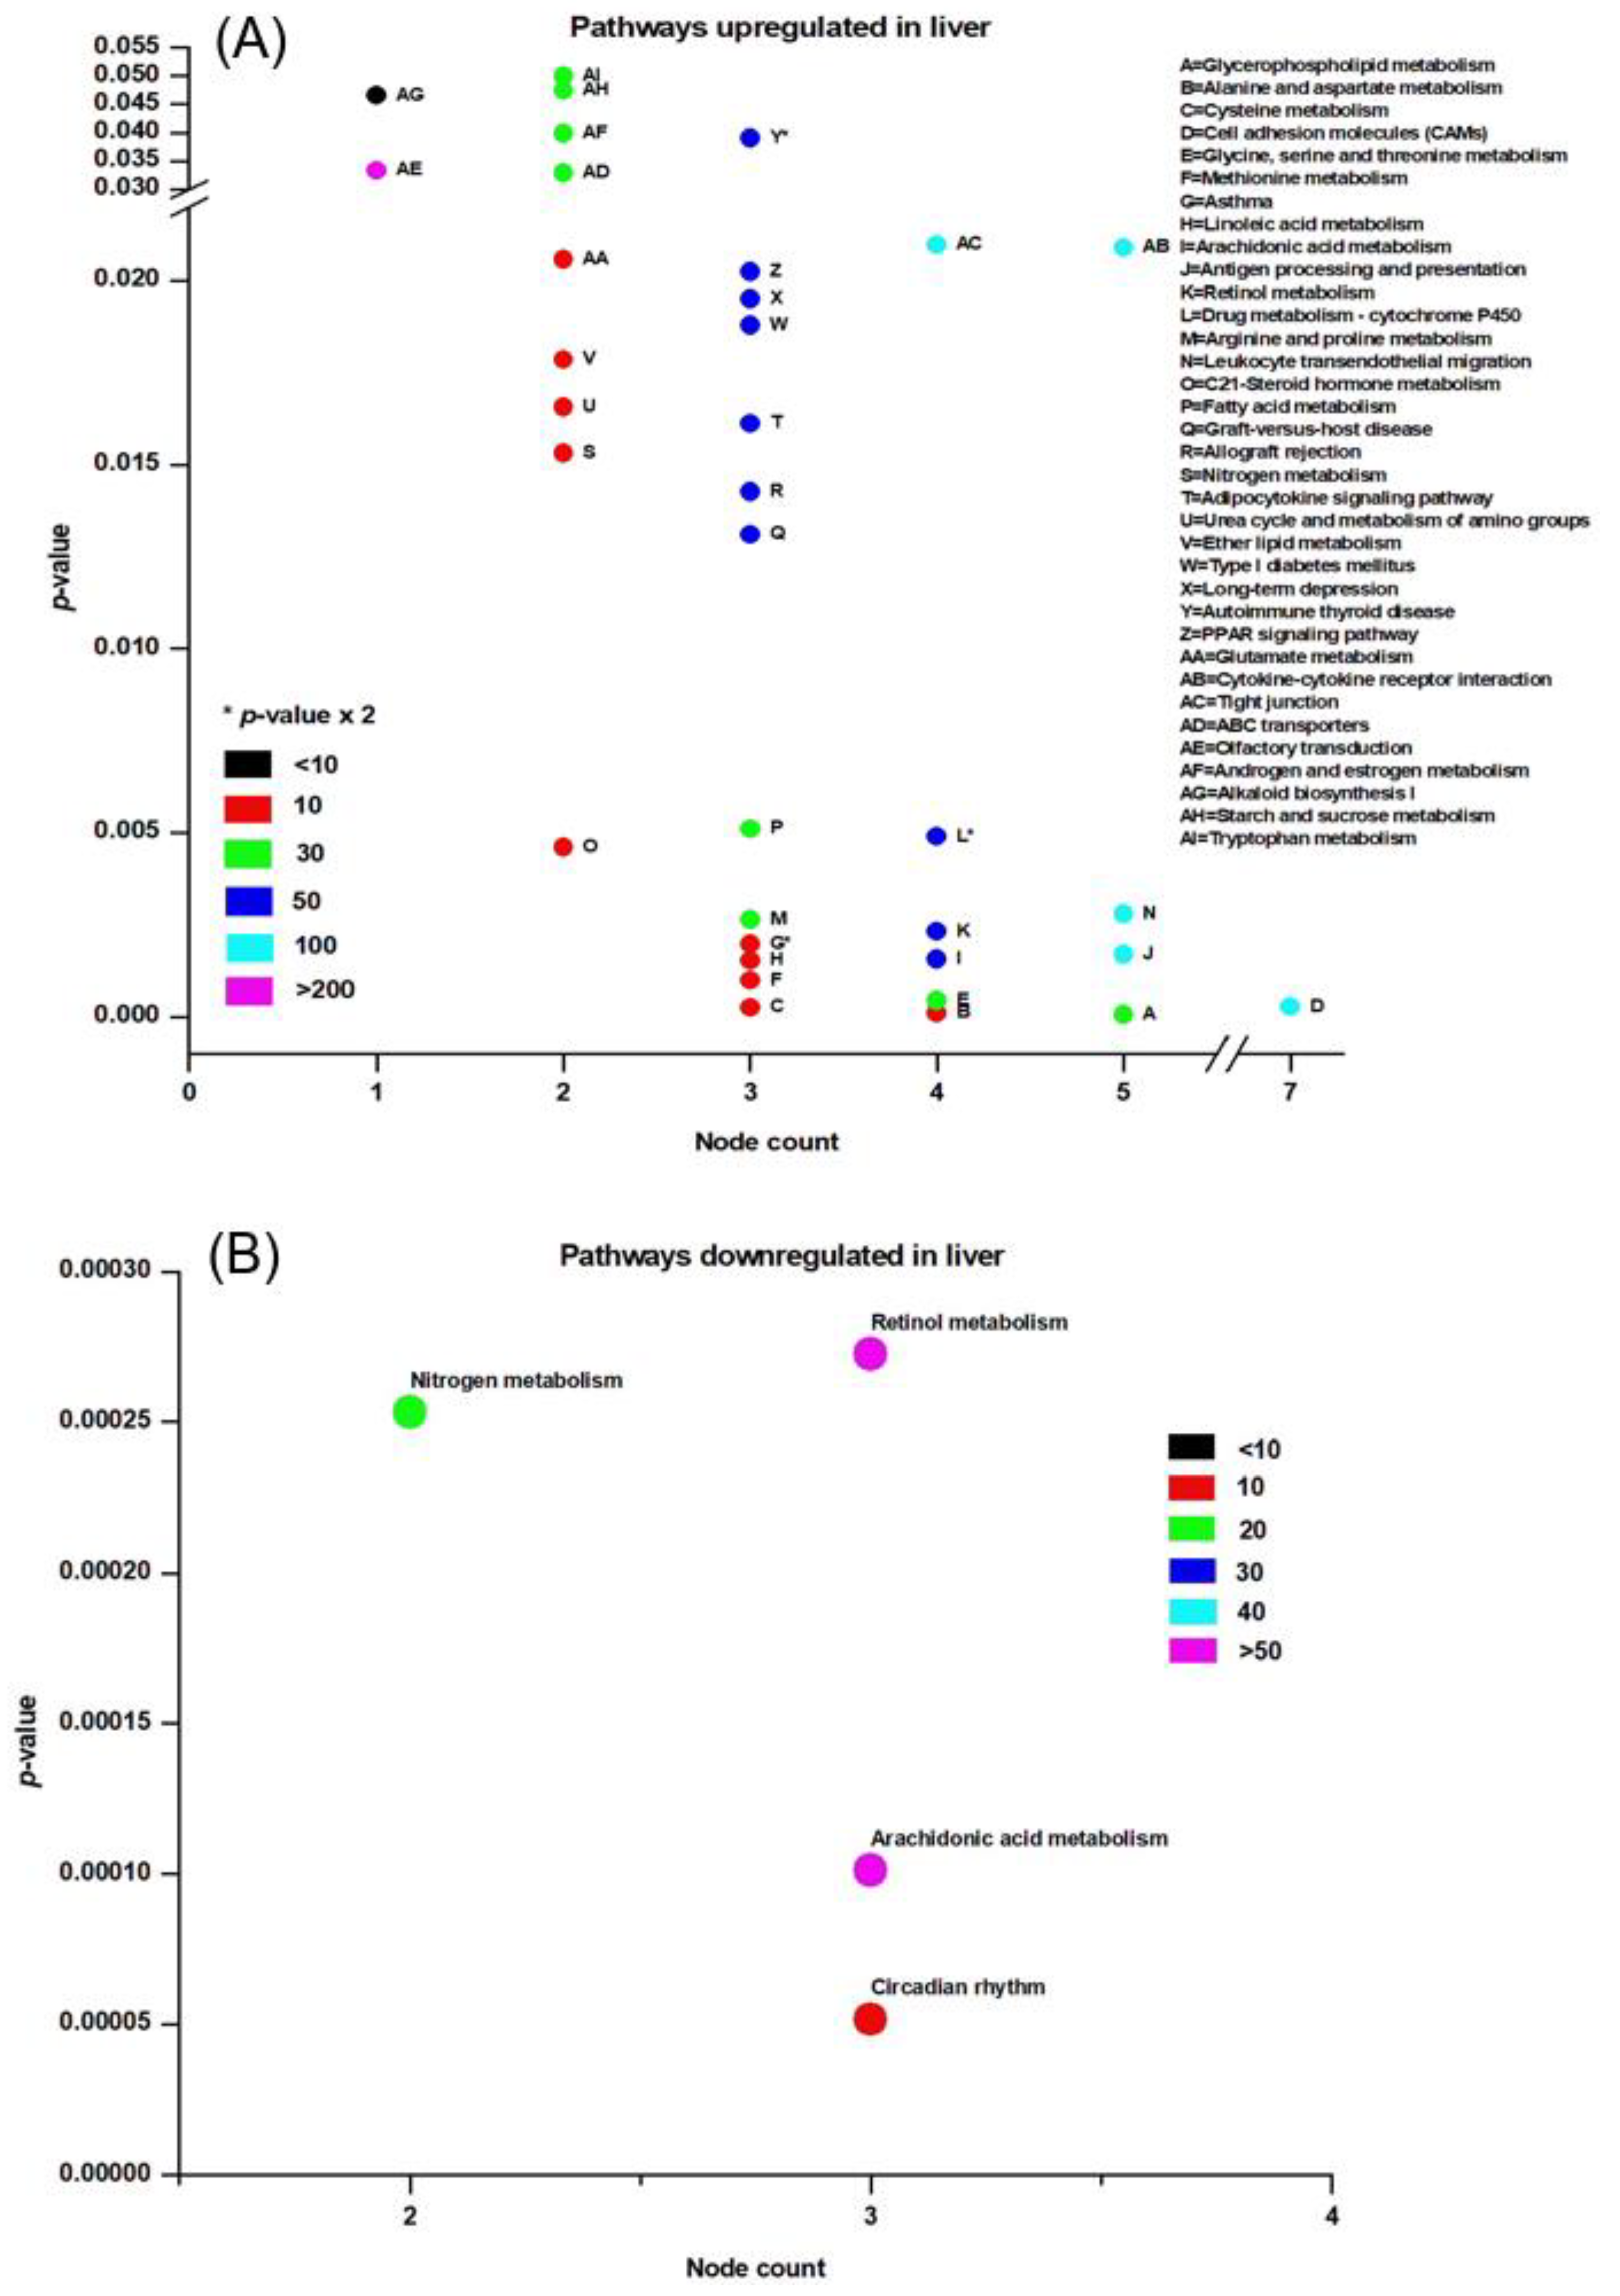
3.3. Pathway Analysis

KEGG analysis was used to evaluate the pathways affected by REM sleep loss in the brain and liver, and terms were plotted based on the significance level (p < 0.05), database count, and the number of genes affected by each pathway (node count). Shown are up- and down-regulated pathways in the brain (Figure 6), up-regulated pathways in the liver (Figure 7A), and down-regulated pathways (Figure 7B). Pathways that were significantly up-regulated in the brain included only ribosomes and olfactory transduction, while 11 were down-regulated—of which the top five were neuroactive ligand-receptor interaction, axon guidance, calcium signaling pathway, olfactory transduction, and GAP junction (Figure 6). The top five of the 36 significantly up-regulated liver pathways were glyceraldehyde metabolism, alanine and aspartate metabolism, cysteine metabolism, cell adhesion molecules, and glycine-serin and threonine metabolism (Figure 7A), while just circadian rhythm, arachidonic acid metabolism, nitrogen metabolism, and retinol metabolism were down-regulated (Figure 7B).
We used KEGG pathway maps (Figures S1–S4) to visualize the components, proteins, and genes that were highly associated with the involved processes. Displayed are the subunits of ribosomes (Figure S1) and neuroactive legend-receptor interaction pathways (Figure S2), which were negatively and positive affected pathways, respectively, in the brain. Additionally, the cancer pathway (Figure S3) and glycerophospholipid metabolism pathway (Figure S4) were negatively and positively affected, respectively, due to REM sleep loss.

4. Discussion

We sought to characterize the effects of prolonged REM sleep deprivation using gene expression data from the brain and liver of rats. In order to confirm our findings and validate our analyses, six differentially expressed genes were analyzed using RT-PCR (Figure 1). We found that our study corroborates with previous microarray findings of sleep deprivation relating to the effects on genes such as Egr1, Fos, and Ptgs2 and several genes of the Slc family, Hba-a1 and Hbb [81,101,102,103]. Indeed, each of these six genes have previously been found to be associated with sleep loss. Out of the hundreds of genes found to be significantly affected in the brain and liver, only a few genes were common between the tissues examined and their associated direction of change. Four genes, Wee1, slc2a12, Hrk, and Fam110b (Figure 2, Table S3A), were commonly down-regulated in the tissues examined, but none were commonly up-regulated. Three genes, Hba-a1, Hba-a2, and Mup5, were up-regulated in the brain and down-regulated in the liver and associated with the GO terms drug transport, oxidoreductase activity, heme binding, fatty acid biosynthesis processes, and catalytic activity (Figure 2, Table S3B). Genes that were found to be up-regulated in the liver and, at the same time, down-regulated in the brain (RT1Da, Zbtb6, and Tmem 106b) are associated with the GO term stimulus response (Figure 2, Table S3C).
Several of the aforementioned genes that were commonly associated with brain and liver tissue, and any combination of direction of change, were found in previous literature regarding sleep and REM. Several genes of the solute carrier (Slc) family (Table S4) were up- and down-regulated in the brain and liver, respectively, except for slc2a12, which was down-regulated in both the brain and liver. Previously, genes of the slc family were reported to be associated with glucose homeostasis, and slc17a8 is down-regulated in Tinaja cave fish in response to sleep deprivation [104]. Slc38a5a is up-regulated in response to sleep deprivation when glucose levels drop and circulating amino acid levels increase [105]. Recently, the Hrk gene was found to be up-regulated in mice after sleep deprivation, which is contradictory to that of our findings and may be a result of differential expression between organisms or sleep-loss in general, as compared to only REM deprivation [106]. GO term analysis of molecular/biological functions associated with Hrk returned the terms protein tyrosine kinase activity, carbohydrate transmembrane transport activity, apoptosis regulation, and Bleb assembly (Table S3A). Previous studies and recent pre-prints support that REM sleep deprivation results in the apoptotic death of neuronal and hepatocytic cells [43,44,45]. Induction of the Hba-a1 gene in the brain may cause cerebral hypoxia-like conditions after REM loss as a result of cerebral hypoxemia and obstructive sleep apnea, and could reduce hemoglobin denaturation [107,108]. A recent study on sleep restriction showed that there is an increase in free fatty acids in healthy men, which led us to speculate that REM sleep deprivation can affect genes such as Mup5, which our findings demonstrated as having an association with the term fatty acid biosynthetic processes and was differentially expressed as a result of REM sleep deprivation [58]. Similarly, Zbtb6 is a homologous gene that codes for the BTB domain of zinc finger protein in mammals, and Tmem 106b returned several GO terms, which included protein binding, dendrite morphogenesis, and lysosomal transport [109,110]. A recent study showed that Tmem 106b is associated with dementia, which is caused by faulty regulation of micro-RNAs [111]. Overall, our study provides a list of genes that are affected across different tissues of the body and are further commonly affected in the same or different directions, which would be interesting to explore in future.
Many of the GO terms in our findings indicated the presence of various phenomena associated the synapse, and more specifically, synaptic potentiation (Figure 3, Figure 4 and Figure 5). Previous analyses demonstrated that several genes, Arc, Bdnf, Camk4, Creb1, Egr1, Fos, Nr4a1, Ppp2ca, and Ppp2r2d are associated with the GO term potentiation of synaptic plasticity, which largely supports the ‘synaptic homeostasis theory’ [54,57]. Indeed, we found that Fos and Egr1 are significantly down-regulated in our study in both brain and liver. In addition, several other genes in our study that were non-significantly up-regulated/down-regulated in the liver/brain, respectively are associated with GO terms related to synaptic plasticity such as positive regulation of long-term neuronal synaptic plasticity, regulation of neuronal synaptic plasticity, synaptic vesicle endocytosis, and neuromuscular synaptic transmission. Previously, sleep loss has been shown to be involved in the up-regulation of genes associated with synaptic plasticity [112,113,114]; however, many of its associated GO terms (Table S5) were a result of genes that were down-regulated in the brain of the REM sleep loss rats in our study. The regulation of synaptic plasticity during sleep and learning is essential [115], and loss of sleep was found to be associated with a negative impact on the glial signaling pathway that are important for synaptic plasticity [25,116,117,118].
REM sleep deprivation is found to be associated with modification of expression of long-term potentiation in the visual cortex of immature rats [119], and we report up-regulation of structural constituents of ribosomes, translation regulation activity, while dopamine receptor-signaling pathway, dopaminergic, cholinergic, GABAergic regulation of synaptic transmission, serotonin binding, and receptor activity were down-regulated in the brain (Figure 3B and Figure 4B). The dopamine receptor-signaling pathways regulating sleep, learning, and its plasticity are well known [83,84]. Sleep disorders and sleep deprivation have been correlated with the dopaminergic, cholinergic, and GABAergic regulation of synaptic transmission, each of which were terms that were significantly enriched for genes that were down-regulated in our study [85,86,87,88,89]. These observations support our hypothesis that REM sleep loss negatively affect the genes and processes related to synaptic homeostasis in the brain.
Processes and pathways in the liver following REM sleep deprivation are largely associated with metabolism and the immune system. Many metabolic processes and cellular metabolic processes such as gluconeogenesis, the triglyceride metabolic process, the negative regulation of fatty acid biosynthetic process, oxidation reduction, and the arachidonic acid metabolic process were up-regulated in the liver in response to REM loss. Whole body energy expenditure decreases by 15–35 percent, with the lowest expenditure during slow-wave sleep and a marginally higher expenditure during REM sleep [120], and sleep restriction involves reduced muscle glucose uptake, elevated blood glucose production, and pancreatic β-cell dysfunction [121,122]. An increasing body of evidence indicates that Obstructive Sleep Apnea Syndrome is associated with a variety of metabolic alterations such as dyslipidemia, insulin resistance, and glucose intolerance [123]. REM sleep impairs glucose metabolism, which is involved in intermittent hypoxemia [124]. An up-regulation of gluconeogenesis may serve as a mechanism to compensate for hypoxemia due to prolonged REM loss. The GO terms related to homeostatic processes, such as cholesterol homeostasis, nitric oxide homeostasis, fatty acid homeostasis, retina homeostasis, and cytosolic calcium ion homeostasis, are associated with genes that were up-regulated in the liver, while T cell homeostasis and other processes associated with the immune system were down-regulated (Table S6). The immune functions of sleep and associated diseases have been studied [125,126], and it has been evidenced that the immune system is compromised by lack of sleep [127]. The body of previous evidence and our results support our hypothesis that, while REM sleep loss is associated with synaptic potentiation and maintenance, its affects in the liver are more related to metabolism and immune response to infections.
REM sleep loss negatively affects several genes linked to neuroactive ligand-receptor interaction pathways in the brain, primarily gamma-Aminobutyric acid, the Human Thrombin receptor, and associated receptor signaling dopamine (Figure S2). A recent review of sleep and protein-dependent synaptic plasticity indicated that sleep deprivation impairs many of the related biological and physiological processes [128]. We have found that many of the pathways in the liver that have been up-regulated are linked to metabolism, immunity, and depression (Figure 7A). On the other hand, only a few down-regulated pathways in the liver have been established, which include nitrogen metabolism and circadian rhythm (Figure 7B). The findings further support our secondary hypothesis that REM sleep loss affects the processes and pathways related to synaptic potentiation and learning and memory (Figure 8A) and processes related to homeostasis and immunity in the liver (Figure 8A–C).
Network analysis of filtered GO terms allowed for the visualization of major themes and the connectivity of processes across brain and liver tissue in rats deprived of REM sleep (Figure 8). Several biological processes, such as positive regulation of locomotion, establishment of localization, and transmembrane transport were terms that were significantly enriched for genes that were both down-regulated in the brain and up-regulated in the liver. Interestingly, responses to external stimuli genes were found to be both positively and negatively affected in the liver, indicating the up- and down-regulation of separate sets of genes associated with this term (Figure 8A). There was no connectivity between terms in the molecular function category; however, terms associated with metabolism and transport, such as oxidoreductase activity, small molecule binding, iron binding, and cofactor binding, were each up-regulated in the liver (Figure 8B). Networking of terms in the cellular component category returned the GO terms cell junction, cell body, post synapse, and somatodendritic compartment, that were up- and down-regulated in the brain and liver, respectively (Figure 8C). To summarize a major theme, some processes that were mainly up-regulated in the liver were also down-regulated in the brain as a result of REM sleep loss. One possible explanation for this is that REM sleep loss influences processes linked to the fear response of the brain and locomotive activity related to the peripheral circadian clock, hemoglobin level, and transport of oxygen throughout the liver. The evidence suggests that the genes and processes involved are highly contrasted between the brain and the liver; however, some processes may be connected across major organs in response to REM sleep loss and should be investigated in the future.
We further explored the common processes related to general interest, such as oxidative-stress, cancer, and cell-death. Processes related to reactive oxygen species metabolic and oxidative stress, e.g., positive regulation of oxygen and reactive oxygen species metabolic process and response to oxidative stress were positively affected while cellular response to reactive oxygen species, oxygen and reactive oxygen species metabolic processes were negatively affected in the brain. Previous studies have shown that there are transcript level variations in many genes involved in the regulation of reactive oxygen species (ROS), including heme oxygenase, superoxide dismutase, and catalase, in patients with obstructive sleep apnea [129]. Similarly, REM sleep has recently been found to be associated with acute phase response and ROS stress in the liver [46,48]. REM sleep loss also affected several genes such as prostaglandin-endoperoxide synthase (Ptgs2), B-cell lymphoma 2 (Bcl-2), Proto-Oncogene, Tyrosine Kinase receptor (Kit), KRAS Proto-Oncogene (K-Ras), and Fos Proto-Oncogene (Fos), which are marked in cancer pathways (Figure S3). A number of recent studies have shown that sleep dysfunction/loss and cancer processes are closely related [130,131,132,133,134,135,136]. However, some emerging evidence also suggests that sleep loss/insomnia prior to the onset of cancer is independently associated with cancer risk [131,135,137,138]. Ptgs2, an enzyme, plays a key role in various pathological processes by catalyzing conversion of arachidonic acid to prostaglandins [139]. Studies have shown that overexpression of Ptgs2 is associated with angiogenesis, metastases, and immunosuppression [75,76]. Pgst2 is also found to be associated with the chemoresistance of some malignant tumors, including liver, pancreatic, lung, esophageal, and gastric cancers [77,78,79]. Inhibition of Ptgs2 effectively increased the sensitivity of tumors to drugs [140]. Similarly, Bcl-2, Kit, K-Ras, and Fos genes have been found to be associated with cancer [141,142,143,144]. These genes play an important role in the sleep-wake cycle regulation and are shown to be correlated with sleep [43,44,145,146,147]. At the same time, the glycerophospholipid metabolism pathway was found to be significantly up-regulated in the liver (Figure S4). These include the genes Phospholipase, PLa2g, Phosphatidylcholine 2-Acylhydrolase 12A Pla2g12a, Glycerol-3-Phosphate Dehydrogenase 2, Gpd2, CDP-Diacylglycerol Synthase 2, Cds2, and Phospholipid Phosphatase 2, Plpp2. The PLa2g associates with neurodegeneration and elevated mitochondrial lipid peroxidation and dysfunction [148,149,150]. The PLa2g is further found to be positively associated with sleep loss and psoriasis in humans [151,152]. Similarly, the Gpd2 gene is found to be associated with intellectual disability in humans [153] and positively affected due to circadian desynchrony in mice [154]. The chronic sleep deprivation in rats affected the protein profile of Gpd2 in hypothalamic astrocytes [103]. The functional aspect of the other genes affected (e.g., Pla2g12a, Cds2, and Plpp2) is lacking and needs further exploration. These findings further support the idea of REM sleep being related to restorative functions against diseases and oxidative stress.
Many KEGG pathways were associated with genes that were either significantly up- or down-regulated (Figure 6 and Figure 7A,B) in the brain or liver as a result of REM sleep loss. The KEGG pathway map (Figures S1–S4) demonstrates that many of the genes for ribosomal proteins that are involved in protein synthesis processes were up-regulated in the brain by REM sleep loss (Figure S1). Indeed, research has shown that long-term sleep loss has been found to control several genes in the brain that are linked to the DNA binding/regulation of transcription, immunoglobulin synthesis, and stress response [55,90]. Contrary to the notion that Homer-1a is a key brain molecule in response to sleep loss in mice, no effect on gene expression of the Homer gene was observed in our study, which suggests that its regulation is modulated during other stages of sleep or is an organism-specific phenomenon [81]. The results underscore the complexity of sleep loss and its associated consequences, and sleep phase-, species-, and/or tissue-specific considerations rather than overarching, vague generalizations are required to deeply understand the phenomenon.
Additionally, REM sleep loss negatively affected several genes linked to neuroactive ligand-receptor interaction pathways in the brain, primarily related to gamma-Aminobutyric acid, Human Thrombin receptor, and associated receptor signaling dopamine (Figure S2). A recent review of sleep and protein-dependent synaptic plasticity indicated that sleep deprivation impairs many of the related biological and physiological processes [128]. We have found that many of the pathways in the liver that have been up-regulated are linked to metabolism, immunity, and depression (Figure 7A). On the other hand, only a few down-regulated pathways in the liver have been established, which include nitrogen metabolism and circadian rhythm (Figure 7B). The findings further support our secondary hypothesis that REM sleep loss affects the processes and pathways related to synaptic potentiation and learning and memory (Figure 8A) and processes related to homeostasis and immunity in the liver (Figure 8A–C).
Findings across studies are inconsistent regarding REM sleep deprivation and locomotor behavior and pain tolerance in rodents. Several studies have shown that REM sleep loss induces locomotor activity [92,155,156], while others have shown decreased locomotor activity [157]. The lack of a consistent explanation could be related to procedural changes in the methods of a given study, such as the degree of REM sleep loss. Few studies have used multiple pots compared to our classic single flower pot method for deprivation, and other studies have implemented less total time for deprivation (72–96 hrs.) compared to ours, which was ~216 hrs. Recent research supports the idea that REM sleep deprivation can affect locomotor activity in rats in an inverted-U manner [158,159]. A widely accepted view in the scientific community is that sleep deprivation decreases pain tolerance and increases the transmission of pain in multiple chronic pain conditions [160,161,162,163,164,165]. There is a conflict between reports on the sensory perception of pain [166,167], which was negatively affected in our study (Figure 3B), and few studies indicated that only total sleep deprivation raises the intensity of pain rather than REM sleep deprivation [168,169]. Nonetheless, selective REM sleep deprivation is correlated with enhanced placebo analgesia effects [170]. Similarly, consistency exists between REM sleep loss and its association with the perception of pain [171]. Perhaps sleep in general and short-term REM sleep deprivation lower the pain threshold, while long-term sleep deprivation increases the pain threshold. REM sleep deprivation and pain is significantly correlated with environmental conditions (e.g., dry or wet conditions), with pain sensitivity enhanced in dry test conditions but no different in wet conditions. [172]. This suggests that further work is needed to understand deeply the relationship between the experience of pain and lack of sleep. Furthermore, a recent microarray analysis shows that Hspa5 gene expression increases not only in the brain but also in the liver as sleep deprivation increases [81]. Our analysis did not return any genes that were commonly up-regulated in both the brain and liver; however, this may simply be due to differences between species, and many of the studies related to Hspa5 and sleep-wakefulness involved mice and drosophila [13,54,173]. Genes such as Wee1, Slc2a12, Hrk, and Fam110b were commonly down-regulated in both the brain and liver. Currently, however, there are disagreements about the relationship between expression of genes associated with locomotor behavior and pain tolerance, an area that is open for future research.
Our approach with GO terms and KEGG pathway analysis is quite relevant in the current era of genomics and sequencing, but it also involves discrepancies in gene function across organisms and distributed biases and biases linked to positive and negative annotations [174,175,176]. Like GO term analysis, KEGG analysis also has its limitations, apart from reducing the complexity of the data and helping to increase the explanatory power. One of the key disadvantages of KEGG is the independent consideration of pathways, even though crosses and overlaps occur in the natural system [177,178,179,180]. Therefore, the findings of our current study involving REM sleep deprivation affecting the brain and liver should be taken as a case study. The present study also provides a data set for future studies to compare the effect of RMS sleep loss across organs. We have only a few microarray studies available to help us understand the effect of molecular signatures of diseases, the effect of sleep deprivation, and disorders, and are looking forward to our study being one of these [129,181,182,183,184,185,186]. We further need more research related to total sleep or REM sleep loss to determine the stage and tissue-specific effects on the body in order to understand particular effects and to evaluate the influence of sleep loss on sleep related disorders.

5. Conclusions

Microarray analysis of brain and liver tissue in rats found that many of the physiological processes and the genes involved in the pathways are regulated differently in the two organs as a consequence of REM sleep loss. This also supports our hypothesis that REM sleep is crucial for proper metabolism and immune function in the liver and synaptic potentiation in the brain. Our findings underscore the idea that the brain is more receptive to processes such as synaptic potentiation, learning and memory, oxidative stress, and circadian rhythms in response to REM sleep loss. On the other hand, the function of the liver is more related to processes such as protein synthesis, stress balance, and detoxification. The study provides a fundamental platform for visualizing the effects of REM sleep loss across the brain and liver, and future studies should address the underlying dynamics of REM sleep deprivation and how it affects other organs of the body.

Supplementary Materials

The following are available online at https://www.mdpi.com/2624-5175/2/4/33/s1, Figure S1: The representation and mapping of genes affected (color marked) using ribosome pathway map (KEGG map:03010), Figure S2: The representation and mapping of genes affected (color marked) using neuroactive ligand-receptor interaction pathway map (KEGG map:04080), Figure S3: The representation and mapping of genes affected (color marked) using pathways in cancer map (KEGG map:05200), Figure S4: The representation and mapping of genes affected (color marked) using glycerophospholipid metabolism pathway map (KEGG map:00564), Table S1: List of real time PCR gene primers/probes used in microarray validation experiments, Table S2: List of genes upregulated in brain (A), downregulated in brain (B), upregulated in liver (C), downregulated in liver (D), Table S3: List of common genes affected in brain and liver, Table S4: Log fold change of gene expression after REM sleep loss compared to control, Table S5: List of GO terms related to synaptic plasticity, Table S6: List of GO terms related to immune system.

Author Contributions

A.P. was involved in conceptualization, data curation, formal analysis, investigation, methodology, software, validation, visualization, writing—original draft, and writing—review & editing; R.O. did helped with formal analysis, software, visualization, writing—review & editing and S.K.K. was involved with conceptualization, funding acquisition, project administration, resources management, supervision, and writing—review & editing of the manuscript. All authors have read and agree to the published version of the manuscript.

Funding

This research received no external funding. The internal university lab running fund given to S.K.K. was used for the purpose. A.P. was funded by university grant commission fellowship supporting graduate students.

Acknowledgments

This research was carried out and funded by a laboratory grant from the SKK Laboratory at the School of Biotechnology, Jawaharlal Nehru University, New Delhi, India. AP received funding from the Research Fellowship of the University Grants Commission (2008–2012), India and was afterward supported by the planning and budgeting committee (PBC) outstanding postdoctoral fellowship of Israel to Chinese and Indian citizens (2014–2017) and project postdoc fellowship from Guy Bloch at The Hebrew University of Jerusalem, Israel.

Conflicts of Interest

The authors have no conflict of interest and all funding and scientific contributions are fully recognized.

References

  1. Kelly, M.L.; Collin, S.P.; Hemmi, J.M.; Lesku, J.A. Evidence for Sleep in Sharks and Rays: Behavioural, Physiological, and Evolutionary Considerations. Brain Behav. Evol. 2020. [Google Scholar] [CrossRef] [PubMed]
  2. Hendricks, J.C.; Finn, S.M.; Panckeri, K.A.; Chavkin, J.; Williams, J.A.; Sehgal, A.; Pack, A.I. Rest in Drosophila is a sleep-like state. Neuron 2000, 25, 129–138. [Google Scholar] [CrossRef] [Green Version]
  3. Shaw, P.J.; Cirelli, C.; Greensoan, R.J.; Tononi, G. Correlates of sleep and waking in Drosophila melanogaster. Science 2000, 287, 1834–1837. [Google Scholar] [CrossRef] [PubMed] [Green Version]
  4. Zimmerman, J.E.; Naidoo, N.; Raizen, D.M.; Pack, A.I. Conservation of sleep: Insights from non-mammalian model systems. Trends Neurosci. 2008, 31, 371–376. [Google Scholar] [CrossRef] [Green Version]
  5. Yokogawa, T.; Marin, W.; Faraco, J.; Pézeron, G.; Appelbaum, L.; Zhang, J.; Rosa, F.; Mourrain, F.; Mignot, E. Characterization of sleep in zebrafish and insomnia in hypocretin receptor mutants. PLoS Biol. 2007, 5, 2379–2397. [Google Scholar] [CrossRef]
  6. Prober, D.A.; Rihel, J.; Onah, A.A.; Sung, R.-J.; Schier, A.F. Hypocretin/Orexin Overexpression Induces An Insomnia-Like Phenotype in Zebrafish. J. Neurosci. 2006, 26, 13400–13410. [Google Scholar] [CrossRef]
  7. Zhdanova, I.V.; Wang, S.Y.; Leclair, O.U.; Danilova, N.P. Melatonin promotes sleep-like state in zebrafish. Brain Res. 2001, 903, 263–268. [Google Scholar] [CrossRef]
  8. Raizen, D.M.; Zimmerman, J.E.; Maycock, M.H.; Ta, U.D.; You, Y.J.; Sundaram, M.V.; Pack, A.I. Lethargus is a Caenorhabditis elegans sleep-like state. Nature 2008, 451, 569–572. [Google Scholar] [CrossRef]
  9. Eban-Rothschild, A.; Bloch, G. Circadian rhythms and sleep in honey bees. Honeybee Neurobiol. Behav. 2012, 31–45. [Google Scholar] [CrossRef]
  10. Eban-Rothschild, A.D.; Bloch, G. Differences in the sleep architecture of forager and young honeybees (Apis mellifera). J. Exp. Biol. 2008, 211, 2408–2416. [Google Scholar] [CrossRef] [Green Version]
  11. Klein, B.A.; Seeley, T.D. Work or sleep? Honeybee foragers opportunistically nap during the day when forage is not available. Anim. Behav. 2011, 82, 77–83. [Google Scholar] [CrossRef] [Green Version]
  12. Nagari, M.; Gera, A.; Jonsson, S.; Bloch, G. Bumble Bee Workers Give Up Sleep to Care for Offspring that Are Not Their Own. Curr. Biol. 2019, 29, 3488–3493. [Google Scholar] [CrossRef] [PubMed]
  13. Shaw, P.J.; Tortoni, G.; Greenspan, R.J.; Robinson, D.F. Stress response genes protect against lethal effects of sleep deprivation in Drosophila. Nature 2002. [Google Scholar] [CrossRef] [PubMed]
  14. Stephenson, R.; Chu, K.M.; Lee, J. Prolonged deprivation of sleep-like rest raises metabolic rate in the Pacific beetle cockroach, Diploptera punctata (Eschscholtz). J. Exp. Biol. 2007. [Google Scholar] [CrossRef] [PubMed] [Green Version]
  15. Montagna, P.; Lugaresi, E. Agrypnia Excitata: A generalized overactivity syndrome and a useful concept in the neurophysiopathology of sleep. Clin. Neurophysiol. 2002. [Google Scholar] [CrossRef]
  16. Newman, S.M.; Paletz, E.M.; Rattenborg, N.C.; Obermeyer, W.H.; Benca, R.M. Sleep deprivation in the pigeon using the Disk-Over-Water method. Physiol. Behav. 2008. [Google Scholar] [CrossRef] [PubMed]
  17. Rechtschaffen, A.; Gilliland, M.A.; Bergmann, B.M.; Winter, J.B. Physiological correlates of prolonged sleep deprivation in rats. Science 1983, 221, 182–184. [Google Scholar] [CrossRef] [Green Version]
  18. Webb, W.B.; Agnew, H.W. Sleep deprivation, age, and exhaustion time in the rat. Science 1962, 136, 1122. [Google Scholar] [CrossRef] [PubMed]
  19. Cirelli, C.; Tononi, G. Is sleep essential? PLoS Biol. 2008, 6, 1605–1611. [Google Scholar] [CrossRef]
  20. Mirsky, A.F.; Cardon, P.V. A comparison of the behavioral and physiological changes accompanying sleep deprivation and chlorpromazine administration in man. Electroencephalogr. Clin. Neurophysiol. 1962. [Google Scholar] [CrossRef]
  21. Kayser, M.S.; Mainwaring, B.; Yue, Z.; Sehgal, A. Sleep deprivation suppresses aggression in Drosophila. Elife 2015. [Google Scholar] [CrossRef] [PubMed]
  22. Rial, R.V.; Nicolau, M.C.; Gamundí, A.; Akaârir, M.; Aparicio, S.; Garau, C.; Tejada, S.; Roca, C.; Gené, L.; Moranta, D.; et al. The trivial function of sleep. Sleep Med. Rev. 2007. [Google Scholar] [CrossRef] [PubMed]
  23. Rattenborg, N.C.; Lesku, J.A.; Martinez-Gonzalez, D.; Lima, S.L. The non-trivial functions of sleep. Sleep Med. Rev. 2007. [Google Scholar] [CrossRef]
  24. Tononi, G.; Cirelli, C. Sleep and synaptic down-selection. Eur. J. Neurosci. 2020. [Google Scholar] [CrossRef] [PubMed] [Green Version]
  25. Tononi, G.; Cirelli, C. Sleep and the Price of Plasticity: From Synaptic and Cellular Homeostasis to Memory Consolidation and Integration. Neuron 2014. [Google Scholar] [CrossRef] [Green Version]
  26. Mendelsohn, A.R.; Larrick, J.W. Sleep Facilitates Clearance of Metabolites from the Brain: Glymphatic Function in Aging and Neurodegenerative Diseases. Rejuvenation Res. 2013. [Google Scholar] [CrossRef]
  27. Opp, M.R.; Baracchi, F. Sleep and immune function. Curr. Adv. Sleep Biol. 2009. [Google Scholar] [CrossRef] [Green Version]
  28. Opp, M.R.; Krueger, J.M. Sleep and immunity: A growing field with clinical impact. Brain Behav. Immun. 2015. [Google Scholar] [CrossRef] [Green Version]
  29. Mullington, J.M.; Haack, M.; Toth, M.; Serrador, J.M.; Meier-Ewert, H.K. Cardiovascular, Inflammatory, and Metabolic Consequences of Sleep Deprivation. Prog. Cardiovasc. Dis. 2009. [Google Scholar] [CrossRef] [Green Version]
  30. Cirelli, C. Cellular consequences of sleep deprivation in the brain. Sleep Med. Rev. 2006. [Google Scholar] [CrossRef]
  31. Geissmann, Q.; Beckwith, E.J.; Gilestro, G.F. Most sleep does not serve a vital function. Evidence from Drosophila melanogaster. BioRxiv 2018. [Google Scholar] [CrossRef] [PubMed] [Green Version]
  32. Shein-Idelson, M.; Ondracek, J.M.; Liaw, H.P.; Reiter, S.; Laurent, G. Slow waves, sharp waves, ripples, and REM in sleeping dragons. Science 2016. [Google Scholar] [CrossRef] [PubMed]
  33. Boyce, R.; Glasgow, S.D.; Williams, S.; Adamantidis, A. Sleep research: Causal evidence for the role of REM sleep theta rhythm in contextual memory consolidation. Science 2016, 352, 812–816. [Google Scholar] [CrossRef] [PubMed]
  34. Graves, L.; Heller, E.; Pack, A.; Abel, T. Sleep deprivation selectively impairs memory consolidation for contextual fear conditioning. Learn. Mem. 2003, 10, 168–176. [Google Scholar] [CrossRef] [Green Version]
  35. Kumar, T.; Jha, S.K. Sleep Deprivation Impairs Consolidation of Cued Fear Memory in Rats. PLoS ONE 2012, 7. [Google Scholar] [CrossRef] [PubMed] [Green Version]
  36. Youngblood, B.D.; Zhou, J.; Smagin, G.N.; Ryan, D.H.; Harris, R.B.S. Sleep deprivation by the “flower pot” technique and spatial reference memory. Physiol. Behav. 1997, 61, 249–256. [Google Scholar] [CrossRef]
  37. Chokroverty, S. Physiological changes of sleep. Sleep Disord. Med. Basic Sci. Tech. Consid. Clin. 2017, 153–194. [Google Scholar] [CrossRef]
  38. Mallick, B.N.; Singh, S.; Pal, D. Role of alpha and beta adrenoceptors in locus coeruleus stimulation-induced reduction in rapid eye movement sleep in freely moving rats. Behav. Brain Res. 2005, 158, 9–21. [Google Scholar] [CrossRef]
  39. Mônico-Neto, M.; Dáttilo, M.; Ribeiro, D.A.; Lee, K.S.; de Mello, M.T.; Tufik, S.; Antunes, H.K.M. REM sleep deprivation impairs muscle regeneration in rats. Growth Factors 2017. [Google Scholar] [CrossRef]
  40. Van Der Helm, E.; Yao, J.; Dutt, S.; Rao, V.; Saletin, J.M.; Walker, M.P. REM sleep depotentiates amygdala activity to previous emotional experiences. Curr. Biol. 2011, 21, 2029–2032. [Google Scholar] [CrossRef] [Green Version]
  41. Grosmark, A.D.; Mizuseki, K.; Pastalkova, E.; Diba, K.; Buzsáki, G. REM Sleep Reorganizes Hippocampal Excitability. Neuron 2012, 75, 1001–1007. [Google Scholar] [CrossRef] [Green Version]
  42. Li, W.; Ma, L.; Yang, G.; Gan, W.B. REM sleep selectively prunes and maintains new synapses in development and learning. Nat. Neurosci. 2017, 20, 427–437. [Google Scholar] [CrossRef] [Green Version]
  43. Somarajan, B.I.; Khanday, M.A.; Mallick, B.N. Rapid eye movement sleep deprivation induces neuronal apoptosis by noradrenaline acting on alpha1 adrenoceptor and by triggering mitochondrial intrinsic pathway. Front. Neurol. 2016, 7. [Google Scholar] [CrossRef] [Green Version]
  44. Pandey, A.; Kumar, D.; Ray, G.; Kar, S. Rapid eye movement sleep deprivation causes apoptotic cell-death of the hepatocytes in rat. BioRxiv 2018. [Google Scholar] [CrossRef] [Green Version]
  45. Biswas, S.; Mishra, P.; Mallick, B.N. Increased apoptosis in rat brain after rapid eye movement sleep loss. Neuroscience 2006, 142, 315–331. [Google Scholar] [CrossRef]
  46. Pandey, A.K.; Kar, S.K. REM sleep deprivation of rats induces acute phase response in liver. Biochem. Biophys. Res. Commun. 2011, 410, 242–246. [Google Scholar] [CrossRef]
  47. Yehuda, S.; Sredni, B.; Carasso, R.L.; Kenigsbuch-Sredni, D. REM sleep deprivation in rats results in inflammation and interleukin-17 elevation. J. Interf. Cytokine Res. 2009. [Google Scholar] [CrossRef]
  48. Pandey, A.; Kar, S.K. Rapid Eye Movement sleep deprivation of rat generates ROS in the hepatocytes and makes them more susceptible to oxidative stress. Sleep Sci. 2018. [Google Scholar] [CrossRef]
  49. Balestrieri, S.; D’Onofrio, G.; Giuditta, A. Deprivation of paradoxical sleep effect on weight and nucleic acid content of liver and brain. Neurochem. Res. 1980. [Google Scholar] [CrossRef] [PubMed]
  50. Li, T.; Cao, R.; Xia, R.; Xia, Z. Effects of 72 Hours Sleep Deprivation on Liver Circadian Clock Gene Expression and Oxidative Stress in Rats. Yangtze Med. 2017. [Google Scholar] [CrossRef] [Green Version]
  51. Koban, M.; Swinson, K.L. Chronic REM-sleep deprivation of rats elevates metabolic rate and increases UCP1 gene expression in brown adipose tissue. Am. J. Physiol. Endocrinol. Metab. 2005. [Google Scholar] [CrossRef] [PubMed] [Green Version]
  52. Gómez-González, B.; Hurtado-Alvarado, G.; Esqueda-León, E.; Santana-Miranda, R.; Rojas-Zamorano, J.Á.; Velázquez-Moctezuma, J. REM sleep loss and recovery regulates blood-brain barrier function. Curr. Neurovasc. Res. 2013, 10, 197–207. [Google Scholar] [CrossRef] [PubMed]
  53. Venancio, D.P.; Suchecki, D. Prolonged REM sleep restriction induces metabolic syndrome-related changes: Mediation by pro-inflammatory cytokines. Brain Behav. Immun. 2015. [Google Scholar] [CrossRef] [PubMed]
  54. Cirelli, C.; Gutierrez, C.M.; Tononi, G. Extensive and Divergent Effects of Sleep and Wakefulness on Brain Gene Expression. Neuron 2004, 41, 35–43. [Google Scholar] [CrossRef] [Green Version]
  55. Cirelli, C.; Tononi, G. Gene expression in the brain across the sleep-waking cycle. Brain Res. 2000. [Google Scholar] [CrossRef]
  56. Vyazovskiy, V.V.; Cirelli, C.; Pfister-Genskow, M.; Faraguna, U.; Tononi, G. Molecular and electrophysiological evidence for net synaptic potentiation in wake and depression in sleep. Nat. Neurosci. 2008. [Google Scholar] [CrossRef]
  57. Tononi, G.; Cirelli, C. Sleep and synaptic homeostasis: A hypothesis. Brain Res. Bull. 2003, 62, 143–150. [Google Scholar] [CrossRef] [PubMed]
  58. Tononi, G.; Cirelli, C. Time to be SHY? Some comments on sleep and synaptic homeostasis. Neural. Plast. 2012. [Google Scholar] [CrossRef]
  59. Bliss, T.V.P.; Collingridge, G.L. Expression of NMDA receptor-dependent LTP in the hippocampus: Bridging the divide. Mol. Brain 2013. [Google Scholar] [CrossRef] [Green Version]
  60. Alberini, C.M. Transcription factors in long-term memory and synaptic plasticity. Physiol. Rev. 2009. [Google Scholar] [CrossRef] [PubMed]
  61. Bozon, B.; Kelly, Á.; Josselyn, S.A.; Silva, A.J.; Davis, S.; Laroche, S. MAPK, CREB and zif268 are all required for the consolidation of recognition memory. Philos. Trans. R. Soc. B Biol. Sci. 2003. [Google Scholar] [CrossRef] [Green Version]
  62. Chowdhury, S.; Shepherd, J.D.; Okuno, H.; Lyford, G.; Petralia, R.S.; Plath, N.; Kuhl, D.; Huganir, R.L.; Worley, P.F. Arc/Arg3.1 Interacts with the Endocytic Machinery to Regulate AMPA Receptor Trafficking. Neuron 2006. [Google Scholar] [CrossRef] [Green Version]
  63. Messaoudi, E.; Kanhema, T.; Soulé, J.; Tiron, A.; Dagyte, G.; Da Silva, B.; Bramham, C.R. Sustained Arc/Arg3.1 synthesis controls long-term potentiation consolidation through regulation of local actin polymerization in the dentate gyrus in vivo. J. Neurosci. 2007. [Google Scholar] [CrossRef] [PubMed] [Green Version]
  64. Racaniello, M.; Cardinale, A.; Mollinari, C.; D’Antuono, M.; De Chiara, G.; Tancredi, V.; Merlo, D. Phosphorylation Changes of CaMKII, ERK1/2, PKB/Akt Kinases and CREB Activation during Early Long-Term Potentiation at Schaffer Collateral-CA1 Mouse Hippocampal Synapses. Neurochem. Res. 2010. [Google Scholar] [CrossRef]
  65. Shepherd, J.D.; Rumbaugh, G.; Wu, J.; Chowdhury, S.; Plath, N.; Kuhl, D.; Huganir, R.L.; Worley, P.F. Arc/Arg3.1 Mediates Homeostatic Synaptic Scaling of AMPA Receptors. Neuron 2006. [Google Scholar] [CrossRef] [PubMed] [Green Version]
  66. Tzingounis, A.V.; Nicoll, R.A. Arc/Arg3.1: Linking Gene Expression to Synaptic Plasticity and Memory. Neuron 2006. [Google Scholar] [CrossRef] [Green Version]
  67. Pompeiano, M.; Cirelli, C.; Tononi, G. Immediate-early genes in spontaneous wakefulness and sleep: Expression of c-fos and NGFI-A mRNA and protein. J. Sleep Res. 1994. [Google Scholar] [CrossRef] [PubMed]
  68. Calais, J.B.; Ojopi, E.B.; Morya, E.; Sameshima, K.; Ribeiro, S. Experience-dependent upregulation of multiple plasticity factors in the hippocampus during early REM sleep. Neurobiol. Learn. Mem. 2015. [Google Scholar] [CrossRef] [Green Version]
  69. Smith-Hicks, C.; Xiao, B.; Deng, R.; Ji, Y.; Zhao, X.; Shepherd, J.D.; Posern, G.; Kuhl, D.; Huganir, R.L.; Ginty, D.D.; et al. SRF binding to SRE 6.9 in the Arc promoter is essential for LTD in cultured Purkinje cells. Nat. Neurosci. 2010. [Google Scholar] [CrossRef] [Green Version]
  70. Waung, M.W.; Pfeiffer, B.E.; Nosyreva, E.D.; Ronesi, J.A.; Huber, K.M. Rapid Translation of Arc/Arg3.1 Selectively Mediates mGluR-Dependent LTD through Persistent Increases in AMPAR Endocytosis Rate. Neuron 2008. [Google Scholar] [CrossRef] [Green Version]
  71. Korb, E.; Wilkinson, C.L.; Delgado, R.N.; Lovero, K.L.; Finkbeiner, S. Arc in the nucleus regulates PML-dependent GluA1 transcription and homeostatic plasticity. Nat. Neurosci. 2013. [Google Scholar] [CrossRef] [PubMed] [Green Version]
  72. Okuno, H.; Akashi, K.; Ishii, Y.; Yagishita-Kyo, N.; Suzuki, K.; Nonaka, M.; Kawashima, T.; Fujii, H.; Takemoto-Kimura, S.; Abe, M.; et al. Inverse synaptic tagging of inactive synapses via dynamic interaction of Arc/Arg3.1 with CaMKIIβ. Cell 2012. [Google Scholar] [CrossRef] [PubMed] [Green Version]
  73. Lambrecht, C.; Haesen, D.; Sents, W.; Ivanova, E.; Janssens, V. Structure, regulation, and pharmacological modulation of PP2A phosphatases. Methods Mol. Biol. 2013. [Google Scholar] [CrossRef]
  74. Ravassard, P.; Pachoud, B.; Comte, J.C.; Mejia-Perez, C.; Scoté-Blachon, C.; Gay, N.; Claustrat, B.; Touret, M.; Luppi, P.H.; Salin, P.A. Paradoxical (REM) sleep deprivation causes a large and rapidly reversible decrease in long-term potentiation, synaptic transmission, glutamate receptor protein levels, and ERK/MAPK activation in the dorsal hippocampus. Sleep 2009. [Google Scholar] [CrossRef]
  75. Mignot, E. Why we sleep: The temporal organization of recovery. PLoS Biol. 2008, 6, 661–669. [Google Scholar] [CrossRef] [Green Version]
  76. Cirelli, C.; Bushey, D. Sleep and wakefulness in Drosophila melanogaster. Ann. N. Y. Acad. Sci. 2008, 1129, 323–329. [Google Scholar] [CrossRef] [Green Version]
  77. Cirelli, C.; LaVaute, T.M.; Tononi, G. Sleep and wakefulness modulate gene expression in Drosophila. J. Neurochem. 2005, 94, 1411–1419. [Google Scholar] [CrossRef]
  78. Cirelli, C. Locus Ceruleus Control of State-Dependent Gene Expression. J. Neurosci. 2004, 24, 5410–5419. [Google Scholar] [CrossRef] [Green Version]
  79. Jones, S.; Pfister-Genskow, M.; Benca, R.M.; Cirelli, C. Molecular correlates of sleep and wakefulness in the brain of the white-crowned sparrow. J. Neurochem. 2008, 105, 46–62. [Google Scholar] [CrossRef]
  80. Mackiewicz, M.; Shockley, K.R.; Romer, M.A.; Galante, R.J.; Zimmerman, J.E.; Naidoo, N.; Baldwin, D.A.; Jensen, S.T.; Churchill, G.A.; Pack, A.I. Macromolecule biosynthesis: A key function of sleep. Physiol. Genom. 2007, 31, 441–457. [Google Scholar] [CrossRef]
  81. Maret, S.; Dorsaz, S.; Gurcel, L.; Pradervand, S.; Petit, B.; Pfister, C.; Hagenbuchle, O.; O’Hara, B.F.; Franken, P.; Tafti, M. Homer1a is a core brain molecular correlate of sleep loss. Proc. Natl. Acad. Sci. USA 2007, 104, 20090–20095. [Google Scholar] [CrossRef] [PubMed] [Green Version]
  82. Zimmerman, J.E.; Rizzo, W.; Shockley, K.R.; Raizen, D.M.; Naidoo, N.; Mackiewicz, M.; Churchill, G.A.; Pack, A.I. Multiple mechanisms limit the duration of wakefulness in Drosophila brain. Physiol. Genom. 2006, 27, 337–350. [Google Scholar] [CrossRef] [Green Version]
  83. Volkow, N.D.; Tomasi, D.; Wang, G.J.; Telang, F.; Fowler, J.S.; Logan, J.; Benveniste, H.; Kim, R.; Thanos, P.K.; Ferré, S. Evidence that sleep deprivation down regulates dopamine D2R in ventral striatum in the human brain. J. Neurosci. 2012. [Google Scholar] [CrossRef] [PubMed] [Green Version]
  84. França, A.S.C.; Lobão-Soares, B.; Muratori, L.; Nascimento, G.; Winne, J.; Pereira, C.M.; Jeronimo, S.M.B.; Ribeiro, S. D2 dopamine receptor regulation of learning, sleep and plasticity. Eur. Neuropsychopharmacol. 2015. [Google Scholar] [CrossRef] [PubMed] [Green Version]
  85. Nicholson, A.N.; Pascoe, P.A. Dopaminergic transmission and the sleep-wakefulness continuum in man. Neuropharmacology 1990. [Google Scholar] [CrossRef]
  86. Marlene Oscar, K.B. Dopaminergic Neurogenetics of Sleep Disorders in Reward Deficiency Syndrome (RDS). J. Sleep Disord. Ther. 2014. [Google Scholar] [CrossRef] [Green Version]
  87. Parameswari, P.; Chethan, N.; Saravana Babu, C. Neurochemicals and Behavioural Alterations in Sleep Deprivation: A Revisit. J. Dement. 2017, 1, 104. [Google Scholar]
  88. Peever, J.; Fuller, P.M. The Biology of REM Sleep. Curr. Biol. 2017. [Google Scholar] [CrossRef]
  89. Yamada, R.G.; Ueda, H.R. Molecular Mechanisms of REM Sleep. Front. Neurosci. 2020. [Google Scholar] [CrossRef]
  90. Cirelli, C.; Faraguna, U.; Tononi, G. Changes in brain gene expression after long-term sleep deprivation. J. Neurochem. 2006. [Google Scholar] [CrossRef]
  91. Hicks, R.A.; Okuda, A.; Thomsen, D. Depriving rats of REM sleep: The identification of a methodological problem. Am. J. Psychol. 1977, 90, 95–102. [Google Scholar] [CrossRef]
  92. van Hulzen, Z.J.M.; Coenen, A.M.L. Paradoxical sleep deprivation and locomotor activity in rats. Physiol. Behav. 1981, 27, 741–744. [Google Scholar] [CrossRef]
  93. R Development Core Team. Computing R: A language and environment for statistical. R Found. Stat. Comput. 2013. Available online: https://www.R-project.org (accessed on 23 October 2020).
  94. R Foundation for Statistical Computing. R: A Language and Environment for Statistical Computing. R Found. Stat. Comput. 2016. Available online: https://www.R-project.org (accessed on 23 October 2020).
  95. Ashburner, M.; Ball, C.A.; Blake, J.A.; Butler, H.; Cherry, J.M.; Eppig, J.T.; Harris, M.; Hill, D.P.; Mungall, C.; Reiser, L.; et al. Creating the Gene Ontology resource: Design and implementation. Genome Res. 2001. [Google Scholar] [CrossRef] [Green Version]
  96. Kanehisa, M.; Goto, S. KEGG: Kyoto Encyclopedia of Genes and Genomes. Nucleic Acids Res. 2000. [Google Scholar] [CrossRef]
  97. Kanehisa, M.; Sato, Y.; Furumichi, M.; Morishima, K.; Tanabe, M. New approach for understanding genome variations in KEGG. Nucleic Acids Res. 2019. [Google Scholar] [CrossRef] [Green Version]
  98. Kanehisa, M. Toward understanding the origin and evolution of cellular organisms. Protein Sci. 2019. [Google Scholar] [CrossRef]
  99. Core Team R. R: A Language and Environment for Statistical Computing. R Found. Stat. Comput. 2020. Available online: http://softlibre.unizar.es/manuales/aplicaciones/r/fullrefman.pdf (accessed on 23 October 2020).
  100. Yu, G.; Wang, L.G.; Han, Y.; He, Q.Y. ClusterProfiler: An R package for comparing biological themes among gene clusters. Omi. J. Integr. Biol. 2012. [Google Scholar] [CrossRef]
  101. Wang, H.; Liu, Y.; Briesemann, M.; Yan, J. Computational analysis of gene regulation in animal sleep deprivation. Physiol. Genom. 2010. [Google Scholar] [CrossRef]
  102. Martyn-Nemeth, P.; Phillips, S.A.; Mihailescu, D.; Farabi, S.S.; Park, C.; Lipton, R.; Idemudia, E.; Quinn, L. Poor sleep quality is associated with nocturnal glycaemic variability and fear of hypoglycaemia in adults with type 1 diabetes. J. Adv. Nurs. 2018. [Google Scholar] [CrossRef]
  103. Kim, J.H.; Kim, J.H.; Cho, Y.E.; Baek, M.C.; Jung, J.Y.; Lee, M.G.; Jang, I.S.; Lee, H.O.; Suk, K. Chronic sleep deprivation-induced proteome changes in astrocytes of the rat hypothalamus. J. Proteome Res. 2014. [Google Scholar] [CrossRef]
  104. Obholzer, N.; Wolfson, S.; Trapani, J.G.; Mo, W.; Nechiporuk, A.; Busch-Nentwich, E.; Seiler, C.; Sidi, S.; Söllner, C.; Duncan, R.N.; et al. Vesicular glutamate transporter 3 is required for synaptic transmission in zebrafish hair cells. J. Neurosci. 2008. [Google Scholar] [CrossRef] [Green Version]
  105. McGaugh, S.E.; Passow, C.N.; Jaggard, J.B.; Stahl, B.A.; Keene, A.C. Unique transcriptional signatures of sleep loss across independently evolved cavefish populations. J. Exp. Zool. Part B Mol. Dev. Evol. 2020. [Google Scholar] [CrossRef]
  106. Wei, Y. Comparative transcriptome analysis of the hippocampus from sleep-deprived and alzheimer’s disease mice. Genet. Mol. Biol. 2020. [Google Scholar] [CrossRef] [Green Version]
  107. Dyken, M.E.; Yamada, T.; Glenn, C.L.; Berger, H.A. Obstructive sleep apnea associated with cerebral hypoxemia and death. Neurology 2004. [Google Scholar] [CrossRef]
  108. Muller, N.L.; Francis, P.W.; Gurwitz, D.; Levison, H.; Bryan, A.C. Mechanism of hemoglobin desaturation during rapid-eye-movement sleep in normal subjects and in patients with cystic fibrosis. Am. Rev. Respir. Dis. 1980. [Google Scholar] [CrossRef]
  109. Gaudet, P.; Livstone, M.S.; Lewis, S.E.; Thomas, P.D. Phylogenetic-based propagation of functional annotations within the Gene Ontology consortium. Brief. Bioinform. 2011. [Google Scholar] [CrossRef] [Green Version]
  110. Schwenk, B.M.; Lang, C.M.; Hogl, S.; Tahirovic, S.; Orozco, D.; Rentzsch, K.; Lichtenthaler, S.F.; Hoogenraad, C.C.; Capell, A.; Haass, C.; et al. The FTLD risk factor TMEM106B and MAP6 control dendritic trafficking of lysosomes. EMBO J. 2014. [Google Scholar] [CrossRef]
  111. Chen-Plotkin, A.S.; Unger, T.L.; Gallagher, M.D.; Bill, E.; Kwong, L.K.; Volpicelli-Daley, L.; Busch, J.I.; Akle, S.; Grossman, M.; Van Deerlin, V.; et al. TMEM106B, the Risk Gene for Frontotemporal Dementia, Is Regulated by the microRNA-132/212 Cluster and Affects Progranulin Pathways. J. Neurosci. 2012. [Google Scholar] [CrossRef]
  112. Niethard, N.; Burgalossi, A.; Born, J. Plasticity during sleep is linked to specific regulation of cortical circuit activity. Front. Neural. Circuits 2017. [Google Scholar] [CrossRef] [Green Version]
  113. González-Rueda, A.; Pedrosa, V.; Feord, R.C.; Clopath, C.; Paulsen, O. Activity-Dependent Downscaling of Subthreshold Synaptic Inputs during Slow-Wave-Sleep-like Activity In Vivo. Neuron 2018. [Google Scholar] [CrossRef] [Green Version]
  114. Seibt, J.; Frank, M.G. Primed to sleep: The dynamics of synaptic plasticity across brain states. Front. Syst. Neurosci. 2019. [Google Scholar] [CrossRef] [Green Version]
  115. Wang, G.; Grone, B.; Colas, D.; Appelbaum, L.; Mourrain, P. Synaptic plasticity in sleep: Learning, homeostasis and disease. Trends Neurosci. 2011. [Google Scholar] [CrossRef] [Green Version]
  116. Havekes, R.; Vecsey, C.G.; Abel, T. The impact of sleep deprivation on neuronal and glial signaling pathways important for memory and synaptic plasticity. Cell. Signal. 2012. [Google Scholar] [CrossRef] [Green Version]
  117. Cirelli, C. Sleep and synaptic changes. Curr. Opin. Neurobiol. 2013. [Google Scholar] [CrossRef] [Green Version]
  118. Shaffery, J.P.; Lopez, J.; Bissette, G.; Roffwarg, H.P. Rapid eye movement sleep deprivation revives a form of developmentally regulated synaptic plasticity in the visual cortex of post-critical period rats. Neurosci. Lett. 2006. [Google Scholar] [CrossRef]
  119. Shaffery, J.P.; Sinton, C.M.; Bissette, G.; Roffwarg, H.P.; Marks, G.A. Rapid eye movement sleep deprivation modifies expression of long-term potentiation in visual cortex of immature rats. Neuroscience 2002. [Google Scholar] [CrossRef]
  120. Katayose, Y.; Tasaki, M.; Ogata, H.; Nakata, Y.; Tokuyama, K.; Satoh, M. Metabolic rate and fuel utilization during sleep assessed by whole-body indirect calorimetry. Metabolism 2009. [Google Scholar] [CrossRef]
  121. Spiegel, K.; Leproult, R.; Van Cauter, E. Impact of sleep debt on metabolic and endocrine function. Lancet 1999, 354, 1435–1439. [Google Scholar] [CrossRef]
  122. Donga, E.; Van Dijk, M.; Van Dijk, J.G.; Biermasz, N.R.; Lammers, G.J.; Van Kralingen, K.W.; Corssmit, E.P.M.; Romijn, J. A single night of partial sleep deprivation induces insulin resistance in multiple metabolic pathways in healthy subjects. J. Clin. Endocrinol. Metab. 2010. [Google Scholar] [CrossRef] [Green Version]
  123. Pamidi, S.; Aronsohn, R.S.; Tasali, E. Obstructive sleep apnea: Role in the risk and severity of diabetes. Best Pract. Res. Clin. Endocrinol. Metab. 2010. [Google Scholar] [CrossRef] [Green Version]
  124. Iiyori, N.; Alonso, L.C.; Li, J.; Sanders, M.H.; Garcia-Ocana, A.; O’Doherty, R.M.; Polotsky, V.Y.; O’Donnell, C.P. Intermittent hypoxia causes insulin resistance in lean mice independent of autonomic activity. Am. J. Respir. Crit. Care Med. 2007. [Google Scholar] [CrossRef] [Green Version]
  125. Asif, N.; Iqbal, R.; Nazir, C.F. Human immune system during sleep. Am. J. Clin. Exp. Immunol. 2017, 6, 92. [Google Scholar]
  126. Besedovsky, L.; Lange, T.; Haack, M. The sleep-immune crosstalk in health and disease. Physiol. Rev. 2019. [Google Scholar] [CrossRef] [Green Version]
  127. Ruiz, F.S.; Andersen, M.L.; Martins, R.C.S.; Zager, A.; Lopes, J.D.; Tufik, S. Immune alterations after selective rapid eye movement or total sleep deprivation in healthy male volunteers. Innate Immun. 2012. [Google Scholar] [CrossRef]
  128. Grønli, J.; Soulé, J.; Bramham, C.R. Sleep and protein synthesis-dependent synaptic plasticity: Impacts of sleep loss and stress. Front. Behav. Neurosci. 2014. [Google Scholar] [CrossRef] [Green Version]
  129. Hoffmann, M.S.; Singh, P.; Wolk, R.; Romero-Corral, A.; Raghavakaimal, S.; Somers, V.K. Microarray studies of genomic oxidative stress and cell cycle responses in obstructive sleep apnea. Antioxid. Redox Signal. 2007. [Google Scholar] [CrossRef]
  130. Fiorentino, L.; Ancoli-Israel, S. Sleep dysfunction in patients with cancer. Curr. Treat. Options Neurol. 2007. [Google Scholar] [CrossRef] [Green Version]
  131. Fang, H.F.; Miao, N.F.; Chen, C.D.; Sithole, T.; Chung, M.H. Risk of cancer in patients with insomnia, parasomnia, and obstructive sleep apnea: A nationwide nested case-control study. J. Cancer 2015. [Google Scholar] [CrossRef]
  132. Sateia, M.J.; Lang, B.J. Sleep and cancer: Recent developments. Curr. Oncol. Rep. 2008. [Google Scholar] [CrossRef] [PubMed]
  133. Shi, T.; Min, M.; Sun, C.; Zhang, Y.; Liang, M.; Sun, Y. Does insomnia predict a high risk of cancer? A systematic review and meta-analysis of cohort studies. J. Sleep Res. 2020. [Google Scholar] [CrossRef] [PubMed]
  134. Martínez-Garćia, M.Á.; Martorell-Calatayud, A.; Nagore, E.; Valero, I.; Selma, M.J.; Chiner, E.; Landete, P.; Montserrat, J.M.; Carrera, C.; Peŕez-Gil, A.; et al. Association between sleep disordered breathing and aggressiveness markers of malignant cutaneous melanoma. Eur. Respir. J. 2014. [Google Scholar] [CrossRef] [PubMed]
  135. Lin, C.L.; Liu, T.C.; Wang, Y.N.; Chung, C.H.; Chien, W.C. The association between sleep disorders and the risk of colorectal cancer in patients: A Population-based Nested Case–Control Study. In Vivo 2019. [Google Scholar] [CrossRef] [Green Version]
  136. Sillah, A.; Watson, N.F.; Schwartz, S.M.; Gozal, D.; Phipps, A.I. Sleep apnea and subsequent cancer incidence. Cancer Causes Control 2018. [Google Scholar] [CrossRef]
  137. Chiu, H.Y.; Huang, C.J.; Fan, Y.C.; Tsai, P.S. Insomnia but Not Hypnotics Use Associates with the Risk of Breast Cancer: A Population-Based Matched Cohort Study. J. Womens Health 2018. [Google Scholar] [CrossRef]
  138. Sturgeon, S.R.; Luisi, N.; Balasubramanian, R.; Reeves, K.W. Sleep duration and endometrial cancer risk. Cancer Causes Control 2012. [Google Scholar] [CrossRef]
  139. Liu, R.; Xu, K.P.; Tan, G.S. Cyclooxygenase-2 inhibitors in lung cancer treatment: Bench to bed. Eur. J. Pharmacol. 2015. [Google Scholar] [CrossRef]
  140. Lin, X.M.; Luo, W.; Wang, H.; Li, R.Z.; Huang, Y.S.; Chen, L.K.; Wu, X.P. The role of prostaglandin-endoperoxide synthase-2 in chemoresistance of non-small cell lung cancer. Front. Pharmacol. 2019. [Google Scholar] [CrossRef] [Green Version]
  141. Mueller, S.; Engleitner, T.; Maresch, R.; Zukowska, M.; Lange, S.; Kaltenbacher, T.; Konukiewitz, B.; Öllinger, R.; Zwiebel, M.; Strong, A.; et al. Evolutionary routes and KRAS dosage define pancreatic cancer phenotypes. Nature 2018. [Google Scholar] [CrossRef]
  142. LoRusso, P.M.; Herbst, R.S.; Rischin, D.; Ranson, M.; Calvert, H.; Raymond, E.; Kieback, D.; Kaye, S.; Gianni, L.; Harris, A.; et al. Improvements in quality of life and disease-related symptoms in phase I trials of the selective oral epidermal growth factor receptor tyrosine kinase inhibitor ZD1839 in non-small cell lung cancer and other solid tumors. Clin. Cancer. Res. 2003, 9, 2040–2048. [Google Scholar] [PubMed]
  143. Thomadaki, H.; Scorilas, A. BCL2 family of apoptosis-related genes: Functions and clinical implications in cancer. Crit. Rev. Clin. Lab. Sci. 2006. [Google Scholar] [CrossRef]
  144. Cruse, G.; Metcalfe, D.D.; Olivera, A. Functional deregulation of KIT: Link to mast cell proliferative diseases and other neoplasms. Immunol. Allergy Clin. N. Am. 2014. [Google Scholar] [CrossRef] [PubMed] [Green Version]
  145. Redline, S.; Tishler, P.V. The genetics of sleep apnea. Sleep Med. Rev. 2000. [Google Scholar] [CrossRef] [PubMed]
  146. Cirelli, C.; Tononi, G. On the Functional Significance of c-fos Induction During the Sleep-waking Cycle. Sleep 2000. [Google Scholar] [CrossRef]
  147. Cirelli, C.; Pompeiano, M.; Tononi, G. Sleep deprivation and c-fos expression in the rat brain. J. Sleep Res. 1995. [Google Scholar] [CrossRef]
  148. Gregory, A.; Kurian, M.A.; Maher, E.R.; Hogarth, P.; Hayflick, S.J. PLA2G6-Associated Neurodegeneration. In GeneReviews; Adam, M.P., Ardinger, H.H., Pagon, R.A., Wallace, S.E., Bean, L.J.H., Stephens, K., Amemiya, A., Eds.; GeneReviews® [Internet]; University of Washington: Seattle, WA, USA, 2008. Available online: https://www.ncbi.nlm.nih.gov/books/ (accessed on 23 October 2020).
  149. Gregory, A.; Westaway, S.K.; Holm, I.E.; Kotzbauer, P.T.; Hogarth, P.; Sonek, S.; Coryell, J.C.; Nguyen, T.M.; Nardocci, N.; Zorzi, G.; et al. Neurodegeneration associated with genetic defects in phospholipase A2. Neurology 2008. [Google Scholar] [CrossRef] [Green Version]
  150. Kinghorn, K.J.; Castillo-Quan, J.I.; Bartolome, F.; Angelova, P.R.; Li, L.; Pope, S.; Cochemé, H.M.; Khan, S.; Asghari, S.; Bhatia, K.P.; et al. Loss of PLA2G6 leads to elevated mitochondrial lipid peroxidation and mitochondrial dysfunction. Brain 2015. [Google Scholar] [CrossRef] [Green Version]
  151. Ollila, H. Genetics of Sleep, Sleep and Comorbidities: Connection at the Genetic Level; National Institute for Health and Welfare: Helsinki, Finland, 2013. [Google Scholar]
  152. Gao, Y.; Yi, X.; Ding, Y. Combined transcriptomic analysis revealed AKR1B10 played an important role in psoriasis through the dysregulated lipid pathway and overproliferation of keratinocyte. Biomed. Res. Int. 2017. [Google Scholar] [CrossRef]
  153. Barge-Schaapveld, D.Q.C.M.; Ofman, R.; Knegt, A.C.; Alders, M.; Höhne, W.; Kemp, S.; Hennekam, R.C.M. Intellectual Disability and Hemizygous GPD2 Mutation. Am. J. Med. Genet. Part A 2013. [Google Scholar] [CrossRef]
  154. Barclay, J.L.; Husse, J.; Bode, B.; Naujokat, N.; Meyer-Kovac, J.; Schmid, S.M.; Lehnert, H.; Oster, H. Circadian desynchrony promotes metabolic disruption in a mouse model of shiftwork. PLoS ONE 2012. [Google Scholar] [CrossRef] [Green Version]
  155. Arriaga, F.; Dugovic, C.; Wauquier, A. Effects of lithium on dopamine behavioural supersensitivity induced by rapid eye movement sleep deprivation. Neuropsychobiology 1988. [Google Scholar] [CrossRef]
  156. Albert, I.; Cicala, G.A.; Siegel, J. The behavioral effects of REM sleep deprivation in rats. Psychophysiology 1970. [Google Scholar] [CrossRef]
  157. Asakura, W.; Matsumoto, K.; Ohta, H.; Watanabe, H. REM sleep deprivation decreases apomorphine-induced stimulation of locomotor activity but not stereotyped behavior in mice. Gen. Pharmacol. 1992. [Google Scholar] [CrossRef]
  158. Maquet, P. Functional neuroimaging of normal human sleep by positron emission tomography. J. Sleep Res. 2000. [Google Scholar] [CrossRef] [Green Version]
  159. Van Luutelaar, E.L.J.M.; Coenen, A.M.L. Differential behavioural effects of two instrumental paradoxical sleep deprivation techniques in rats. Biol. Psychol. 1982. [Google Scholar] [CrossRef]
  160. Drewes, A.M.; Svendsen, L.; Taagholt, S.J.; Bjerregård, K.; Nielsen, K.D.; Hansen, B. Sleep in rheumatoid arthritis: A comparison with healthy subjects and studies of sleep/wake interactions. Br. J. Rheumatol. 1998. [Google Scholar] [CrossRef] [Green Version]
  161. Aǧargün, M.Y.; Tekeoǧlu, I.; Güneş, A.; Adak, B.; Kara, H.; Ercan, M. Sleep quality and pain threshold in patients with fibromyalgia. Compr. Psychiatry 1999. [Google Scholar] [CrossRef]
  162. Raymond, I.; Nielsen, T.A.; Lavigne, G.; Manzini, C.; Choinière, M. Quality of sleep and its daily relationship to pain intensity in hospitalized adult burn patients. Pain 2001. [Google Scholar] [CrossRef]
  163. Schrimpf, M.; Liegl, G.; Boeckle, M.; Leitner, A.; Geisler, P.; Pieh, C. The effect of sleep deprivation on pain perception in healthy subjects: A meta-analysis. Sleep Med. 2015. [Google Scholar] [CrossRef]
  164. Stroemel-Scheder, C.; Kundermann, B.; Lautenbacher, S. The effects of recovery sleep on pain perception: A systematic review. Neurosci. Biobehav. Rev. 2020. [Google Scholar] [CrossRef]
  165. Roehrs, T.; Hyde, M.; Blaisdell, B.; Greenwald, M.; Roth, T. Sleep loss and REM sleep loss are hyperalgesic. Sleep 2006. [Google Scholar] [CrossRef] [PubMed]
  166. Staffe, A.T.; Bech, M.W.; Clemmensen, S.L.K.; Nielsen, H.T.; Larsen, D.B.; Petersen, K.K. Total sleep deprivation increases pain sensitivity, impairs conditioned pain modulation and facilitates temporal summation of pain in healthy participants. PLoS ONE 2019. [Google Scholar] [CrossRef] [PubMed] [Green Version]
  167. Kim, S.H.; Park, J.Y.; Shin, H.E.; Lee, S.B.; Ryu, D.W.; Kim, T.W.; Park, J.W. The influence of rapid eye movement sleep deprivation on nociceptive transmission and the duration of facial allodynia in rats: A behavioral and Fos immunohistochemical study. J. Headache Pain 2019. [Google Scholar] [CrossRef] [PubMed] [Green Version]
  168. Azevedo, E.; Manzano, G.M.; Silva, A.; Martins, R.; Andersen, M.L.; Tufik, S. The effects of total and REM sleep deprivation on laser-evoked potential threshold and pain perception. Pain 2011. [Google Scholar] [CrossRef]
  169. Onen, S.H.; Alloui, A.; Gross, A.; Eschallier, A.; Dubray, C. The effects of total sleep deprivation, selective sleep interruption and sleep recovery on pain tolerance thresholds in healthy subjects. J. Sleep Res. 2001. [Google Scholar] [CrossRef] [Green Version]
  170. Chouchou, F.; Chauny, J.M.; Rainville, P.; Lavigne, G.J. Selective REM sleep deprivation improves expectation-related placebo analgesia. PLoS ONE 2015. [Google Scholar] [CrossRef]
  171. Smith, M.T.; Edwards, R.R.; Stonerock, G.L.; McCann, U.D. Individual variation in rapid eye movement sleep is associated with pain perception in healthy women: Preliminary data. Sleep 2005. [Google Scholar] [CrossRef] [Green Version]
  172. Onen, S.H.; Alloui, A.; Jourdan, D.; Eschalier, A.; Dubray, C. Effects of rapid eye movement (REM) sleep deprivation on pain sensitivity in the rat. Brain Res. 2001. [Google Scholar] [CrossRef]
  173. Hoekstra, M.M.B.; Emmenegger, Y.; Hubbard, J.; Franken, P. Cold-inducible RNA-binding protein (CIRBP) adjusts clock-gene expression and REM-sleep recovery following sleep deprivation. Elife 2019. [Google Scholar] [CrossRef]
  174. Gaudet, P.; Dessimoz, C. Gene ontology: Pitfalls, biases, and remedies. Methods Mol. Biol. 2017. [Google Scholar] [CrossRef] [Green Version]
  175. Tomczak, A.; Mortensen, J.M.; Winnenburg, R.; Liu, C.; Alessi, D.T.; Swamy, V.; Vallania, F.; Lofgren, S.; Haynes, W.; Shah, N.H.; et al. Interpretation of biological experiments changes with evolution of the Gene Ontology and its annotations. Sci. Rep. 2018. [Google Scholar] [CrossRef] [PubMed]
  176. Carbon, S.; Douglass, E.; Dunn, N.; Good, B.; Harris, N.L.; Lewis, S.E.; Mungall, C.J.; Basu, S.; Chisholm, R.L.; Dodson, R.J.; et al. The Gene Ontology Resource: 20 years and still GOing strong. Nucleic Acids Res. 2019. [Google Scholar] [CrossRef] [Green Version]
  177. Du, J.; Li, M.; Yuan, Z.; Guo, M.; Song, J.; Xie, X.; Chen, Y. A decision analysis model for KEGG pathway analysis. BMC Bioinform. 2016. [Google Scholar] [CrossRef] [Green Version]
  178. Du, J.; Yuan, Z.; Ma, Z.; Song, J.; Xie, X.; Chen, Y. KEGG-PATH: Kyoto encyclopedia of genes and genomes-based pathway analysis using a path analysis model. Mol. Biosyst. 2014. [Google Scholar] [CrossRef]
  179. Bauer-Mehren, A.; Furlong, L.I.; Sanz, F. Pathway databases and tools for their exploitation: Benefits, current limitations and challenges. Mol. Syst. Biol. 2009. [Google Scholar] [CrossRef]
  180. Khatri, P.; Sirota, M.; Butte, A.J. Ten years of pathway analysis: Current approaches and outstanding challenges. PLoS Comput. Biol. 2012. [Google Scholar] [CrossRef] [PubMed]
  181. Kittleson, M.M.; Hare, J.M. Molecular signature analysis: Using the myocardial transcriptome as a biomarker in cardiovascular disease. Trends Cardiovasc. Med. 2005. [Google Scholar] [CrossRef] [PubMed]
  182. Mohr, S.; Liew, C.C. The peripheral-blood transcriptome: New insights into disease and risk assessment. Trends Mol. Med. 2007. [Google Scholar] [CrossRef] [PubMed]
  183. Seugnet, L.; Boero, J.; Gottschalk, L.; Duntley, S.P.; Shaw, P.J. Identification of a biomarker for sleep drive in flies and humans. Proc. Natl. Acad. Sci. USA 2006. [Google Scholar] [CrossRef] [Green Version]
  184. Thimgan, M.; Gottschalk, L.; Duntley, S.; Shaw, P.J. New biomarkers of sleepiness identified in humans and Drosophila. In Proceedings of the Sleep 2009, 23rd Annual Meeting of the Associated Professional Sleep Societies, Seattle, WA, USA, 6–11 June 2009. [Google Scholar]
  185. Irwin, M.R.; Wang, M.; Campomayor, C.O.; Collado-Hidalgo, A.; Cole, S. Sleep deprivation and activation of morning levels of cellular and genomic markers of inflammation. Arch. Intern. Med. 2006. [Google Scholar] [CrossRef] [Green Version]
  186. Khalyfa, A.; Capdevila, O.S.; Buazza, M.O.; Serpero, L.D.; Kheirandish-Gozal, L.; Gozal, D. Genome-wide gene expression profiling in children with non-obese obstructive sleep apnea. Sleep Med. 2009. [Google Scholar] [CrossRef] [PubMed]
Figure 1. Relative expression of six candidate genes from the brain and liver tissue using real-time PCR and Microarray: (A) the comparative expression of genes in the brain; (B) the comparative expression of genes in the liver. Relative gene expressions were normalized by comparison with the expression of the Glyceraldehyde 3-phosphate dehydrogenase (GAPDH) gene, while results were analyzed using the 2−ΔΔCT method. For each gene, all RT-qPCRs used five biological replicates, with three technological replicates per experiment. The non-parametric Mann–Whitney U test was used to compare the pairwise expression of the microarray and the RT-PCR expression for the respective genes. We evaluated the normality of the data using the Kolmogorov–Smirnov normality test. Error bars indicate a ±SE value. * p < 0.05, ** p < 0.001, ns = non-significant.
Clockssleep 02 00033 g001
Figure 2. Venn diagram of the differentially expressed genes in the liver and brain after rapid eye movement sleep deprivation for nine days in rats. The Venn diagram shows overlapping genes of the UR_Liver (up-regulated liver); UR_Brain (up-regulated brain); DR_Liver (down-regulated liver); and DR_Brain (down-regulated brain). Numbers in separate shaded panels reflects the genes typically affected in both tissues, in a similar or opposite direction.
Clockssleep 02 00033 g002
Figure 3. Graphical representation of GO terms from biological processes for genes that are up-regulated in the brain (A), down-regulated in the brain (B), up-regulated in the liver (C), and down-regulated in the liver (D) following rapid eye movements sleep deprivation in rats. The x-axis shows gene count, and the y-axis shows the percentage of genes affected for respective node. The bubble size represents the log transformed p-value [Y = −0.5*log(Y)] of the respective biological processes. A bigger bubble size indicates a more significantly affected given process, and thus, a lower p-value. The top 20 terms are displayed for each category.
Clockssleep 02 00033 g003
Figure 4. Graphical representation of molecular function terms for genes that are up-regulated in the brain (A), down-regulated in the brain (B), up-regulated in the liver (C), and down-regulated in the liver (D) following rapid eye movements sleep deprivation in rats. The x-axis shows gene count, and the y-axis shows the percentage of genes affected. The bubble size represents the log transformed p-value [Y = −0.5*log(Y)] of the respective molecular function. A bigger bubble size indicates a more significantly affected given process, and thus, a lower p-value. The top 20 terms are displayed for each category.
Clockssleep 02 00033 g004
Figure 5. Graphical representation of cellular component terms for genes that are up-regulated in the brain (A), down-regulated in the brain (B), up-regulated in the liver (C), and down-regulated in the liver (D) following rapid eye movement sleep deprivation in rats. The x-axis shows gene count, and the y-axis shows the percentage of genes affected. The bubble size represents the log transformed p-value [Y = −0.5*log(Y)] of the respective cellular component. To fit the bubble size, the p-value in 5A* was normalized with formula [Y = −0.5*log(Y)/2]. A bigger bubble size indicates a more significantly affected given process, and thus, a lower p-value. The top 20 terms are displayed for each category.
Clockssleep 02 00033 g005
Figure 6. Kyoto Encyclopedia of Genes and Genomes (KEGG) pathways affected by rapid eye movement sleep deprivation in rats in the brain. The x-axis depicts the number of nodes affected and the y-axis shows the p-value (p < 0.05). Color coding indicates the total number of database nodes evaluated. The size of the circle indicates the direction of change.
Clockssleep 02 00033 g006
Figure 7. KEGG pathways affected by rapid eye movement sleep deprivation in rats in the liver: (A) up-regulated, (B) down-regulated. The x-axis depicts the number of nodes affected and the y-axis shows the * p-value (p < 0.05). Color coding reflects the total number of associated nodes.
Clockssleep 02 00033 g007
Figure 8. Network view of GO term association. Network plots of the top filtered GO terms, depicting the degree of connectivity within and between terms of enriched genes that are up-regulated in the brain, up-regulated in the liver, down-regulated in the brain, and down-regulated in the liver. The circles-legend at the bottom of each left-hand corner indicates the number of genes that are enriched for a given term. Connecting lines indicate a significant degree of semantic similarity between terms. Biological process (A), cellular component (B), and molecular function (C). GO terms were filtered (level = 3) to reduce redundancy and capture major categorical themes prior to visualization of connectivity in network plots, which were designed in R using the cluster Profiler package. Plots of filtered GO terms contained the top 20 significant categories, respectively, per subject cluster.
Clockssleep 02 00033 g008
Publisher’s Note: MDPI stays neutral with regard to jurisdictional claims in published maps and institutional affiliations.

