Article

The Effect of Mn Doping and Ti3+ Defects at TiO2 Surfaces in NO and SO2 Gas Capture Investigated Using Near-Ambient Pressure X-ray Photoelectron Spectroscopy

1
Department of Materials, School of Natural Sciences, The University of Manchester, Oxford Road, Manchester M13 9PL, UK
2
Photon Science Institute, The University of Manchester, Oxford Road, Manchester M13 9PL, UK
3
Henry Royce Institute, The University of Manchester, Oxford Road, Manchester M13 9PL, UK
4
Croda Europe Ltd., Widnes WA8 8UB, UK
*
Author to whom correspondence should be addressed.
Surfaces 2024, 7(1), 26-43; https://doi.org/10.3390/surfaces7010003
Submission received: 4 October 2023 / Revised: 20 November 2023 / Accepted: 29 November 2023 / Published: 5 January 2024

Abstract

:
The removal of air pollutants is an important research topic in order to improve the environment. In addition, many common pollutants can affect human health to varying degrees. In this work, we investigate NO and SO2 conversion by reaction with a commonly used metal oxide catalyst, TiO2. Rutile TiO2(110) single crystals and industrial powder samples used in sunscreen are studied using near-ambient pressure X-ray photoelectron spectroscopy (NAP-XPS) as a main tool. This allows in situ monitoring of the gas conversion process. We find Ti3+ defects (oxygen vacancies) or Mn oxides/cations (MnO) at the TiO2 surfaces can improve the conversion of NO and SO2 to surface-bound species. MnO and Ti3+ defects at the surface of rutile TiO2(110) exhibit a synergistic effect on the conversion of NO and SO2 that is significantly improved by nearly an order of magnitude. The by-products are mainly in the form of NO3, SO32−, and SO42−. We find the main oxidation products formed on the single crystals are subtly different from those on the industrial powder samples. For TiO2 nanopowders (undoped and Mndoped), the presence of Mn also shows improvement in toxic gas adsorption capacity. Overall, it is believed that the outcome obtained from NAP-XPS in this research provides useful insights for the future use of TiO2 in pollutant gas capture.

Graphical Abstract

1. Introduction

Titanium dioxide (TiO2) is a widely used semiconducting metal oxide, applied in a large number of applications including personal care products, where it is coated or doped for use in sunscreen [1]. Its effective ultraviolet (UV) light absorption, arising from the optical energy bandgap (3.0–3.2 eV), and biocompatibility in bone-contacting implants [2] have led to applications in numerous technological areas [3]. TiO2 also possesses good adsorption capability against a variety of reactants, some of which are toxic gases such as SO2 [4], NOx [5], etc. This is important since SO2 and NOx are known to have negative effects on human respiratory health [6] and have been implicated in skin ageing/damage [7] and more recently, it has also been suggested that NOx may be linked to dementia [8].
Materials can be used for air pollutant removal in several ways, including an intrinsic process [9], under light [5], or heat stress [10]. The intrinsic route for catalytic reactions does not require any other inputs; i.e., no light is required, so the material can act even under dark conditions. However, the catalytic capability of pure TiO2 samples via intrinsically catalytic reactions is typically limited. One reason for this is that without light, no extra electrons or holes are produced by photoexcitation. Electrons and holes are thought to be key to the catalytic activity of TiO2 [5]. Creating defects and/or adding some dopants at the surface or in the bulk of TiO2 are effective approaches to improve the performance [11,12]. For example, doping potassium cations (K+) in TiO2 appears to improve the ability to capture nitrogenated species and therefore enhance NO2 removal [9]. Other dopants have also been shown to be effective for pollutant gas removal [13], and among them, manganese (Mn) is an inexpensive and effective dopant for TiO2. Mn doping leads to the creation of additional states within the bandgap which may facilitate catalytic processes. The typical concentration of dopant atoms like Mn to give an optimised performance is around 10% or less since they are only required to reside at or near the surface to initiate the surface reactions that occur following the adsorption of the target gases [14]. In addition, Mn-TiO2-based catalyst systems are of particular interest for NO removal and appear to be particularly resistant to poisoning by SO2 [15,16].
Catalytic mechanisms with different reactants on different surfaces are quite varied [17]. Hence, understanding the fundamental interaction of gas molecules with catalyst materials is essential for designing relevant and efficient catalysts for use in air pollutant removal. X-ray photoelectron spectroscopy (XPS) is a powerful surface characterisation technique for catalytic mechanism studies [18,19]. However, conventional XPS only allows samples to be analysed in ultrahigh vacuum (UHV) conditions, which poses questions regarding the applicability to processes occurring under normal atmospheric conditions. This is true even when studying reactions with gases that only occur in ppm concentrations in the atmosphere since the vapour pressures of such gases will be in the 10−3 mbar range. It only enables post-mortem measurements that may miss some key information [20], making it difficult to properly understand catalytic mechanisms, and in particular identify intermediate species. The development of near-ambient pressure XPS (NAP-XPS) means that surface reactions under pressures up to tens of mbar now can be studied in situ/operando and in real time [9,21], allowing mechanisms at more realistic pressures to be elucidated. In addition to research in catalysis, NAP-XPS has also led to numerous successes in the investigation of other mechanisms, such as TiO2 with water adsorption [22] and the moisture-induced degradation process of halide perovskites [23], which provide useful insights for future materials development.
Although NAP-XPS studies have been performed on model TiO2-containing samples with various reactants, there is less work studying the effect of particle size, dopants, and defects (i.e., Ti3+/oxygen vacancies) in TiO2 and their effect on the reaction with NO and SO2, common atmospheric pollutants. In this paper, we study the reaction of NO and SO2 with rutile TiO2(110) single crystal, with and without O-vacancies. We then investigate the effect of Mn deposition on the rutile TiO2(110) single crystal surface—again with and without O-vacancies. We compare these samples to the reaction of the gases with TiO2 nanopowders, with and without Mn doping. The rationale for this approach is based on the concept that using single crystal TiO2, where the surface can be prepared to be atomically clean and ordered, can help with the interpretation of data recorded from the more complex, realistic system of the manufactured powders. The rutile TiO2(110) single crystal surface is one of the most well-understood metal oxide systems, and the preparation of stoichiometric and reduced surfaces is well known [22,24,25]. Single crystal TiO2 also allows us to monitor the effect of depositing Mn on the surface, in terms of the effects of the electronic structure, without having to consider the effects of adsorbed hydrocarbons, or other contaminants that may be present in the powders. Using NAP-XPS, it was found that a powder containing Mn has a better NO and SO2 adsorption capacity than the undoped materials with similar particle sizes. Interestingly, we find for the rutile TiO2(110) single crystal that depositing Mn on a reduced TiO2 surface leads to an increased reaction with both NO and SO2. This results in more adsorbed NO or SO2 than for the stoichiometric surface (regardless of Mn doping) or the reduced sample without Mn doping. In addition, it is found that reduction in the TiO2 surface affects the S species formed by adsorption. This suggests a synergistic effect of Ti3+ defects and Mn cations on TiO2 for air pollutant removal.

2. Experimental Section

2.1. Samples

Rutile TiO2(110) single crystals (PI-KEM) were prepared by a common TiO2 singlecrystal cleaning process [21] that involved cycles of sputtering using an Ar ion cluster source (cluster size = 1000 atoms, cluster energy = 10 keV) and annealing to 700 °C in vacuum (<5 × 10⁻¹⁰ mbar), until the surface is free of contaminants (C, K, Ca) and the Ti 2p spectrum shows no evidence of Ti3+ species. The reoxidation of the rutile TiO2(110) surface is thought to proceed via the diffusion of O-ions from the bulk to the surface, resulting in the formation of a stoichiometric surface. The diffusion of O from the bulk leads to a reduction in the bulk, rendering it n-doped, and resulting in a colour change from transparent to pale blue. The n-type nature of the reduced bulk gives rise to sufficient conductivity so that charge compensation is not required in photoelectron spectroscopy measurements [24]. To form defective (reduced) surfaces, the final annealing step is omitted, in order to produce O-vacancies at the rutile TiO2(110) surface which is evidenced by the appearance of Ti3+ in Ti 2p spectra. To study the effect of Mn doping, Mn was deposited on these surfaces using a Knudsen-cell evaporator with a Mn flake (99.95%, Goodfellow) in a preparation chamber attached to the NAP-XPS system so that samples were not exposed to the atmosphere prior to analysis. These surface treatments resulted in four different TiO2(110) surfaces: stoichiometric TiO2(110) (s-TiO2), reduced TiO2(110) rich in O-vacancies and Ti3+(r-TiO2), Mn-doped s-TiO2 and Mn-doped r-TiO2.
Before putting the Mn into the evaporator, the Mn flakes were washed with HCl several times to remove the surface oxide and then dried in air [26]. To heat the Mn source, a clean flake was surrounded by a handmade tungsten wire coil heated via an electric current of 4 A. Under this condition, the sample-to-sample electrical resistance was quite stable (ca. 1.5 ohm), which is expected to offer identical heat stress. Mn deposition was maintained for 10 min at a base pressure of around 5 × 10⁻⁸ mbar. The TiO2 substrates were not heated during deposition.
Nanoparticulate, rutile TiO2 powder samples were synthesised by a precipitation/calcination route and provided by Croda Europe. The Mn-doped (doping level ~0.7 wt %) and undoped samples with similar particle sizes are named Croda 1 (OptisolTM) and Croda 2, respectively, hereinafter (note Croda 1 has a slightly larger particle size due to the Mn doping). The powders consist of a large agglomerate of smaller nanoparticles, resulting in visible particle sizes in the micron range. These samples were measured by XPS by pressing the powder onto a conductive graphite tape compatible with a vacuum.

2.2. XPS Measurements

Standard XPS measurements were performed for the Croda samples, using a Kratos Axis Ultra XPS instrument(Kratos, Manchester, UK), equipped with a monochromated Al Kα X-ray source (photon energy = 1486.6 eV). Emitted photoelectrons were collected using the 165 mm hemispherical energy analyser. These results are shown in the Supplementary Materials (SM). All measurements conducted in this section were carried out in ultrahigh vacuum (UHV).
NAP-XPS measurements were performed using a SPECS Focus 500 monochromated Al Kα ( = 1486.6 eV) X-ray source and a SPECS 150 mm Phoibos 150 NAP analyser, with a three-stage, differentially pumped electrostatic lens to enable gas exposure experiments. Single crystal samples were prepared as described above in the same ultrahigh vacuum as the NAP-XPS cell, before being loaded directly into the NAP cell. The cell is then “docked” onto the entrance lens of the electron energy analyser before the gases are admitted. This means the prepared samples are not exposed to atmosphere between preparation and measurement at near-ambient pressures. SO2 and NO gases are allowed into the cell to a fixed pressure using mass flow controllers. For the SO2 experiment, a diluted SO2 gas (1% in Ar) was used, and the pressure applied during exposure was 1.5 mbar. For NO, undiluted NO (99.999%) gas was allowed into the cell to a pressure of 1 mbar. The spectra recorded “after exposure” were made after the gases were pumped out of the cell and the pressure had returned to a level of below 2 × 10⁻⁸ mbar. Fresh samples were prepared prior to each of the gas exposure experiments.
Binding energies (BEs) are calibrated to the C 1s spectrum from adventitious carbon at 284.8 eV [27] for Croda powders and to the O 1s spectrum from rutile (110) at 530.5 eV for the single crystals (all four surface preparations) [22]. For the latter, the Ti4+ Ti 2p3/2 peaks are located at 459.2 eV, consistent with the values for Ti4+ (TiO2 and SrTiO3) measured by the same instrument [22,23]. BE values are quoted to an accuracy of ±0.1 eV. A Shirley or a linear background was subtracted from the spectra [22], and a GL(30) peak (70% Gaussian and 30% Lorentzian) was applied to fit the core-level spectra using CasaXPS software (v2.3.25) [28]. The built-in CasaXPS sensitivity factors (Kratos) are used for calculating the stoichiometry of the samples. It was found empirically that the ratios of N/Ti and S/Ti during exposure could still be applied using the sensitivity factors for UHV.

3. Results and Discussion

3.1. Single Crystal TiO2(110) Surfaces

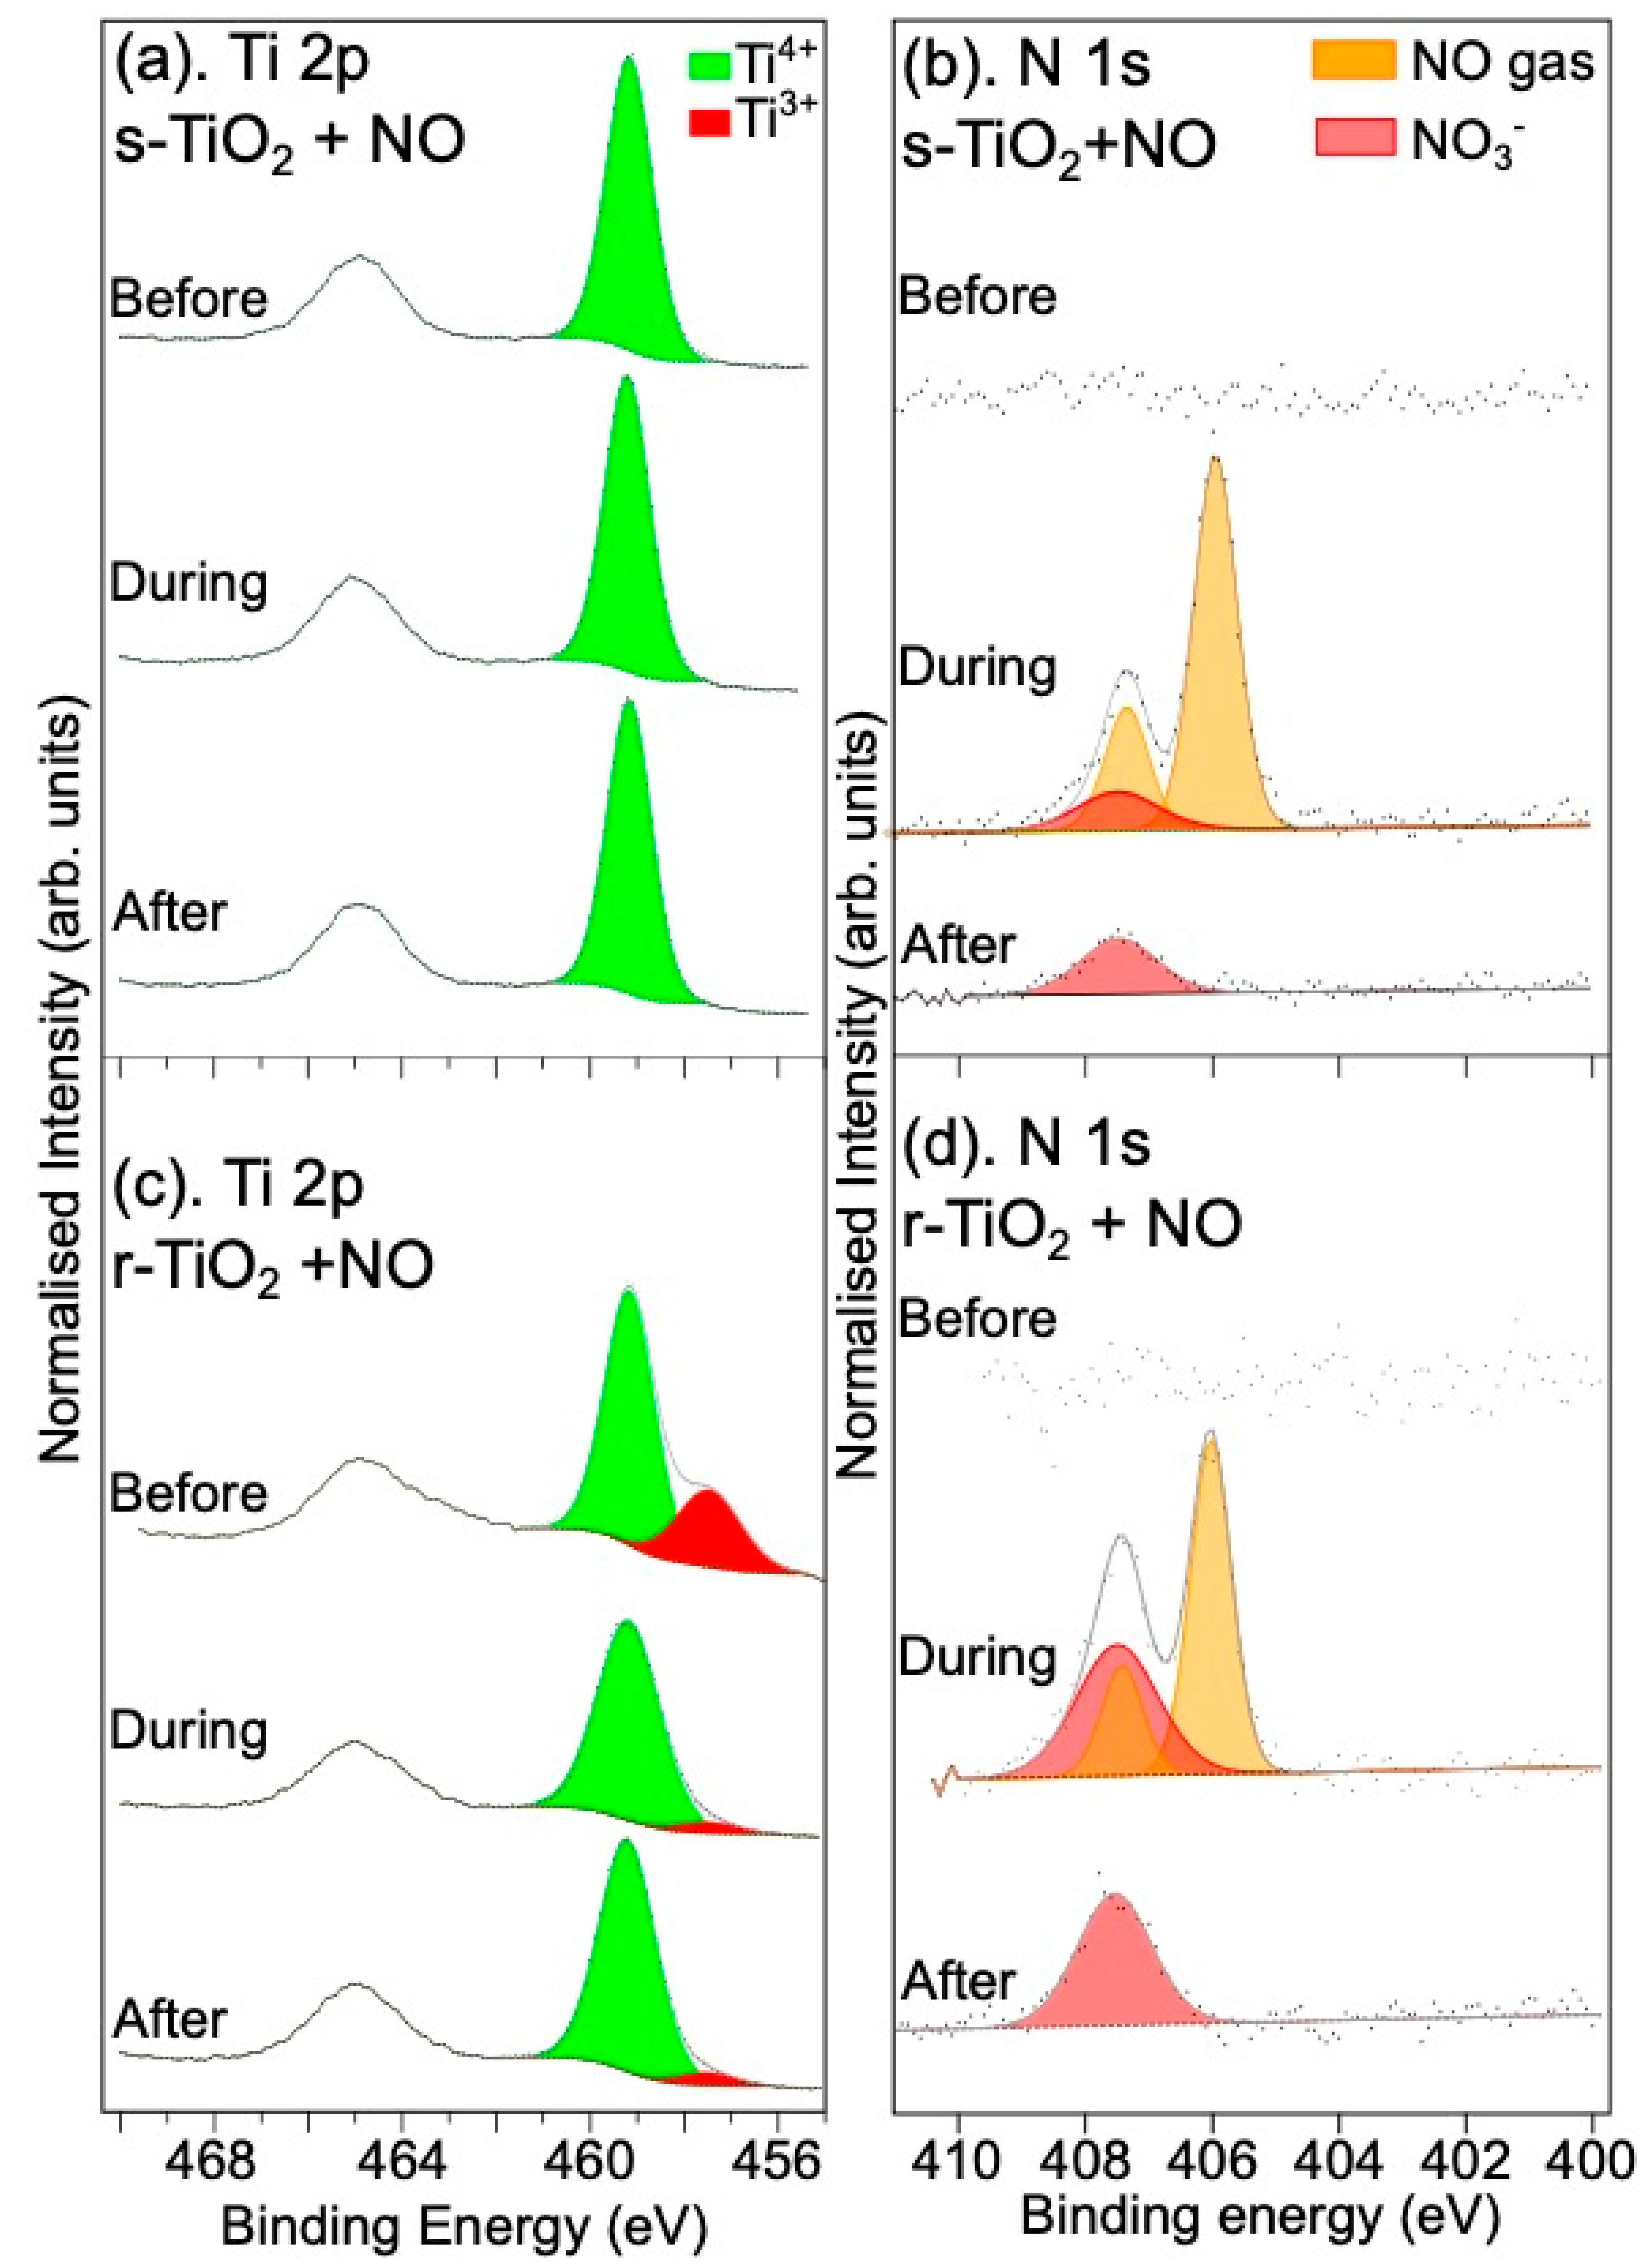
3.1.1. Reaction with NO Gas

XPS spectra were recorded from the as-prepared single crystal sample, during exposure to 1 mbar NO (undiluted), and after exposure to NO. Figure 1 shows Ti 2p and N 1s spectra recorded during this cycle. The Ti 2p core-level XPS spectra (before NO exposure) are shown in Figure 1a. The spectrum consists of two peaks at binding energies (BE) of 459.2 ± 0.1 eV (Ti 2p3/2) and 464.9 ± 0.1 eV (Ti 2p1/2), corresponding to the spin-orbit splitting of the Ti 2p level for Ti4+ in TiO2 [22]. There is no evidence of a contribution from Ti3+, which would lie at around 457.5 eV for the Ti 2p3/2 component [22]. Upon exposure to NO gas, the Ti 2p spectrum does not change, but the N 1s core-level spectra (Figure 1b) show changes during exposure and post-exposure to NO. During exposure to NO, the N 1s spectra exhibit three peaks. Two of these peaks arise from the NO gas due to its paramagnetic behaviour, which results in a splitting of 1.4 eV. (The NO gas phase spectrum, recorded from NO gas with the substrate retracted from the analysis region, is shown in Supplementary Materials (SM) Figure S1). The area of the lower BE peak (ca. 406.1 eV) is approximately three times that of the higher BE component (ca. 407.5 eV), and the peaks are called the triplet and singlet peaks, respectively [9]. The N 1s spectrum recorded during exposure does not give rise to peaks consistent with NO adsorption, which would appear at a BE of ~401 eV [29]. However, a broad peak can be fitted to the spectrum beneath the gas phase peak with a centre of gravity at 407.5 eV, a BE consistent with the formation of NO3 [5]. Nitrate species are a common by-product produced by TiO2 catalytic processes [9]. During NO exposure, the NO3 component lies directly beneath the NO gas phase-derived peaks, but the additional component is much broader than the gas phase peaks. As seen in the bottom curve in Figure 1b), which was recorded after the removal of the gas, the peak corresponding to NO3 is still present. It should be noted that fitting the spectrum recorded during exposure to NO did not require the application of constraints on the relative peak areas or full width at half maxima in the data analysis software to obtain the expected 3:1 peak area ratio for the gas phase NO peaks.
Surface Ti3+ resulting from the presence of surface O-vacancies has been shown to improve the photocatalytic performance of titania [12]. Its role in pollutant gas conversion, without UV illumination is, however, not clear. Figure 1c shows the Ti 2p and Figure 1d the N 1s XPS spectra recorded from an atomically clean rutile TiO2(110) substrate prepared with a final 10 min Ar-cluster ion sputtering step to create O-vacancies at the surface. As shown in Figure 1c, before NO exposure, a significant Ti3+-derived, Ti 2p3/2 component can be observed at a BE of 457.5 eV [17]. Upon NO exposure, the intensity of the Ti3+-derived peak is attenuated significantly, indicating that the NO appears to react at the O-vacancies leading to healing of the surface. The precise structure of this sputtered TiO2 surface is unclear, but it appears that reaction with NO results in the healing of the defects [18]. It has been shown that the reaction of NO to form nitrate at the surface of TiO2 progresses via a reaction with water or adsorbed hydroxide [4,26]. It is well known that reduced TiO2 surfaces show a higher reactivity with regard to water and therefore are likely to have a higher surface OH content [22,25,30]. Despite careful degassing and conditioning of the gas handling lines for the NAP cell, it is likely that at high pressures used in this experiment, there will be significant water desorption from the walls of the vacuum chamber. Therefore, it is possible that in part, the healing of the defects may be due to the reaction of the surface with water to form OH, and it is this OH that then reacts with the NO to form nitrate. Table S4 of the supplementary information shows that the r-TiO2(110) surface has a much higher surface Ti-OH concentration than the stoichiometric surface, which would seem to support this mechanism. In particular, it is noted that the r-TiO2(110) water:OH ratio is reduced compared to the stoichiometric surface, consistent with water dissociation at defect sites at the surface of the TiO2 [22]. It would be interesting to investigate this reaction further using techniques such as scanning tunnelling microscopy (STM), where the adsorption and reaction of NO at O-vacancies could be monitored directly. It would also be useful to study the effect of exposure to NO/H2O mixtures and under light and dark conditions under these higher-pressure regimes. It is clear from Figure 1c that even when the gas is removed, the Ti3+ intensity does not return to the original concentration, suggesting the “healing” process is permanent.
The N 1s NAP-XPS spectra for the reduced surface (Figure 1d), show a stronger NO3 signal relative to NO gas peaks. This alone does not mean a larger amount of NO3 on the surface, since the number of NO gas molecules probed also depends on the distance between the sample and the NAP analyser cone, even if the pressure is identical (i.e., 1 mbar). The distance between the sample and the analyser cone may vary by a few tens of microns. A better measure is the relative intensity of the NO3 to total Ti 2p since both are substrate-related. The values of the nitrogen-containing species relative to Ti are summarised in Table 1 and show that the NO3 concentration relative to Ti is almost double for the r-TiO2(110) than in the s-TiO2 sample. This suggests that the presence of Ti3+/O-vacancies improves the capture of NO gas and subsequent conversion to surface-bound nitrates. It is also found that the nitrate formed is quite stable since spectra recorded 30 min and 1 h after the gas is removed show no reduction in the amount of NO at the surface (see Table S1, SM). To calculate the N 1s:Ti 2p3/2 ratios, Kratos sensitivity factors are used, although these are not strictly applicable to measurements at higher pressure. This is because the gas will affect the transmission of photoelectrons between the sample and the analyser cone. However, the kinetic energy of N 1s and Ti 2p3/2 photoelectrons is similar (~1086.6 eV and ~1030.6 eV, respectively), so the effect should be small. In fact, the agreement between the “during” and “after” gas NO3 concentrations, for the “after” spectra the Kratos sensitivity factors are applicable as the measurements are at high vacuum, suggests that the use of these sensitivity factors is acceptable.
The effect of manganese (Mn) doping of the surface on NO adsorption by rutile TiO2(110) was also investigated. Figure 2 shows the Mn 2p spectra for the stoichiometric and reduced TiO2 surfaces before and after NO exposure. Based on the BE position and the broad structure of the Mn 2p3/2 peak for both the stoichiometric and r-TiO2(110) surfaces, the Mn appears to be oxidised [31]. The Mn 2p3/2 spectra can all be fitted with multiplet features consistent with the multiplet structure for MnO (Mn2+) [31,32,33], suggesting the reaction of Mn with the TiO2 surface. This is further supported by the Ti 2p spectrum of the s-TiO2(110) surface shown in Figure 3a, where deposition of Mn is found to create Ti3+ at the surface, presumably due to the creation of surface O-vacancies in the TiO2. This is consistent with the reaction of oxygen from the TiO2 surface with Mn, resulting in MnO formation. In addition, the Ti 2p spectra shown in Figure 3c, following deposition of Mn on the reduced TiO2 surface, show a larger Ti3+:Ti4+ ratio compared to the reduced TiO2 surface without Mn, despite using the same Ar+ ion sputtering conditions. The shape of the Mn 2p spectra for the Mn-doped TiO2 samples are similar regardless of the surface pre-treatment, showing that the deposition has good reproducibility, although it results in twice the coverage of Mn on the reduced surface compared to the stoichiometric surface. A simple calculation assuming a thin continuous film of Mn on the single crystal surface gives a film thickness of 0.2 nm (stoichiometric) or 0.4 nm (reduced surface). This result is interesting since it suggests that O-vacancy sites, or other defects on the rutile surface, may act as nucleation points for the attachment of the Mn. It is difficult to determine exactly the nature of the Mn growth, but previous work studying the deposition of Ag on the rutile TiO2 surface [34] suggests the growth is likely to be as clusters which begin at nucleation sites around defects on the surfaces, which would be consistent with the observation of higher coverage on the reduced surface.
Upon exposure to NO, as shown in Figure 2, the Mn 2p spectra do not undergo any changes. The Ti 2p spectra, shown in Figure 3a,c, on the other hand, show an almost complete removal of Ti3+ following reaction with NO gas, both for the stoichiometric and the reduced surfaces doped with Mn, suggesting the reaction results in oxidation of surface Ti3+. At the same time, for the Mn-s-TiO2 surface, the N 1s spectra indicate that NO reacts with the surface to form NO3, as shown in Figure 3b, and in agreement with the observation of the reaction of s-TiO2 with NO (Figure 1b). Table 1 shows that NO conversion by Mn-doped s-TiO2 is higher than for the undoped surface and similar to the undoped r-TiO2 sample. This is consistent with the similar levels of Ti3+ seen in the Ti 2p spectra for the r-TiO2 and Mn-s-TiO2 surfaces.
Figure 3d shows the N 1s spectra of the Mn-doped r-TiO2 upon exposure to NO. The appearance of a peak at a BE of 404.0 eV is observed, and this is assigned to NO2 or adsorbed NO2 [9]. The NO3:Ti ratios shown in Table 1 indicate that the total N-species present on the Mn-doped r-TiO2 is roughly ten times that for the undoped stoichiometric sample. This suggests a synergistic effect of MnO and r-TiO2 on the NO adsorption and conversion. Such improvement in total NO reaction uptake is mainly ascribed to a gain in NO3 and NO2/chemisorbed NO2 species, as shown in Figure 3d. Interestingly, the adsorbed NO2 species remains on the surface of the Mn-r-TiO2 sample when the background gas is removed, but the spectral weight seems to shift to the NO3 peak as shown in Table S1. When the sample is left in a vacuum for another hour (Table S1), the NO2-related peak continues to decrease in intensity whilst the NO3 peak intensity increases. Initially, there is a decrease in the total N-species concentration when the NO gas is first removed, but between 30 min and 1 h in a vacuum, the total N content remains roughly constant as shown in Figure S2. This suggests the feature at 404.0 eV may be an intermediate of the oxidation process induced by the Mn-doped r-TiO2 surface.

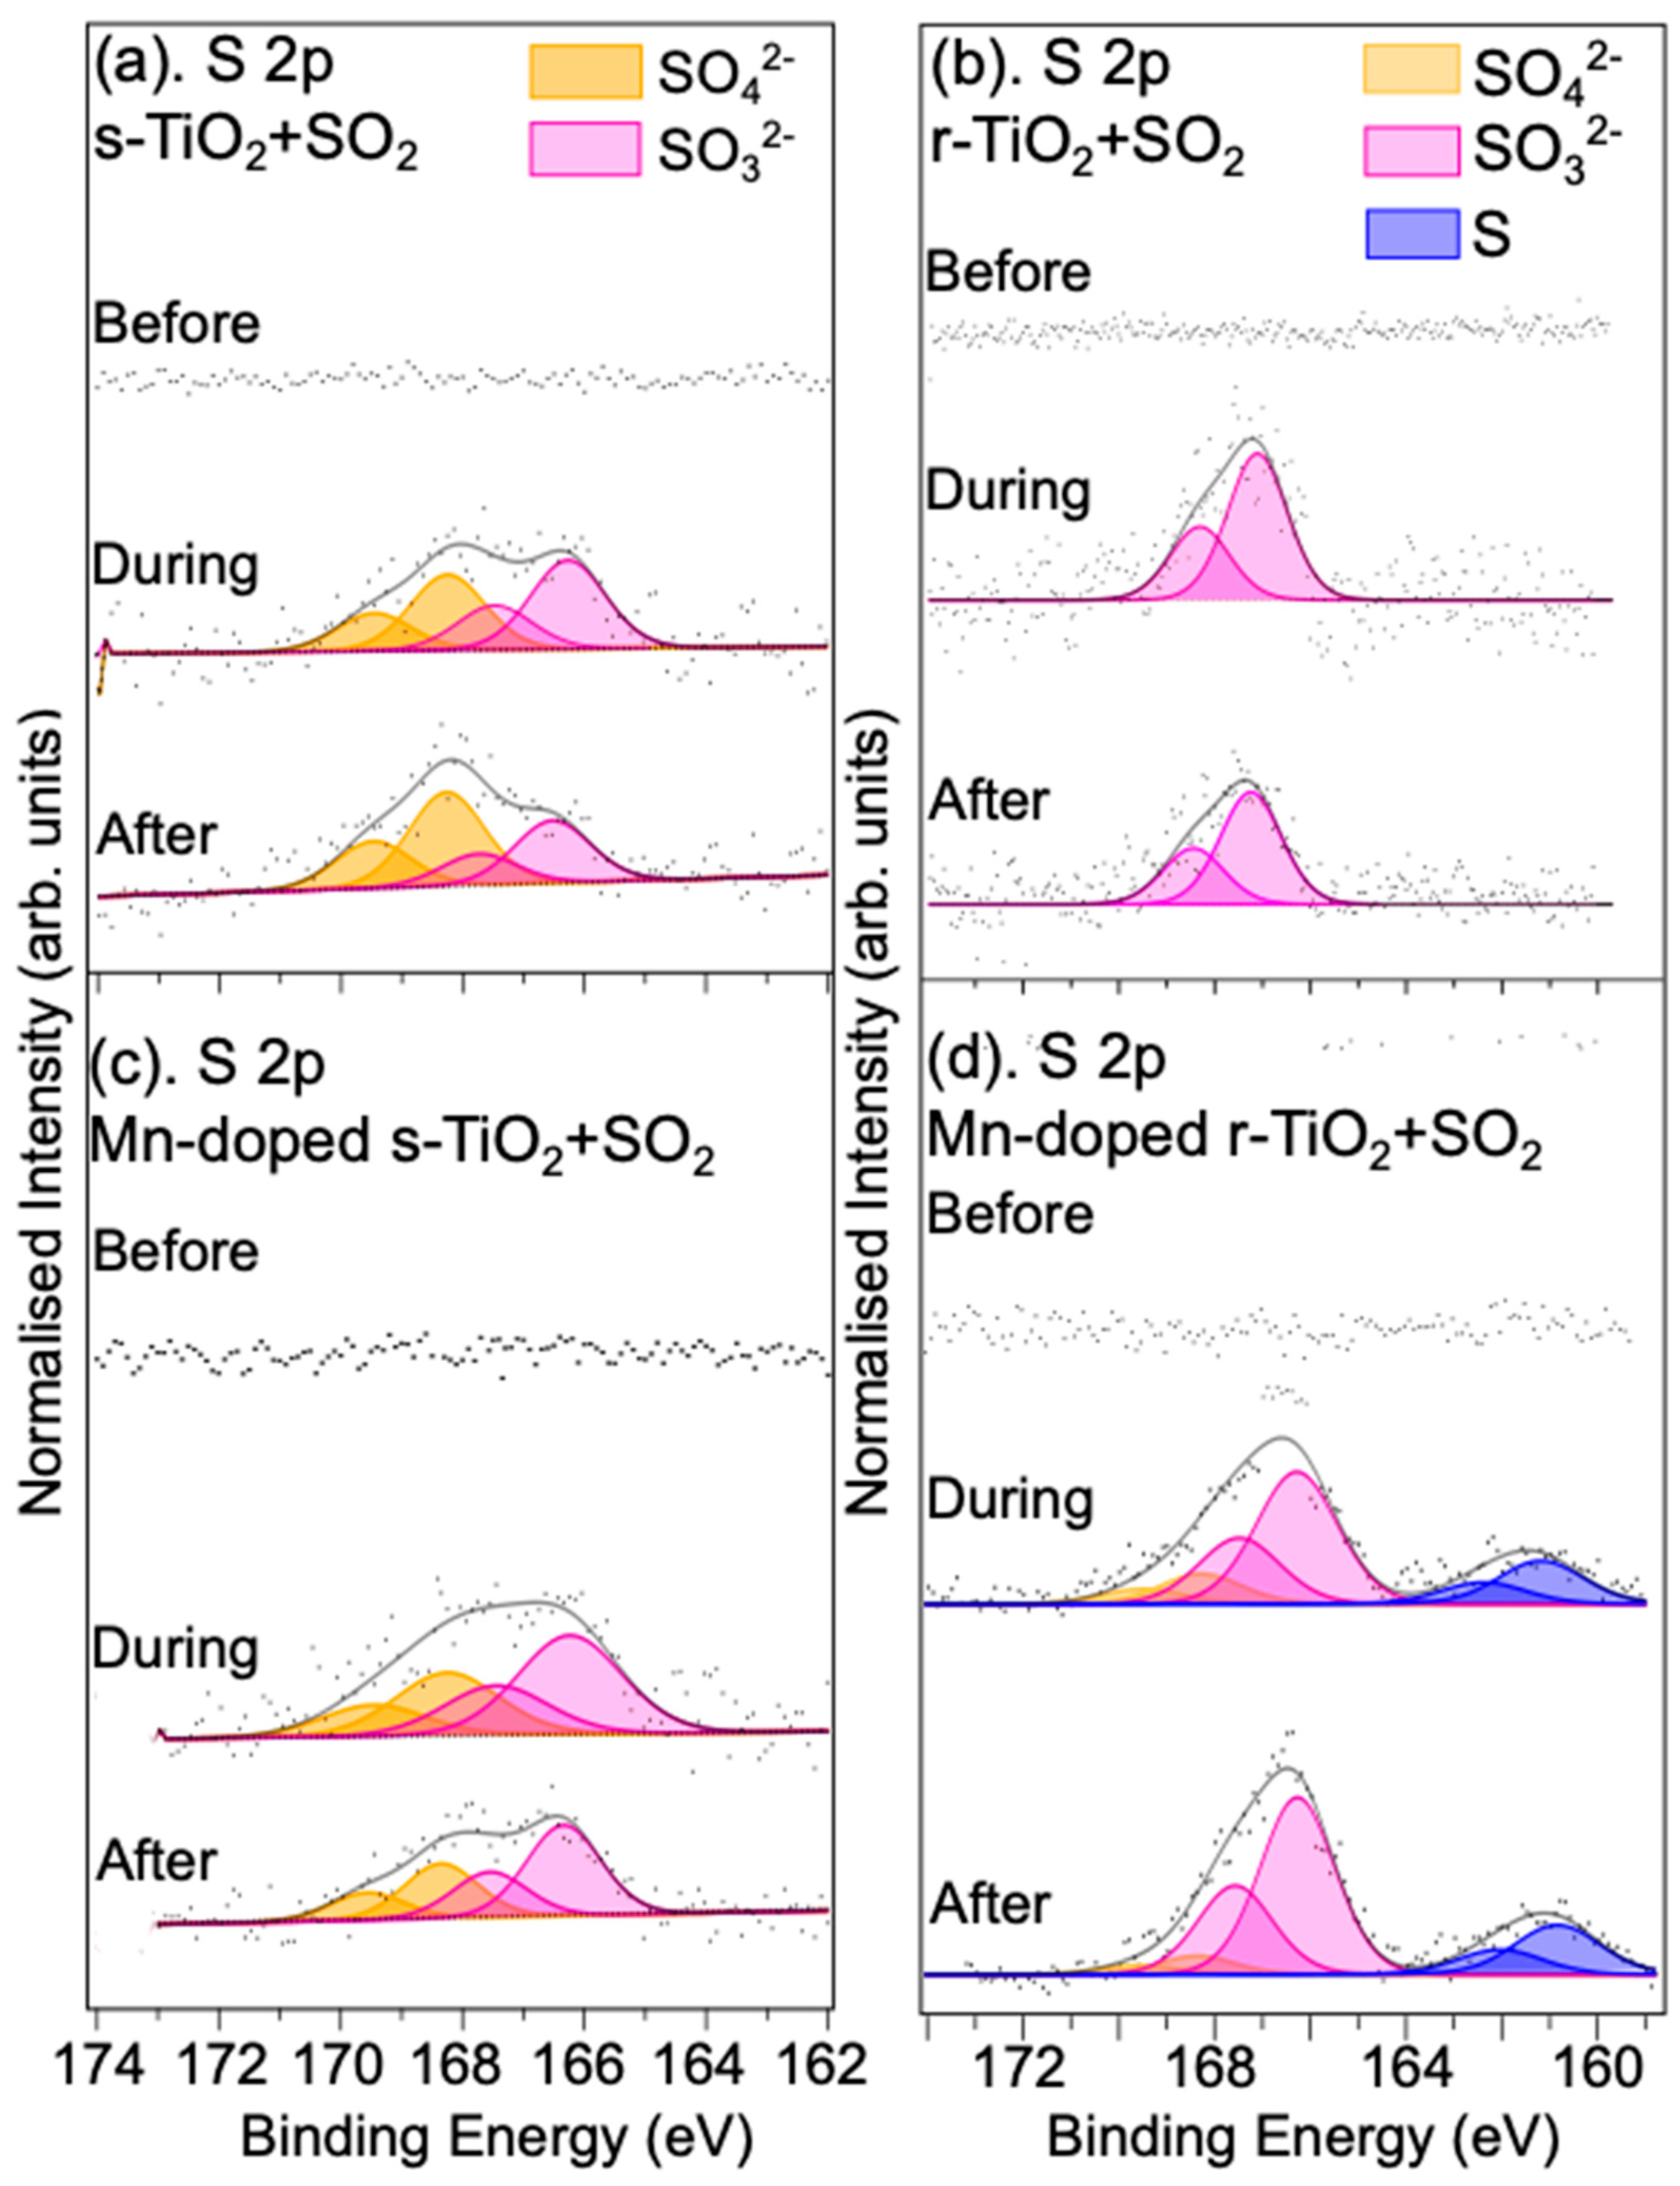
3.1.2. Reaction with SO2 Gas

SO2 is another pollutant gas for which the reaction with the four rutile TiO2(110) single crystal treatments was evaluated using NAP-XPS. The reaction of S-containing gases is also of interest in catalysis applications where S can lead to the poisoning of catalysts [35,36]. Exposure of the s-TiO2 surface to 1.5 mbar 1% SO2 in Ar gives rise to no observable changes in the Ti 2p spectra (Figure S3 in SM). Interestingly, for r-TiO2, Figure S3 also shows that exposure to 1.5 mbar of 1% SO2 in Ar does not lead to a large reduction in the intensity of the Ti3+ defect-related peak. This suggests there may be different reaction mechanisms between NO and SO2 at the surface of r-TiO2. Figure 4a,b show S 2p spectra of the undoped s-TiO2 and r-TiO2 crystals exposed to SO2 in Ar, respectively. No physisorbed SO2 peaks are observed in the S 2p spectra, suggesting that SO2 is rapidly converted into other sulphur-containing species. The spectra for the stoichiometric sample can be fitted with two S 2p3/2 and 2p1/2 spin-orbit-split doublets. The doublet at a lower BE (with an S 2p3/2 binding energy = 166.3 eV) is assigned to SO32−, and the doublet with S 2p3/2 located at a BE of 168.4 eV is assigned to SO42− species [35,37,38]. This indicates an oxidation process triggered by TiO2 to form a mixture of sulphates and sulphites, in agreement with earlier work studying the adsorption of SO2 at low coverages on the s-TiO2(110) surface [39,40]. Previous work using diffuse reflectance infrared Fourier transform spectroscopy to study Mn-Fe-doped TiO2 catalysts also showed the presence of sulphite and sulphate on the surface, with the sulphate formed following adsorption in a bidentate mode with surface-O species [35]. It is also seen that after time, sulphite appears to be slowly converted to sulphate since the spectral density shifts towards the latter in a spectrum recorded 1 h after exposure to the gas is stopped (see also Table S2 and Figure S4). On the reduced TiO2 surface, as shown in Figure 4d, SO42− does not seem to form upon exposure to SO2, with only peaks associated with SO32− visible. The reasons for this difference are unclear. It may be associated with differences between the surface-O environments for the two surfaces, perhaps with the SO2 interacting with bridging oxygen rows on the s-TiO2 surface that are likely to be absent, or significantly disrupted, on the r-TiO2(110) surface [24,38]. In the spectra recorded under UHV conditions, after 1 h and 2 h following the evacuation of the SO2 gas, there is a slight decrease in the amount of SO32− at the surface relative to the “in situ” measurement (see Table S2 and Figure S4 in SM). Again, it is noted that the use of vacuum sensitivity factors may affect the calculated S:Ti ratios for the in situ measurements, and here the effect is likely to be larger than for the NO spectra since the kinetic energy difference of photoelectrons emitted from S 2p3/2 and Ti 2p3/2 is around 300 eV. It is possible, therefore, that the amount of SO32− does not change over time; i.e., the sulphite species is strongly bound to the surface. Table S2, which shows the SO32− concentration over time after the gas is removed, supports this assumption since the concentration does not change, within error, between 1 and 2 h after the gas is removed. Since these latter measurements are both made in vacuum, the sensitivity factors used will account for the different kinetic energies of the photoelectrons.
We now turn to the effect of Mn doping on the SO2 reaction with rutile s-TiO2(110) and r-TiO2(110). No change was observed in the Mn 2p spectra upon SO2 exposure for any of the surfaces studied here (see Figure S5). The S 2p spectra sets of spectra show components due to SO42− and SO32−, although for the r-TiO2 sample, the sulphate-derived peak is smaller than the sulphite. The Mn-doped r-TiO2(110) sample also shows a much higher concentration of total surface-bound S species on exposure to the SO2 gas than either the undoped r-TiO2 or either of the s-TiO2 surfaces. The total S content at the surface is around six times the value for the undoped stoichiometric sample. This seems to suggest that Mn (or MnO) acts to promote the conversion of SO2 to sulphite. This is similar to the case of NO conversion on this surface, where it was seen that the increase in N content was due to the formation of lower oxidation state products (i.e., NO2 vs. NO3 and SO32− vs. SO42−). MnO appears to have a significant effect on the capacity for NO and SO2 gas adsorption although it should also be remembered that more Mn is deposited on the r-TiO2(110) surface. This was also the case for the sample used for the study of SO2 conversion. Of particular interest, for the Mn-doped reduced TiO2 sample, a spin-orbit split doublet peak is present with an S 2p3/2 peak at a binding energy of 160.9 eV, which is consistent with the formation of metal sulphides [41,42]. In addition, a decrease in the intensity of the Ti3+ and Ti2+ components in the Ti 2p spectrum is observed (see Figure S3 in SM), in contrast to what was seen for the undoped r-TiO2(110) and the Mn-doped s-TiO2 samples, where only a small decrease in the Ti3+ content is observed. It appears that Mn is therefore catalysing the reduction of SO2 on the TiO2 surface, with the O being incorporated into the TiO2 surface, coupled with the formation of Ti sulphides [41,42].
Table 2 shows the S species concentrations measured relative to Ti during exposure to SO2 in Ar gas. For the stoichiometric TiO2 surface, it appears that Mn doping does not lead to any significant difference in the total amount of adsorbed S-containing species, but the amount of SO32− is higher on the Mn-doped r-TiO2 surface. It is noted that again when the gas is removed and the sample returned to UHV, the spectral weight again shifts towards the formation of sulphate, suggesting either a slow conversion of SO32− to SO42− or the desorption of SO32− from the surface (see Table S2, Figure S4). This too would seem to support a reaction between the SO2 gas and surface oxygen since Mn doping leads to the formation of surface Ti3+. This then would lead to a reduction in the amount of surface oxygen available for reaction with SO2, limiting the reaction to the formation of SO32−, as appears to be the case for the reduced TiO2(110) surface. Unlike the Mn-doped r-TiO2 surface, however, there is no evidence of sulphide formation, nor is there an observable decrease in the Ti3+ concentration upon reaction with the surface as shown in Figure S3.

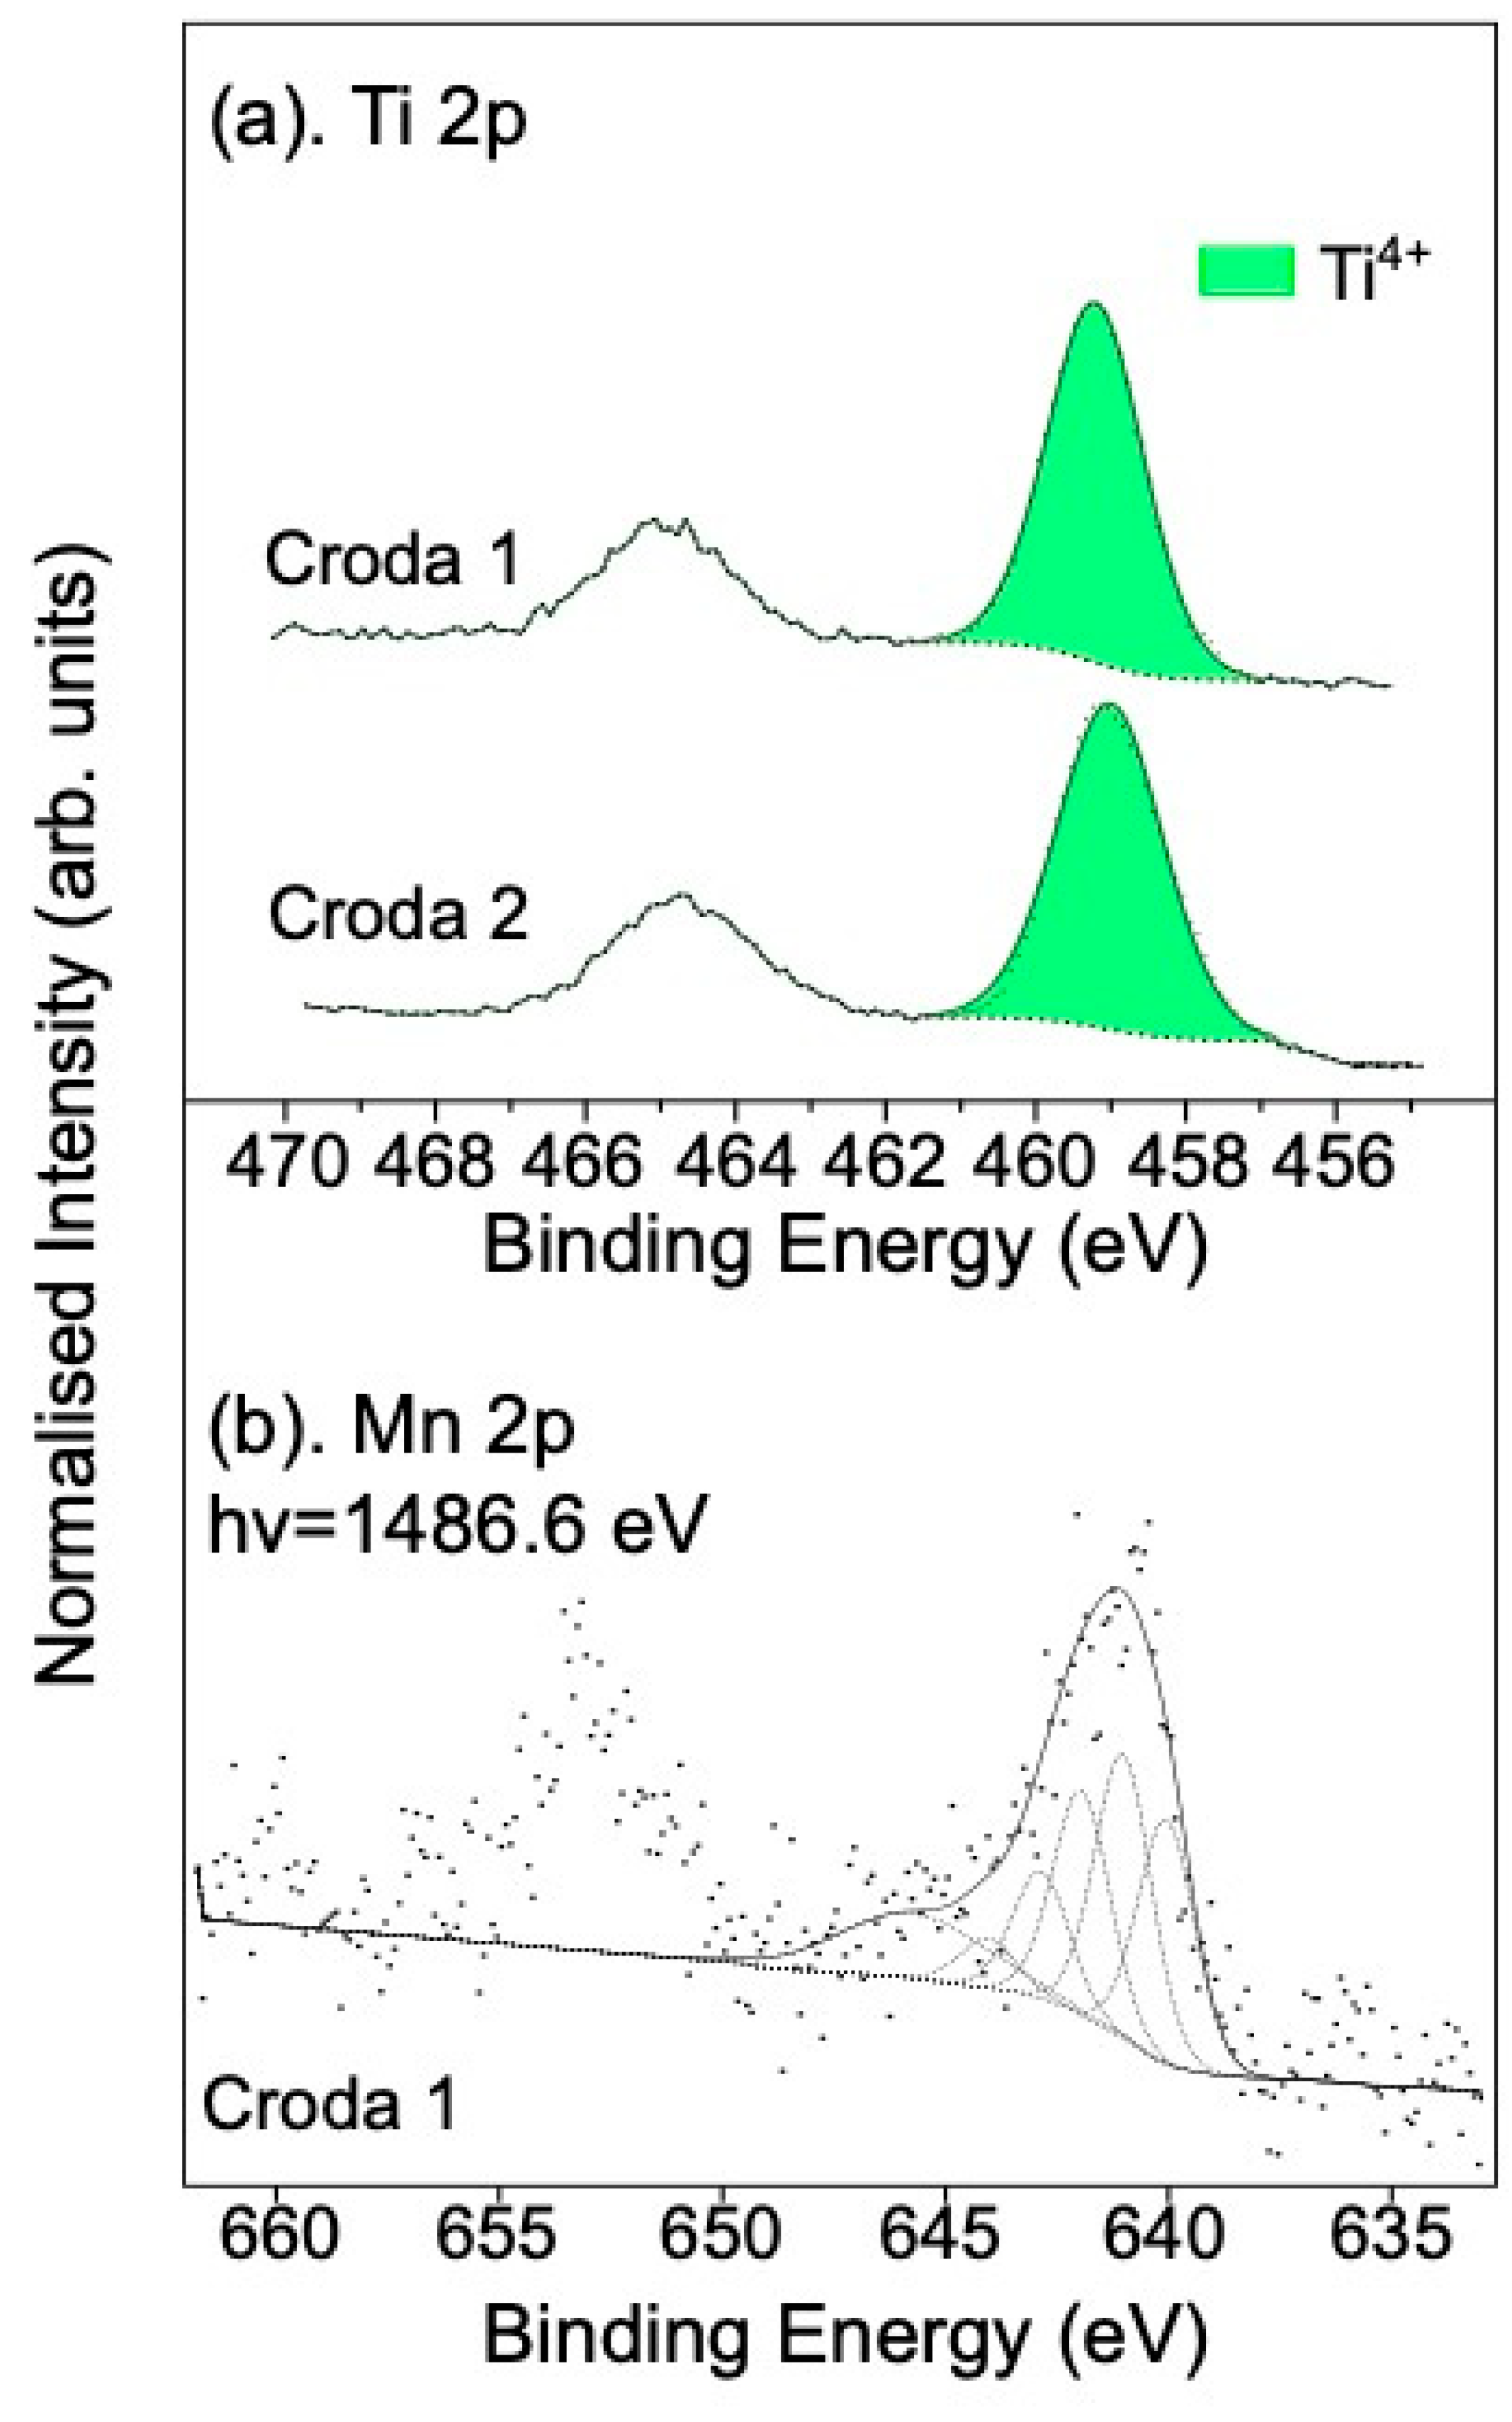
3.2. TiO2 Nanopowders

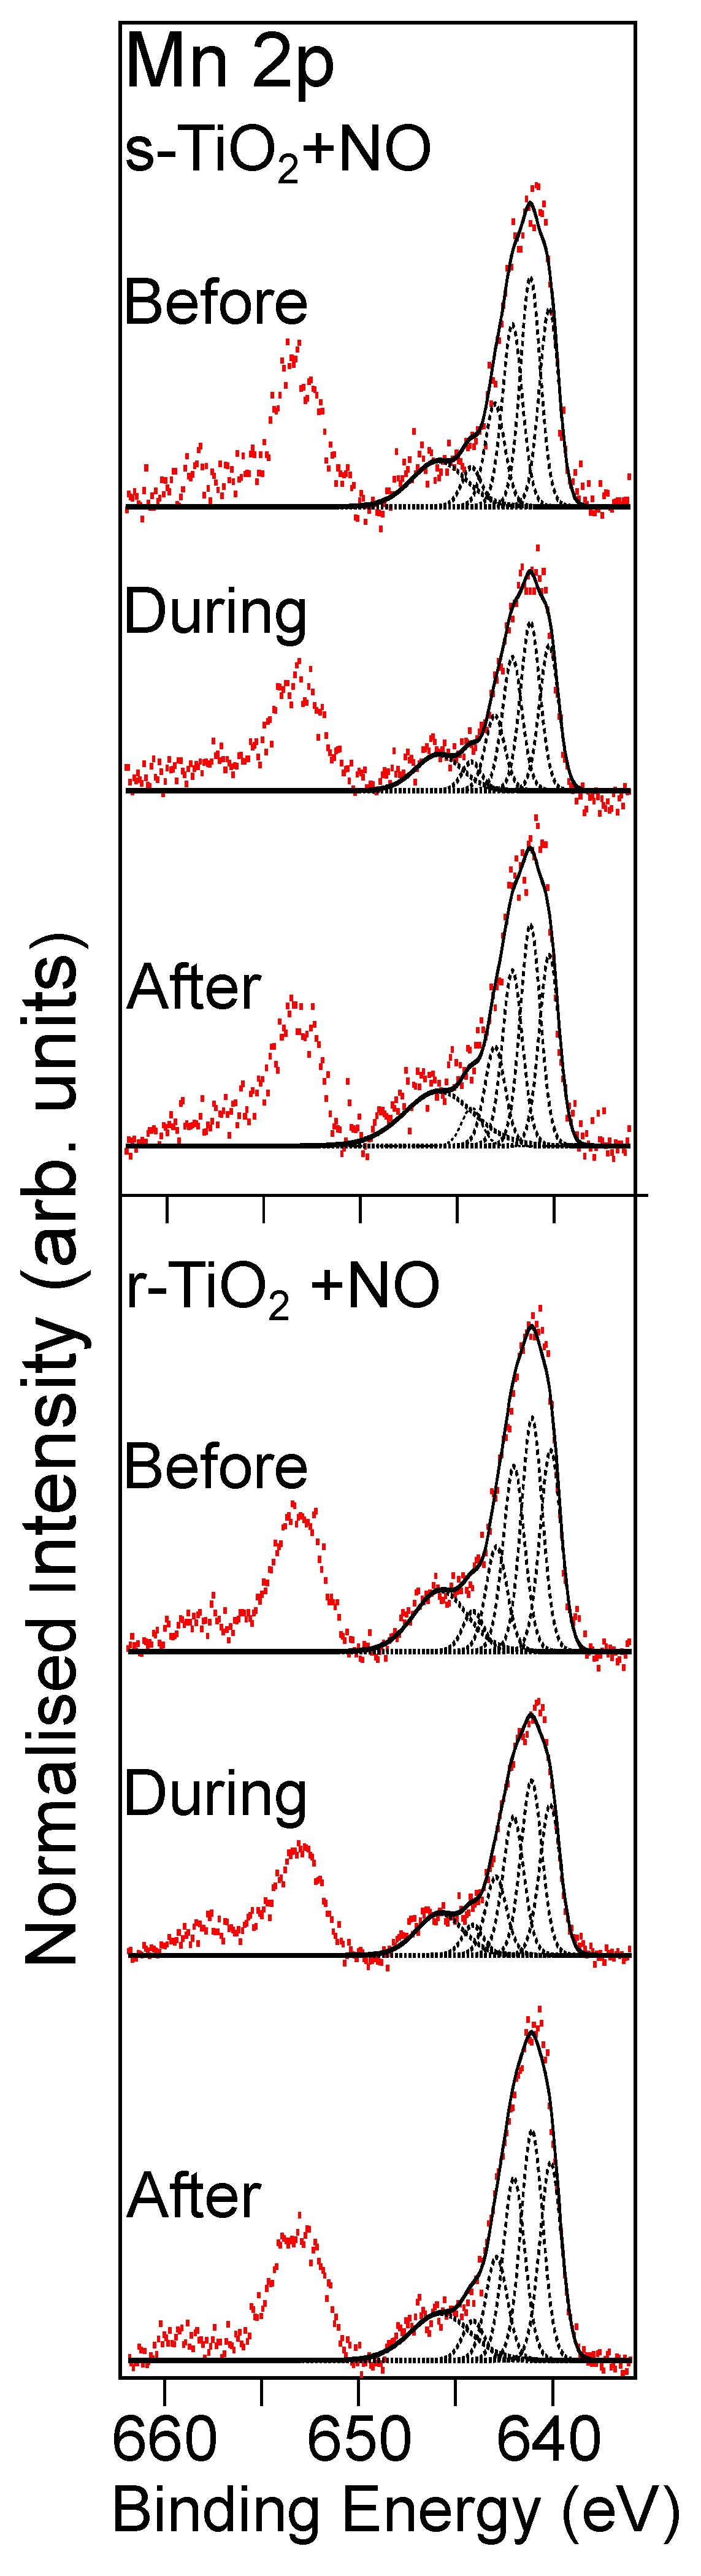
3.2.1. Reaction with NO Gas

We have shown that pollutant gas conversion can be induced by various treatments of rutile TiO2(110) single crystals. The single crystal studies above provide an idealised model for mechanistic studies and allow us to clearly identify surface species free from contamination and the complexity of powder samples. Here, we evaluate two different samples supplied by Croda Europe: Croda 1 is a TiO2 nanopowder, doped with Mn, and Croda 2 is undoped TiO2. This enables us to study the effect of Mn doping on the nanoparticle powders and their reaction with NO and SO2. Ti 2p XPS spectra for these samples show that the surfaces of the particles are largely free of Ti3+ (see Figure 5a). Based on the multiplet splitting and binding energy of the Mn 2p spectrum in Figure 5b, we deduce that the Mn at the surface is also in the form of MnO, similar to the single crystal case. Although the spectrum is rather noisy, a weak shake-up feature (at ~646 eV) can be observed, further supporting the presence of MnO at the surface [31].
Figure 6 shows N 1s spectra recorded during the reaction of NO with the Croda samples. The spectra for the two samples indicate that the N-containing components generated are the same in both samples. A peak related to the formation of NO3 at a binding energy of 407.5 eV is present for both samples, which remains when the background gas is removed, in agreement with the measurements on the single crystal surface discussed above. A feature at a BE of 400.4 eV not observed on the rutile single crystals exposed to NO is present on the Croda 1 powder samples that contain Mn. This peak can be assigned to adsorbed NO [29]. The absence of NO on the single crystal surfaces is not entirely surprising since it was reported that NO is only weakly adsorbed on rutile TiO2 surfaces [43]. The peak area of the NO3 relative to the Ti 2p3/2 peak for these two powder samples is higher than those in the case of the s-TiO2 crystals but slightly lower than for the r-TiO2(110) sample, as shown in Table 3. The improved performance of NO conversion provided by the powder samples may be due to an increased concentration of adsorbed hydroxides and water on the surface of the powder samples. It has been shown that the conversion of NO to NO3 results in the formation of HNO3 and NO3 species at the surface through reaction with water or surface OH [5], catalysed by UV light. Although no UV light was deliberately introduced into the system here, the cell was illuminated with an LED lamp to allow sample positioning, and absorption of X-rays will also result in the formation of the holes in the valence band which are required for the reaction to progress [5,29]. In order to investigate this further, the effect of exposing the powder to 1 mbar NO + 1 mbar H2O, simultaneously, was investigated. As can be seen in Table 3, for the undoped Croda 2 sample, the conversion rate in the presence of water is approximately the same as for NO gas alone. However, for the Mn-doped powder sample, there is a threefold increase in the amount of nitrate at the surface, accompanied by a doubling of the adsorbed NO species. Similarly to the single crystal studies, it was found that after the gas was evacuated from the cell, the nitrate and NO concentrations remained roughly constant relative to the Ti 2p, as shown in Table S5 of the SM.

3.2.2. Reaction with SO2/Ar Gas

SO2 reaction with the powder samples is also of interest for comparison with the rutile single crystal samples and with regard to catalyst poisoning. S 2p spectra obtained by exposing Croda 1 and Croda 2 to SO2 in Ar are shown in Figure 6c,d. In agreement with the results for the s-TiO2(110) single crystal surface, the main S 2p3/2 component at a binding energy of 168.4 eV is assigned to the formation of sulphate at the surface [39]. As in the case of the N 1s spectra for NO adsorption on the Croda samples, we also find S 2p components attributed to the presence of SO2(ads) with a S 2p3/2 BE of around 164.6 eV [37]. As shown in Table 4, below, the Mn doped Croda 1 powder results in more SO42− and more adsorbed SO2 on the surface. The presence of adsorbed NO and adsorbed SO2 is interesting since neither species was observed on the single crystal surfaces. It may be that the presence of adventitious hydrocarbons on the surface of the powders helps stabilise the adsorption of the gases or slow the reaction with the titania particles. An alternative explanation may lie in the fact that the powders are likely to contain more active sites, in the form of step edges where adsorption of the gases may occur preferentially, and this, coupled with a much larger surface area, may explain the stabilisation of adsorbed gases on the powders. It is also noted that the amount of adsorbed SO2 is lower on the undoped Croda 2 surface, which again suggests that MnO enhances the adsorption of SO2 on this surface in agreement with the results of the NO reaction.
Both powders contain a significant amount of sulphate on the surface following exposure to SO2 (see Table 4), but peaks corresponding to the formation of sulphite are not observed for either sample. In addition, no sulphide peaks are seen in the spectra recorded from the Mn-doped Croda 1 sample. On the stoichiometric TiO2 single crystal surface, only sulphate was observed, both with and without Mn doping. On the reduced surface, however, only sulphite was found to be present. Again, it is not surprising that sulphite is not observed in the spectra recorded from the powders, since the density of O-vacancies is low. It was argued above that for the heavily reduced TiO2(110) surface, missing oxygen atoms in the bridging oxygen rows are likely to lead to a lack of available sites for the adsorption of the SO2 to two O-atoms. It would be interesting to confirm this observation by examining the adsorption as a function of the degree of reduction in the TiO2(110) surface in order to clarify this observation. Since the powders were found to contain no Ti3+ it is likely that the surface is fully oxidised, which may explain why SO42− is formed preferentially on the powders. This suggests the adsorption capacity is limited by the adsorption sites on the TiO2 powder rather than the gas or the gas concentration. Again, the data show that the Mn-doped powder outperforms the undoped TiO2 in the total S uptake as well as the formation of SO42− showing that Mn doping leads to an increase in surface reactivity, in agreement with the single crystal studies.

4. Conclusions

In summary, this work has demonstrated the reaction between TiO2 single crystals and two commercial TiO2 powders, with toxic gases (NO and SO2). We clearly show that Ti3+ defects (O-vacancies) or Mn cations (MnO) can enhance the chemisorption of NO on rutile TiO2(110) single crystals. The reduced TiO2(110) surface containing Ti3+ combined with MnO exhibits a synergistic effect on the reaction of the NO and SO2 gases, significantly outperforming the undoped stoichiometric TiO2 by 6~10 fold. Upon exposure to NO, Ti3+ is oxidised to Ti4+ whilst the oxidation state of Mn (MnO) remains unchanged as a result of the reaction with the gases. SO2 on the other hand does not seem to readily react with the TiO2 surface to remove Ti3+ (O-vacancies). Here, Mn is required to promote the conversion of SO2 to S and lattice O.
NO and SO2 are also found to react with commercial powder samples, showing enhanced adsorption and reaction capacity provided by MnO in the presence of the gas. The surface species generated via reactions with the powders, however, are different to those on the single crystal surfaces in that they show a much higher concentration of fully oxidised N and S species and the presence of adsorbed gases. We also observe an increase in the amount of surface nitrate on the powders exposed to NO gas, when a small amount of water vapour is present, suggesting a reaction mechanism involving surface hydroxide, particularly since the conversion of NO to nitrite and nitrate is enhanced on the single crystal surfaces that contain a higher density of surface Ti-OH.

Supplementary Materials

The following supporting information can be downloaded at: https://www.mdpi.com/article/10.3390/surfaces7010003/s1, Figure S1: N 1s XPS spectrum of NO gas molecules during exposure to 1 mbar NO gas with the substrate was retracted from the analysis region. The two peaks arise from triplet/singlet splitting due to the paramagnetic electronic structure of NO; Table S1: N-components at the single crystal surface for the various surface treatments following exposure to NO gas and after 1 and 2 h. * N.D. = not detected; Figure S2: (a) N 1s NAP-XPS spectra of the Mn-doped defective rutile (110) single crystal during and 1 h and 2 h after exposure to 1 mbar to show the evolution of the NO-conversion by-products. (b) NO3 concentration for the stoichiometric (s-TiO2), reduced (r-TiO2) and Mn-doped stoichiometric single crystals over time showing little change over time and (c) NO3 and NO2 concentrations on the Mn-doped reduced TiO2 (Mn-r-TiO2) with time. It appears NO2 is converted to NO3− over time, although there is also a slight decrease in the overall N-concentration at the surface over time; Table S2: Ti3+:Ti4+ ratios for the various surface treatments during and after exposure to a SO2/Ar gas mixture. * Note that the Mn-doped r-TiO2 sample was heavily reduced and that the Ti3+ component is likely also to contain some other low oxidation states of Ti (i.e. Ti2+); Figure S3: Ti 2p spectra recorded from (a). stochiometric TiO2(110) with and without Mn doping before during and after exposure to SO2 in Ar gas, and (b) reduced TiO2(110) with and without Mn doping before during and after exposure to SO2 in Ar gas. (c). shows the variation in Ti3+ and Ti4+ peak areas for the two reduced surfaces from (b) indicating that there is only minimal change in Ti3+ removal in the reduced surface but that the Mn-doped surface leads to reoxidation of the TiO2 surface by the SO2/Ar gas mixture; Figure S4: The top panel shows the amount of SO32− and SO42− species found on stoichiometric (s-TiO2) and reduced (r-TiO2) single crystal TiO2(110) surfaces, along with the Mn-doped stoichiometric TiO2 surface (Mn s-TiO2) relative to the Ti 2p3/2 peak area. The lower panel shows the sulphur species for the Mn-doped reduced surface, where an additional feature for sulphide species is observed. The sulphide content remains constant and is accompanied by a decrease in Ti3+ as shown in Figure S3; Table S3: S-components at the single crystal surface for the various surface treatments following exposure to SO2 in Ar gas and after 1 and 2 h. * N.D. = not detected; Figure S5: Mn 2p spectra following deposition of Mn on stoichiometric TiO2(110) (top) and reduced TiO2(110) (bottom panel). Spectra are shown fitted with multiplet fitting for MnO (Mn2+) [32], before during and after exposure to SO2 gas. No significant changes are observed in the Mn 2p spectra. The spectra recorded from the r-TiO2 sample have a better signal to noise ratio, associated with the higher uptake of Mn on this surface (see main manuscript); Table S4: Contributions of different O-species to the O 1s spectra for the different sample treatments and samples. Peak assignments are taken from Jackman et al. [22] Binding energies for the different O-contributions are given in parentheses; Figure S6: O 1s spectra recorded from (a) single crystal samples s-TiO2, r-TiO2, s-TiO2+Mn and r-TiO2+Mn and (b) Croda 1 and Croda 2. Peak binding energies and assignments are in good agreement with those seen for water adsorption on anatase TiO2 [22]. Table S5: N and S concentrations on the two TiO2 nanopowders two hours after exposure to NO or SO2/Ar gas. Note that the effect of water on SO2 adsorption was not measured. The supplementary materials also show the method of calculation of the thickness of the Mn overlayers, using the method described by Briggs and Seah [44].

Author Contributions

Conceptualization, A.G.T. and R.S.; formal analysis, J.C.-R.K.; funding acquisition, R.S., J.P. and A.G.T.; investigation, A.G.T.; methodology, J.C.-R.K.; project administration, J.P.; supervision, A.G.T.; writing—original draft, J.C.-R.K.; writing—review and editing, A.G.T., R.S. and J.P. All authors have read and agreed to the published version of the manuscript.

Funding

This research was funded by EPSRC, Croda Europe, and The University of Manchester through the Impact Acceleration Scheme and Henry Royce Institute by way of access to the Near-Ambient Pressure XPS instrument funded by EPSRC grants EP/R00661X/1, EP/P025021/1, and EP/P025498/1.

Data Availability Statement

The raw, unfitted data for the XPS presented in this work are available for download from https://dx.doi.org/10.48420/24764433.

Acknowledgments

The authors also thank Sarayute Chansai, Conor Byrne, and Claudia Compean-Gonzalez for assistance with XPS measurements and technical aspects of the project.

Conflicts of Interest

The authors declare that the Impact Acceleration Scheme involves funding from both EPSRC and Croda Healthcare Europe. This funding was utilized to fund the postdoctoral researcher and cover facility access charges to the equipment used in the study. All data acquisition and analysis was carried out by A.G.T. and J.C.-R.K.; J.P. and R.S. are employed by Croda Europe. They did not contribute to analysis or interpretation of the data, but did contribute to checking of the manuscript drafts prior to submission.

References

  1. Jaroenworaluck, A.; Sunsaneeyametha, W.; Kosachan, N.; Stevens, R. Characteristics of Silica-Coated TiO2 and Its UV Absorption for Sunscreen Cosmetic Applications. Surf. Interface Anal. 2006, 38, 473–477. [Google Scholar] [CrossRef]
  2. Zinelis, S.; Silikas, N.; Thomas, A.; Syres, K.; Eliades, G. Surface Characterization of SLActive Dental Implants. Eur. J. Esthet. Dent. Off. J. Eur. Acad. Esthet. Dent. 2012, 7, 72–92. [Google Scholar]
  3. Thomas, A.; Syres, K. Adsorption of Organic Molecules on Rutile TiO2 and Anatase TiO2 Single Crystal Surfaces. Chem. Soc. Rev. 2012, 41, 4207–4217. [Google Scholar] [CrossRef]
  4. Morris, D.; Egdell, R.G. Application of V-Doped TiO2 as a Sensor for Detection of SO2. J. Mater. Chem. 2001, 11, 3207–3210. [Google Scholar] [CrossRef]
  5. Dalton, J.S.; Janes, P.A.; Jones, N.G.; Nicholson, J.A.; Hallam, K.R.; Allen, G.C. Photocatalytic Oxidation of NOx Gases Using TiO2: A Surface Spectroscopic Approach. Environ. Pollut. 2002, 120, 415–422. [Google Scholar] [CrossRef] [PubMed]
  6. Kampa, M.; Castanas, E. Human Health Effects of Air Pollution. Environ. Pollut. 2008, 151, 362–367. [Google Scholar] [CrossRef] [PubMed]
  7. Mancebo, S.E.; Wang, S.Q. Recognizing the Impact of Ambient Air Pollution on Skin Health. J. Eur. Acad. Dermatol. Venereol. 2015, 29, 2326–2332. [Google Scholar] [CrossRef]
  8. Cerza, F.; Renzi, M.; Gariazzo, C.; Davoli, M.; Michelozzi, P.; Forastiere, F.; Cesaroni, G. Long-Term Exposure to Air Pollution and Hospitalization for Dementia in the Rome Longitudinal Study. Environ. Health 2019, 18, 72. [Google Scholar] [CrossRef]
  9. Rosseler, O.; Sleiman, M.; Montesinos, V.N.; Shavorskiy, A.; Keller, V.; Keller, N.; Litter, M.I.; Bluhm, H.; Salmeron, M.; Destaillats, H. Chemistry of NOx on TiO2 Surfaces Studied by Ambient Pressure XPS: Products, Effect of UV Irradiation, Water, and Coadsorbed K+. J. Phys. Chem. Lett. 2013, 4, 536–541. [Google Scholar] [CrossRef]
  10. Ettireddy, P.R.; Ettireddy, N.; Mamedov, S.; Boolchand, P.; Smirniotis, P.G. Surface Characterization Studies of TiO2 Supported Manganese Oxide Catalysts for Low Temperature SCR of NO with NH3. Appl. Catal. B Environ. 2007, 76, 123–134. [Google Scholar] [CrossRef]
  11. Khlyustova, A.; Sirotkin, N.; Kusova, T.; Kraev, A.; Titov, V.; Agafonov, A. Doped TiO2: The Effect of Doping Elements on Photocatalytic Activity. Mater. Adv. 2020, 1, 1193–1201. [Google Scholar] [CrossRef]
  12. Janczarek, M.; Kowalska, E. Defective Dopant-Free TiO2 as an Efficient Visible Light-Active Photocatalyst. Catalysts 2021, 11, 978. [Google Scholar] [CrossRef]
  13. Fan, L.; Ichikuni, N.; Shimazu, S.; Uematsu, T. Preparation of Au/TiO2 Catalysts by Suspension Spray Reaction Method and Their Catalytic Property for CO Oxidation. Appl. Catal. A Gen. 2003, 246, 87–95. [Google Scholar] [CrossRef]
  14. Binas, V.D.; Sambani, K.; Maggos, T.; Katsanaki, A.; Kiriakidis, G. Synthesis and Photocatalytic Activity of Mn-Doped TiO2 Nanostructured Powders under UV and Visible Light. Appl. Catal. B Environ. 2012, 113–114, 79–86. [Google Scholar] [CrossRef]
  15. Nam, K.B.; Kwon, D.W.; Hong, S.C. DRIFT Study on Promotion Effects of Tungsten-Modified Mn/Ce/Ti Catalysts for the SCR Reaction at Low-Temperature. Appl. Catal. A Gen. 2017, 542, 55–62. [Google Scholar] [CrossRef]
  16. Jia, B.; Guo, J.; Luo, H.; Shu, S.; Fang, N.; Li, J. Study of NO Removal and Resistance to SO2 and H2O of MnOx/TiO2, MnOx/ZrO2 and MnOx/ZrO2–TiO2. Appl. Catal. A Gen. 2018, 553, 82–90. [Google Scholar] [CrossRef]
  17. Shayegan, Z.; Lee, C.-S.; Haghighat, F. TiO2 Photocatalyst for Removal of Volatile Organic Compounds in Gas Phase—A Review. Chem. Eng. J. 2018, 334, 2408–2439. [Google Scholar] [CrossRef]
  18. Venezia, A.M. X-Ray Photoelectron Spectroscopy (XPS) for Catalysts Characterization. Catal. Today 2003, 77, 359–370. [Google Scholar] [CrossRef]
  19. Zhong, L.; Chen, D.; Zafeiratos, S. A Mini Review of in Situ Near-Ambient Pressure XPS Studies on Non-Noble, Late Transition Metal Catalysts. Catal. Sci. Technol. 2019, 9, 3851–3867. [Google Scholar] [CrossRef]
  20. Wagstaffe, M.; Hussain, H.; Acres, M.J.; Jones, R.; Syres, K.L.; Thomas, A.G. Structure and Reactivity of a Model Oxide Supported Silver Nanocluster Catalyst Studied by Near Ambient Pressure X-ray Photoelectron Spectroscopy. J. Phys. Chem. C 2017, 121, 21383–21389. [Google Scholar] [CrossRef]
  21. Herranz, T.; Deng, X.; Cabot, A.; Alivisatos, P.; Liu, Z.; Soler-Illia, G.; Salmeron, M. Reactivity of Au Nanoparticles Supported over SiO2 and TiO2 Studied by Ambient Pressure Photoelectron Spectroscopy. Catal. Today 2009, 143, 158–166. [Google Scholar] [CrossRef]
  22. Jackman, M.J.; Thomas, A.G.; Muryn, C. Photoelectron Spectroscopy Study of Stoichiometric and Reduced Anatase TiO2(101) Surfaces: The Effect of Subsurface Defects on Water Adsorption at Near-Ambient Pressures. J. Phys. Chem. C 2015, 119, 13682–13690. [Google Scholar] [CrossRef]
  23. Chun-Ren Ke, J.; Walton, A.S.; Lewis, D.J.; Tedstone, A.; O’Brien, P.; Thomas, A.G.; Flavell, W.R. In Situ Investigation of Degradation at Organometal Halide Perovskite Surfaces by X-ray Photoelectron Spectroscopy at Realistic Water Vapour Pressure. Chem. Commun. 2017, 53, 5231–5234. [Google Scholar] [CrossRef] [PubMed]
  24. Diebold, U. The Surface Science of Titanium Dioxide. Surf. Sci. Rep. 2003, 48, 53–229. [Google Scholar] [CrossRef]
  25. Wendt, S.; Schaub, R.; Matthiesen, J.; Vestergaard, E.K.; Wahlstrom, E.; Rasmussen, M.D.; Thostrup, P.; Molina, L.M.; Laegsgaard, E.; Stensgaard, I.; et al. Oxygen Vacancies on TiO2(110) and Their Interaction with H2O and O2: A Combined High-Resolution STM and DFT Study. Surf. Sci. 2005, 598, 226–245. [Google Scholar] [CrossRef]
  26. Byrne, C.; Brennan, B.; McCoy, A.P.; Bogan, J.; Brady, A.; Hughes, G. In Situ XPS Chemical Analysis of MnSiO3 Copper Diffusion Barrier Layer Formation and Simultaneous Fabrication of Metal Oxide Semiconductor Electrical Test MOS Structures. ACS Appl. Mater. Interfaces 2016, 8, 2470–2477. [Google Scholar] [CrossRef]
  27. Smith, G.C. Evaluation of a Simple Correction for the Hydrocarbon Contamination Layer in Quantitative Surface Analysis by XPS. J. Electron Spectrosc. Relat. Phenom. 2005, 148, 21–28. [Google Scholar] [CrossRef]
  28. Fairley, N. CasaXPS Manual 2.3.15 Introduction to XPS and AES; Casa Software: Valencia, Spain, 2009. [Google Scholar]
  29. Gupta, V.K.; Balzaretti, F.; Guo, P.; Köppen, S.; Frauenheim, T.; Dominguez, A. NO Degradation on the Anatase TiO2 (001) Surface in the Presence of Water. J. Phys. Chem. C 2022, 126, 17544–17553. [Google Scholar] [CrossRef]
  30. Pang, C.L.; Lindsay, R.; Thornton, G. Chemical Reactions on Rutile TiO2(110). Chem. Soc. Rev. 2008, 37, 2328–2353. [Google Scholar] [CrossRef]
  31. Biesinger, M.C.; Payne, B.P.; Grosvenor, A.P.; Lau, L.W.M.; Gerson, A.R.; Smart, R.S.C. Resolving Surface Chemical States in XPS Analysis of First Row Transition Metals, Oxides and Hydroxides: Cr, Mn, Fe, Co and Ni. Appl. Surf. Sci. 2011, 257, 2717–2730. [Google Scholar] [CrossRef]
  32. Gupta, R.P.; Sen, S.K. Calculation of Multiplet Structure of Core p-Vacancy Levels. Phys. Rev. B 1974, 10, 71–77. [Google Scholar] [CrossRef]
  33. Gupta, R.P.; Sen, S.K. Calculation of Multiplet Structure of Core p-Vacancy Levels. II. Phys. Rev. B 1975, 12, 15–19. [Google Scholar] [CrossRef]
  34. Chen, D.A.; Bartelt, M.C.; Seutter, S.M.; McCarty, K.F. Small, Uniform, and Thermally Stable Silver Particles on TiO2(110)-(1×1). Surf. Sci. 2000, 464, L708–L714. [Google Scholar] [CrossRef]
  35. Jiang, B.Q.; Wu, Z.B.; Liu, Y.; Lee, S.C.; Ho, W.K. DRIFT Study of the SO2 Effect on Low-Temperature SCR Reaction over Fe−Mn/TiO2. J. Phys. Chem. C 2010, 114, 4961–4965. [Google Scholar] [CrossRef]
  36. Matsumoto, S.; Ikeda, Y.; Suzuki, H.; Ogai, M.; Miyoshi, N. NOx Storage-Reduction Catalyst for Automotive Exhaust with Improved Tolerance against Sulfur Poisoning. Appl. Catal. B Environ. 2000, 25, 115–124. [Google Scholar] [CrossRef]
  37. Turner, N.H.; Murday, J.S.; Ramaker, D.E. Quantitative Determination of Surface Composition of Sulfur Bearing Anion Mixtures by Auger Electron Spectroscopy. Anal. Chem. 1980, 52, 84–92. [Google Scholar] [CrossRef]
  38. Rodriguez, J.A.; Liu, G.; Jirsak, T.; Hrbek, J.; Chang, Z.; Dvorak, J.; Maiti, A. Activation of Gold on Titania: Adsorption and Reaction of SO2 on Au/TiO2(110). J. Am. Chem. Soc. 2002, 124, 5242–5250. [Google Scholar] [CrossRef]
  39. Sayago, D.I.; Serrano, P.; Böhme, O.; Goldoni, A.; Paolucci, G.; Román, E.; Martín-Gago, J.A. Adsorption and Desorption SO2 on the TiO2(110) Surface: A Photoemission Study. Phys. Rev. B 2001, 64, 205402. [Google Scholar] [CrossRef]
  40. Sayago, D.I.; Serrano, P.; Böhme, O.; Goldoni, A.; Paolucci, G.; Román, E.; Martín-Gago, J.A. A Photoemission Study of the SO2 Adsorption on TiO2 (110) Surfaces. Surf. Sci. 2001, 482–485, 9–14. [Google Scholar] [CrossRef]
  41. Sun, K.; Zhang, Q.; Bock, D.C.; Tong, X.; Su, D.; Marschilok, A.C.; Takeuchi, K.J.; Takeuchi, E.S.; Gan, H. Interaction of TiS2 and Sulfur in Li-S Battery System. J. Electrochem. Soc. 2017, 164, A1291. [Google Scholar] [CrossRef]
  42. Franzen, H.F.; Umaña, M.X.; McCreary, J.R.; Thorn, R.J. XPS Spectra of Some Transition Metal and Alkaline Earth Monochalcogenides. J. Solid State Chem. 1976, 18, 363–368. [Google Scholar] [CrossRef]
  43. Sorescu, D.C.; Rusu, C.N.; Yates, J.T. Adsorption of NO on the TiO2(110) Surface:  An Experimental and Theoretical Study. J. Phys. Chem. B 2000, 104, 4408–4417. [Google Scholar] [CrossRef]
  44. Briggs, D.; Seah, M.P. Practical Surface Analysis: Auger and Photoelectron Spectroscopy, 2nd ed.; John Wiley and Sons: Chichester, UK, 1990. [Google Scholar]
Figure 1. XPS spectra of (a) Ti 2p, (b) N 1s core levels recorded from a cleaned, undoped, s–TiO2(110) rutile single crystal before/during/after exposure to 1 mbar NO gas and (c) Ti 2p, and (d) N 1s core levels recorded from a cleaned, undoped, r–TiO2(110) rutile single crystal before/during/after exposure to 1 mbar NO gas. Spectra are normalised to the corresponding Ti 2p spectra.
Surfaces 07 00003 g001
Figure 2. Mn 2p spectra recorded from the Mn–doped TiO2(110) single crystal samples exposed to NO gas. The top three spectra show the spectra of Mn–doped s–TiO2, before, during, and after exposure to NO, and the bottom three are the corresponding Mn 2p spectra recorded from the Mn-doped r–TiO2 sample. The dotted lines are fits consistent with the multiplet splitting of MnO and fitted using the constraints suggested by Biesinger et al. [27], the solid black lines are the fits to the 2p3/2 components of the spectra (i.e. the sum of the dotted lines) and the red dots are the experimental data. Spectra are normalised to the corresponding Ti 2p spectra shown in Figure 3.
Surfaces 07 00003 g002
Figure 3. XPS spectra following the deposition of Mn on the stoichiometric and reduced TiO2(110) surfaces. (a) Ti 2p before, during, and after exposure to NO gas, (b) N 1s spectra for the Mn–s–TiO2 surface, (c) Ti 2p recorded from the Mn–r–TiO2 surface, and (d) N 1s for the Mn–r–TiO2 surface. Spectra are normalised to the corresponding Ti 2p spectra, and only the Ti 2p3/2 components are fitted in the Ti 2p spectra.
Surfaces 07 00003 g003
Figure 4. S 2p XPS spectra of (a) the undoped s–TiO2, (b) r–TiO2(110) single crystals, (c) Mn–doped s–TiO2, and (d) Mn–doped r–TiO2(110) single crystals before/during/after exposure to 1.5 mbar SO2 gas (1% in Ar). All spectra are normalised to corresponding Ti 2p spectra (not shown). For the reduced Mn-doped sample, a peak due to a surface sulphide is observed.
Surfaces 07 00003 g004
Figure 5. (a) Ti 2p XPS spectra of Croda 1 and Croda 2 (before exposure), and (b) Mn 2p XPS spectra of Croda 1 powder. For the Mn 2p spectrum, black dots are raw data, black dashed lines are the multiplet splittings of Mn according to Biesinger et al. [27] and solid black lines are the fits to the 2p3/2 components of the spectra (i.e. the sum of the dotted lines).
Surfaces 07 00003 g005
Figure 6. XPS spectra of Croda powders upon and after exposure to NO and SO2/Ar gases. (a) Croda 1 (Mn–doped) and (b) Croda 2 (undoped) samples before/during/after exposure to 1 mbar NO gas. Corresponding S 2p spectra recorded from Croda 1 and Croda 2 exposed to SO2/Ar are shown in (c) and (d), respectively.
Surfaces 07 00003 g006
Table 1. Concentrations of the adsorbed nitrogen-containing species (total Nads, NO3, and NO2) obtained from the N 1s XPS spectra relative to Ti (from the Ti 2p XPS spectra—i.e., N/Ti, NOx/Ti) during NO exposure. Total N is the sum of all the nitrogen-containing species. * N.D. = not detected.
SampleTotal NadsNO3NO2
s-TiO2(110)0.03 ± 0.010.03 ± 0.01N.D. *
r-TiO2(110)0.08 ± 0.020.08 ± 0.02N.D.
Mn-doped s-TiO2(110)0.06 ± 0.020.06 ± 0.01N.D.
Mn-doped r-TiO2(110)0.41 ± 0.050.16 ± 0.020.25 ± 0.05
Table 2. Concentrations of the sulphur-containing species (total S, SO42−, SO32−, and sulphide) obtained from the S 2p3/2 XPS spectra relative to Ti (from the Ti 2p3/2 XPS spectra—i.e., S/Ti, SOx/Ti) during SO2 exposure. The total S is the sum of all the sulphur-containing species.
SampleTotal SSO42−SO32−Sulphide
s-TiO2(110)0.08 ± 0.020.04 ± 0.010.04 ± 0.010.00 ± 0.01
r-TiO2(110)0.08 ± 0.010.00 ± 0.010.08 ± 0.010.00 ± 0.01
Mn-doped s-TiO2(110)0.09 ± 0.020.03 ± 0.010.06 ± 0.010.00 ± 0.01
Mn-doped r-TiO2(110)0.40 ± 0.050.06 ± 0.010.25 ± 0.050.09 ± 0.01
Table 3. Concentrations of the nitrogen-containing species (total N, NO3, NOads) obtained from the N 1s XPS spectra relative to Ti (from the Ti 2p XPS spectra—i.e., N/Ti, NOx/Ti) during NO exposure. The total N is the sum of all the nitrogen-containing species.
SampleTotal NNO3NOads
Croda 10.35 ± 0.020.20 ± 0.010.15 ± 0.01
Croda 1 + H2O0.99 ± 0.050.60 ± 0.050.39 ± 0.02
Croda 20.33 ± 0.020.23 ± 0.010.10 ± 0.01
Croda 2 + H2O0.35 ± 0.010.18 ± 0.010.17 ± 0.01
Table 4. Ratios/concentrations of the sulphur-containing species (total S, SO42−, and SO2 ads) obtained from the S 2p XPS spectra relative to Ti (from the Ti 2p XPS spectra—i.e., S/Ti, SOx/Ti) during SO2 exposure. Total S is the sum of all the sulphur-containing species.
SampleTotal SSO42−SO2 ads
Croda 10.49 ± 0.010.36 ± 0.010.13 ± 0.01
Croda 20.28 ± 0.010.23 ± 0.010.05 ± 0.01
Disclaimer/Publisher’s Note: The statements, opinions and data contained in all publications are solely those of the individual author(s) and contributor(s) and not of MDPI and/or the editor(s). MDPI and/or the editor(s) disclaim responsibility for any injury to people or property resulting from any ideas, methods, instructions or products referred to in the content.

