Abstract
The development of biodegradable Zn-based alloys for implants that effectively mimic the functionality of native bone throughout the healing process is a multifaceted challenge; this is particularly evident in the task of achieving appropriate corrosion rates. This work explores the incorporation of 0.5wt.%Mn into a Zn−1wt.%Mg alloy, with focus on the relationship between corrosion behavior and microstructure. Electrochemical corrosion tests were carried out in a 0.06 M NaCl solution using as-solidified samples with two distinct microstructural length scales. Mn addition was found to induce significant electrochemical active behavior. Localized corrosion was predominant in interdendritic regions, with the ternary alloy exhibiting a higher susceptibility. For both alloys, the coarsening of the microstructure promoted a slight inclination to accelerate the corrosion rates in both biodegradable Zn alloys. The corrosion rate showed an increase of about nine-times with Mn addition for coarser eutectic spacings, while for finer ones, the increase was by about 22 times.
1. Introduction
Inspired by nature, biomimetic implants can be used in biomedical applications, assuming diverse forms [1]. The development of alloys specifically for biomedical purposes is a relatively new field of study [2]. Zn-based alloys have gained attention for use in bio-absorbable implants due to their exceptional biocompatibility, appropriate in vivo corrosion behavior, and suitable mechanical properties. However, some commercially available Zn alloys contain elements that raise biosafety concerns [3,4]—particularly the ZA and Zamak series, which often contain significant amounts of Al. The presence of Al in these alloys can have adverse effects on human health [5], as it has been linked to Alzheimer’s disease [6,7]. To ensure human health safety, a preferred approach for designing biodegradable alloys is to combine high-purity Zn with elements known to be biocompatible and essential for biological functions in the human body [8].
Another important point to consider is that Zn-based alloys go through solidification during the traditional and advanced processing techniques used to manufacture biodegradable components with different sizes and shapes [9,10]. The as-cast alloy serves as the raw material for the further mechanical working needed to shape the Zn-based alloys into specific biodegradable medical devices [11,12]. For example, thin-walled cylindrical tubes are required for stents, whereas solid cylindrical rods and flat plates are required by bone fixation screws and plates, respectively [12]. In all these cases, significant cost savings could be achieved by better planning of the casting process, as it directly affects the microstructure formation during solidification and hence may improve the alloy’s mechanical and electrochemical properties. Therefore, besides involving an appropriate selection of alloying elements, the optimized design of Zn bio-absorbable alloys also presumes an in-depth understanding of how different solidification thermal conditions may affect the microstructure evolution and, consequently, the alloy’s resulting properties.
Aside from their superior mechanical performance, a key advantage of Zn-Mg alloys is their ability to form biocompatible corrosion layers [13]. According to Vojtěch et al. [14], the as-cast state of these alloys exhibits higher ultimate tensile strength (UTS) and hardness due to having a refined structure consisting of primary α-Zn dendrites surrounded by a eutectic mixture of Mg2Zn11 intermetallic compounds (IMCs) + α-Zn. Vida et al. [15] also demonstrated that the refinement of a competitive mixture of stable (α-Zn + Mg2Zn11 particles) and metastable (α-Zn + Zn2Mg IMCs) eutectic constituents enhances the UTS and elongation at fracture in a Zn−2.2wt.%Mg alloy.
Unlike the mechanical behavior, which generally improves with microstructural refinement, the corrosion resistance does not follow a definitive trend, as it depends on the electrochemical characteristics of the microstructural phases and can be influenced by the aggressiveness of the corrosive environment. Prosek et al. [16], based on the corrosion mechanisms of Zn-(1–32wt.%)Mg alloys in atmospheric conditions, proposed that the initial formation of Mg-based oxide films on the surface of Mg2Zn11 and Zn2Mg IMCs is the main factor in reducing the corrosion rate. Zn-Mg IMCs exhibit different electrochemical characteristics compared to that of a Zn-rich matrix [17]. Therefore, investigating the role of these IMCs in the corrosion properties of Zn-based alloys, considering different microstructural length scales, is of great importance in the field of metallic biomaterials.
When designing Zn-Mg alloys for controlled degradation in biomedical applications, the focus is not only on improving mechanical performance but also on managing corrosion rates [18,19]. While the addition of strategic alloying elements, including Mn, to Zn-Mg alloys has been extensively studied for the evaluation of alloy mechanical properties [20,21,22], limited investigations have explored the underlying mechanisms that affect microstructure evolution and corrosion behaviors. Liu et al. [23] proposed that reductions in corrosion potentials and increases in corrosion current densities can be attributed to the formation of galvanic micro-cells between Zn and Zn2Mg or Zn and Mn, after alloying pure Zn with Mg and Mn. Huang et al. [24], using transmission electron microscopy (TEM), demonstrated the presence of both Zn2Mg and MnZn13 intermetallic compounds (IMCs) in the microstructure of a Zn–Mg–Mn alloy, both in the as-cast state and after equal channel angular pressing (ECAP).
Analyzing the corrosion performance of Zn-(1 to 3wt.%)Mg alloys solidified in a permanent mold, Krieg et al. [25] noticed the following corrosion phenomena: surface activation, active corrosion, and passivation by corrosion products. These authors suggest that in alloys with low Mg content, the passivation stage is directly influenced by a finer microstructure, where the refinement of the microstructural length scale plays a crucial role in increasing the corrosion kinetics. In contrast, Vida et al. [15] state that for directionally solidified Zn-(0.3 and 0.5wt.%)Mg alloys exposed to a 0.06 M NaCl solution, coarser microstructures resulting from lower solidification cooling rates contribute to higher corrosion rates compared to refined microstructures.
With the above considerations in mind, the main objective of this study is to investigate the impact of the microstructural length scale on the electrochemical corrosion behavior of Zn−1wt.%Mg and Zn−1wt.%Mg−0.5wt.%Mn bio-absorbable alloys. It is worth noting that the thermal parameters, microstructure evolution, and hardness of these alloys were previously characterized [26]. In this work, Zn–Mg(–Mn) alloy samples with distinct microstructural length scales were selected for investigation. Subsequently, potentiodynamic polarization and electrochemical impedance spectroscopy tests were conducted to assess corrosion features.
2. Materials and Methods
The alloys under investigation—namely. Zn−1Mg and Zn−1Mg−0.5Mn [wt.%]—were prepared using commercial purity metals, with their respective chemical compositions listed in Table 1. The experimental procedure involved placing weighed pieces of Zn into a SiC crucible, which was then placed inside a muffle furnace set at 600 °C. Once the Zn was completely melted, the other alloying elements (Mg and Mn) were added to the molten bath and mechanically homogenized. Subsequently, the liquid material was poured into an AISI 301 stainless-steel cylindrical mold, with an internal diameter of 55 mm and a height of 150 mm. This mold had been previously positioned within the casting chamber of a directional solidification apparatus, which was equipped with a water-cooled system at its bottom. Figure 1 illustrates an overview of the experimental methodology.

Table 1.
Chemical compositions [wt.%] of the metals used to prepare the Zn-based alloys.
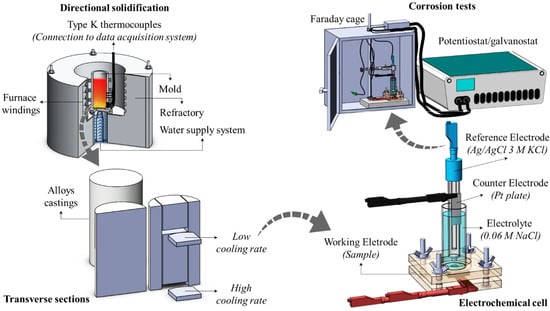
Figure 1.
Schematic representation of the experimental methodology.
Using type-K thermocouples (0.2 mm wires) connected to a Lynx data acquisition system, real-time temperature monitoring was conducted at various regions of the casting, from the cooled bottom to the top. Immediately after the thermocouple closest to the mold bottom reached a melt superheat of 10% in relation to the liquidus temperature, the electrical resistance was deactivated, and the cooling system was activated to initiate directional solidification. It is worth noting that the temperature–time data obtained during the upward growth of the sample were utilized to determine the solidification thermal parameters, including cooling rates and growth rates, as reported in previous studies [26,27].
Different cooling regimes were achieved along the length of the directionally solidified casting. Consequently, specific transverse sections were selected from each resulting casting at 5 and 70 mm from the cooled interface. These sections were extracted and used as working electrodes for electrochemical corrosion testing. By utilizing samples from these positions, the corrosion behavior of each investigated alloy could be assessed considering two distinct microstructural length scales. The samples extracted at 5 mm (P_5) represented a refined microstructure resulting from relatively higher solidification cooling rates, while the samples extracted at 70 mm (P_70) represented a coarse microstructure resulting from lower cooling rates.
Prior to the corrosion tests, a comprehensive characterization was performed using various techniques. Optical microscopy (Olympus GX41) and scanning electron microscopy (SEM) coupled with energy dispersive spectrometer (EDS; ZEISS-EVO-MA15) analyses were conducted. The microstructures were observed through metallographic preparation, involving sanding with 100- to 1200-grit SiC papers, polishing with 6- to 0.25-µm diamond pastes, and chemical etching with a 10% Nital acid solution for 7 s. Quantitative characterization was also performed, following the procedures described in previous articles [26,27].
Electrochemical impedance spectroscopy (EIS) and potentiodynamic polarization (POL) experiments were conducted using a three-electrode electrochemical cell configuration. The cell consisted of an Ag/AgCl reference electrode (3 M KCl), a Pl plate counter electrode, and the Zn alloy sample under investigation—used as the working electrode—as depicted in Figure 1. Prior to electrochemical testing, the specimens were prepared through metallographic procedures, just like those used for the microstructural characterization. However, no chemical etching was performed. The corrosion tests were then performed in triplicate using a potentiostat/galvanostat Autolab PGSTAT128N.
All the electrochemical tests were conducted at room temperature (25 ± 2 °C) in a 0.06 M NaCl solution. The main reason for choosing this diluted saline solution instead of the standard 0.5 M was the fact that electrolytes with higher concentrations may inhibit the microstructure response due to their aggressiveness. By using a diluted NaCl solution—approximately 10 times less concentrated—the corrosion resistance trend could be effectively assessed [28]. The circular area of the working electrode, which was exposed to the electrolyte solution, had a surface area of 0.503 cm2 and was prepared with a 1 μm diamond paste finish. Additionally, an Autolab Faraday cage was utilized to shield the tests from any electromagnetic interference originating from external sources.
In the EIS analysis, an initial standard time of 900 s at the open circuit potential was utilized. Subsequently, EIS measurements were taken at different time intervals (0, 18, 24, and 72 h) using a frequency range from 100 mHz to 100 kHz and an AC signal amplitude of 10 mV (10 points per decade). The obtained EIS data were used to simulate an equivalent circuit model using the Nova 2.1 software(NOVA software version 2.1.6 from Metrohm AG (Herisau/Switzerland)). For the potentiodynamic polarization (POL) analysis, a scan rate of 0.16 mV s−1 was employed. The resulting current density (i) versus potential (E) graphs enabled the calculation of both the corrosion potential (Ecorr) and corrosion current density (icorr) through Tafel extrapolation. Lastly, SEM/EDS analysis was conducted on the samples’ surface after the corrosion tests.
3. Results
3.1. Microsstructure
To provide more details of the as-solidified microstructures, Figure 2 displays characteristic optical and SEM images of the cross-sections of the DS castings for the Zn−1Mg and Zn−1Mg−0.5Mn [wt.%] alloys at positions 5 and 70 mm from the metal/mold interface.
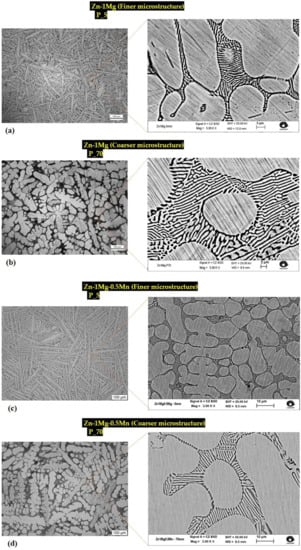
Figure 2.
Micrographs of Zn−1wt%Mg alloy (a) P_5, (b) P_70; and Zn−1wt%Mg−0.5wt%Mn alloy (c) P_5, (d) P_70.
These positions—denoted as P_5 and P_70, represent refined and coarse microstructures, respectively. As expected, the coarsening of the microstructure towards the inner part of the DS casting was a result of cooling attenuation. The cooling rate for P_5 was approximately 18 °C/s, while for P_70, it was around 2 °C/s. Preceding studies [26,27] have documented that both alloys are primarily composed of dendrites of the η-Zn phase, while the interdendritic areas consist of a complex eutectic mixture comprising stable Zn + Mg2Zn11 and metastable Zn + MgZn2. In addition, the interdendritic regions of the ternary alloy exhibited the presence of MnZn9 particles, along with a eutectic mixture displaying a spiral lamellae morphology. Comparatively, the Zn−1Mg alloy (Figure 2a,b) demonstrated a larger eutectic mixture size than that of the Zn−1Mg−0.5Mn alloy (Figure 2c,d). The average eutectic spacing (λeut) at positions P_5 and P_70 was found to be 0.66 μm and 1.15 μm for Zn−1Mg, and 0.54 μm and 1.01 μm for Zn−1Mg−0.5Mn, respectively. More information on the dendrite and eutectic spacings of Zn−1Mg and Zn−1Mg−0.5Mn alloys can be seen in previous research [26]. It is worth noting that the corrosion tests were conducted using samples extracted from P_5 and P_70. This approach allowed the corrosion analysis to consider a significant shift in the microstructural length scale, approximately doubling the scale, for both alloys.
3.2. Electrochemical Corrosion Measurements
3.2.1. Electrochemical Impedance Spectroscopy (EIS)
The EIS measurements of the studied alloys in a 0.06 M NaCl solution are here interpreted using Nyquist plots and Bode diagrams. The analyses were conducted at t = 0 h using two samples extracted from two different regions of the DS casting: P_5 and P_70. This approach enabled the corrosion analysis to consider a significant change in the microstructural length scale, roughly doubling the eutectic spacing (λeut) from ~0.6 to ~1.1 μm for both alloys. These two extreme values of average eutectic mixture sizes corresponded to solidification cooling rates of approximately 18 and 2 °C/s, respectively—as precisely described in a previous study [26]. Furthermore, EIS measurements were conducted on the samples from P_5 (which will demonstrate higher corrosion resistance), with additional immersion times of 18, 24, and 72 h in the same 0.06 M NaCl solution.
The EIS measurements for the immersion time of 0 h are shown in Figure 3 for both alloys, considering the samples from P_5 and P_70. The Nyquist plots are presented in Figure 3a,b, while the Bode and Bode-phase diagrams are displayed in Figure 3c,d. The Nyquist diagrams of both samples exhibit two capacitive semicircles at high and low frequencies, as well as an inductive process at low frequencies. The semicircles related to the Zn−1Mg alloy have wider diameters compared to those of the Zn−1Mg−0.5Mn, indicating a slower electrochemical process for the ternary alloy. This suggests a higher corrosion resistance or the formation of a protective layer for the Zn−1Mg alloy under both microstructural conditions: finer and coarser.
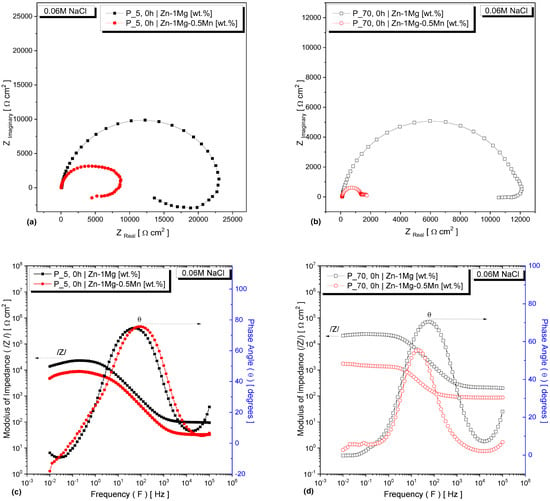
Figure 3.
EIS results for the Zn−1Mg(−0.5Mn) alloys: Nyquist plots for samples from (a) P_5 and (b) P_70; Bode and Bode-phase diagrams for samples from (c) P_5 and (d) P_70.
Figure 3c,d shows the Bode and Bode phase diagrams for the samples extracted from the P_5 and P_70 positions of the analyzed alloys in the frequency range of 10−2 Hz to 100 Hz. It is demonstrated that the Zn−1Mg alloy displayed an increasing |Z| with higher frequencies. The corresponding values were |Z| = 8.5 kΩ cm2 for P_5 and |Z| = 21.6 kΩ cm2 for P_70, respectively. A similar trend was observed for the maximum phase angle for the two analyzed alloys—particularly in the case of the finer microstructure. However, notable differences in phase angle values emerged between the alloys for the coarser microstructure. The Zn−1Mg alloy with the coarsest sample demonstrated a maximum phase angle (θ) of approximately 71°, while the Zn−1Mg−0.5Mn alloy exhibited a maximum θ of around 56°. Based on these comparative and qualitative observations, it can be concluded that the Zn−1Mg alloy with the finer microstructure exhibited an enhanced electrochemical corrosion resistance. In other words, these results suggest that the incorporation of Mn can potentially enhance the degradation of the alloy.
Figure 4 and Figure 5 depict the EIS results of the alloys, specifically focusing on sample P_5, after being immersed in a 0.06 M NaCl solution for various time intervals. The Bode diagrams reveal that the impedance modulus initially exhibited higher values at the beginning of immersion, indicating a greater resistance to corrosion. For samples immersed for 0 h, there was only one distinct peak in the phase angle. Moreover, in the low-frequency range, the observed phase angles were close to zero, indicating that the occurring phenomena had a purely resistive contribution. This can be affirmed, as phase angles equal to or close to 0° indicate the presence of resistors as circuit elements, while angles equal to or close to 90° refer to capacitive components [29,30,31]. However, as the immersion time increased to 18, 24, and 72 h, a second peak emerged—indicating the occurrence of additional electrochemical processes during the corrosion process. This observation can be observed in Figure 4a and Figure 5a. Moreover, the phenomenon of the changing phase angles was further reflected in the Bode and Bode-phase diagrams, as shown in Figure 4b and Figure 5b.
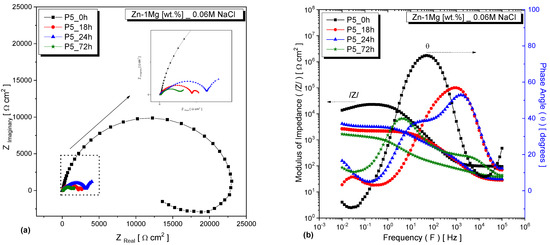
Figure 4.
EIS plots for the Zn−1Mg alloy, sample from P_5, under different immersion times: (a) Nyquist plots and (b) Bode and Bode-phase diagrams.
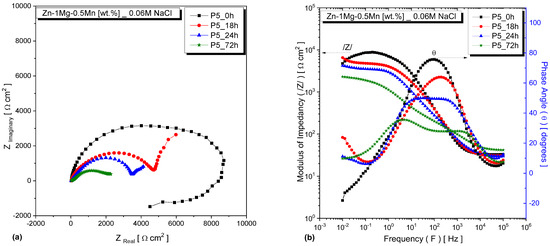
Figure 5.
EIS plots for the Zn−1Mg−0.5Mn alloy, sample from P_5, under different immersion times: (a) Nyquist plots and (b) Bode and Bode-phase diagrams.
The SEM images in Figure 6 and Figure 7 illustrate the cross-sections of the Zn−1Mg and Zn−1Mg−0.5Mn alloy EIS test in a 0.06M NaCl solution. These images were obtained through energy-dispersive X-ray spectroscopy (EDS) analysis.
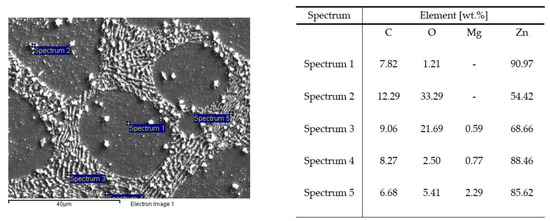
Figure 6.
SEM-EDS analysis of the Zn−1Mg alloy after EIS measurement in 0.06 M NaCl solution.
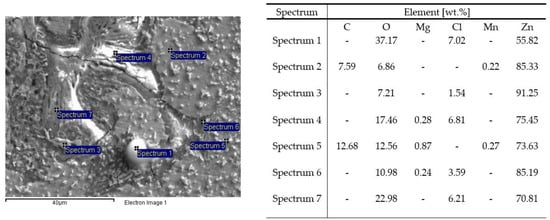
Figure 7.
SEM-EDS analysis of the Zn−1Mg−0.5Mn alloy after EIS measurement in 0.06 M NaCl solution.
3.2.2. Potentiodynamic Polarization
The corrosion resistance of the studied alloys was evaluated in a 0.06 M NaCl solution using potentiodynamic polarization tests. Figure 8a,b presents the characteristic potentiodynamic polarization curves for the samples extracted from positions P_5 and P_70 of each alloy’s DS casting, respectively. Tafel’s extrapolation method was employed to determine the corrosion potential (Ecorr) and corrosion current density (icorr). Overall, the addition of 0.5wt.%Mn led to a shift in the corrosion potential of the Zn−1Mg alloy towards the less noble direction and an increase in the current density. Furthermore, for both alloys, it was observed that microstructure length scale influenced their corrosion characteristics. For both alloys, finer microstructures tended to favor higher corrosion resistance. For finer microstructures (Figure 8a), the Zn−1Mg−0.5Mn alloy showed a corrosion potential shifted towards the less noble side (approximately −1005 mV), while the average corrosion potentials of the Zn−1Mg alloy were around −911 mV. The current density of the Zn−1Mg−0.5Mn alloy was higher compared to the other alloy. In the case of the coarser microstructures (Figure 8b), the corrosion potential of the Zn−1Mg−0.5Mn alloy was approximately −1009 mV, while the corrosion potential of the Zn−1Mg alloy was −932 mV. Additionally, the Zn−1Mg−0.5Mn alloy exhibited a higher current density.
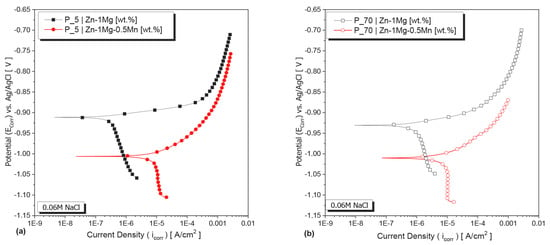
Figure 8.
Typical potentiodynamic polarization curves of the Zn−1Mg(−0.5Mn) alloys in a 0.06 M NaCl solution using samples from (a) P_5 and (b) P_70.
Another important corrosion parameter employed here to evaluate the corrosion behavior of the Zn−1 Mg(−0.5 Mn) alloys is the corrosion rate (CRy), which quantifies the rate of material corrosion in terms of penetration depth per unit time (expressed in µm/year). The calculation of CRy values follows the ASTM G102-89 (2015) standard [32] and is determined using the equation:
where CRy is the corrosion rate (µm/year), K1 = 3.27 × 10⁻³ mm g/(μA cm year), icorr is the corrosion current density (μA/cm2), ρ is the density of the alloy (g/cm3). EW is the alloy equivalent weight, ni is the valence of the ith element of the alloy, fi is the mass fraction of the ith element in the alloy, and Wi is the atomic weight of the ith element in the alloy.
The summarized data on Ecorr, icorr, and CRy can be found in Table 2. Notably, Ecorr values indicated relatively more active corrosion for the coarser microstructure in all analyzed alloys. Overall, the addition of 0.5wt.%Mn significantly increased the CRy of the Zn−1Mg alloy. Based on comparison of icorr, it can be concluded that the Zn−1Mg−0.5Mn alloy exhibited a more active corrosion behavior—demonstrated by its consistently high corrosion rate in both positions (P_5 and P_70). Corrosion rate showed around a ninefold increase with Mn addition for coarser eutectic spacings and an approximately ~22-times increase for finer ones. Specifically, the Zn−1Mg−0.5Mn alloy sample from the P_70 exhibited the highest degradation rate—CRy—at 117 μm/year, while Zn−1Mg at position P_5 showed the lowest CRy.

Table 2.
Summary of experimental results including solidification cooling rates (TR), microstructural parameters (secondary dendrite arm spacing—λ2 and eutectic spacing—λeut), corrosion potential (Ecorr), corrosion current density (icorr), and corrosion rate (CRy) of the analyzed alloys.
Figure 9 displays SEM images of the cross sections of the Zn−1Mg and Zn−1Mg−0.5Mn alloys after immersion in a 0.06 M NaCl solution and subsequent EIS and potentiodynamic polarization measurements. Surface analysis revealed that the Zn−1Mg−0.5Mn alloy exhibited the most significant corrosion attack among the investigated alloys. Overall, the ternary alloy exhibited a higher susceptibility to localized corrosion, which was predominant in the interdendritic regions of both studied alloys.
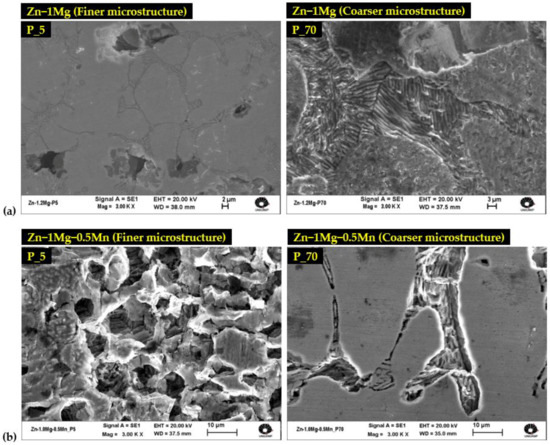
Figure 9.
SEM images of the alloys (a) Zn−1Mg and (b) Zn−1Mg−0.5Mn after potentiodynamic polarization measurements in a 0.06 M NaCl solution.
4. Conclusions
Based on the findings and discussion of this work, the following conclusions can be drawn:
- The biodegradable Zn−1Mg−0.5Mn alloy exhibits higher susceptibility to corrosion compared to that of the binary Zn−1Mg alloy, indicating that 0.5wt.%Mn addition induces significant electrochemical active behavior in the Zn−1Mg alloy, making it more susceptible to corrosion.
- Certain areas of the biodegradable Zn−1Mg(−0.5Mn) alloys—specifically the regions between dendrites—are more prone to corrosion than others. These localized corrosion sites may be areas of higher vulnerability due to the phases contained in it.
- Corrosion rates tends to increase with the coarsening of the microstructure for both biodegradable Zn−1Mg(−0.5Mn) alloys, with the corrosion rate showing an around nine-times increase with Mn addition for coarser eutectic spacings and by approximately 22 times for finer eutectic spacings.
- The addition of 0.5wt.%Mn to the Zn−1Mg alloy significantly increased its CRy value; this means that the alloy will degrade more rapidly in a physiological environment. This is a desirable property for bio-absorbable biomaterials since this allows for more precise control over the time period over which the material is resorbed by the body. For example, an implant made from this alloy could be designed to degrade over a period of months or years, depending on the specific needs of each patient.
Author Contributions
Conceptualization, T.V., N.C., C.B. and A.G.; methodology, T.V., C.C. and C.B.; validation, T.V., C.C., A.B. and C.B.; formal analysis, T.V., C.C., A.B., N.C. and C.C.; resources, N.C., and A.G.; data curation, T.V.; writing—original draft preparation, T.V., A.B., N.C. and C.B.; writing—review and editing, N.C., C.B. and A.G.; supervision, A.G.; project administration, T.V. and A.G.; funding acquisition, A.G. All authors have read and agreed to the published version of the manuscript.
Funding
FAPESP—São Paulo Research Foundation, Brazil (Grants: 2014/50502-5; 2021/11439-0; 2022/15696-0); FAPEAM—Amazonas State Research Support Foundation; CNPq—National Council for Scientific and Technological Development, Brazil (Grant: 406239/2018-5); CAPES—Coordenação de Aperfeiçoamento de Pessoal de Nível Superior, Brazil (Finance Code 001), and FAEPEX/UNICAMP-Fundo de Apoio ao Ensino, à Pesquisa e à Extensão (grants 2162/21 and 2549/22).
Institutional Review Board Statement
Not applicable.
Informed Consent Statement
Not applicable.
Data Availability Statement
Not applicable.
Conflicts of Interest
The authors declare no conflict of interest.
References
- Ma, H.; Qiao, X.; Han, L. Advances of Mussel-inspired nanocomposite hydrogels in biomedical applications. Biomimetics 2023, 8, 128. [Google Scholar] [CrossRef] [PubMed]
- Li, H.; Zheng, Y.; Qin, L. Progress of biodegradable metals. Prog. Nat. Sci. Mater. Int. 2014, 24, 414–422. [Google Scholar] [CrossRef]
- Li, H.F.; Xie, X.H.; Zheng, Y.F.; Cong, Y.; Zhou, F.Y.; Qiu, K.J.; Wang, X.; Chen, S.H.; Huang, L.; Tian, L.; et al. Development of biodegradable Zn-1X binary alloys with nutrient alloying elements Mg, Ca and Sr. Sci. Rep. 2015, 5, srep10719. [Google Scholar] [CrossRef] [PubMed]
- Hernández-Escobar, D.; Champagne, S.; Yilmazer, H.; Dikici, B.; Boehlert, C.J.; Hermawan, H. Current status and perspectives of zinc-based absorbable alloys for biomedical applications. Acta Biomater. 2019, 97, 1–22. [Google Scholar] [CrossRef] [PubMed]
- Cirovic, A.; Cirovic, A. Aluminum bone toxicity in infants may be promoted by iron deficiency. J. Trace Elem. Med. Biol. 2022, 71, 126941. [Google Scholar] [CrossRef] [PubMed]
- Exley, C.; Clarkson, E. Aluminium in human brain tissue from donors without neurodegenerative disease: A comparison with Alzheimer’s disease, multiple sclerosis and autism. Sci. Rep. 2020, 10, 7770. [Google Scholar] [CrossRef] [PubMed]
- Dey, M.; Singh, R.K. Neurotoxic effects of aluminium exposure as a potential risk factor for Alzheimer’s disease. Pharmacol. Rep. 2022, 74, 439–450. [Google Scholar] [CrossRef]
- Venezuela, J.; Dargusch, M.S. The influence of alloying and fabrication techniques on the mechanical properties, biodegradability and biocompatibility of zinc: A comprehensive review. Acta Biomater. 2019, 87, 1–40. [Google Scholar] [CrossRef]
- Sikora-Jasinska, M.; Mostaed, E.; Mostaed, A.; Beanland, R.; Mantovani, D.; Vedani, M. Fabrication, mechanical properties and in vitro degradation behavior of newly developed ZnAg alloys for degradable implant applications. Mater. Sci. Eng. C 2017, 77, 1170–1181. [Google Scholar] [CrossRef]
- Wen, P.; Voshage, M.; Jauer, L.; Chen, Y.; Qin, Y.; Poprawe, R.; Schleifenbaum, J.H. Laser additive manufacturing of Zn metal parts for biodegradable applications: Processing, formation quality and mechanical properties. Mater. Des. 2018, 155, 36–45. [Google Scholar] [CrossRef]
- Zaeem, M. Advances in modeling of solidification microstructures. JOM 2015, 67, 1774–1775. [Google Scholar] [CrossRef]
- Hermawan, H. Updates on the research and development of absorbable metals for biomedical applications. Prog. Biomater. 2018, 7, 93–110. [Google Scholar] [CrossRef]
- Alves, M.M.; Prošek, T.; Santos, C.F.; Montemor, M.F. Evolution of the in vitro degradation of Zn–Mg alloys under simulated physiological conditions. RSC Adv. 2017, 7, 28224–28233. [Google Scholar] [CrossRef]
- Vojtěch, D.; Kubásek, J.; Šerák, J.; Novák, P. Mechanical and corrosion properties of newly developed biodegradable Zn-based alloys for bone fixation. Acta Biomater. 2011, 7, 3515–3522. [Google Scholar] [CrossRef] [PubMed]
- Vida, T.A.; Brito, C.; Lima, T.S.; Spinelli, J.E.; Cheung, N.; Garcia, A. Near-eutectic Zn-Mg alloys: Interrelations of solidification thermal parameters, microstructure length scale and tensile/corrosion properties. Curr. Appl. Phys. 2019, 19, 582–598. [Google Scholar] [CrossRef]
- Prosek, T.; Nazarov, A.; Bexell, U.; Thierry, D.; Serak, J. Corrosion mechanism of model zinc–magnesium alloys in atmospheric conditions. Corros. Sci. 2008, 50, 2216–2231. [Google Scholar] [CrossRef]
- Vida, T.A.; Freitas, E.S.; Cheung, N.; Garcia, A.; Osório, W.R. Electrochemical corrosion behavior of as-cast Zn-rich Zn-Mg alloys in a 0.06 M NaCl solution. Int. J. Electrochem. Sci. 2017, 12, 5264–5283. [Google Scholar] [CrossRef]
- Vida, T.A.; Soares, T.; Septimio, R.S.; Brito, C.C.; Cheung, N.; Garcia, A. Effects of macrosegregation and microstructure on the corrosion resistance and hardness of a directionally solidified Zn-5.0wt.%Mg alloy. Mater. Res. 2019, 22, e20190009. [Google Scholar] [CrossRef]
- Mostaed, E.; Sikora-Jasinska, M.; Drelich, J.W.; Vedani, M. Zinc-based alloys for degradable vascular stent applications. Acta Biomater. 2018, 71, 1–23. [Google Scholar] [CrossRef]
- Čapek, J.; Kubásek, J.; Pinc, J.; Drahokoupil, J.; Čavojský, M.; Vojtěch, D. Extrusion of the biodegradable ZnMg0.8Ca0.2 alloy—The influence of extrusion parameters on microstructure and mechanical characteristics. J. Mech. Behav. Biomed. Mater. 2020, 108, 103796. [Google Scholar] [CrossRef]
- Pinc, J.; Čapek, J.; Kubásek, J.; Veřtát, P.; Hosová, K. Microstructure and mechanical properties of the potentially biodegradable ternary system Zn-Mg0.8-Ca0.2. Procedia Struct. Integr. 2019, 23, 21–26. [Google Scholar] [CrossRef]
- Sun, S.; Ren, Y.; Wang, L.; Yang, B.; Li, H.; Qin, G. Abnormal effect of Mn addition on the mechanical properties of as-extruded Zn alloys. Mater. Sci. Eng. A 2017, 701, 129–133. [Google Scholar] [CrossRef]
- Liu, X.; Sun, J.; Zhou, F.; Yang, Y.; Chang, R.; Qiu, K.; Pu, Z.; Li, L.; Zheng, Y. Micro-alloying with Mn in Zn–Mg alloy for future biodegradable metals application. Mater. Des. 2016, 94, 95–104. [Google Scholar] [CrossRef]
- Huang, H.; Liu, H.; Wang, L.; Ren, K.; Yan, K.; Li, Y.; Jiang, J.; Ma, A.; Xue, F.; Bai, J. Multi-interactions of dislocations and refined microstructure in a high strength and toughness Zn-Mg-Mn alloy. J. Mater. Res. Technol. 2020, 9, 14116–14121. [Google Scholar] [CrossRef]
- Krieg, R.; Vimalanandan, A.; Rohwerder, M. Corrosion of Zinc and Zn-Mg alloys with varying microstructures and magnesium contents. J. Electrochem. Soc. 2014, 161, C156–C161. [Google Scholar] [CrossRef]
- Vida, T.A.; Silva, C.A.P.; Lima, T.S.; Cheung, N.; Brito, C.; Garcia, A. Tailoring microstructure and microhardness of Zn−1wt.%Mg−(0.5wt.%Mn, 0.5wt.%Ca) alloys by solidification cooling rate. Trans. Nonferrous Met. Soc. China 2021, 31, 1031–1048. [Google Scholar] [CrossRef]
- Vida, T.A.; Freitas, E.S.; Brito, C.; Cheung, N.; Arenas, M.A.; Conde, A.; De Damborenea, J.; Garcia, A. Thermal parameters and microstructural development in directionally solidified Zn-rich Zn-Mg alloys. Met. Mater. Trans. A Phys. Met. Mater. Sci. 2016, 47, 3052–3064. [Google Scholar] [CrossRef]
- Dias, M.; Verissimo, N.C.; Regone, N.N.; Freitas, E.S.; Cheung, N.; Garcia, A. Electrochemical corrosion behaviour of Sn–Sb solder alloys: The roles of alloy Sb content and type of intermetallic compound. Corros. Eng. Sci. Techn. 2020, 56, 11–21. [Google Scholar] [CrossRef]
- Orazem, M.E.; Tribolet, D.B. Electrochemical Impedance Spectroscopy, 2nd ed.; John Wiley and Sons: Hoboken, NJ, USA, 2008. [Google Scholar]
- Bard, A.J.; Faulkner, L.R.; White, H.S. Electrochemical Methods: Fundamentals and Applications, 3rd ed.; John Wiley & Sons: Hoboken, NJ, USA, 2022. [Google Scholar]
- Barsoukov, E.; Macdonald, J.R. Impedance Spectroscopy: Theory, Experiment, and Applications, 3rd ed.; John Wiley & Sons: Hoboken, NJ, USA, 2018. [Google Scholar]
- ASTM American Society for Testing and Materials. ASTM G102-89 Standard Practice for Calculation of Corrosion Rates and Related Information from Electrochemical Measurements; ASTM Internacional: West Conshohocken, PA, USA, 2015. [Google Scholar]
Disclaimer/Publisher’s Note: The statements, opinions and data contained in all publications are solely those of the individual author(s) and contributor(s) and not of MDPI and/or the editor(s). MDPI and/or the editor(s) disclaim responsibility for any injury to people or property resulting from any ideas, methods, instructions or products referred to in the content. |
© 2023 by the authors. Licensee MDPI, Basel, Switzerland. This article is an open access article distributed under the terms and conditions of the Creative Commons Attribution (CC BY) license (https://creativecommons.org/licenses/by/4.0/).