Article

Development of a Portable Device for Surface Traction Characterization at the Shoe–Floor Interface

1
Centre for Biomedical Engineering (CBME), Indian Institute of Technology (IIT), Delhi 110016, India
2
Department of Biomedical Engineering, All India Institute of Medical Sciences (AIIMS), Delhi 110029, India
*
Author to whom correspondence should be addressed.
Surfaces 2022, 5(4), 504-520; https://doi.org/10.3390/surfaces5040036
Submission received: 10 September 2022 / Revised: 6 December 2022 / Accepted: 8 December 2022 / Published: 10 December 2022
(This article belongs to the Collection Featured Articles for Surfaces)

Abstract

:
Slip and fall accidents are widespread in workplaces and on walkways. Slipping is generally initiated by a sudden change in the flooring properties or due to a low available traction at the shoe–floor interface. To measure shoe-floor traction, mechanical slip and fall risk estimation devices are typically employed. However, to date, such existing devices are lab-based, bulky, and are unable to simulate realistic slip biomechanics and measure whole footwear traction in realistic contaminated floorings at the same time. Moreover, these devices are expensive and not available in low- or lower-middle-income countries with limited awareness regarding slip testing. To overcome these challenges, in this work, a biofidelic, portable, and low-cost slip testing device was developed. A strategic three-part subassembly was designed for the application of normal load, slipping speed, and heel strike angle for its modularity. The developed slip tester was extensively tested and validated for its performance using 10 formal footwears and two floorings, under dry and wet conditions. The results indicated that the slip tester was accurate, repeatable, and reliable in differentiating traction measurements across varying combinations of shoes, contaminants, and floorings. The instrumentation performance of the slip tester was found to also capture the differences between different shoe tread patterns in the presence of fluid films. The developed device is anticipated to significantly impact the clinical, industrial, and commercial performance testing of footwear traction in realistic slippery flooring conditions, especially in the low- or middle-income countries.

1. Introduction

Slips and falls are prevalent in workplaces and on walkways, which recently accounted for over 18% non-fatal cases in the USA (2020) [1]. Slip-related injuries are also the major source of hospital visits in many sectors, including the manufacturing, retail, and construction sectors [2]. In sports, footwear traction has been observed to significantly affect the performance of athletic movements, such as sprinting, cutting, stopping, and jumping [3]. Most severe outcomes of sports-related slip injuries include joint dislocation, hip fractures, tissue ruptures, and skull injuries [4,5,6]. To reduce the overall slip risk, adequate shoe-floor traction is required [7,8,9,10,11]. Furthermore, external factors, such as fluid contaminated floorings, are known to increase the risk of slipping [10,12,13]. The resisting force required to ambulate across different flooring surfaces in barefoot conditions or when wearing shoes is typically quantified by the ratio of shear force to normal force, known as the available coefficient of friction (ACOF) [10,12,14,15]. Several factors have been reported to alter the ACOF, such as presence of contaminants [16], type of flooring, footwear material, and outsole tread geometry [7,10,11,13,17,18,19]. Thus, to reduce the risk of slip accidents, the quantification of these variables is imperative.
Estimation of the ACOF at the shoe–floor interface has been found to correlate with the risk of slipping accurately [20,21]. The quantification of the ACOF, i.e., to perform a risk assessment, is typically conducted using slip testers or tribometers. For the slip risk assessment, numerous research studies have employed a wide range of slip testers with a variety of different operating mechanisms [22]. Several devices, such as the portable inclinable articulated strut tribometer (PIAST) [23], portable friction tester (PFT) [24], TORTUS [25], step simulator [26], and SATRA STM 603 [27,28], have been used in the past to assess slipping risks. The PIAST consists of an inclined-strut assembly which is manually dragged, and the friction coefficient is calculated during the sliding operation. The slipping risk assessment in the PFT is performed by pushing a wheeled device at a constant velocity and measuring the coefficient of friction. The TORTUS consists of a four-wheeled trolley which is moved on the surface for friction measurements. The test sample is attached to the shaft, and the shaft is moved vertically while the trolley is slid. Both the step simulator and the SATRA STM 603 consist of a whole-footwear attachment where the footwear is slid on the surface. Each device measures the friction coefficient in either dynamic or transitional phases, which is further analyzed to quantify the overall slipping risks. From a wide range of traction performance tests conducted on footwear, an ACOF of 0.3 has been reported to be an important threshold, below which, the risk of slipping significantly increases. In a recent study by Beschorner et al. [29], to test the specificity of the device, separate training and validation data sets were used. Slipping risks were predicted when the friction outcome was below the cutoff friction, which was measured using existing human slip data.
Most of these devices are lab-based, bulky, lack biofidelity (i.e., the ability to mimic the biomechanics of human slips) and environmental fidelity (i.e., the ability to mimic walkway surfaces and contaminant conditions common to slip and fall accidents), lack cost effectiveness, and lack portability. There are other portable devices which have been used in past research to quantify shoe friction on different slippery surfaces. In a very recent study, Beschorner et al. [29] presented the friction measurement ability of a portable slip testing device. This study included traction testing of several shoes on different types of floorings and contaminant combinations. Another study by Shibata et al. [30] showed the development of a hand-dragged, cart-type friction measuring instrument to quantify footwear tractions over any flooring. Another research by Yamaguchi et al. [31] used the same device developed by Shibata et al. [30] to test several types of flooring surfaces using a test with a single shoe. Most of the above-mentioned devices are expensive with limited availability in low- or middle-income countries, where there is little to no awareness regarding slip testing. Owing to these challenges associated with existing slip testing devices, an improved low-weight and low-cost portable device simulating accurate human slip biomechanics and allowing measurements on realistic slippery floorings would be indispensable to improve footwear traction performance testing widely.
In this work, the development of a whole-shoe biofidelic, portable, lighter, and low-cost slip testing device is presented. The human slip biomechanics based on the parameters used to develop the slip tester were in-line with previous literature studies [17,22,32]. The maximum normal foot load of an average human [13], the slipping velocity observed in human slipping studies [17,33], and the ability to simulate different heel contact angles during slipping were incorporated into the device specifications. The outcomes of the device were validated using 10 formal shoes, tested across two different floorings in dry and wet conditions. The device is anticipated to significantly impact the industrial, clinical, and commercial performance testing of footwear friction in realistic slippery flooring conditions.

2. Materials and Methods

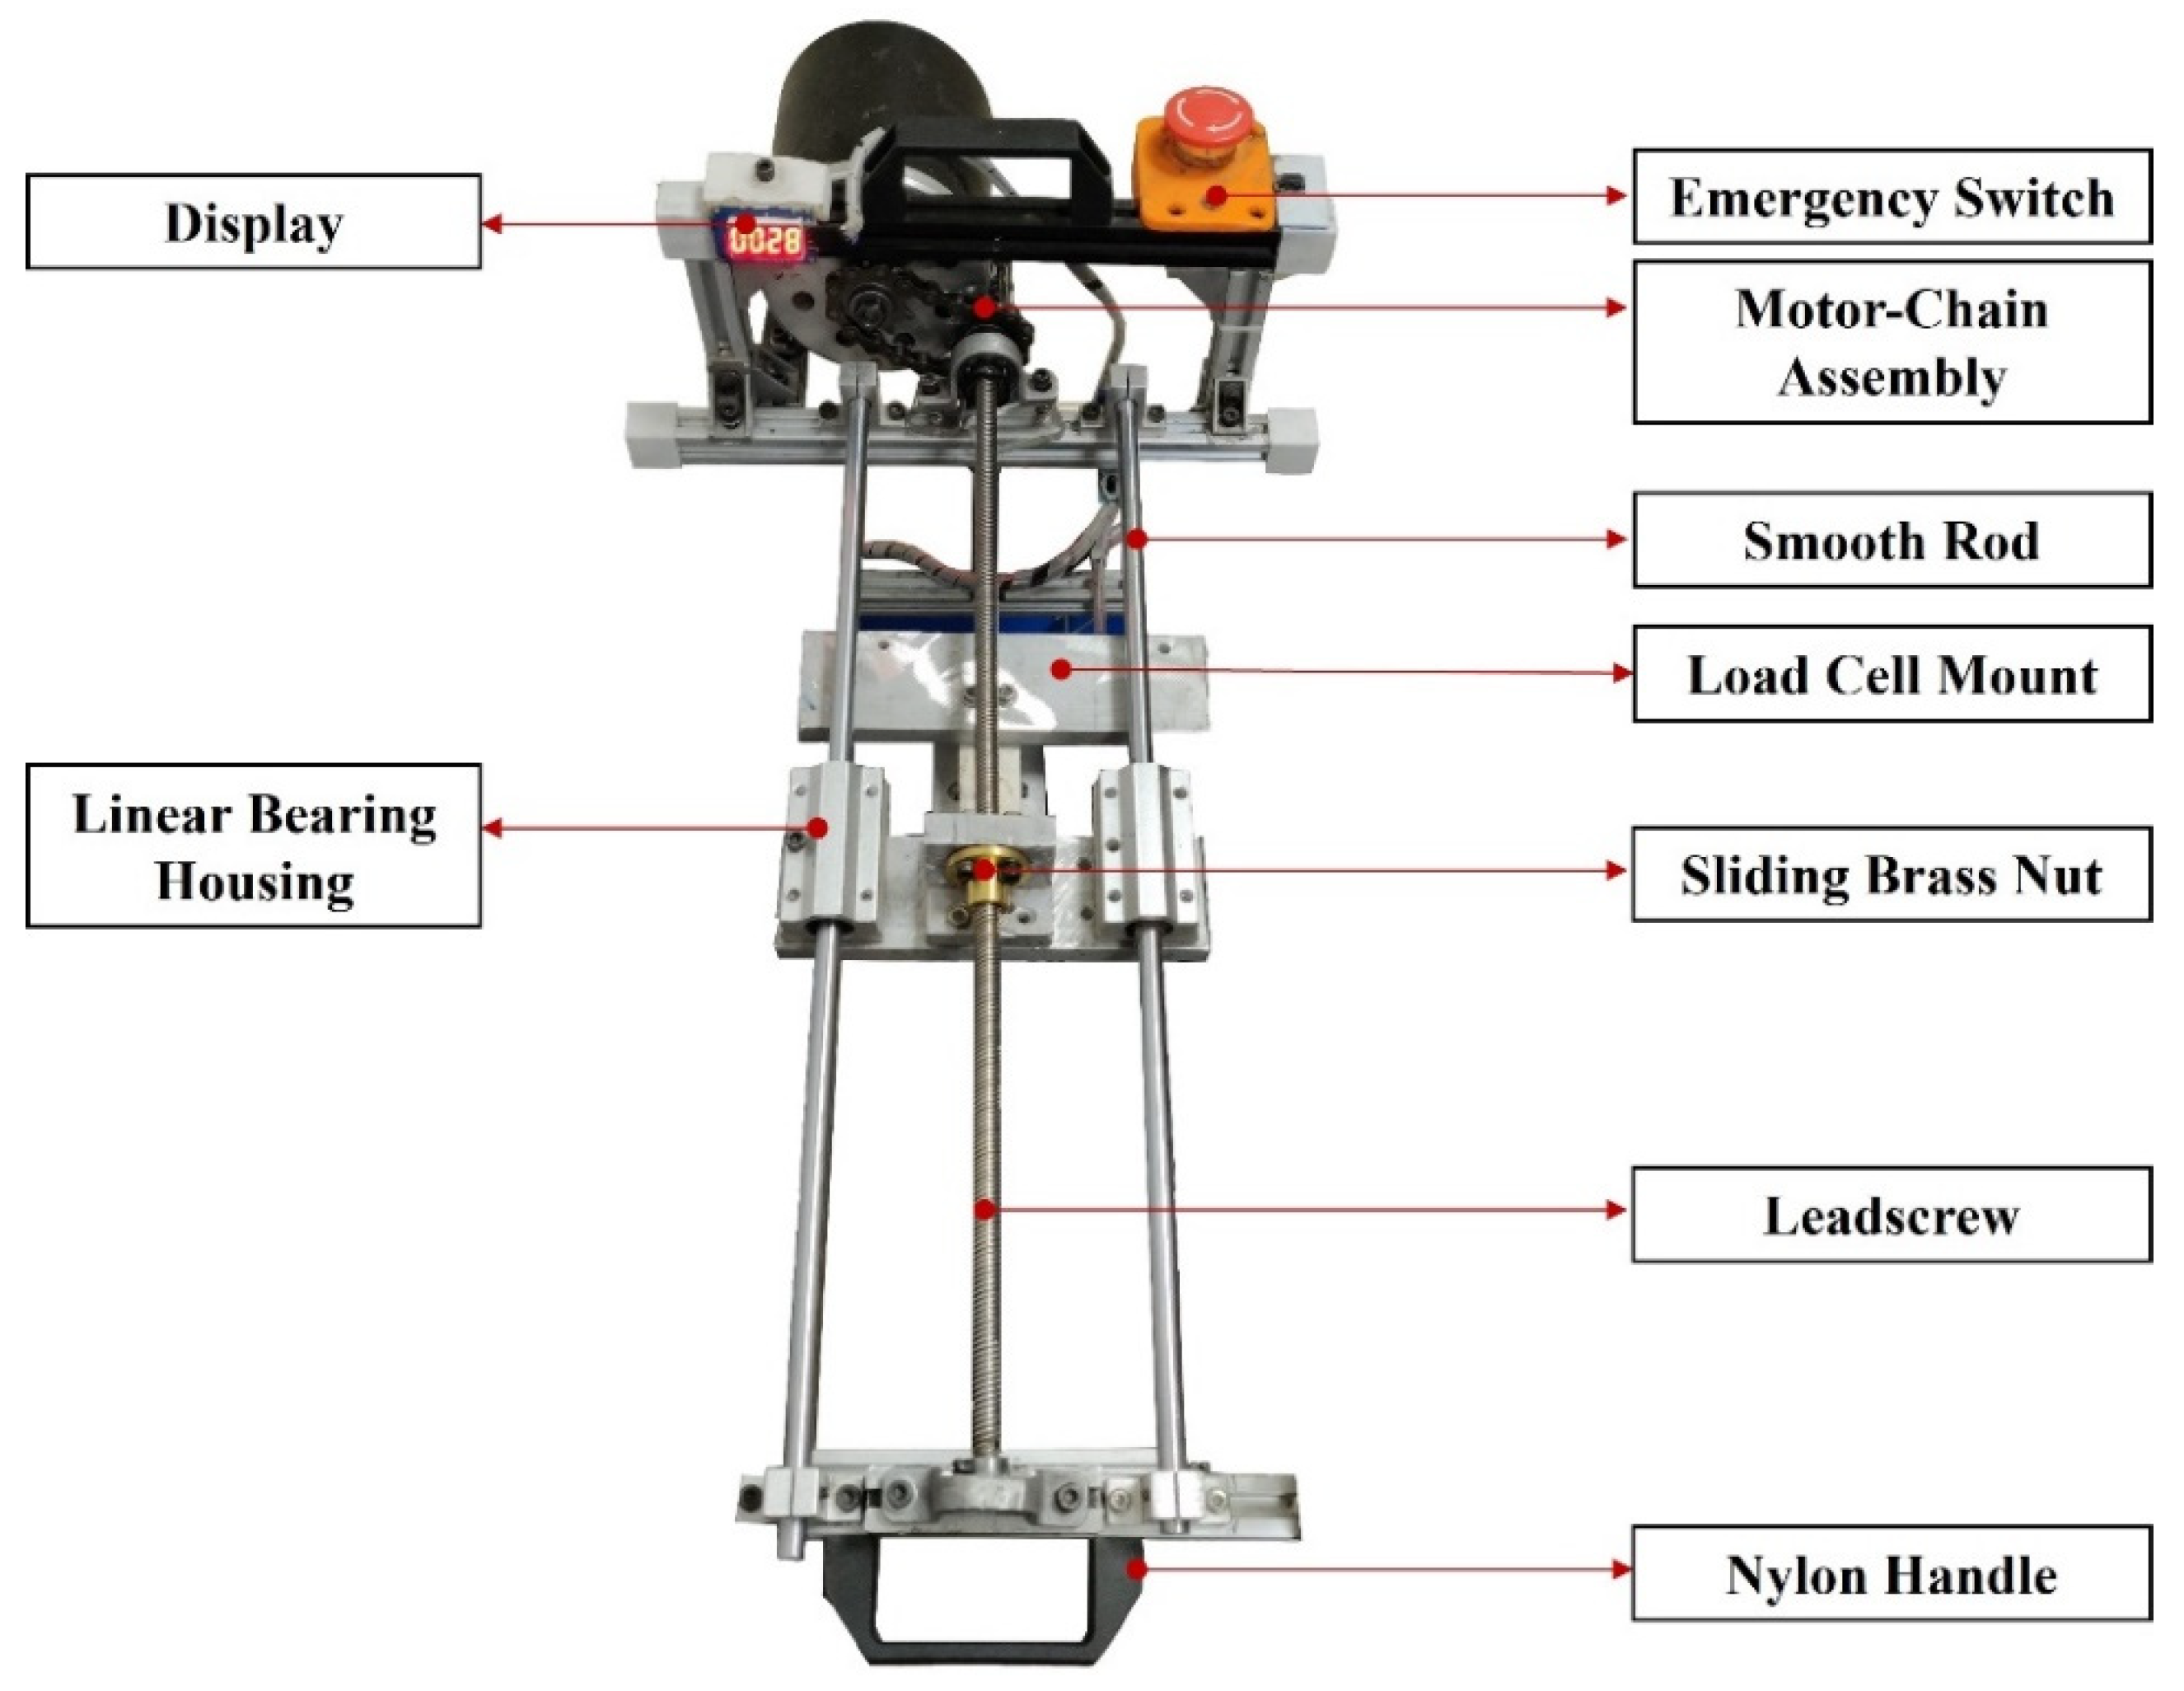
The portable slip tester was manufactured at the Disease Injury and Mechanics Lab (DIML), Indian Institute of Technology, Delhi, India. To ensure repeatable manufacturing and assembly of the device, a majority of the components were generic and widely available mechanical and electronic components, instead of customized manufactured parts. Furthermore, a modular design approach was employed to ensure easy assembly and disassembly for repair purposes. The fabrication of the device was conducted in three sub-assemblies, namely for linear motion, vertical motion, and angle adjusting mechanism. Figure 1 shows the developed portable slip tester. The device weighed 15 kg (i.e., 75 kg with 2 detachable batteries) and had the overall dimensions of 650 mm in length, 250 mm in width (without batteries), and 600 mm in height. The housing chassis was fabricated using aluminium extrusion bars (20 mm × 20 mm). The chassis was assembled using standard angle brackets with added support structures for rigidity. For portability, two nylon pulling handles and four full-swivel load bearing wheels were employed. Furthermore, treaded rubber pads were placed beneath the chassis to avoid any vibrations during testing.
A horizontal motion system was implemented to provide the horizontal motion to the footwear and to replicate the human slipping speed (Figure 2). For this mechanism, a DC motor (24 V, 150 W, 2750 RPM) with a chain drive transmission system was used to provide the horizontal velocity up to 0.5 m/s. A chain drive transmission system was specifically selected due to its durability, anti-slippage, lighter-weight assembly, and availability compared to shaft or belt drives. The sprockets were further connected to the leadscrew mechanism, with a square threaded leadscrew (8 mm lead) attached to a standard brass nut. The ends of the leadscrew were simply supported by flange bearings to support the vertical opposite load from the vertical mechanism. Furthermore, to safeguard the leadscrew from bending due to the opposite normal load, two smooth stainless steel rods with linear bearing housing were attached as a simply supported structure to the device chassis. The overall assembly of the horizontal motion provided a sliding distance of 400 mm, during which the measurement of the shoe friction was performed.
Figure 3 represents the vertical motion mechanism assembly. To simulate the maximum normal load of 500 N, which is applied by an average individual during slipping, a generic 12 V electric linear actuator with a stroke length of 200 mm and a rated load of 1500 N was employed. A load cell was attached to the horizontal assembly, and the actuator was mounted using a generic motor mount. The vertical motion assembly was attached to the brass nut mounting of the horizontal motion assembly for the coordinated slip simulation. Furthermore, an angle adjusting and shear force measuring mechanism was mounted at the end of the actuator stroke rod. The required slip angle could be adjusted from 2° to 20° by manually varying the adjustment screw. The measurement of shear force was conducted using a load cell which was placed over the angle adjustment mechanism. Two small rods with linear bearing housings were attached to the actuator mount using a spring. During the slip simulation, the force induced due to the horizontal motion was transferred directly to the load cell through the sliders. Finally, the assembly was connected to a conventional adjustable shoe, which could be fitted inside shoes ranging from UK sizes 7 to 10.
In this work, two 12 V lead-acid batteries (Amaron, Quanta, Tirupati, India) were connected in series to provide power to the motor. Lead-acid batteries were considered as they are known to provide instant current surges without damaging the battery compared to lithium-based batteries [34]. A power distribution circuit was developed to provide different voltage ranges, which was required to power the mechanisms. The controlling circuit board included a microcontroller, motor drivers, inertial measuring unit (IMU) sensors (MPU6050, TDK Corp., Tokyo, Japan), load cells, current limiters, a 7-segment display, and an emergency power cut-off switch. For the microcontroller, the Arduino Due (Arduino, Turin, Italy) having ARM Cortex M3 CPU with 32 bit was selected for its high clock rate and high number of input/output pins. The motor drivers (MDDS30, Cytron, Penang, Malaysia) included in this study had a peak current limit of 80 A, which could handle a sudden surge in power requirement of the motors in a loaded condition. To measure the horizontal speed and the adjusted angle of slip, a generic 3-axis IMU with a sampling rate of 8 kHz was employed. The IMU was concealed in a foam box to provide vibration isolation. The velocity of the sliding shoe was calculated by reading the raw acceleration values through the sensor. Furthermore, the gravitational acceleration was subtracted from the obtained acceleration values throughout the sensor running phase. The resultant acceleration values were then multiplied with the time intervals obtained during its operation. Moreover, to reduce the induced signal noise and to better calculate the median and standard deviations, a predefined filter library (i.e., Hampel filter) was implemented. A similar approach was used for the calculation of velocity in a previous research by Yuan et al. [35]. It should be mentioned that, while the calculation of shoe slipping speed can also be performed by controlling the horizontal mechanism motor, there are extra contacting pairs, such as chain-sprocket, bearing-lead screw, and brass nut-lead screw, which may lead to reduced speeds due to added frictional components. Hence, the actual slipping velocity was calculated using an IMU. Two load cells were connected to quantify the forces in the vertical and horizontal motion mechanisms, respectively. The vertical force (Fvertical) and the horizontal force (Fshear) were measured dynamically during the slipping simulation. The ratio of these dynamic quantities was used to calculate the ACOF (Equation (1)).
ACOF = F shear F vertical
A four-channel 7-segment display was implemented to display the ACOF achieved by a footwear in a particular slip testing experiment. Furthermore, for safety, current limiters as electrical fuses were employed to avoid any damage to the device due to high current surge. In addition, an emergency power cut-off switch was implemented to shut-off the device in any emergency.
A validation of instrumentation performance of normal loads, slipping speeds, and angle adjustment was conducted to ensure the biofidelity of the slip tester. For the validation, a shoe sample (Figure 4) was slid on a polished flooring (Ra = 15.2 µm) under dry conditions. The normal load was measured by a single point load cell present above the linear actuator mount, whereas the shear force was measured by a button point load sensor (Figure 3). The load sensors were generic, calibrated using standard weights, and had a maximum rating of 600 N with low nonlinearity (i.e., 0.017% MUfull scale) and hysteresis (0.02% full scale). To validate the slipping speed measured by the IMU, the motion of the slip tester was recorded using a high-definition video camera, and the video analyzing software Sony Vegas Pro 12 (Sony Creative Software, Middleton, WI, USA) was used to confirm the speed. Furthermore, the ACOF outcomes were quantified across 10 formal footwears, not labelled as slip-resistant, on two different floorings in dry and wet slipping conditions. The selected footwears had similar outsole material (i.e., polyurethane). The considered floorings, namely polished flooring and anti-skid flooring, had a surface roughness of 15.2 µm and 32.8 µm, respectively, which was measured using a digital profilometer (Precision Instruments, New Delhi, India). A total of five tests for each formal shoe and each slipping condition (i.e., total 200 experimental tests) was performed and averaged.
The ability of the slip tester to distinguish across different shoes on the same contaminated flooring was estimated. In addition, the ability of the slip tester to distinguish the same footwear under the same contaminated condition but on varying floorings was quantified. Additionally, the ACOF across different shoes while keeping the contaminants and floorings constant was also analyzed. The quality of the correlations was estimated using the correlation coefficient (R2). R2 greater than or equal to 0.5 was considered significant, and a value below 0.5 was considered insignificant [13].

3. Results

3.1. Evaluation of Biofidelity and Repeatability of Slip Tester

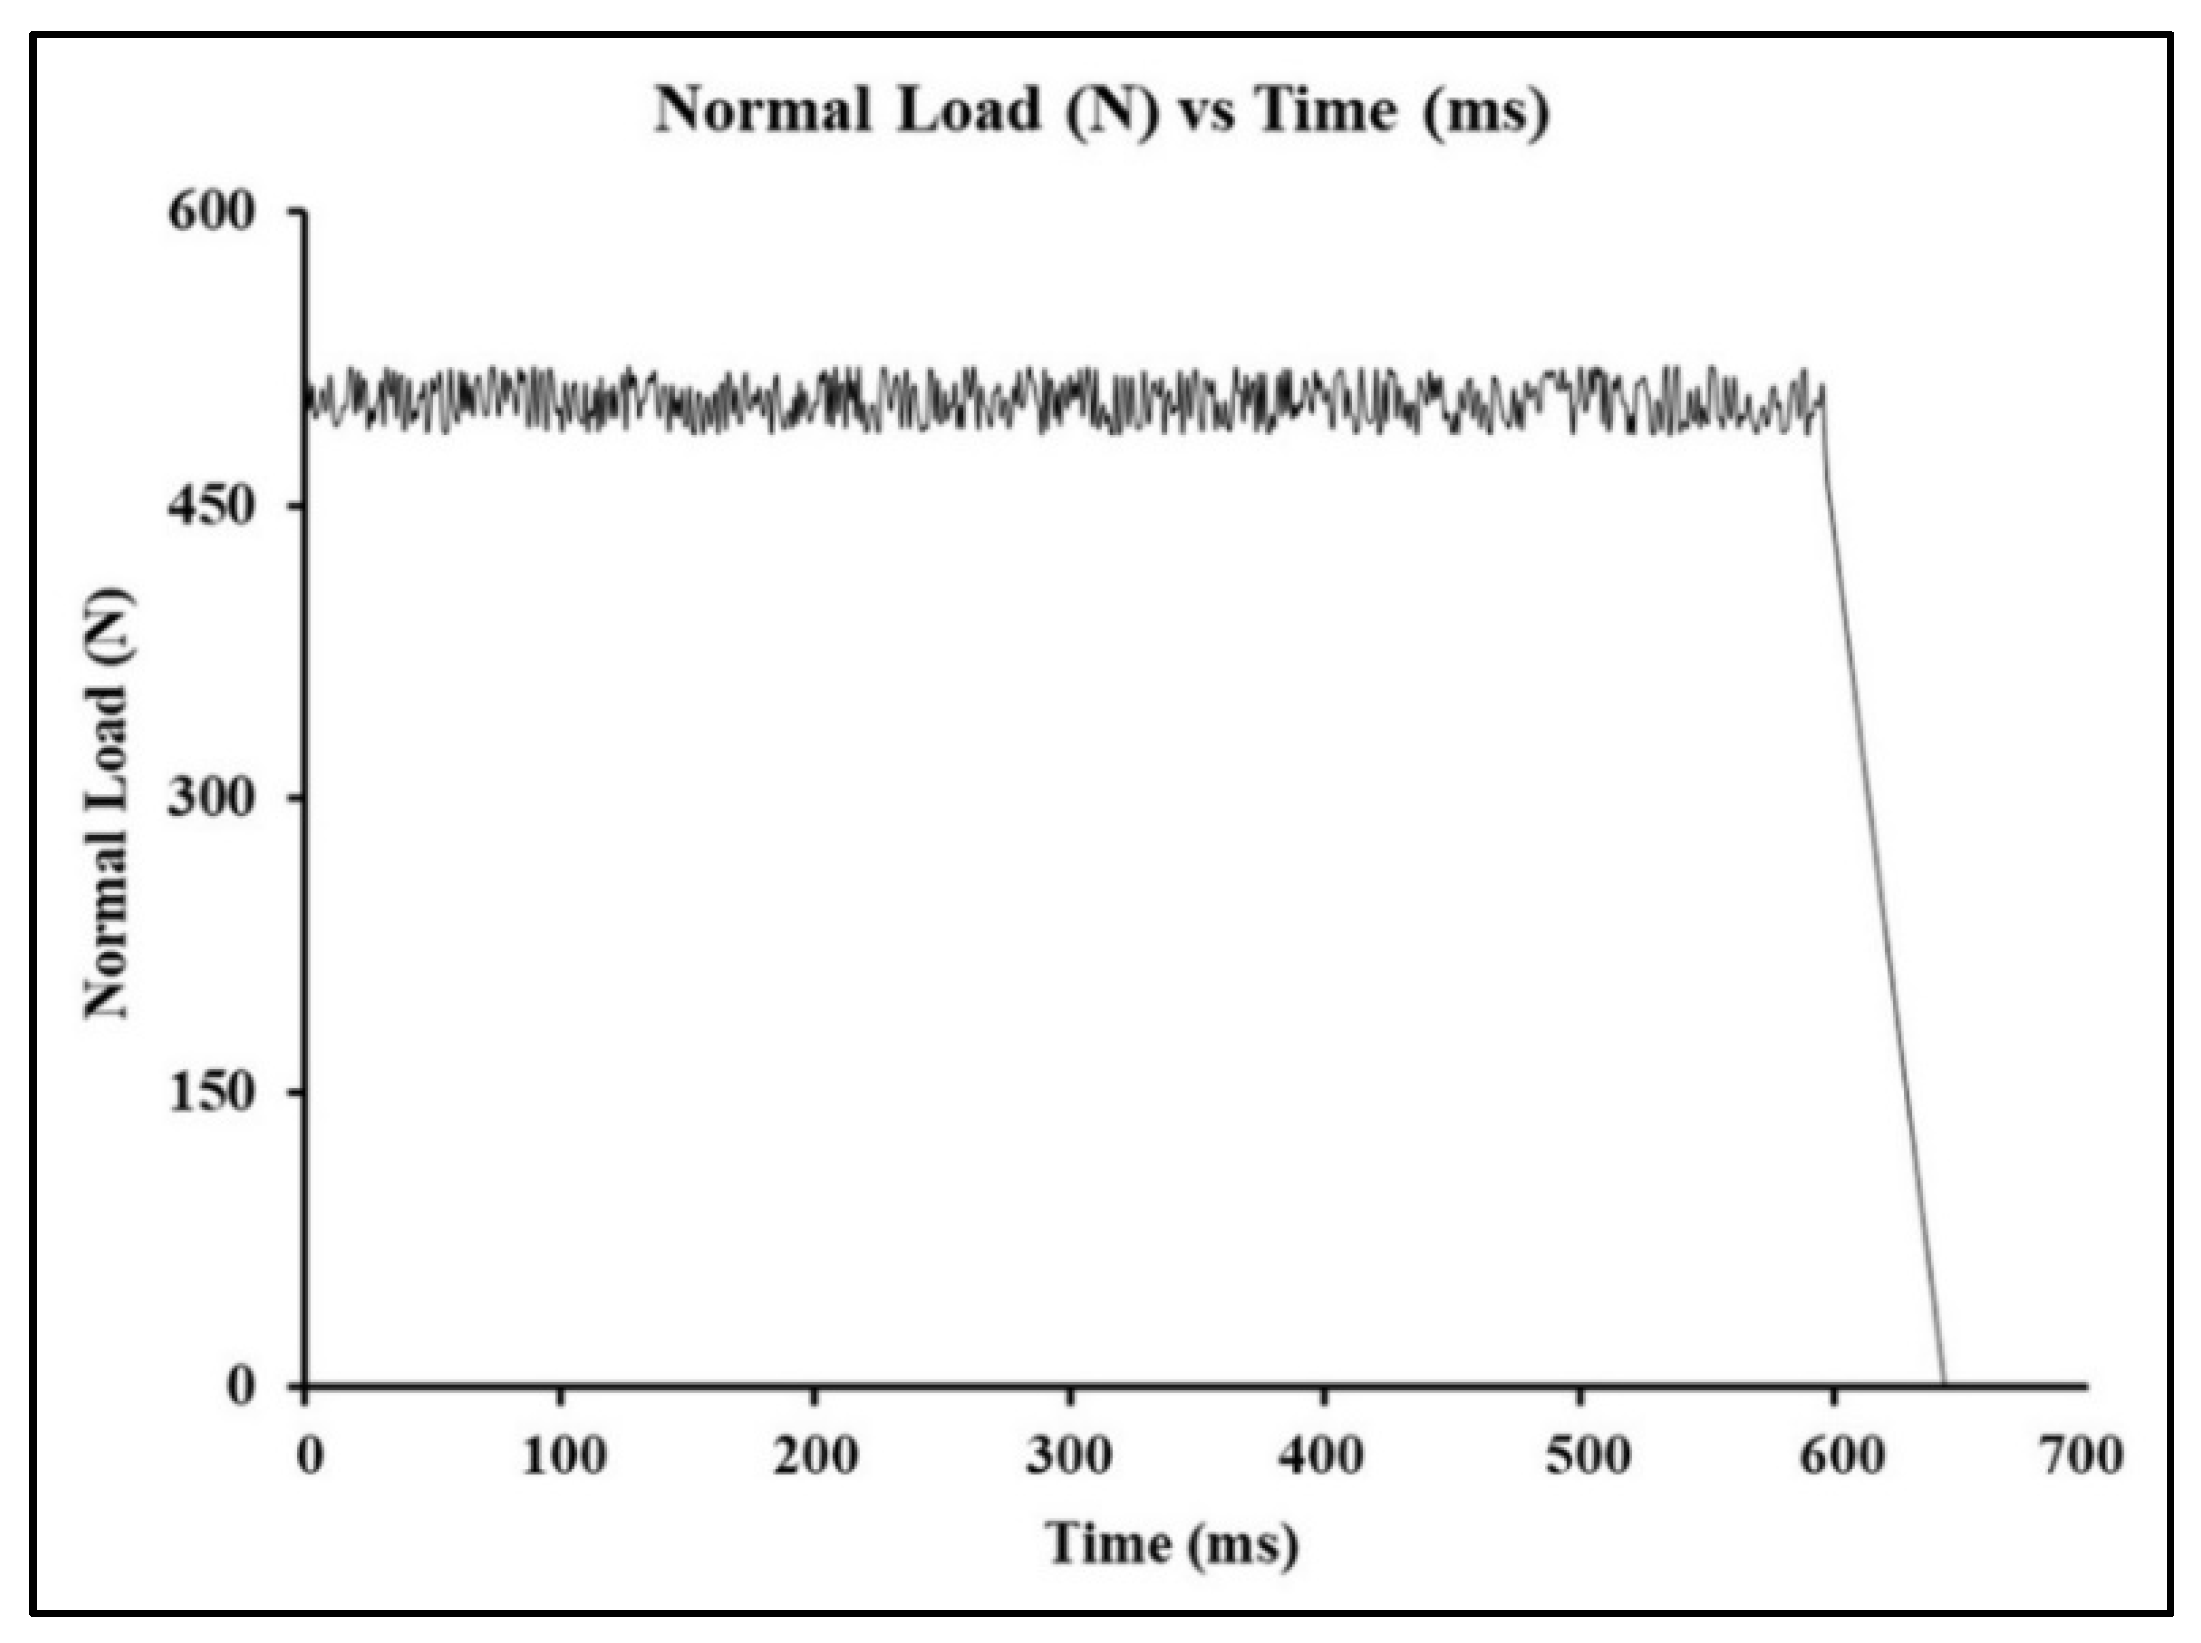
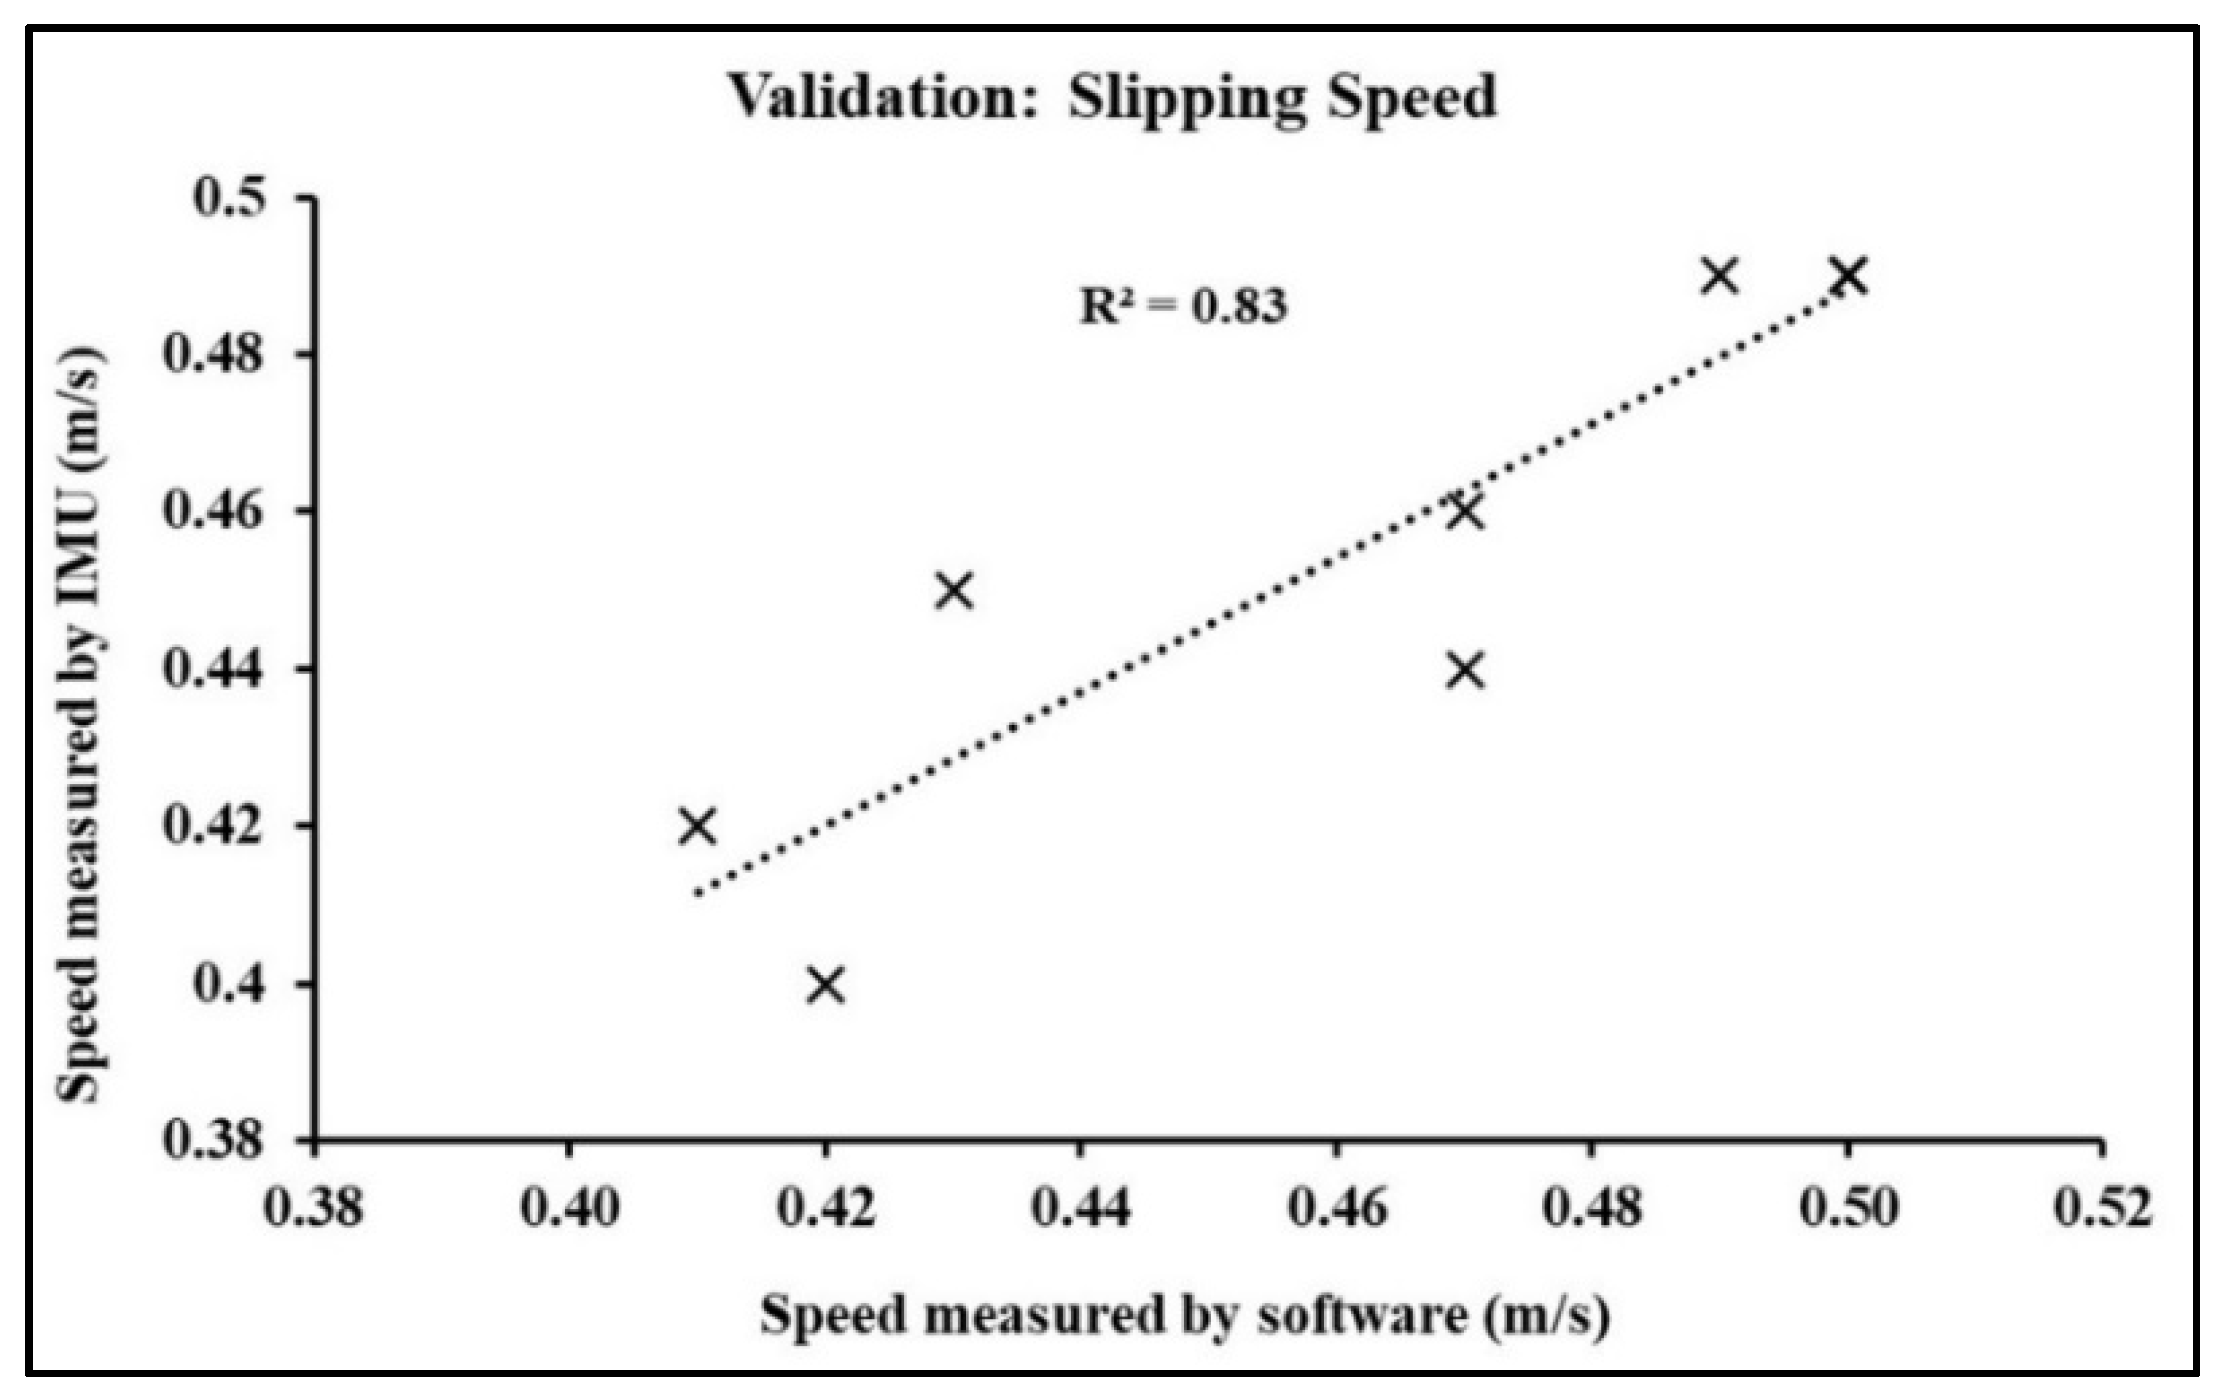
Figure 5 represents the variations in normal load generated by the linear actuator with respect to time. The overall variations ranged from 487 to 510 N, which was within the 3% of the original coded value (i.e., 500 N). Lower fluctuations were observed at the onset and at the end of the slip simulation. The horizontal (or slipping) speed data generated by the IMU strongly correlated (i.e., R2 = 0.83) with the data generated by the video analyzing software (Figure 6).
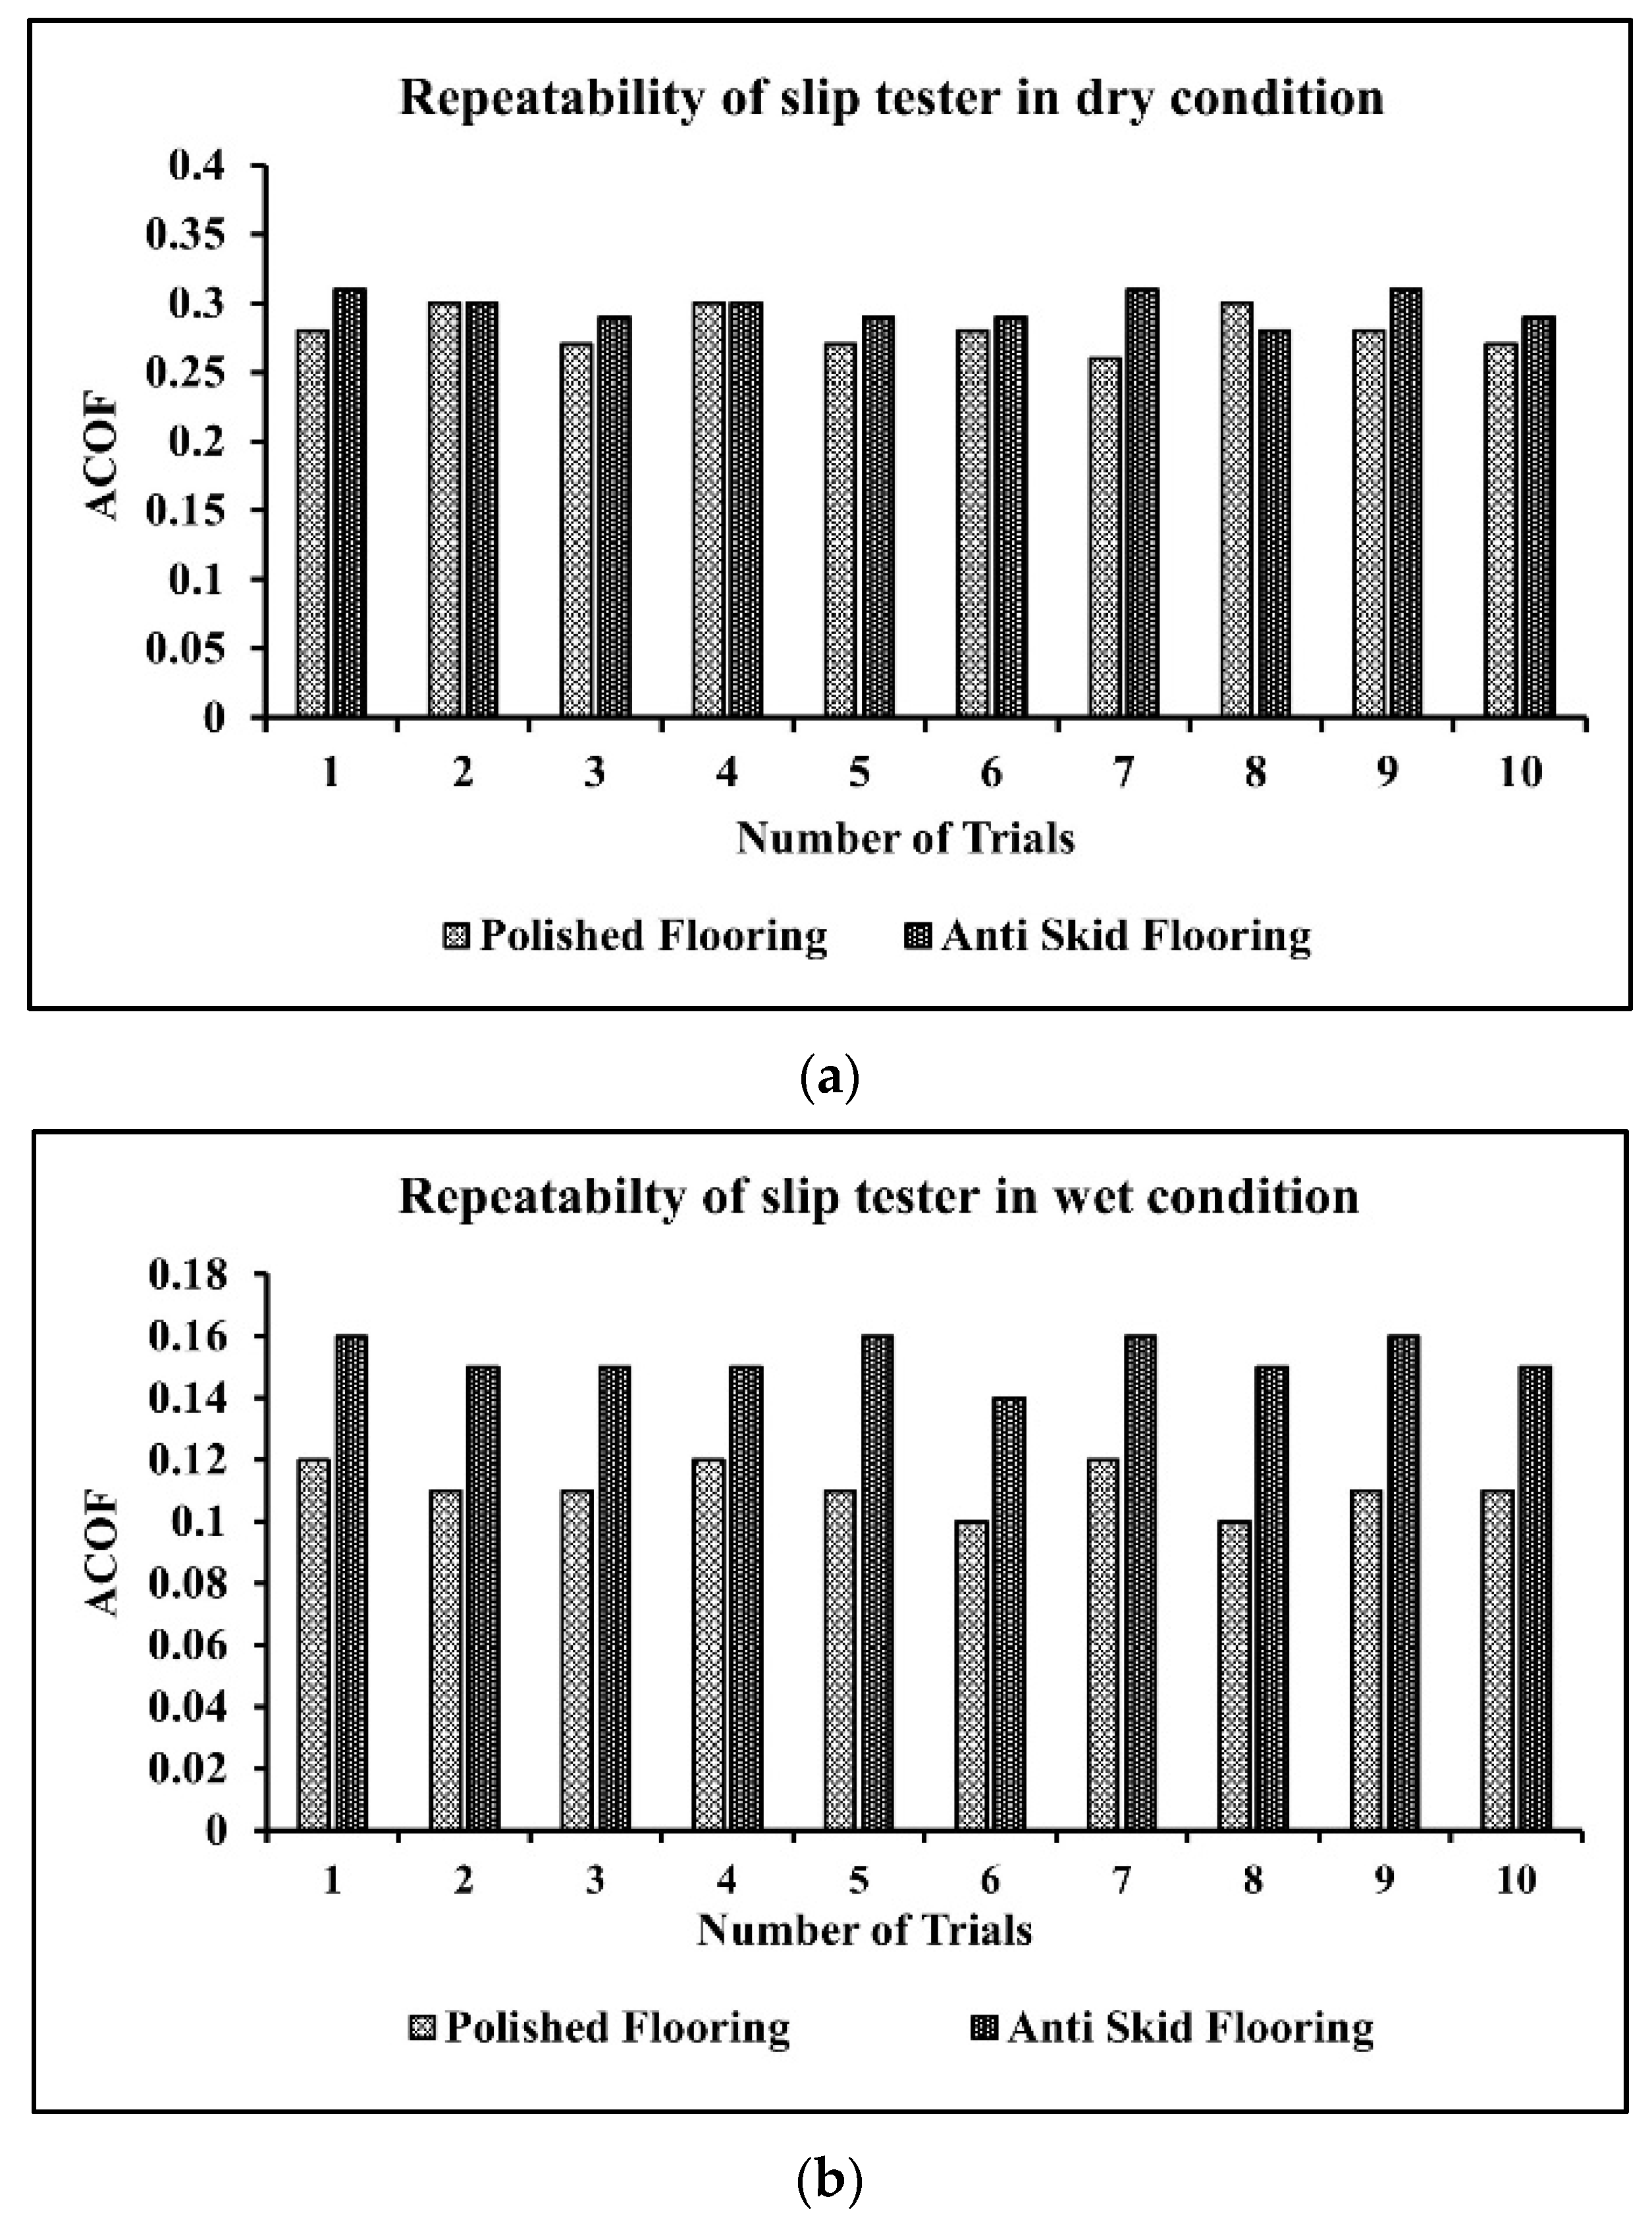
For repeatability, the variations in the ACOF of one shoe was tested 10 times with different flooring-contaminant combinations; the results are presented in Figure 7. A high correlation value (R2 > 0.90) was observed with a maximum difference in the ACOF of 0.04 and 0.03 for the polished and anti-skid floorings, respectively, in dry condition (Figure 7a). Moderate differences were observed for the anti-skid flooring with values of approximately 0.01 and 0.02 in dry and wet conditions, respectively. Negligible differences were observed in the case of the polished flooring in wet slippery condition (Figure 7b). These results confirmed the high repeatability of the slip tester for the shoe-floor-contaminant conditions.

3.2. Ability of Slip Tester to Differentiate Shoes Tested on Similar Slippery Conditions

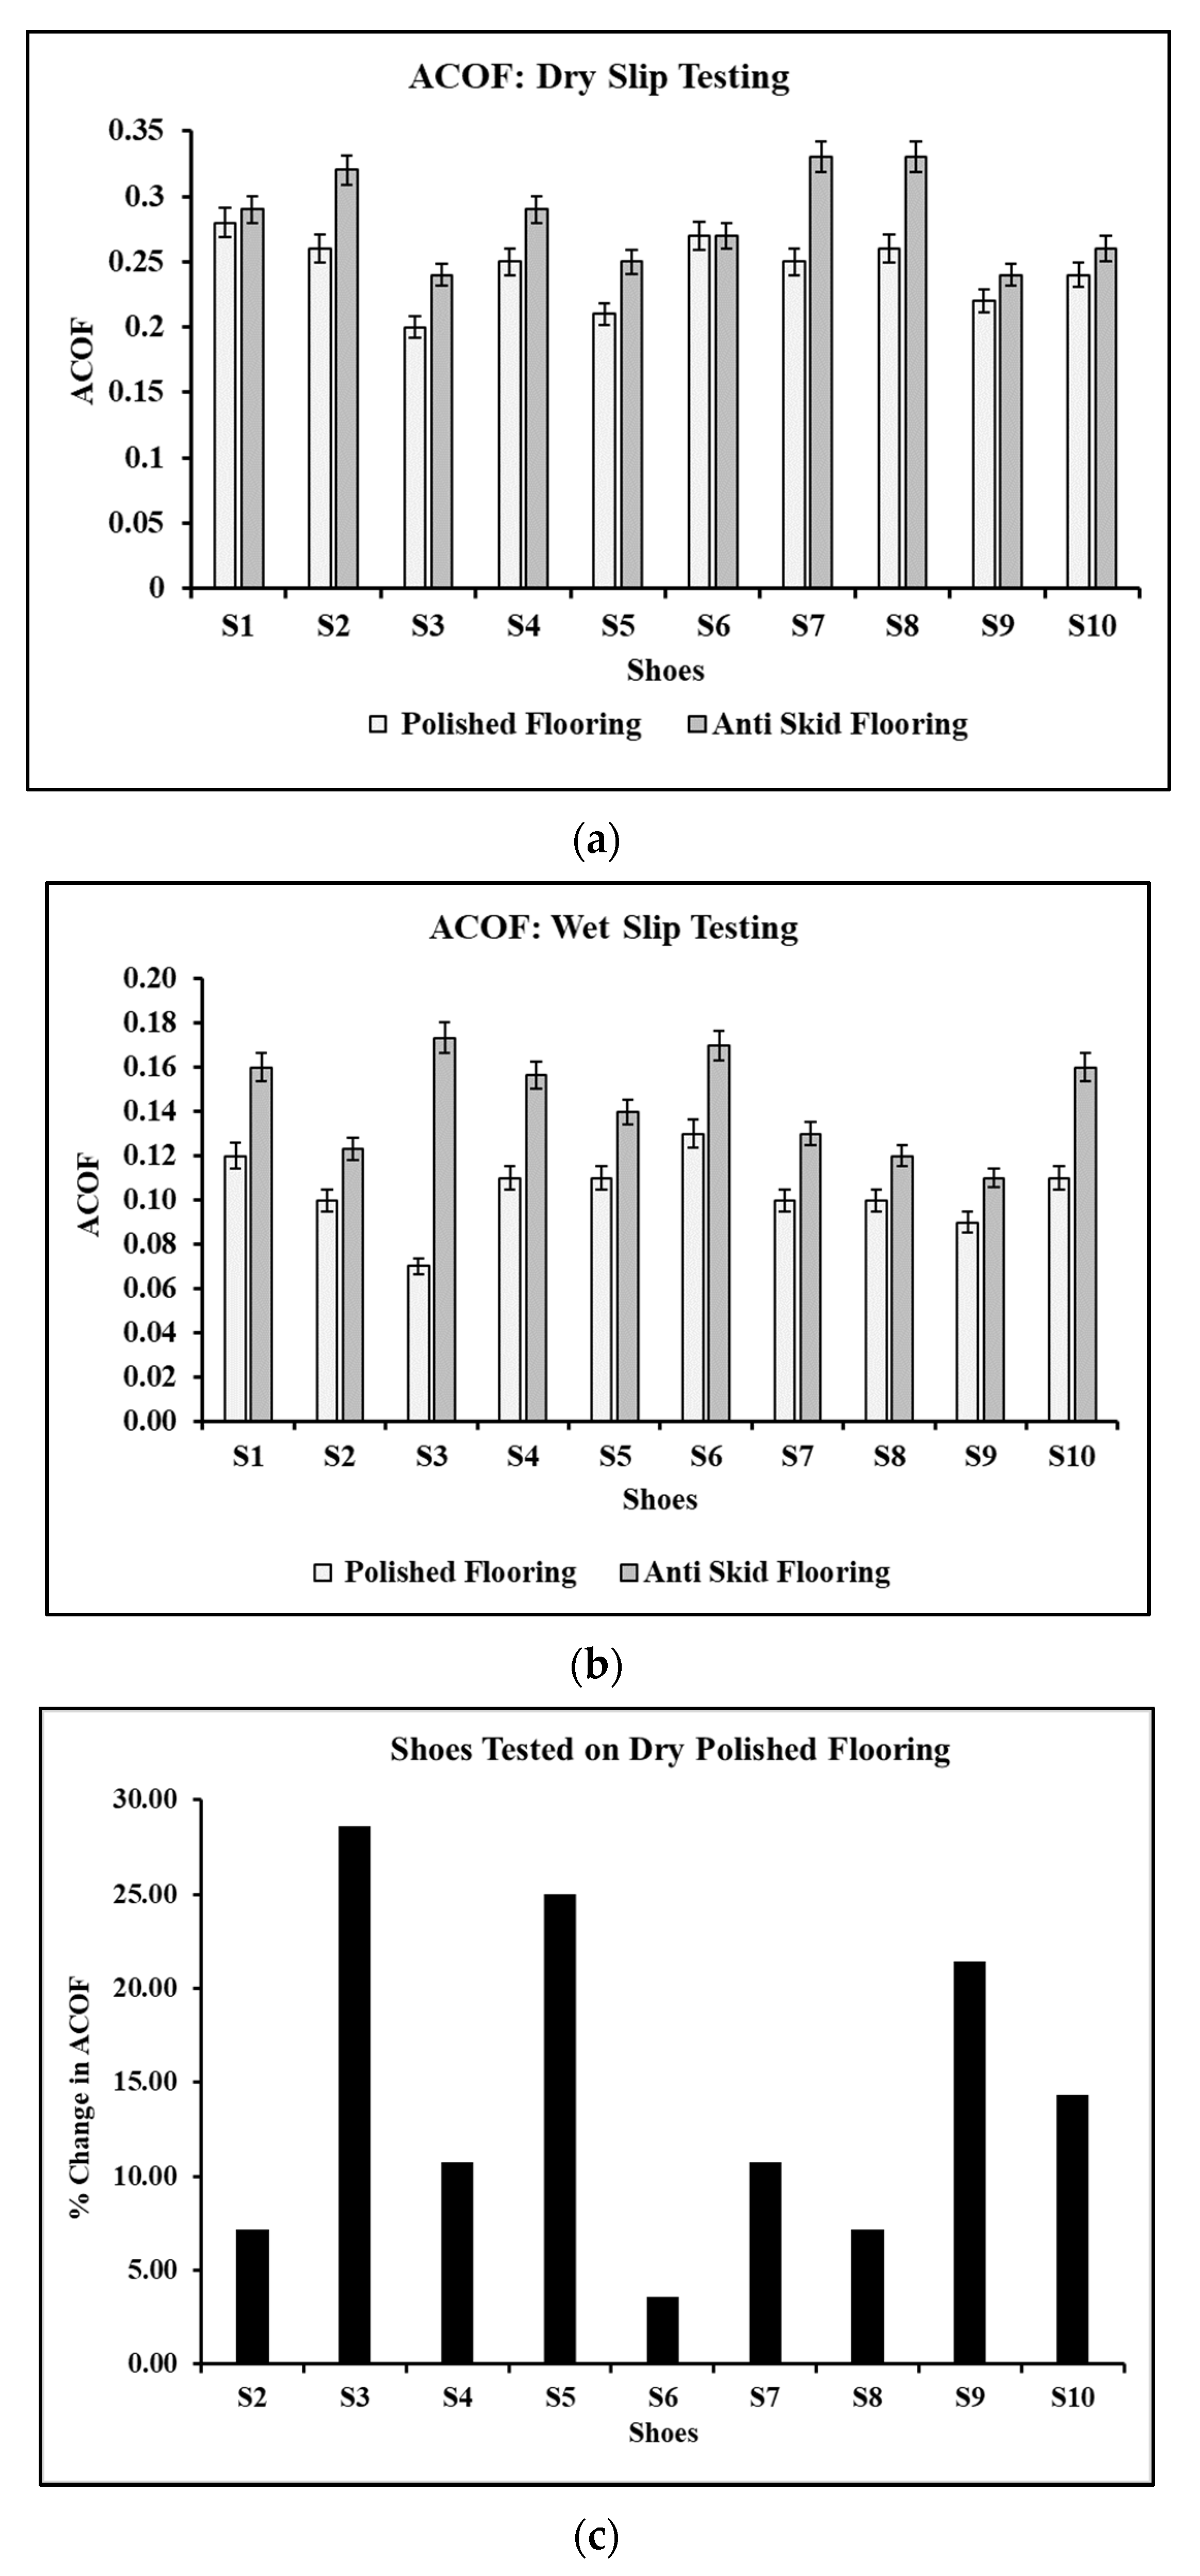
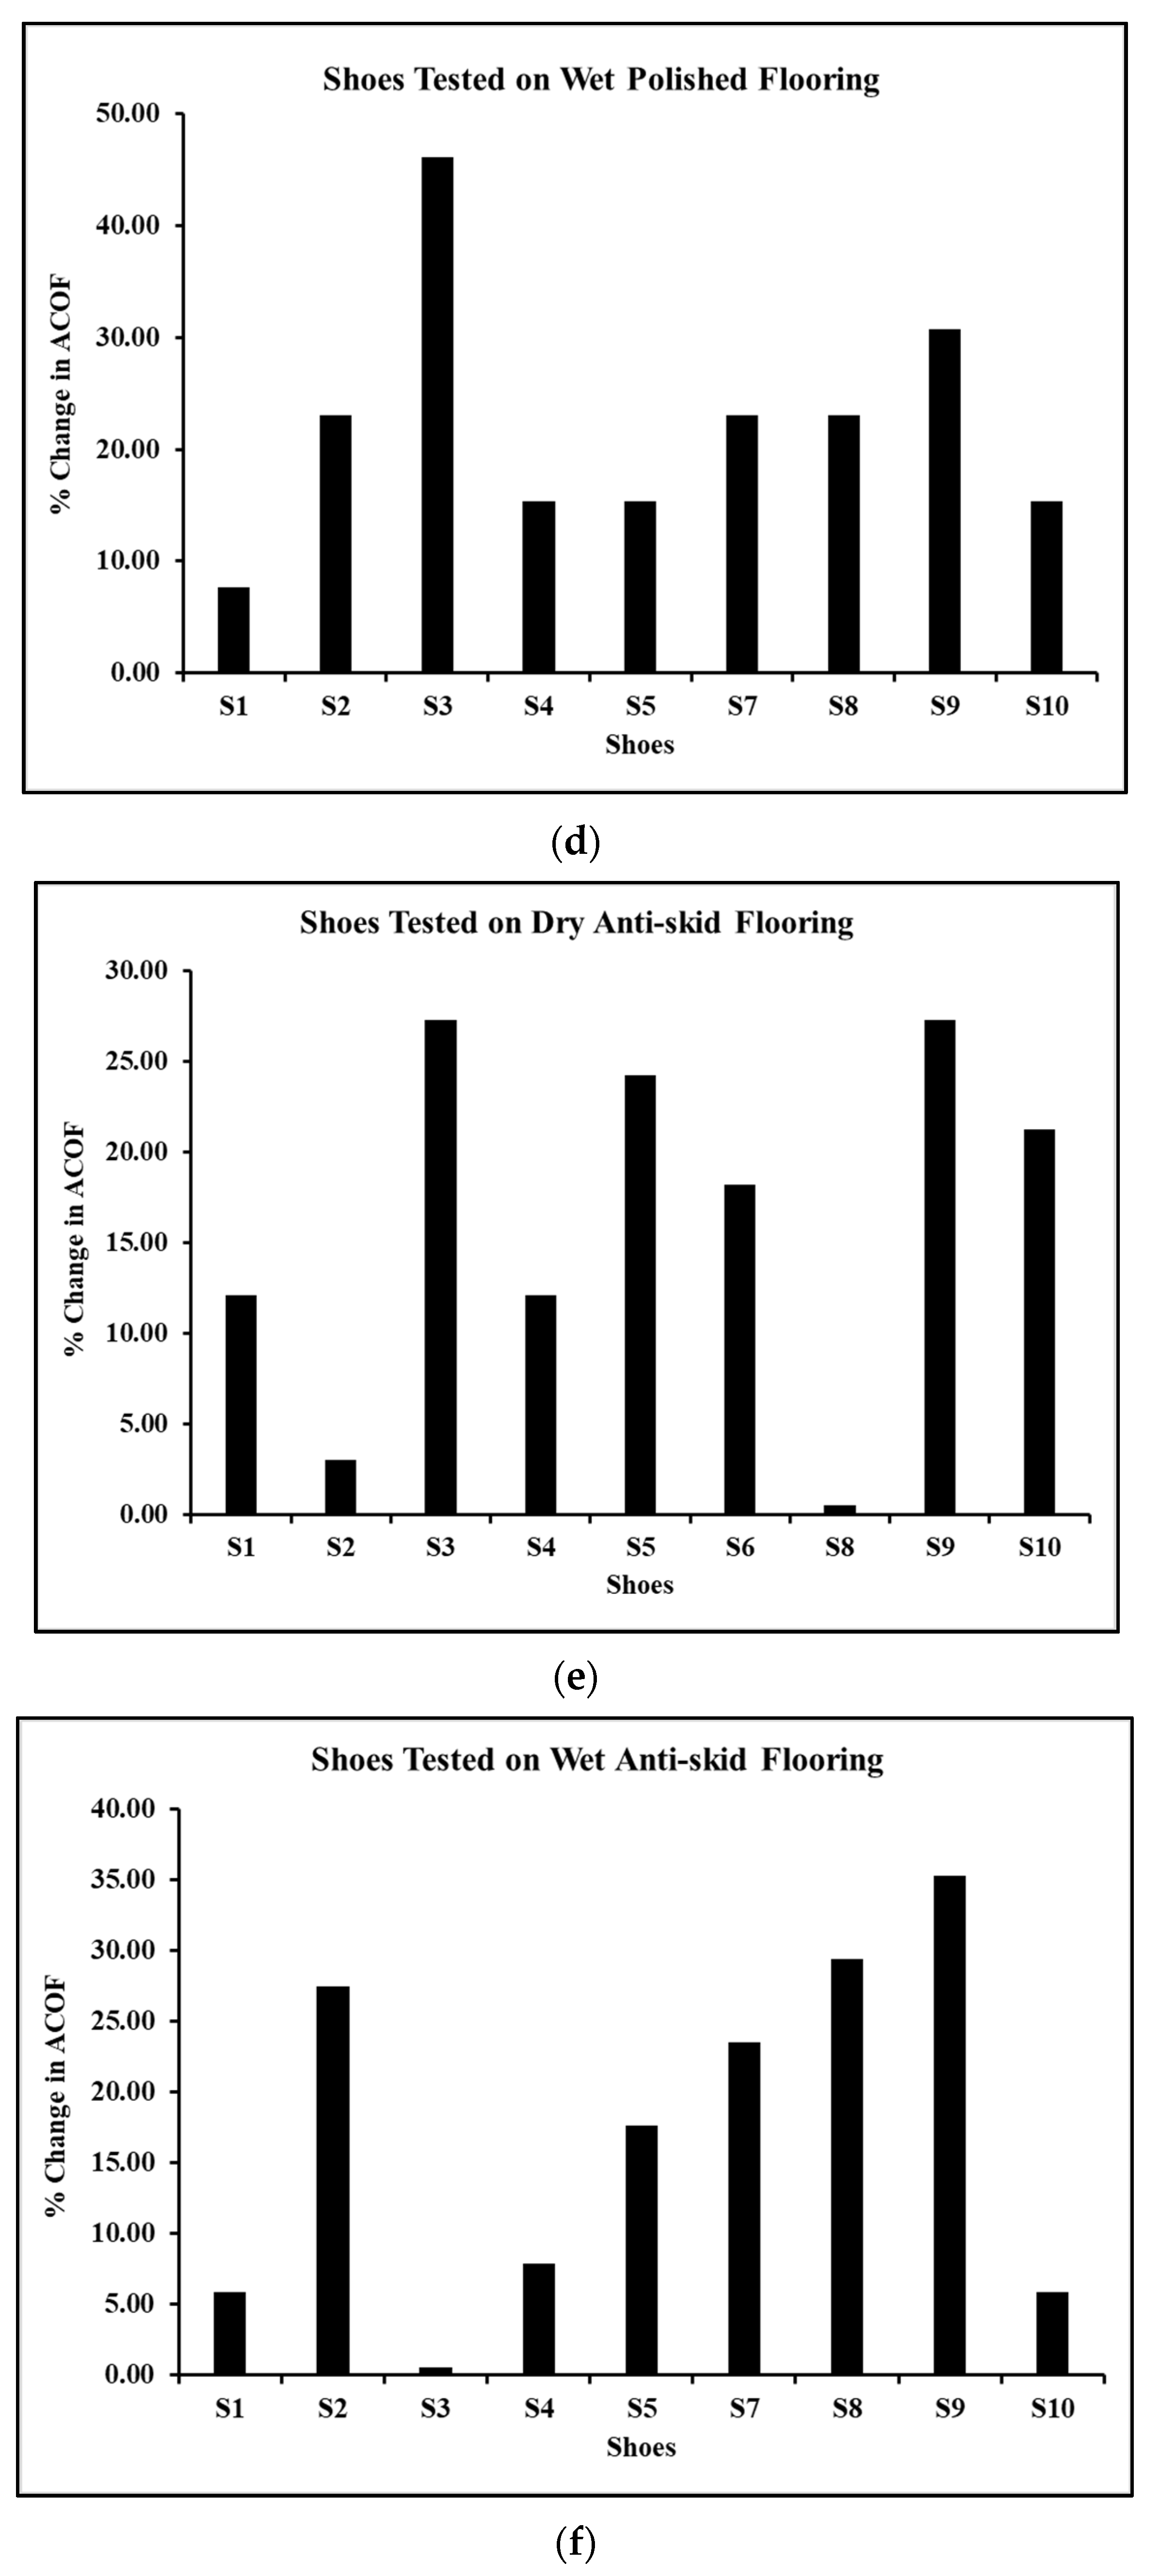
For each floor condition (i.e., dry polished, wet polished, dry anti-skid, and wet anti-skid), the percentage change in the ACOF of all shoes with respect to one shoe (assumed to be a control shoe) was estimated to determine the ability of the slip tester to differentiate between shoes in the same flooring condition. The ACOF of 10 shoes (S1 to S10) ranged from 0.20 ± 0.010 to 0.33 ± 0.015 in dry slip testing (Figure 8a) and 0.07 ± 0.015 to 0.17 ± 0.010 (Figure 8b) in wet slip testing across both types of floorings. The slip testing results varied widely across different shoes for the same slippery condition. For the polished flooring in dry condition, the maximum ACOF of S2, S3, S4, S5, S6, S7, S8, S9, and S10 were approx. 7%, 28%, 11%, 25%, 4%, 11%, 7%, 21%, and 14% lower than S1, respectively (Figure 8c). For the polished flooring in wet condition, the maximum ACOF of S1, S2, S3, S4, S5, S7, S8, S9, and S10 were approx. 8%, 23%, 46%, 15%, 15%, 23%, 23%, 31%, and 15% lower than S6, respectively (Figure 8d). For the anti-skid flooring in dry condition, the maximum ACOF of S1, S2, S3, S4, S5, S6, S8, S9, and S10 were approx. 12%, 3%, 27%, 12%, 24%, 18%, 0.5%, 27%, and 21% lower than S7, respectively (Figure 8e). For the anti-skid flooring in wet condition, the highest ACOF of S1, S2, S3, S4, S5, S6, S8, S9, and S10 were approx. 6%, 27%, 0.5%, 8%, 18%, 24%, 29%, 35%, and 6% lower than S6, respectively (Figure 8f). Overall, the ACOF differences across over 95% of the shoes in the four different slippery conditions ranged from 5% to 35%, indicating that the slip tester was able to clearly differentiate shoes tested under similar slippery conditions.

3.3. Ability of Slip Tester to Differentiate Shoes Tested on Different Floorings

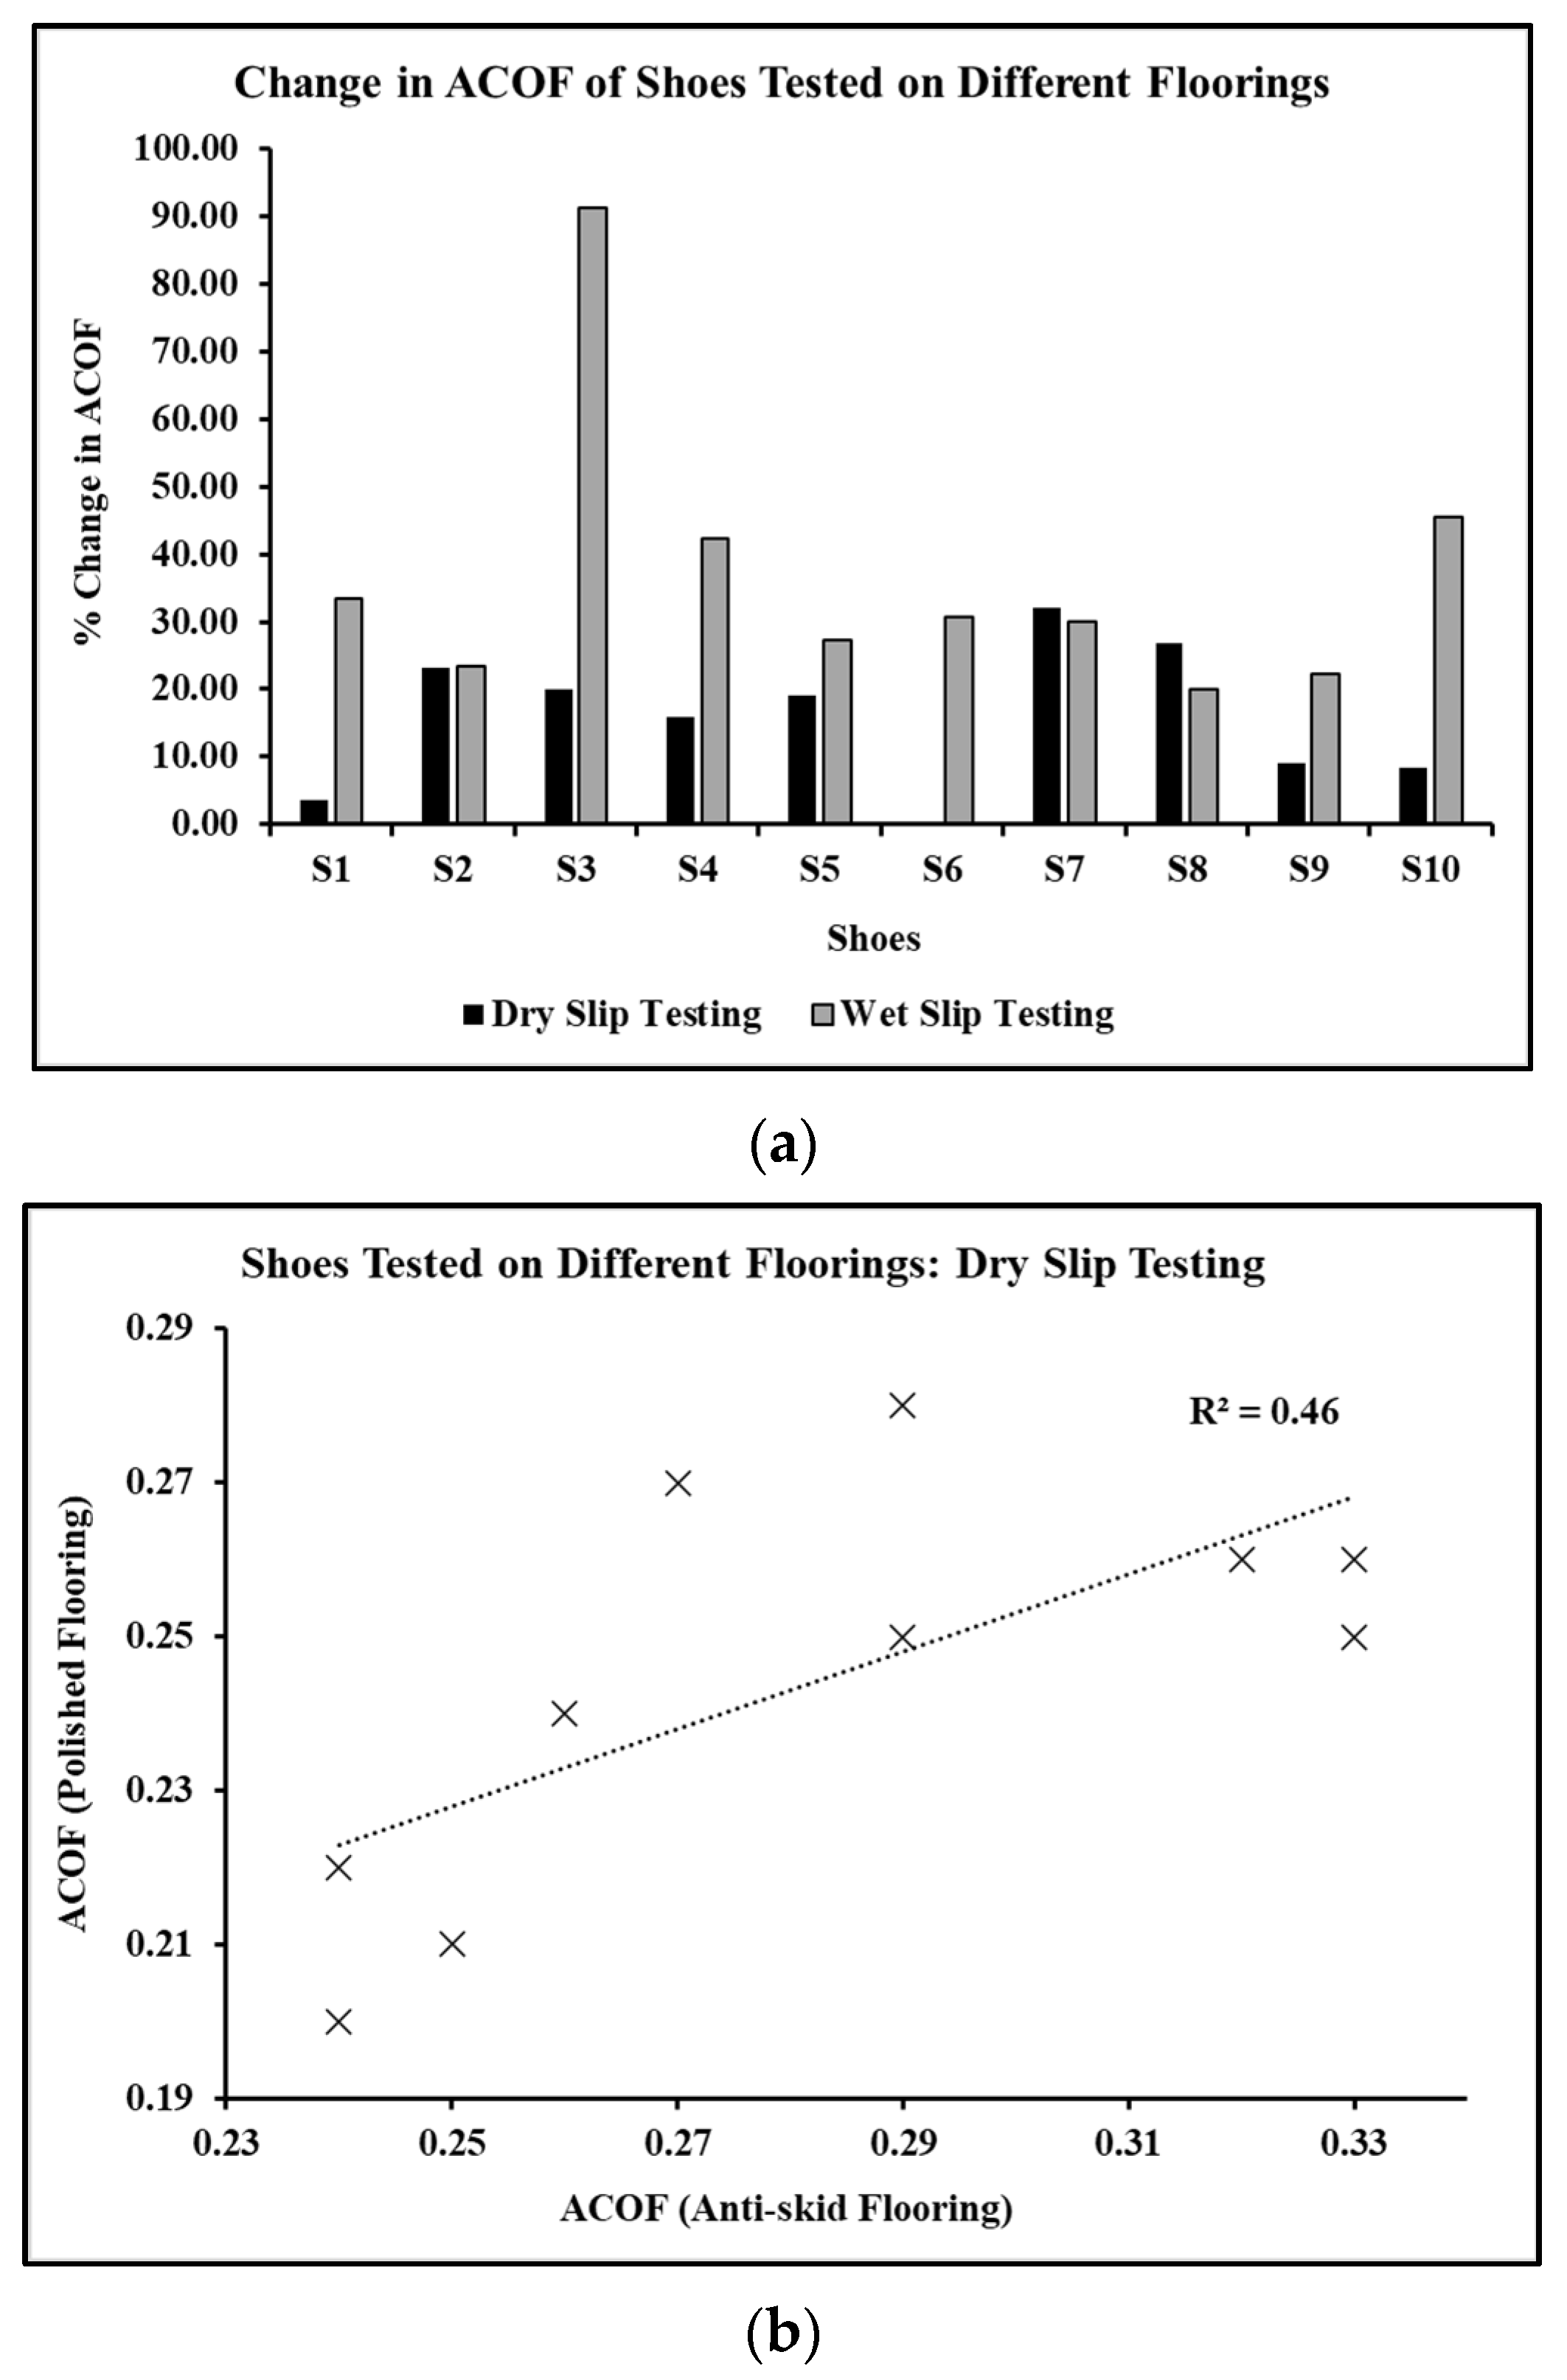
In this section, the percentage differences in the ACOF are presented for each shoe (i.e., S1–S10) on two different floorings (i.e., polished vs. anti-skid), in both dry and wet conditions. This test was performed to determine the ability of the slip tester to differentiate between two floorings for the same shoe and contaminant condition. Across different floorings, the ACOF of any shoe varied significantly. Between the polished and anti-skid floorings, under dry condition, the ACOF of shoe S1 showed 4% difference, S2 showed 23% difference, S3 showed 20% difference, S4 showed 16% difference, S5 showed 19% difference, S6 showed no difference, S7 showed 32% difference, S8 showed 27% difference, S9 showed 9% difference, and S10 showed 8% difference (Figure 9a). Overall, the difference in the majority of shoes ranged between 5 and 32%. Moreover, the correlation of the ACOF of the shoes between the two floorings was estimated to be insignificant (i.e., 0.46) (Figure 9b).
Between the polished and anti-skid floorings, under wet condition, the ACOF of shoe S1 showed 33% difference, S2 showed 23% difference, S3 showed 91% difference, S4 showed 42% difference, S5 showed 27% difference, S6 showed 31% difference, S7 showed 30% difference, S8 showed 20% difference, S9 showed 22% difference, and S10 showed 45% difference (Figure 9a). Overall, the difference ranged between 20 and 91%. Moreover, the correlation of the ACOF of the shoes between the two floorings was estimated to be insignificant (i.e., 0.06) (Figure 9c). The high difference in the ACOF measured between the two floorings for any shoe and the low correlation of the ACOF of different shoes between the two floorings indicate the ability of the slip tester to differentiate shoes tested on different floorings.

3.4. Ability of Slip Tester to Differentiate Shoes Tested with Different Contaminants

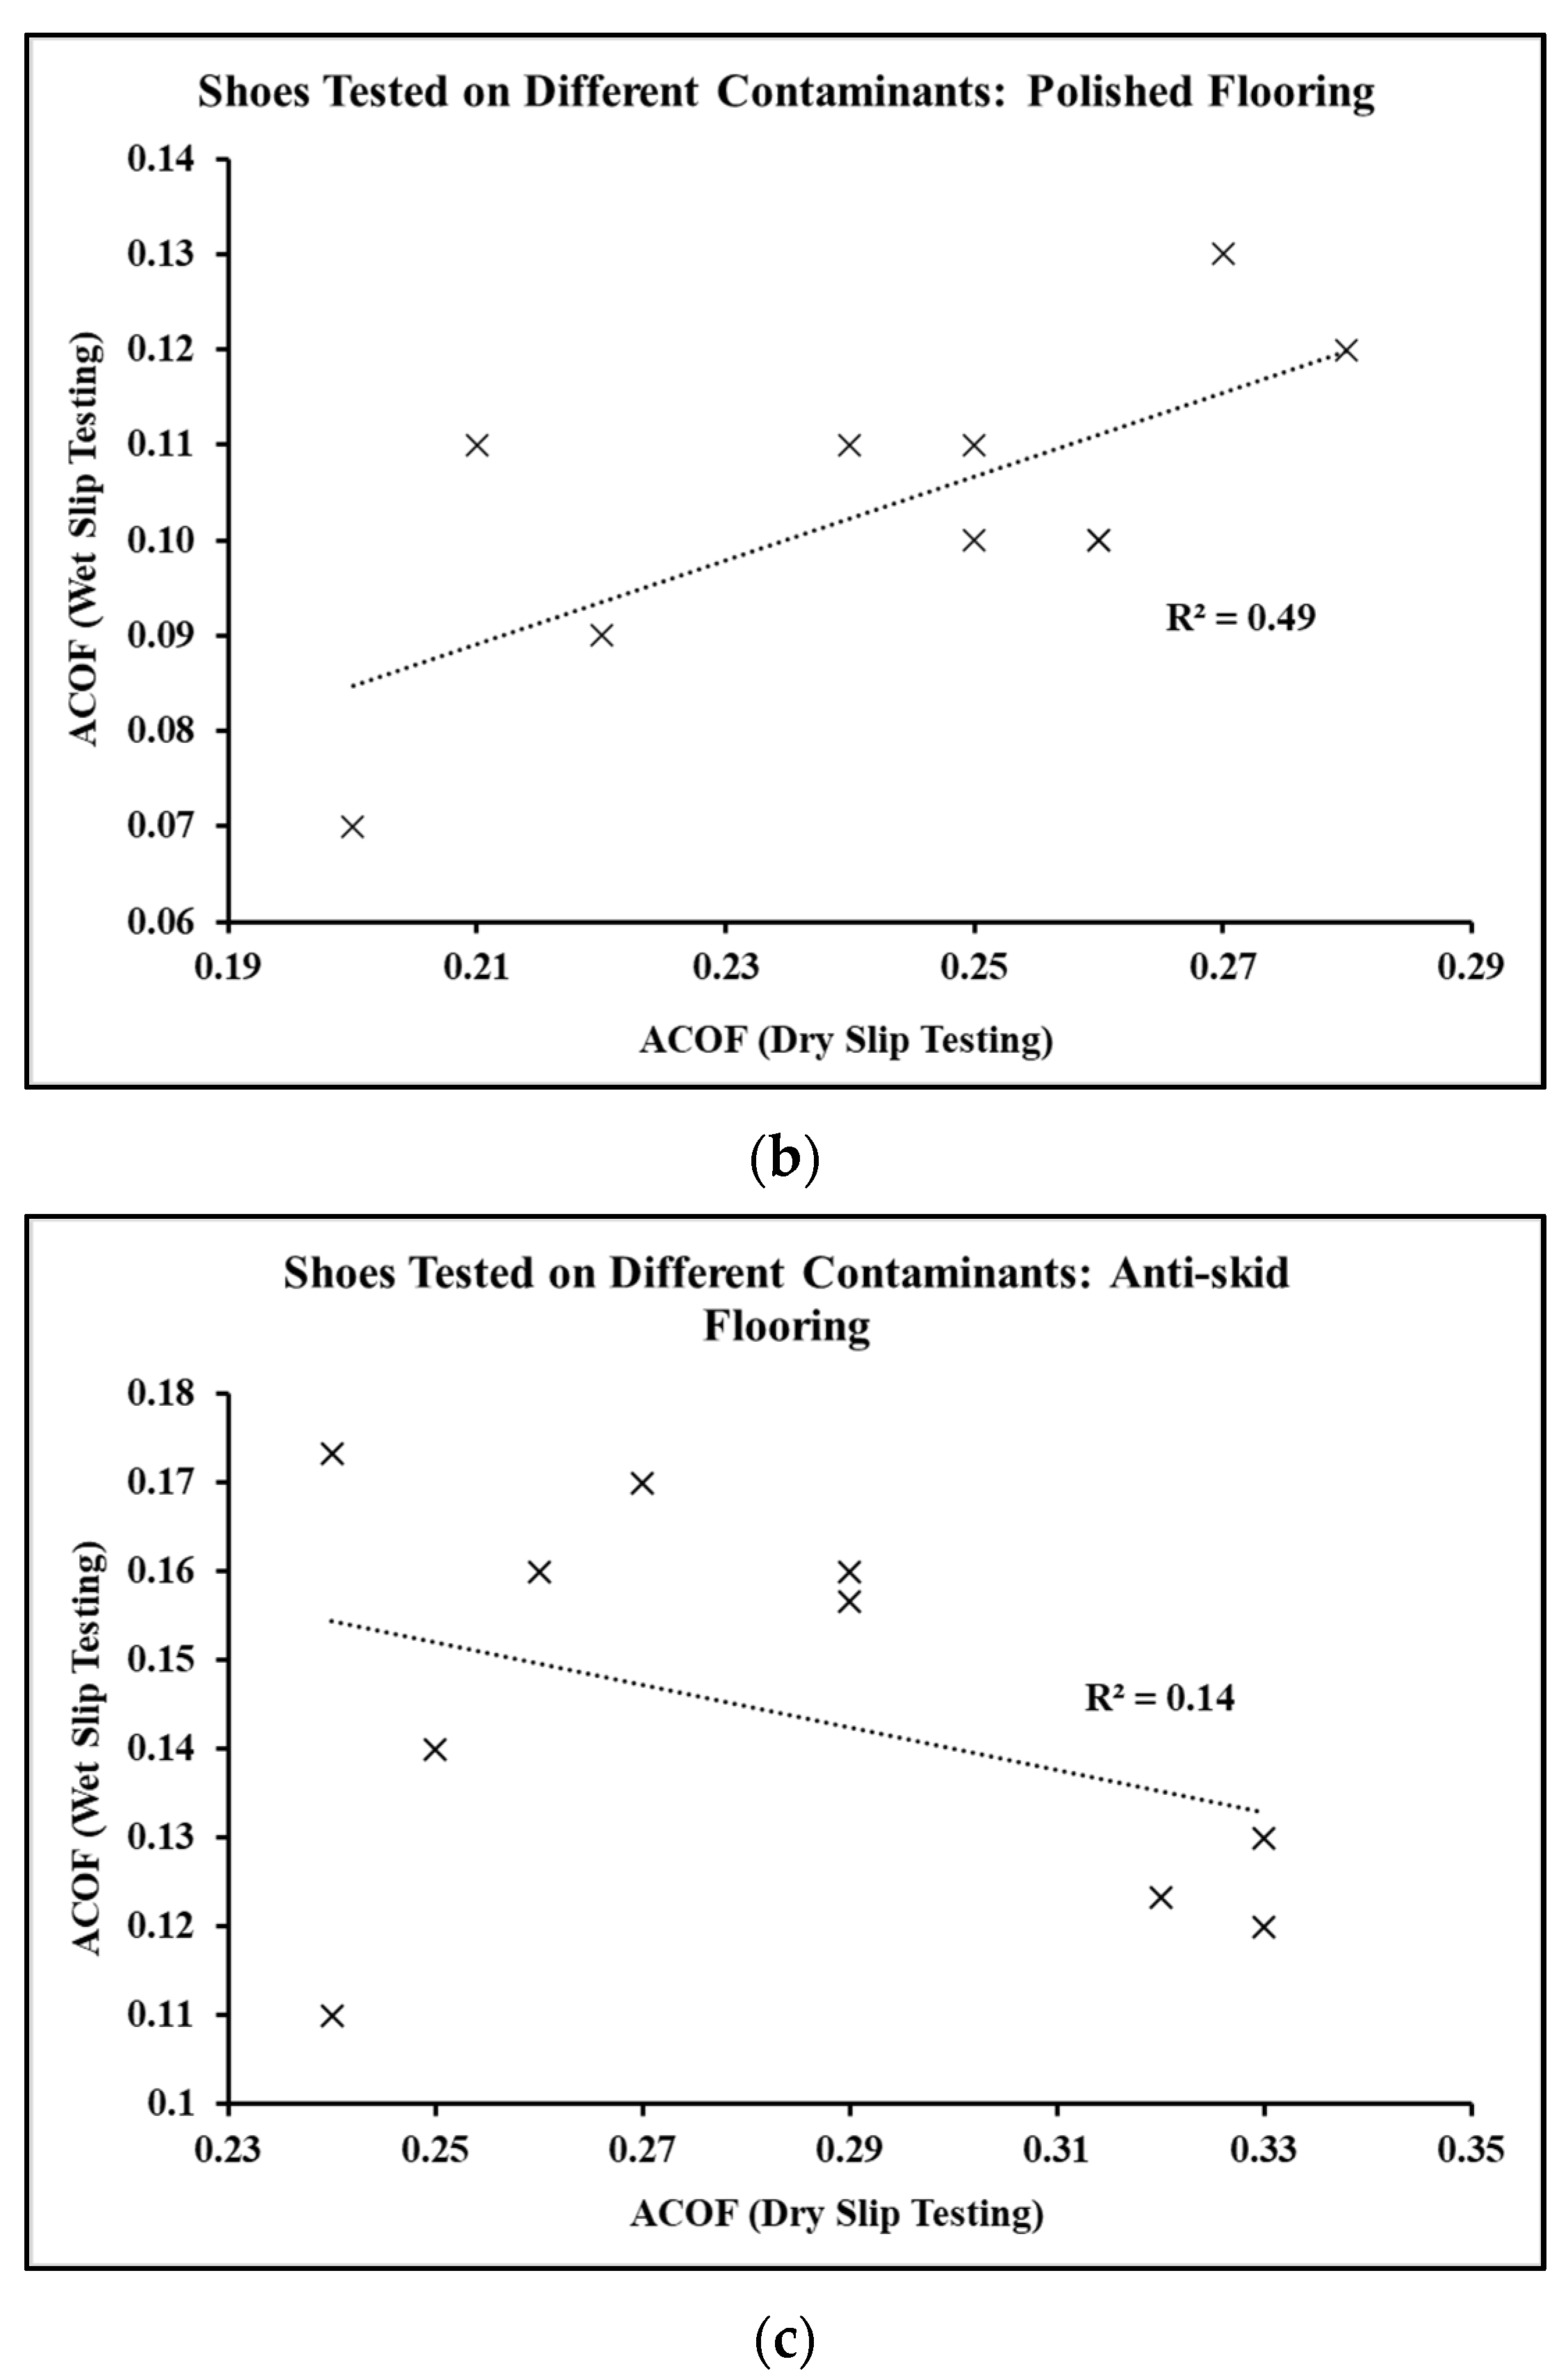
In this section, the percentage differences in the ACOF are presented for each shoe (i.e., S1–S10) with two different contaminant conditions (i.e., dry vs. wet), for both polished and anti-skid floorings. This test was performed to determine the ability of the slip tester to differentiate between two contaminant conditions for the same shoe and flooring. Across the dry and wet flooring conditions, the ACOF of any shoe varied significantly. Between these two conditions on the polished flooring, the ACOF of shoe S1 exhibited 57% difference, S2 exhibited 61% difference, S3 exhibited 65% difference, S4 exhibited 56% difference, S5 exhibited 47% difference, S6 exhibited 52% difference, S7 exhibited 60% difference, S8 exhibited 61% difference, S9 exhibited 59% difference, and S10 exhibited 54% difference. Overall, the difference ranged between 47 and 65% (Figure 10a). In addition, the correlation of the ACOF of the shoes between the two contaminants was estimated to be 0.49 (Figure 10b).
Between the dry and wet flooring conditions on the anti-skid flooring, the ACOF of shoe S1 showed 45% difference, S2 showed 61% difference, S3 showed 28% difference, S4 showed 46% difference, S5 showed 44% difference, S6 showed 37% difference, S7 showed 61% difference, S8 showed 64% difference, S9 showed 54% difference, and S10 showed 38% difference. Overall, the difference ranged between 28 and 64% (Figure 10a). In addition, the correlation of the ACOF of the shoes between the two contaminants was estimated to be 0.14 (Figure 10c). The high difference in the ACOF measured between the two contaminants for any shoe and the low correlation of the ACOF of the shoes between the two contaminants indicate the ability of the slip tester to differentiate shoes tested with different contaminants.

4. Discussions

This work presented the development and detailed performance validation of a novel portable slip tester. The overall cost to develop the slip tester was under USD 850. The developed device was considered a low-weight device compared to the most widely used biofidelic slip testing device (i.e., SATRA STM 603). The overall weight of the SATRA STM 603 is 250 kg, which is significantly higher than the device presented in our research (i.e., 75 kg including batteries). Hence, in this context, the developed device was mentioned as being low-weight. In the current work, the applied vertical load was supported by the device’s weight including the batteries. These batteries (weighing approximately 60 kg) were detachable and transported separately while moving the device from one location to another, and were installed only during device operation.
The slip testing across different footwears indicated that the slip tester was reliable in differentiating between the footwears under similar slipping conditions. The slip testing of the shoes on smooth flooring (i.e., polished flooring) showed a lower ACOF compared to the rough flooring (anti-skid flooring) across dry and wet slipping conditions. Only a few footwears were able to cross the threshold of 0.3, above which, the risk of slips and falls reduces significantly. The results are in-line with the typical ACOF outcomes observed in footwear that are not labelled as slip-resistant [13]. Out of all the footwears, only one showed similar performance on both floorings in the dry slip testing, which could be due to the presence of untreaded region over the heel region. Overall, the device exhibited 5% to 35% difference in the ACOF across shoes, when tested on four different slippery conditions. The high difference in the ACOF and the insignificant correlations confirmed that the slip tester was able to differentiate between the shoes when tested in similar slippery conditions.
The slip testing outcomes across the shoes tested on different floorings exhibited high differences in the ACOF. The differences in the ACOF across the floorings could be due to contributing factors based on surface roughness (i.e., hysteresis friction) [17,36]. When validating the ability of the slip tester to differentiate between the shoes when tested across dry and wet flooring conditions, high differences in the ACOF were again observed. This could be due to the formation of hydrodynamic fluid films during the wet slip testing compared to the absence of films in the dry slip testing. Insignificant correlations of the ACOF of the shoes between the contaminants, tested on both floorings, and high percentage differences in the ACOF ranges were reported. Hence, the developed slip tester was able to capture the differences between the floorings and the contaminants.
A few limitations of this work should be acknowledged. Only a few shoe designs were tested on the two floorings under dry and wet conditions. The normal force was coded to be in the range of 500 ± 25 N. The maximum vertical load that the device could simulate accurately was 600 N. Above 600 N, the device experienced increased vibrations, which could affect the overall friction measurements. In addition, a constant slipping speed of 0.5 m/s was employed, and the effect of lower or higher slipping speeds on footwear friction was not studied. In our future work, the effects of higher normal forces, lower slipping speeds, and higher angles on footwear friction will also be investigated. Batteries of lower weights will be chosen for ease of transportation of the device for field testing and better portability. Another study limitation is the exclusion of effects of human sensory response on the biomechanical parameters during slipping. In future, studying the effects of real-time human sensory response on the biomechanical parameters during slipping and upgrading the device with the same parameters could increase the overall accuracy in the quantification of slip and fall risks.

5. Conclusions

In conclusion, the developed low-cost slip testing device was found to conform to the biomechanical parameters of previous studies, i.e., it was able to simulate the normal load, slipping velocity, and heel angle observed during human slipping experiments. The average ACOF of the 10 tested shoes ranged from 0.20 to 0.33 in the dry slip testing and 0.07 to 0.17 in the wet slip testing across both floorings. Through a range of tests and statistical analysis, the slip tester was observed to generate repeatable results (R2 > 0.90). The ACOF differences across over 95% of the shoes in the four different flooring-contaminant conditions ranged from 5% to 35%, indicating that the slip tester was able to clearly differentiate shoes tested under the similar slippery conditions. Under the wet condition, the difference recorded for the ACOF of any shoe between two floorings ranged between 20% and 91%, indicating the ability of the slip tester to differentiate shoes tested on different floorings. For the same flooring, the difference recorded for the ACOF of any shoe between the two contaminant conditions ranged from 28% to 64%, indicating the ability of the slip tester to differentiate shoes tested with different contaminants. Overall, the developed slip tester was compact, i.e., having dimensions of 0.65 m in length, 0.25 m in width, and 0.6 m in height, had a light structural weight of 15 kg, was portable, and was able to quantify the shoe-surface traction with a higher accuracy. As the world’s footwear market size is more than USD 350 billion with an annual growth rate of more than 4.2%, this device is anticipated to significantly impact several categories of footwear, such as athletic and non-athletic footwears across different age groups. This latest biofidelic traction testing device is also expected to impact the clinical, industrial, and commercial traction performance testing of slip resistant and non-slip resistant footwears, which could help hospital staff, industrial workers, and workplace staff mitigate the risk of slips and falls. The low-cost, low-weight, and portable construction of this device will allow for field testing of specialized footwears on realistic contaminated floorings, such as oil and food spills on the kitchen floorings of hotels, greasy floorings in the heavy oil, gas, and manufacturing industries, and wet floorings after cleaning in commercial buildings, hospitals, and multi-national companies, with provision for slip- and fall-related workers’ compensation. Furthermore, in low- or middle-income countries, where the prevalence of these accidents are high and there is limited awareness regarding slip testing, local footwear manufacturers can use this device to enhance the safety of their footwears and also their credibility. Additionally, this device would be indispensable for promoting further research on footwear safety, for understanding the effect of shoe wear, and in the design of advanced slip resistant footwear treads for sports applications.

Author Contributions

S.G.: methodology; validation; investigation; formal analysis; writing—original draft; and writing—review and editing. A.M.: methodology; design; fabrication; validation; investigation; and formal analysis. S.C.: methodology; data curation; formal analysis; and investigation. A.C.: conceptualization; methodology; formal analysis; supervision; and writing—review and editing. All authors have read and agreed to the published version of the manuscript.

Funding

We would like to acknowledge the funding support received from SERB-DST and IRD, IIT Delhi.

Institutional Review Board Statement

Not applicable.

Informed Consent Statement

Not applicable.

Data Availability Statement

The datasets generated and/or analyzed in the current study are not publicly available because they are large datasets but are available from the corresponding author upon reasonable request.

Conflicts of Interest

The authors declare no conflict of interest.

References

  1. U.S. Bureau of Labor Statistics. Number of Nonfatal Occupational Injuries and Illnesses Involving Days Away from Work by Industry and Selected Events or Exposures Leading to Injury or Illness, Private Industry. 2020. Available online: https://www.cdc.gov/niosh/topics/violence/fastfacts.html (accessed on 13 April 2022).
  2. Layne, L.A.; Pollack, K.M. Nonfatal occupational injuries from slips, trips, and falls among older workers treated in hospital emergency departments, United States 1998. Am. J. Ind. Med. 2004, 46, 32–41. [Google Scholar] [CrossRef] [PubMed]
  3. Luo, G.; Stefanyshyn, D. Identification of critical traction values for maximum athletic performance. Footwear Sci. 2011, 3, 127–138. [Google Scholar] [CrossRef]
  4. Berg, W.P.; Alessio, H.M.; Mills, E.M.; Tong, C. Circumstances and consequences of falls in independent community-dwelling older adults. Age Ageing 1997, 26, 261–268. [Google Scholar] [CrossRef] [PubMed] [Green Version]
  5. Bell, J.L.; Collins, J.W.; Wolf, L.; Gronqvist, R.; Chiou, S.; Chang, W.R.; Sorock, G.S.; Courtney, T.K.; Lombardi, D.A.; Evanoff, B. Evaluation of a comprehensive slip, trip and fall prevention programme for hospital employees. Ergonomics 2009, 51, 1906–1925. [Google Scholar] [CrossRef] [PubMed]
  6. Campbell, A.J.; Borrie, M.J.; Spears, G.F.; Jackson, S.L.; Brown, J.S.; Fitzgerald, J.L. Circumstances and Consequences of Falls Experienced by a Community Population 70 Years and over during a Prospective Study. Age Ageing 1990, 19, 136–141. [Google Scholar] [CrossRef]
  7. Gupta, S.; Chatterjee, S.; Chanda, A. Effect of footwear material wear on slips and falls. Mater Today Proc. 2022, 62, 3508–3515. [Google Scholar] [CrossRef]
  8. Iraqi, A.; Beschorner, K.E. Vertical ground reaction forces during unexpected human slips. Proc. Hum. Factors Ergon. Soc. 2017, 61, 924–928. [Google Scholar] [CrossRef]
  9. Chang, W.R.; Grönqvist, R.; Leclercq, S.; Myung, R.; Makkonen, L.; Strandberg, L.; Brungraber, R.J.; Mattke, U.; Thorpe, S.C. The role of friction in the measurement of slipperiness, Part 1: Friction mechanisms and definition of test conditions. Ergonomics 2010, 44, 1217–1232. [Google Scholar] [CrossRef]
  10. Beschorner, K.E.; Redfern, M.S.; Porter, W.L.; Debski, R.E. Effects of slip testing parameters on measured coefficient of friction. Appl. Ergon. 2007, 38, 773–780. [Google Scholar] [CrossRef]
  11. Iraqi, A.; Cham, R.; Redfern, M.S.; Beschorner, K.E. Coefficient of friction testing parameters influence the prediction of human slips. Appl. Ergon. 2018, 70, 118–126. [Google Scholar] [CrossRef]
  12. Iraqi, A.; Vidic, N.S.; Redfern, M.S.; Beschorner, K.E. Prediction of coefficient of friction based on footwear outsole features. Appl. Ergon. 2020, 82, 102963. [Google Scholar] [CrossRef] [PubMed]
  13. Chanda, A.; Jones, T.G.; Beschorner, K.E. Generalizability of Footwear Traction Performance across Flooring and Contaminant Conditions. IISE Trans. Occup. Ergon. Hum. Factors 2018, 6, 98–108. [Google Scholar] [CrossRef] [PubMed]
  14. Chatterjee, S.; Chanda, A. Development of a Tribofidelic Human Heel Surrogate for Barefoot Slip Testing. J. Bionic. Eng. 2022, 19, 429–439. [Google Scholar] [CrossRef]
  15. Deshpande, N.; Metter, E.J.; Lauretani, F.; Bandinelli, S.; Guralnik, J.; Ferrucci, L. Activity restriction induced by fear of falling and objective and subjective measures of physical function: A prospective cohort study. J. Am. Geriatr. Soc. 2011, 26, 1805–1810. [Google Scholar] [CrossRef]
  16. Chatterjee, S.; Gupta, S.; Chanda, A. Barefoot slip risk assessment of Indian manufactured ceramic flooring tiles. Mater. Today Proc. 2022, 62, 3699–3706. [Google Scholar] [CrossRef]
  17. Jones, T.; Iraqi, A.; Beschorner, K. Performance testing of work shoes labeled as slip resistant. Appl. Ergon. 2018, 68, 304–312. [Google Scholar] [CrossRef]
  18. Meehan, E.E.; Vidic, N.; Beschorner, K.E. In contrast to slip-resistant shoes, fluid drainage capacity explains friction performance across shoes that are not slip-resistant. Appl. Ergon. 2022, 100, 103663. [Google Scholar] [CrossRef]
  19. Yamaguchi, T.; Katsurashima, Y.; Hokkirigawa, K. Effect of rubber block height and orientation on the coefficients of friction against smooth steel surface lubricated with glycerol solution. Tribol. Int. 2017, 110, 96–102. [Google Scholar] [CrossRef]
  20. Hemler, S.L.; Charbonneau, D.N.; Beschorner, K.E. Effects of Shoe Wear on Slipping-Implications for Shoe Replacement Threshold. Proc. Hum. Factors Ergon. Soc. Annu. Meet. 2017, 61, 1424–1428. [Google Scholar] [CrossRef]
  21. Sundaram, V.H.; Hemler, S.L.; Chanda, A.; Haight, J.M.; Redfern, M.S.; Beschorner, K.E. Worn region size of shoe outsole impacts human slips: Testing a mechanistic model. J. Biomech. 2020, 105, 109797. [Google Scholar] [CrossRef]
  22. Chang, W.R.; Grönqvist, R.; Leclercq, S.; Brungraber, R.J.; Mattke, U.; Strandberg, L.; Thorpe, S.C.; Myung, R.; Makkonen, L.; Courtney, T.K. The role of friction in the measurement of slipperiness, Part 2, Survey of friction measurement devices. Ergonomics 2001, 44, 1233–1261. [Google Scholar] [CrossRef] [PubMed]
  23. Chang, W.R.; Lesch, M.F.; Chang, C.C. The effect of contact area on friction measured with the portable inclinable articulated strut slip tester (PIAST). Ergonomics 2009, 51, 1984–1997. [Google Scholar] [CrossRef] [PubMed]
  24. Bergström, A.; Åström, H.; Magnusson, R. Friction Measurement on Cycleways Using a Portable Friction Tester. J. Cold Reg. Eng. 2003, 17, 37–57. [Google Scholar] [CrossRef]
  25. Andres, R.O.; Chaffin, D.B. Ergonomic analysis of slip-resistance measurement devices. Ergonomics 2007, 28, 1065–1079. [Google Scholar] [CrossRef]
  26. Grönqvist, R.; Roine, J.; Järvinen, E.; Korhonen, E. An apparatus and a method for determining the slip resistance of shoes and floors by simulation of human foot motions. Ergonomics 2007, 32, 979–995. [Google Scholar] [CrossRef]
  27. Blanchette, M.G.; Powers, C.M. The influence of footwear tread groove parameters on available friction. Appl. Ergon. 2015, 50, 237–241. [Google Scholar] [CrossRef]
  28. Beschorner, K.E.; Iraqi, A.; Redfern, M.S.; Cham, R.; Li, Y. Predicting slips based on the STM 603 whole-footwear tribometer under different coefficient of friction testing conditions. Ergonomics 2019, 62, 668–681. [Google Scholar] [CrossRef]
  29. Beschorner, K.E.; Chanda, A.; Moyer, B.E.; Reasinger, A.; Griffin, S.C.; Johnston, I.M. Validating the ability of a portable shoe-floor friction testing device, NextSTEPS, to predict human slips. Appl. Ergon. 2023, 106, 103854. [Google Scholar] [CrossRef]
  30. Shibata, K.; Abe, S.; Yamaguchi, T.; Hokkirigawa, K. Development of a Cart-type Friction Measurement Device for Evaluation of Slip Resistance of Floor Sheets. J. JAPAN Soc. Des. Eng. 2016, 51, 721–736. [Google Scholar] [CrossRef]
  31. Yamaguchi, T.; Yamada, R.; Warita, I.; Shibata, K.; Ohnishi, A.; Sugama, A.; Hinoshita, M.; Sakauchi, K.; Matsukawa, S.; Hokkirigawa, K. Relationship between slip angle in ramp test and coefficient of friction values at shoe-floor interface measured with cart-type friction measurement device. J. Biomech. Sci. Eng. 2018, 13, 17–00389. [Google Scholar] [CrossRef]
  32. Aschan, C.; Hirvonen, M.; Mannelin, T.; Rajamäki, E. Development and validation of a novel portable slip simulator. Appl. Ergon. 2005, 36, 585–593. [Google Scholar] [CrossRef] [PubMed]
  33. Albert, D.; Moyer, B.; Beschorner, K.E. Three-Dimensional Shoe Kinematics During Unexpected Slips: Implications for Shoe–Floor Friction Testing. Ergonomics 2016, 5, 1–11. [Google Scholar] [CrossRef]
  34. Keshan, H.; Thornburg, J.; Ustun, T.S. Comparison of lead-Acid and lithium ion batteries for stationary storage in off-grid energy systems. IET Conf. Publ. 2016, 2016, 1–7. [Google Scholar] [CrossRef]
  35. Yuan, Q.; Chen, I.M. Localization and velocity tracking of human via 3 IMU sensors. Sens. Actuators A Phys. 2014, 212, 25–33. [Google Scholar] [CrossRef]
  36. Moghaddam, S.R.M.; Hemler, S.L.; Redfern, M.S.; Jacobs, T.D.B.; Beschorner, K.E. Computational model of shoe wear progression: Comparison with experimental results. Wear 2019, 422–423, 235–241. [Google Scholar] [CrossRef]
Figure 1. The developed portable slip testing device.
Surfaces 05 00036 g001
Figure 2. Horizontal motion assembly.
Surfaces 05 00036 g002
Figure 3. Vertical motion and angle adjustment assembly.
Surfaces 05 00036 g003
Figure 4. Shoe test sample used for the validation of normal load and IMU.
Surfaces 05 00036 g004
Figure 5. Variations in normal load.
Surfaces 05 00036 g005
Figure 6. Validation of speed results generated using IMU.
Surfaces 05 00036 g006
Figure 7. Repeatability of slip tester in: (a) dry condition, and (b) wet condition.
Surfaces 05 00036 g007
Figure 8. The ACOF of shoes in (a) dry condition and (b) wet condition. Percentage difference in the ACOF of shoes tested against (c) Shoe 1 on dry polished flooring, (d) Shoe 6 on wet polished flooring, (e) Shoe 7 on dry anti-skid flooring, and (f) Shoe 7 on wet anti-skid flooring.
Surfaces 05 00036 g008aSurfaces 05 00036 g008b
Figure 9. Ability of the slip tester to differentiate shoes tested on different floorings in terms of (a) percentage difference in the ACOF between floorings, (b) correlation of the ACOF of shoes between floorings in dry condition, and (c) correlation of the ACOF of shoes between floorings in wet condition.
Surfaces 05 00036 g009aSurfaces 05 00036 g009b
Figure 10. Ability of the slip tester to differentiate shoes tested on different contaminants in terms of (a) percentage difference in the ACOF between contaminants, (b) correlation of the ACOF of shoes between contaminants tested on polished flooring, and (c) correlation of the ACOF of shoes between contaminants tested on anti-skid flooring.
Surfaces 05 00036 g010aSurfaces 05 00036 g010b
Publisher’s Note: MDPI stays neutral with regard to jurisdictional claims in published maps and institutional affiliations.