Article

Traction Performance of Common Formal Footwear on Slippery Surfaces

1
Centre for Biomedical Engineering (CBME), Indian Institute of Technology (IIT), Delhi 110016, India
2
Department of Biomedical Engineering, All India Institute of Medical Sciences (AIIMS), Delhi 110029, India
*
Author to whom correspondence should be addressed.
Surfaces 2022, 5(4), 489-503; https://doi.org/10.3390/surfaces5040035
Submission received: 26 August 2022 / Revised: 4 November 2022 / Accepted: 9 November 2022 / Published: 17 November 2022
(This article belongs to the Collection Featured Articles for Surfaces)

Abstract

:
Traumatic injuries caused due to slipping and falling are prevalent in India and across the globe. These injuries not only hamper quality of life but are also responsible for huge economic and compensation burdens. Unintentional slips usually occur due to inadequate traction between the shoe and floor. Due to the economic conditions in low and middle-income countries, the public tends to buy low-cost footwear as an alternative to costly slip-resistant shoes. In this study, ten high-selling formal shoes under $25 were considered. These shoes were tested on three commonly available dry floorings and across contaminated common floor surfaces (i.e., water and floor cleaners). The traction performance of the shoes was quantified by using a biofidelic slip tester. The majority of formal shoes were not found to produce the slip-resistant performance across common slippery surfaces. Shoes with softer outsoles exhibited increased slip-resistant performance (R2 = 0.91). Shoe outsoles with less-to-no treads at the heel region showed poor traction performance as compared to other shoes. The apparent contact area was found as an important metric influencing the slip risks in dry and wet slipping conditions (R2 = 0.88). This research is anticipated to help the public and footwear manufacturers select safer shoes to reduce slip-and-fall incidents.

1. Introduction

Slips and falls in the workplace are a serious contributor to both fatal and non-fatal injuries worldwide [1]. Injuries caused by unintentional slips or falls in the workplace can lead to several severe traumatic incidents, such as fractures, dislocations, and soft tissue damage [2,3,4]. Across all low and middle-income countries, India accounts for over 60% of slips and fall-related cases and reports 100,000 annual deaths [5]. Furthermore, slips and falls a showed high prevalence among working adults in India [6,7,8,9]. In the U.S., workers usually use more than 15 days of hospital leave each year due to these incidents, which cost an average of $10 billion in worker’s compensation [10,11]. Additionally, in the U.K., around 18% of total deaths are due to slips and falls [12]. Hence, understanding mechanisms which lead to unintentional slips and falls is essential, and this defines the purpose of this work and its significance.
Unintentional slipping is usually affected by a sudden change in traction under the shoe [13]. The probability of slipping increases with a reduction in ACOF [14,15,16]. Traction at the interface between shoe and floor can be quantified by measuring the ACOF (i.e., available coefficient of friction) [17,18]. Quantification of ACOF can be obtained through human slipping trials [19]. Due to ethical and biosafety issues, several slip testing devices have been developed and used to quantify the ACOF [20]. A plethora of slip testers, with a wide variety of operating mechanisms, have been used in the past. Only a few studies have developed and tested a biofidelic slip tester to accurately measure the traction between the shoe and the floor [21,22,23,24,25]. Therefore, to understand the effect of footwear characteristics on under-shoe traction, accurate measurements are necessary.
Footwear features include outsole design [26,27,28,29,30,31], outsole material [32,33], wear [34,35], contact area [36], type of flooring [37], and contaminants (i.e., water and floor cleaner) [34,38,39,40]. Specifically, the presence of external contaminants on different types of flooring drastically affects the ACOF [28,41]. In a study by Chanda et al. [42], twelve slip-resistant shoes and five non-slip-resistant shoes were tested on three floorings, and reported generalizable trends across the shoes tested in fluid contaminant conditions. In another study by Jones et al. [43], a drastic reduction in the traction performance of work shoes was observed in the presence of viscous contaminants. These studies included several types of American footwear styles, such as, casual, athletic, and safety footwear. However, to the best of our knowledge, no such work has quantified the effect of common floorings and contaminants on popular and low-cost Indian formal shoes.
In this work, ten popular and low-cost pieces of Indian formal footwear were selected for this study. A novel biofidelic and portable slip testing device was used to quantify the ACOF of these shoes. Shoes were tested across three commonly observed floorings (i.e., laminate, matt, ceramic) in dry, water, as well as floor cleaner contaminated conditions. Shoe contact area and shore hardness were quantified to study their influence on footwear traction. Further to this being the first study investigating how footwear design features affect traction in common Indian footwear, key scientific contributions include the characterization of the relative role of tread geometries and apparent contact areas on footwear traction in both rough and smooth floorings. Additionally, the relative contributions of shore hardness and floor roughness on footwear traction were analyzed. Additionally, unique tread geometries with available and missing treads across the heel and their contributions on footwear traction were measured. This work not only provided novel findings, but also confirmed observations between shore hardness and traction, and apparent contact area and traction, as reported in previous studies. This is expected to advance the understanding of the science of footwear traction, and provide guidelines on the selection and development of safer shoes to prevent slips and falls.

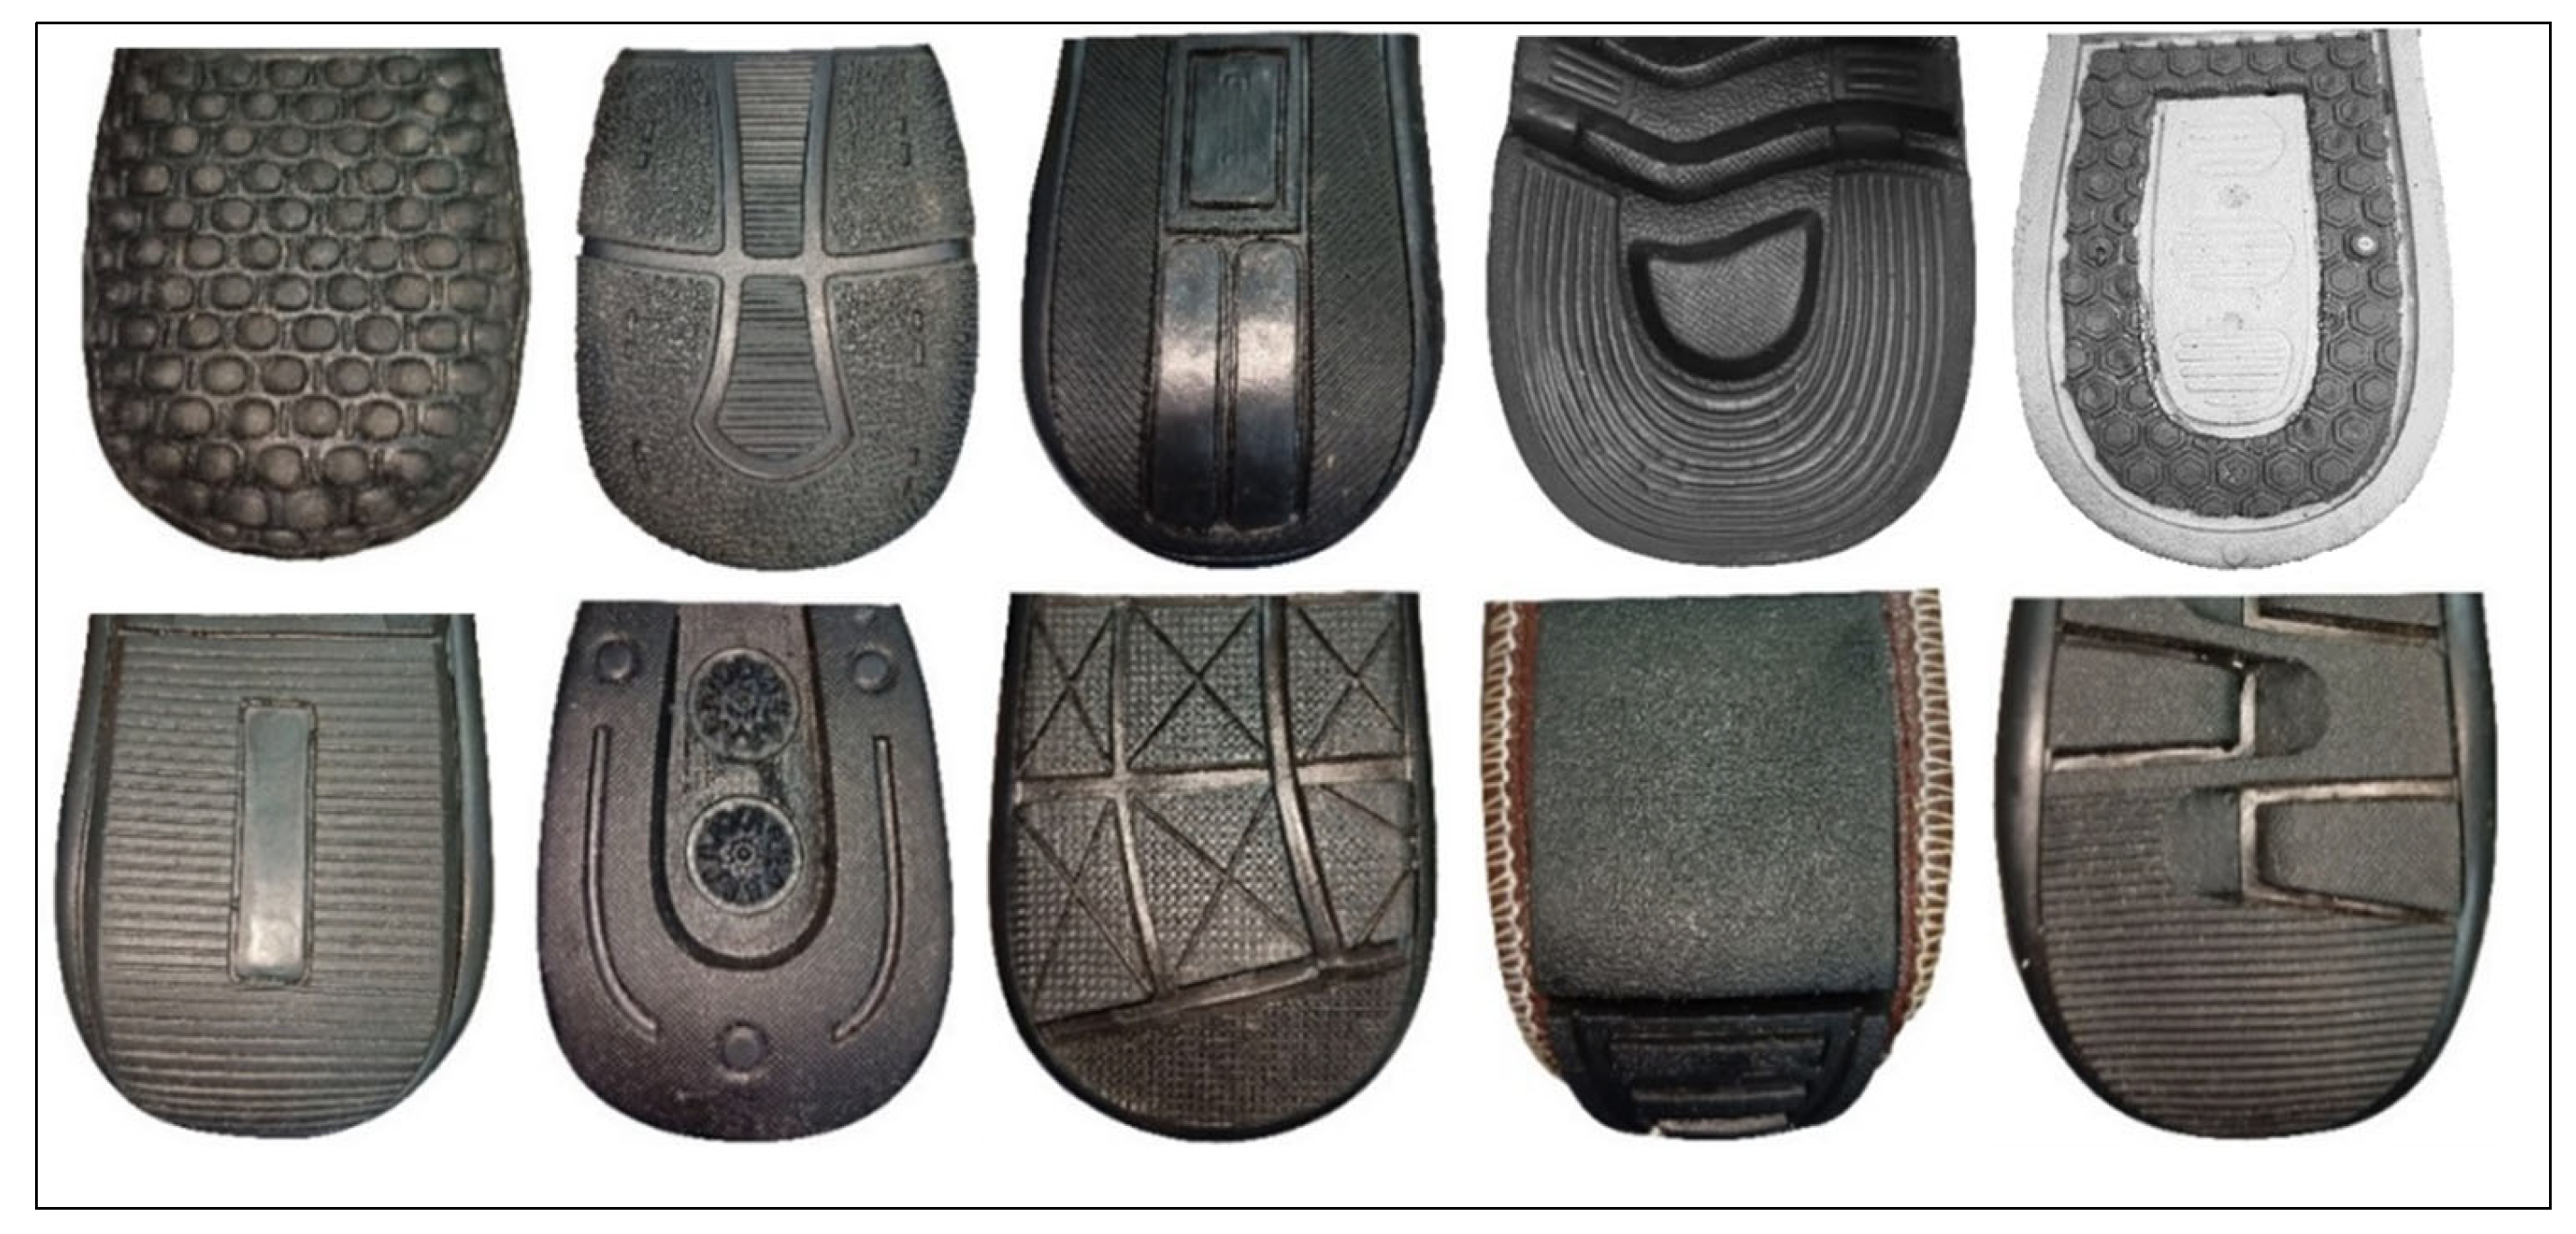
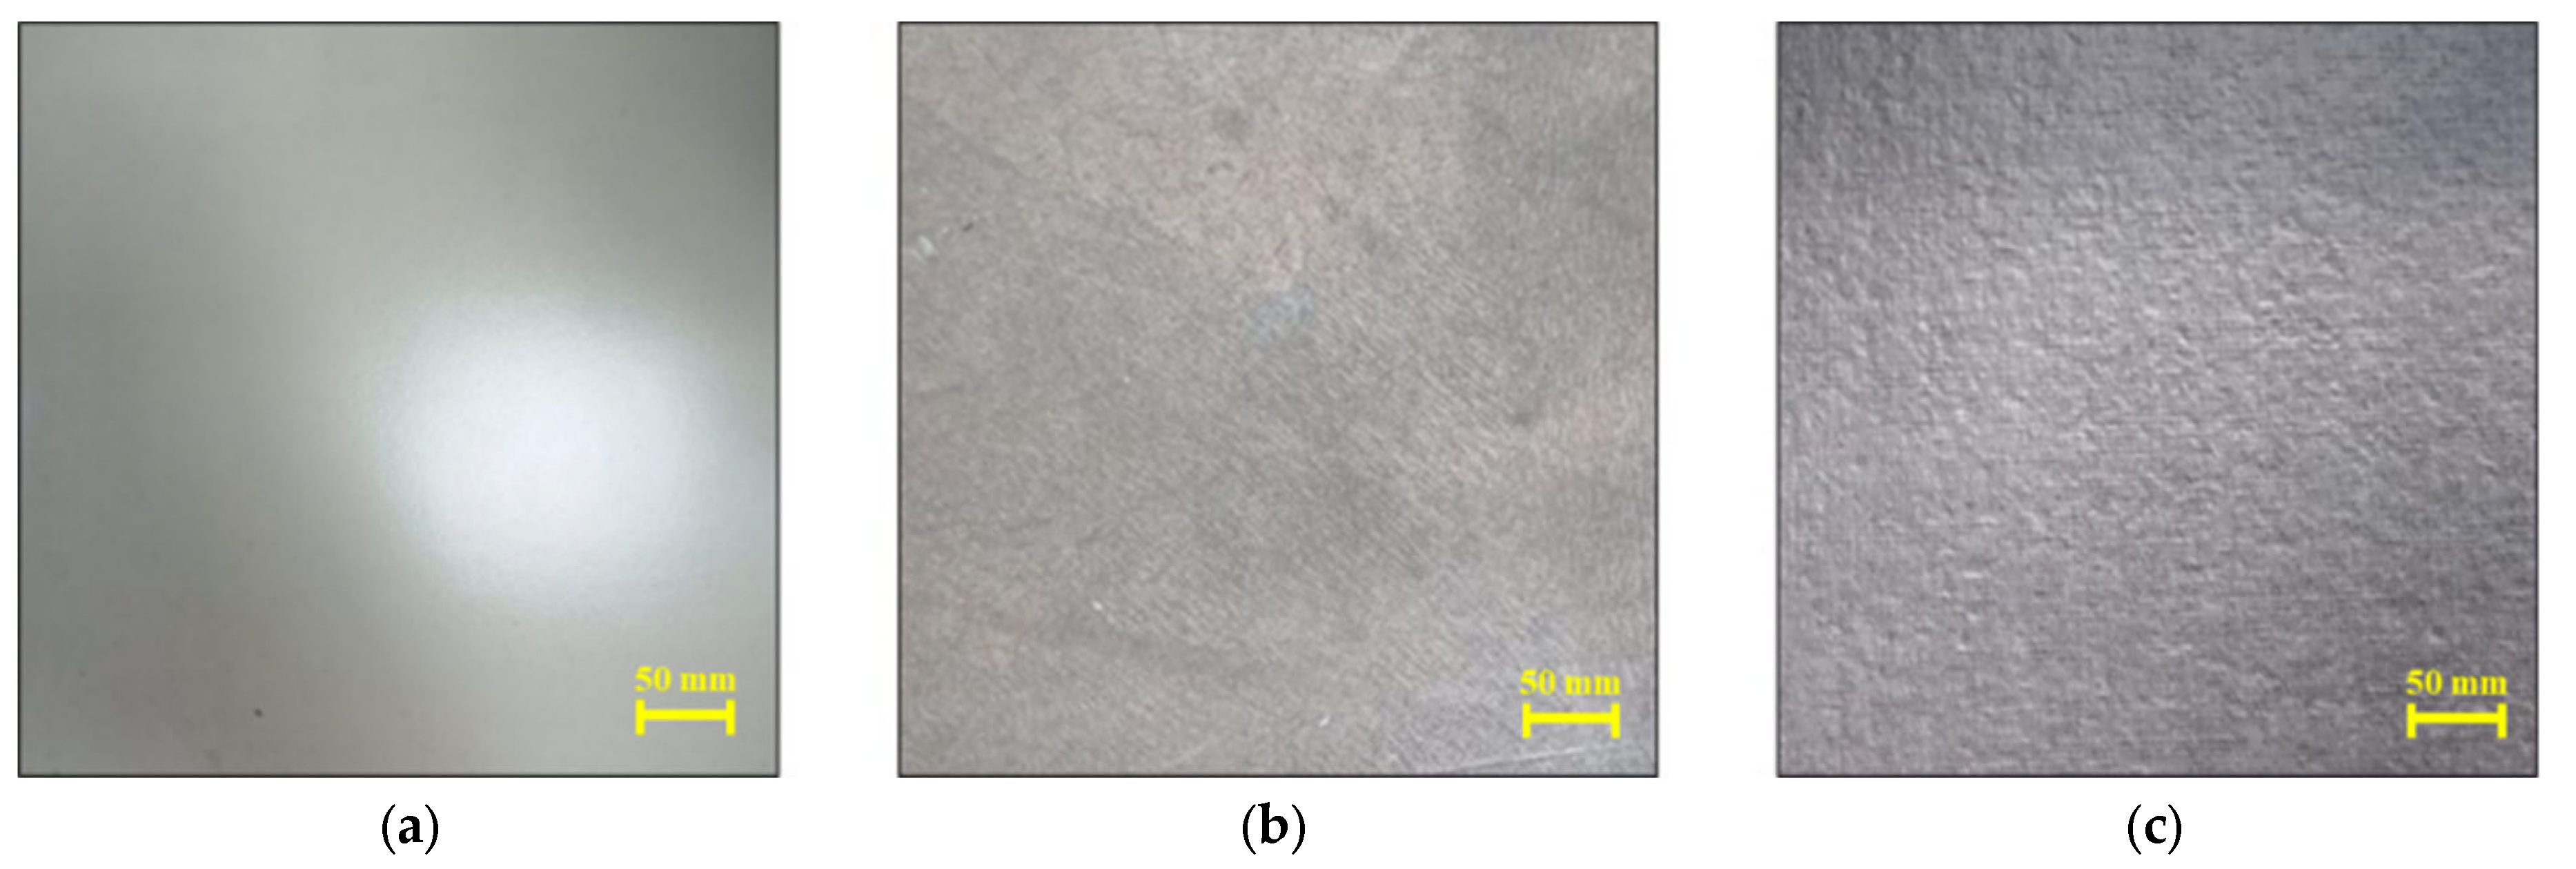
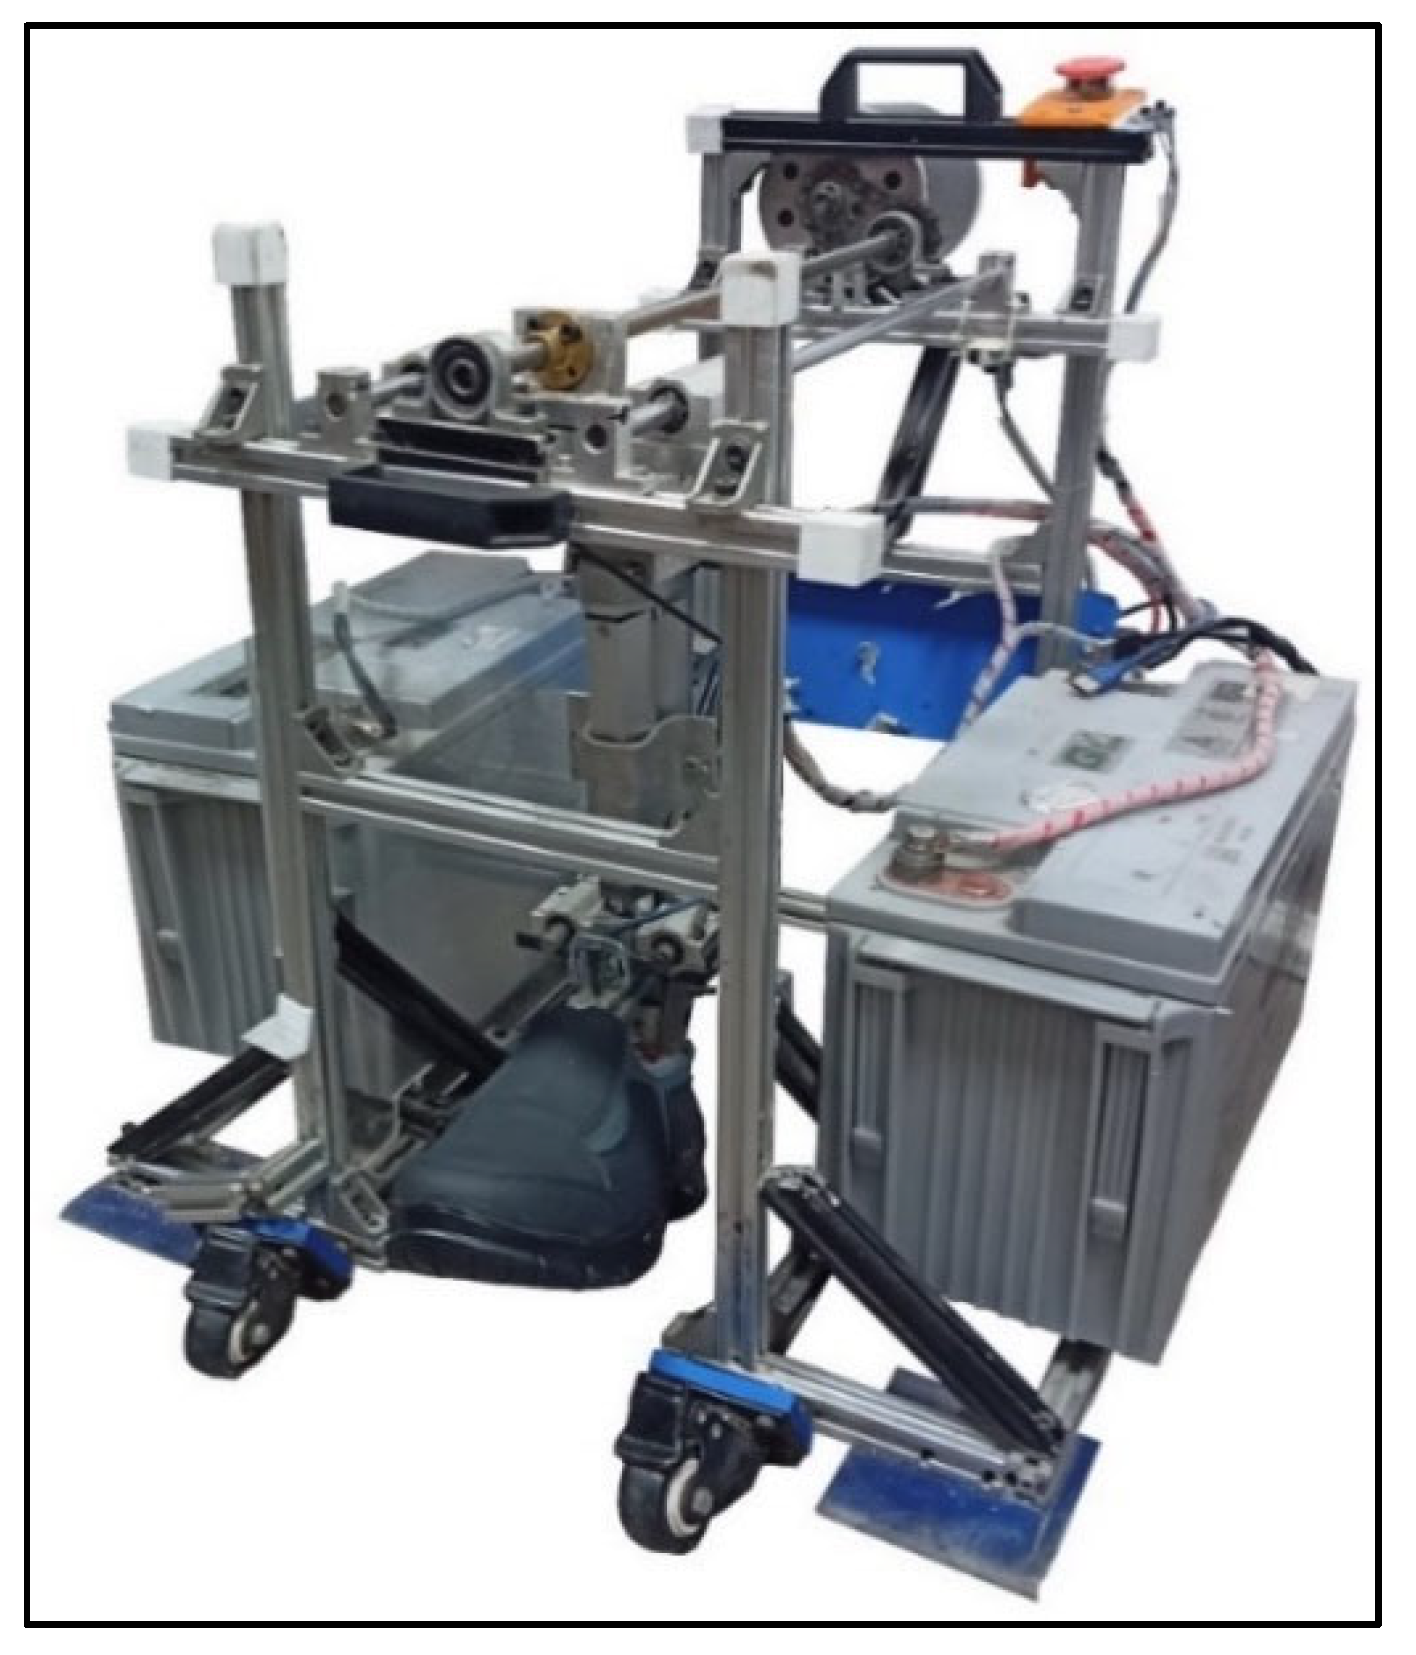
2. Materials and Methods

Indian manufactured formal (i.e., Oxford style) shoes were selected for this pilot study. Ten high selling shoes under Rs. 2000 (~$25), and irrespective of the brand value, were considered. The shoes were of the UK size 8 for men. The selected shoes were named Formal Shoe ‘FS’ (1–10). As observed in previous studies [36,43,44,45], unintentional slips were mostly found to initiate from the heel-strike of the gait cycle. The heel region of the outsole was identified as a significant area to be studied to assess the footwear friction. Figure 1 shows the heel region of selected formal shoes. Shore A hardness of the footwear outsoles was measured at five different locations on the tread patterns at the heel region using a durometer (Precision Instruments, Chennai, India). The five hardness values were then averaged. The shore hardness of the selected formal footwear varied from 47 A to 80 A (Table 1).
The formal shoes were tested on three regular flooring surfaces, namely laminate, matt, and ceramic flooring, which are widely known as smooth, regular, and rough, respectively (Figure 2). The average surface roughness (Ra) of the considered floorings were quantified by a surface profile gauge (Precise Equipment, Chennai, India). Surface roughness of the floorings was tested at five different locations and the resulting roughness values were averaged. The average surface roughness of laminate, matt, and ceramic flooring were Ra = 2.51 µm, Ra = 13.25 µm, and Ra = 28.45 µm, respectively. Furthermore, shoes were tested across three slipping conditions, such as, dry, with water, and with floor cleaner.
The ACOF of shoes were quantified by employing a whole-shoe biofidelic and portable slip risk measurement device (Figure 3). The device was based on the working parameters suggested by ASTM F2913-19 [46]. The shoes were attached to the shoe of the slip tester. To mimic actual slip biomechanics, the slip tester was programed with a slipping velocity (in a horizontal direction) of 0.50 m/s and a stable vertical force of approximately 270 N. Realistic unintentional slips generating from heel-strikes were simulated by applying a slipping angle of 17 ± 2.5° across all the shoes. These parameters were based on previous slip testing studies which incorporated a biofidelic slip tester [47,48,49]. Prior to performing the dry slip tests, the floorings were cleaned using a microfiber cloth. For the contaminated slip testing, 20 mL of floor contaminants was considered to simulate the actual contaminant conditions. Following a rigorous examination of accidental spillage of these contaminants across several locations in a building, the 20 mL metric was chosen. Hence, slip testing experiments to simulate wet slipping conditions were performed by spreading 20 mL of tap water on the floor test area [23]. The flooring was then allowed to dry before the application of floor cleaner for further slip testing experiments. Similar to the wet slipping condition, 20 mL of 100% concentrated floor cleaner (Lysol, Reckitt Benckiser, Slough, UK) was spread throughout the slip testing area. The viscosity of the floor cleaner was 1.25 cP, which was measured using a rheometer (Brookfield AMETEK LVDVE115 with spindle UL/Y, Middleboro, MA, USA). While transitioning from water to floor cleaner, the tiles were first cleaned with a micro-fiber cloth and then allowed to completely dry. After which, the next contaminant, such as floor cleaner, was applied. The testing cycle was then repeated across three selected floorings. Five trials of each test condition were performed and the resulting ACOF was averaged.
The ACOF of the formal shoes were measured by performing slip testing experiments across three contaminants and three floorings. As the real contact area of shoes, when in contact with flooring surfaces, is affected by the hardness of the outsole and the surface roughness of mating solids, the metric used to measure the contact area was named as apparent contact area. A shoe’s apparent contact area was measured by applying a normal load of approximately 270 N over a modeling clay. Furthermore, the calculation of the pressed area was obtained by importing the figures of the clay mold to a 3D CAD software (SolidWorks 2020, Dassault Systèmes, Vélizy-Villacoublay, France). Topographical features of the footwear outsoles were then analyzed by creating separate planes over the clay mold images. A similar approach was considered in a recent study by Hemler et al. [50], in which different slip-resistant shoes were placed in a rectangular container containing liquid silicone and left to dry. After the curing was completed, the contact areas were manually measured. The quality of correlations between apparent contact area, shore hardness, and ACOF were described using the coefficient of determination (R2). Correlations were considered insignificant (or low) if below 0.5; moderate if between 0.5 and 0.7; and high (or strong) for R2 values higher than 0.7.

3. Results

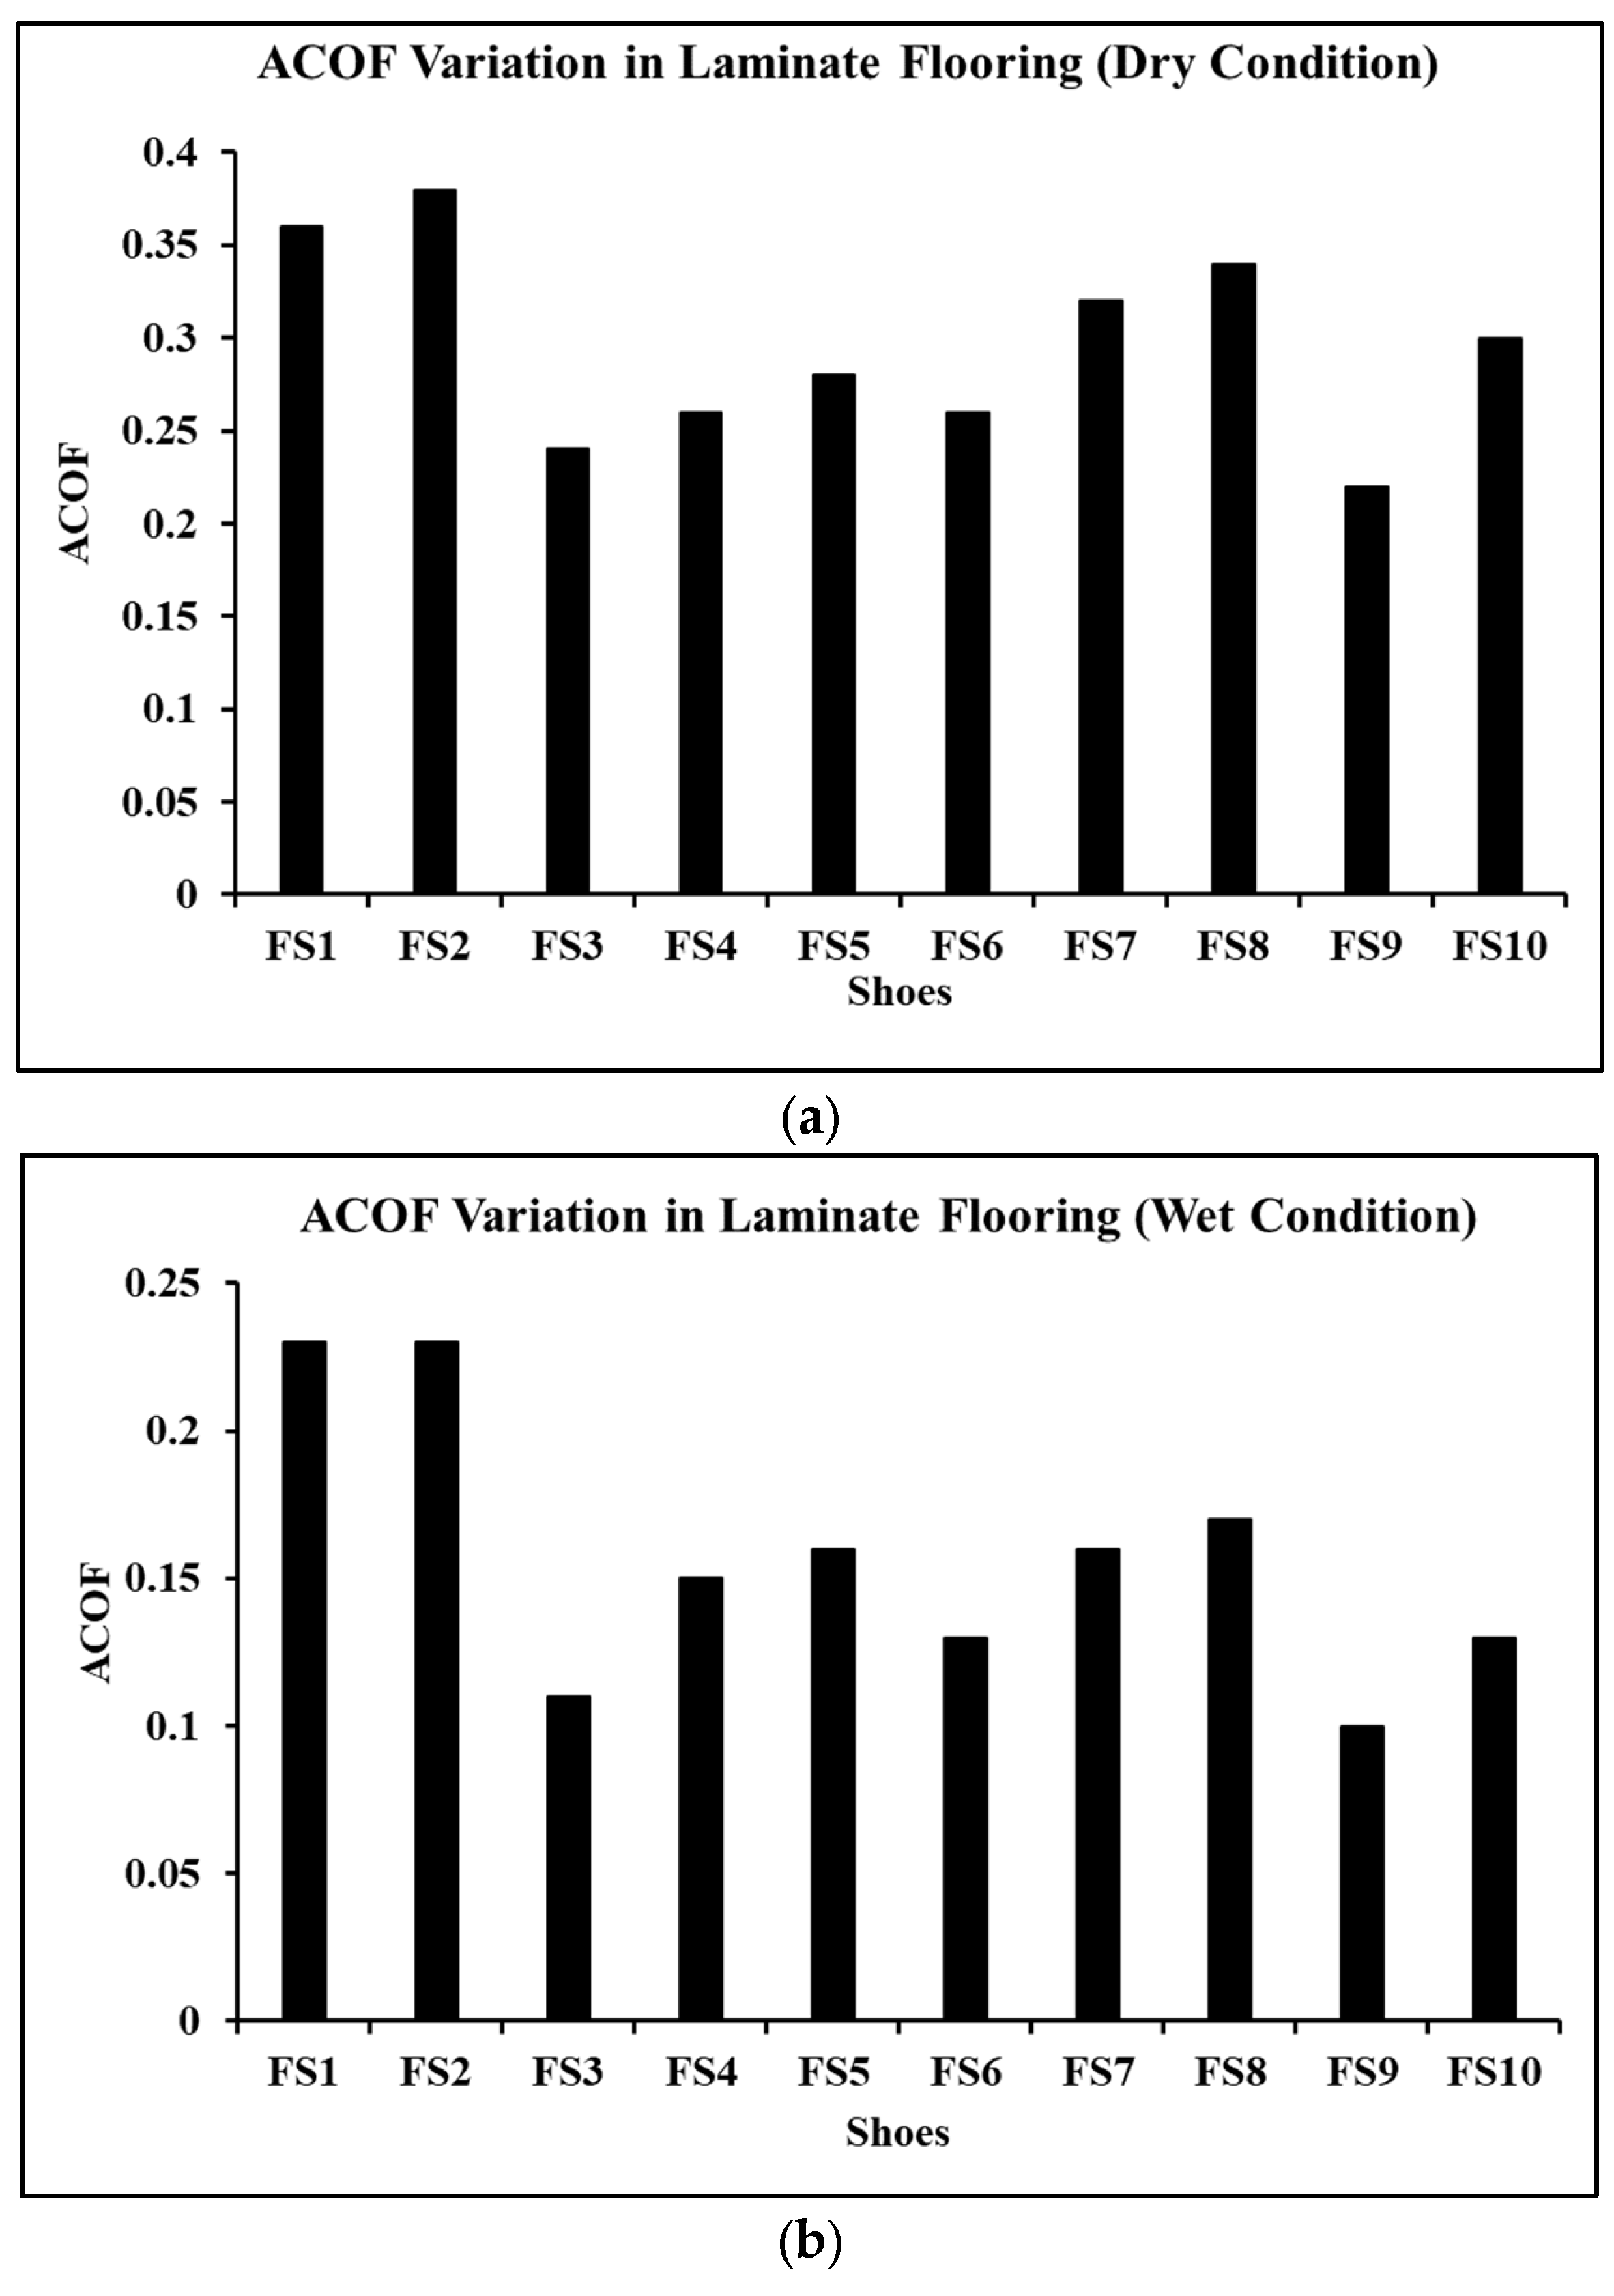
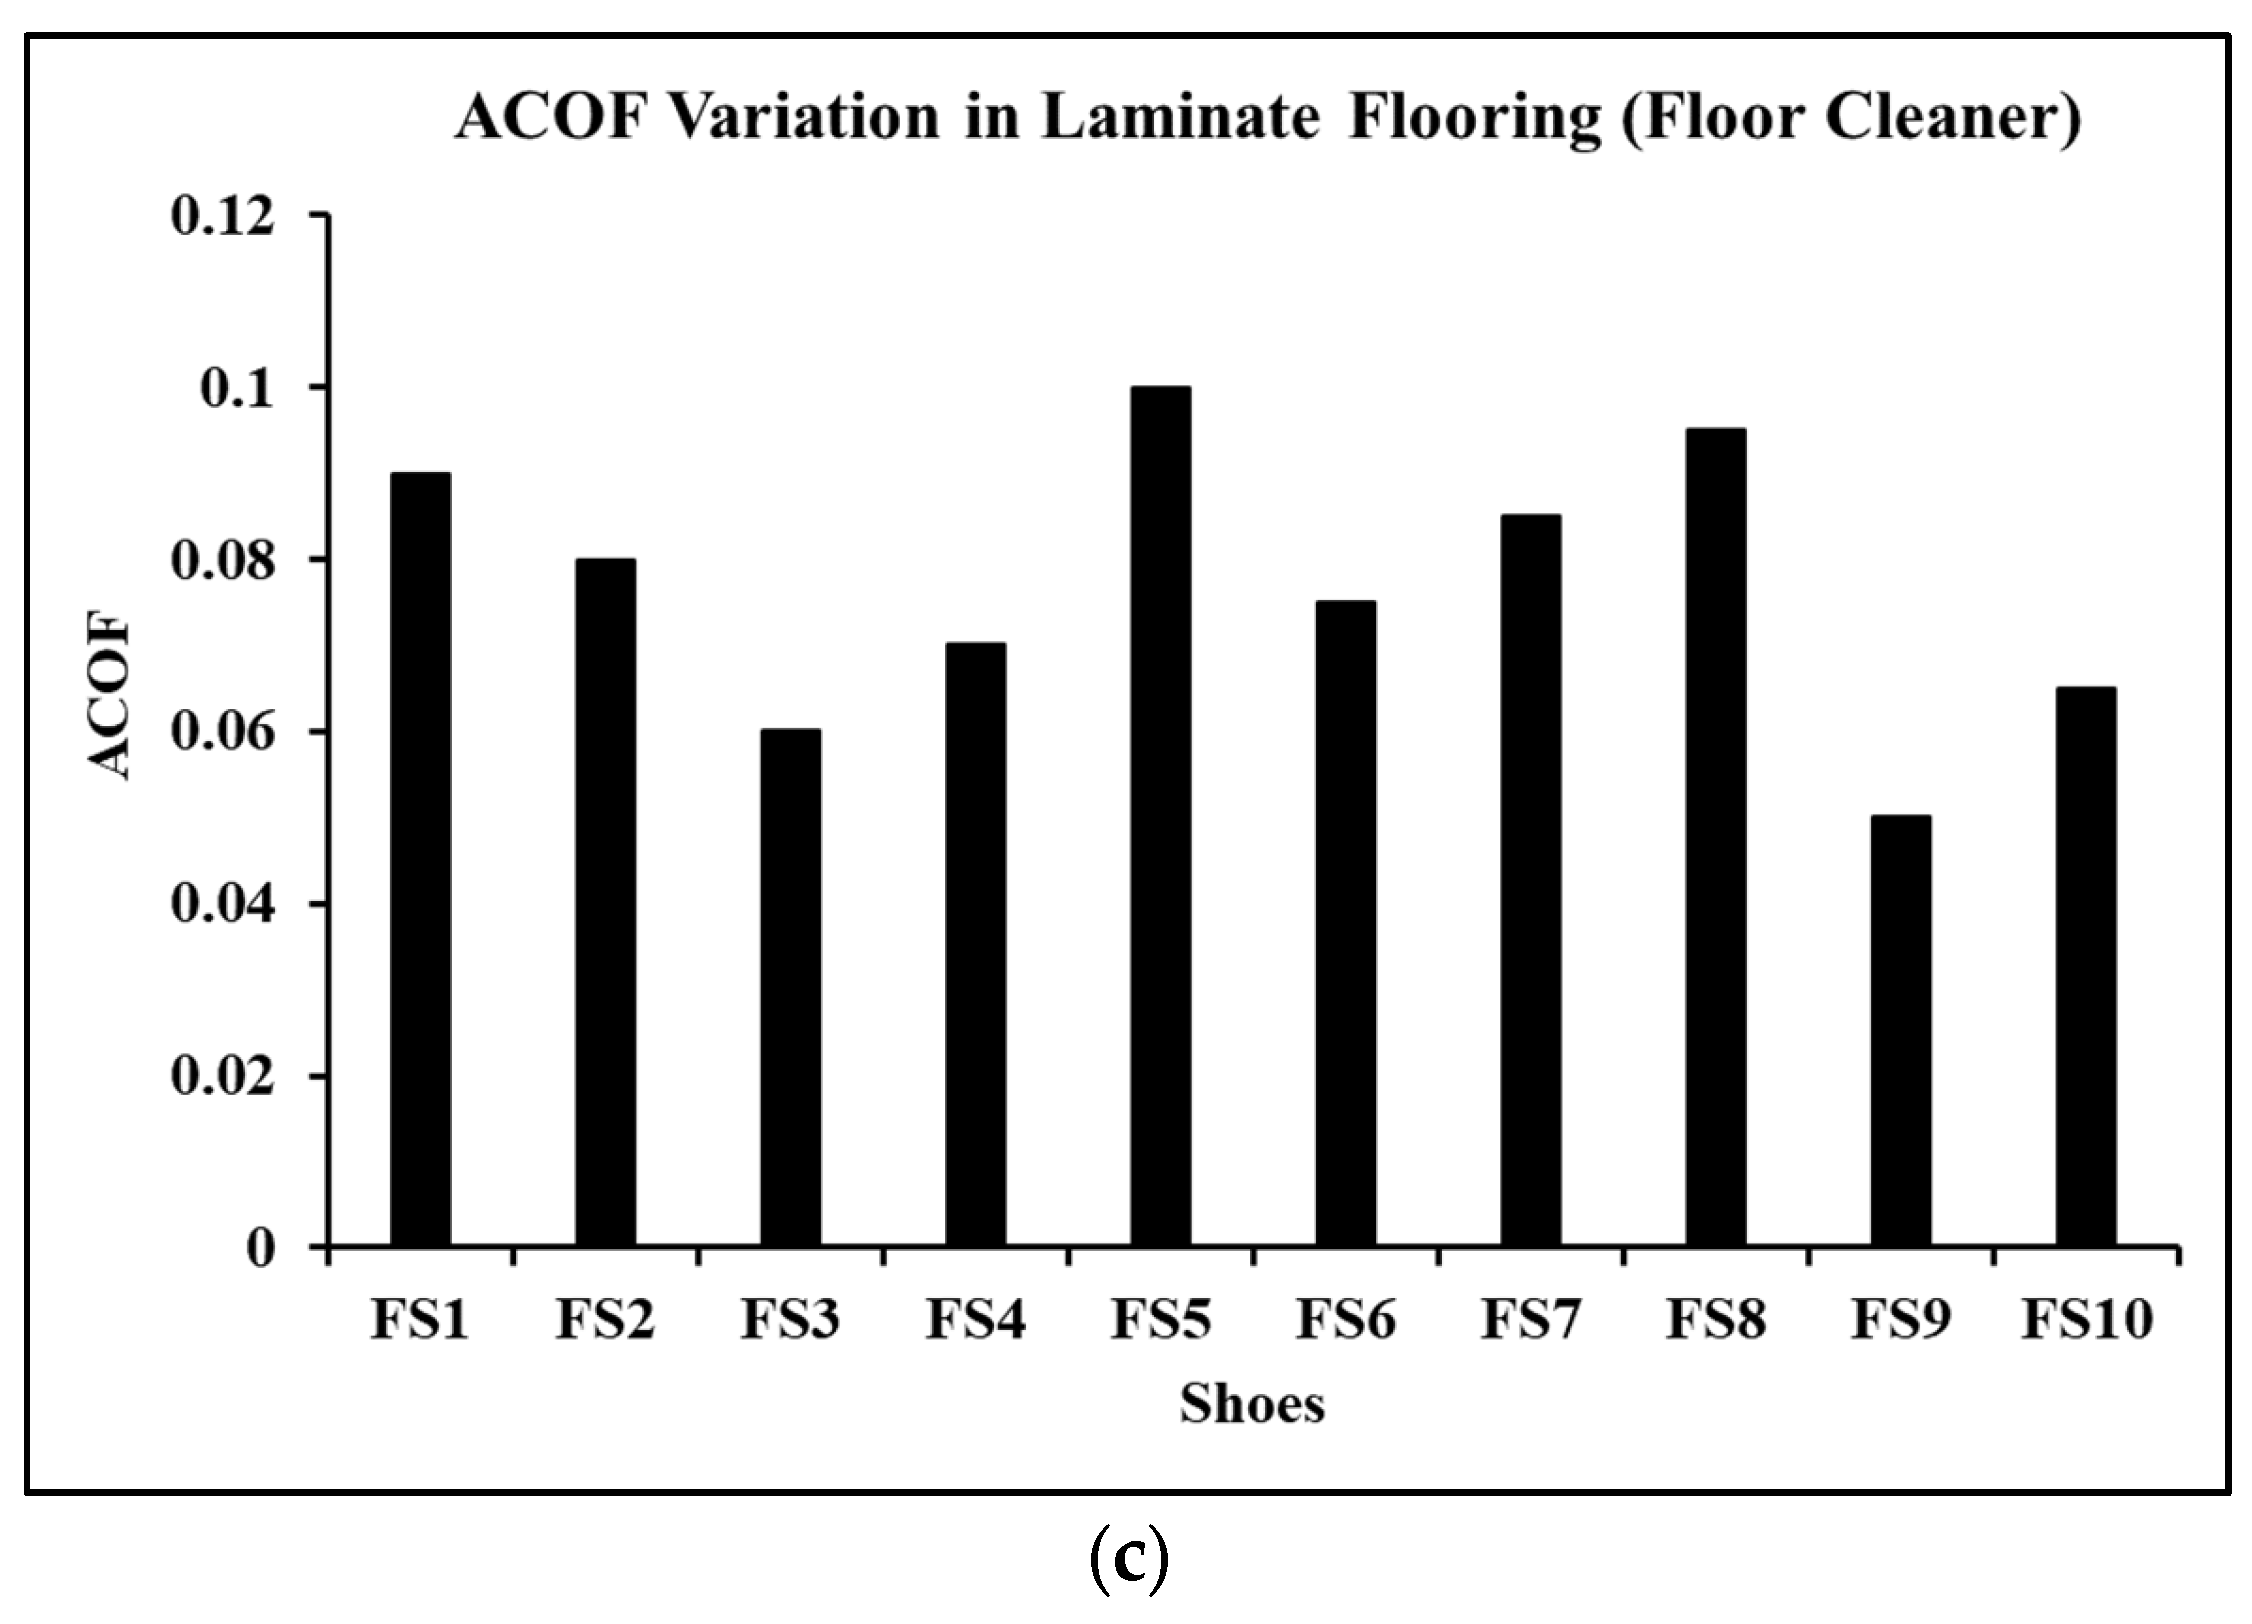
3.1. Traction Performance of Shoes across Laminate Flooring

The ACOF of shoes tested on the laminate flooring across all the slipping conditions ranged between 0.05 to 0.38 (Figure 4). The ACOF of shoes across dry laminate flooring varied between 0.22 to 0.38 (Figure 4a). Shoes FS2 showed the highest ACOF (i.e., 0.38), whereas FS9 showed the lowest ACOF (i.e., 0.22) when tested on dry laminate flooring. FS8 and FS7 showed moderate ACOF ranging between 0.32 to 0.34. As compared to the traction performance of FS9, FS1 exhibited increased ACOF by 63%, FS2 by 72%, FS3 by 9%, FS4 by 18%, FS5 by 27%, FS6 by 18%, FS7 by 45%, FS8 by 54%, and FS10 by 36%. Overall, high variations in the ACOF, across the tested shoes, were observed on dry laminate flooring.
The friction values of shoes tested on laminate flooring contaminated with water ranged from 0.1 to 0.23 (Figure 4b). Similar to the ACOF performances in dry conditions, FS1 exhibited the highest ACOF (i.e., 0.23) and FS9 showed the lowest ACOF (i.e., 0.10). FS2 performed similarly to FS1, as it also showed an ACOF of 0.23. As compared to FS9, FS1 and FS2 showed a 130% increase in the ACOF values; FS3 by 10%, FS4 by 50%, FS5 by 60%, FS6 by 30%, FS7 by 60%, FS8 by 70%, and FS10 by 30%. Overall, high variations in the ACOF, across the tested shoes, were observed on wet laminate flooring. In the case of laminate flooring contaminated with floor cleaner, the ACOF values reported were from 0.05 to 0.10 (Figure 4c). FS9 showed the lowest ACOF (i.e., 0.05) and FS5 showed the highest ACOF (i.e., 0.10). As compared to FS9, FS1 exhibited an increase in ACOF by 80%; FS2 by 60%, FS3 by 20%, FS4 by 40%, FS5 by 100%, FS6 by 50%, FS7 by 70%, FS8 by 90%, and FS10 by 30%. Overall, shoe FS9 consistently showed the lowest ACOF value on laminate flooring in all the contaminant conditions.

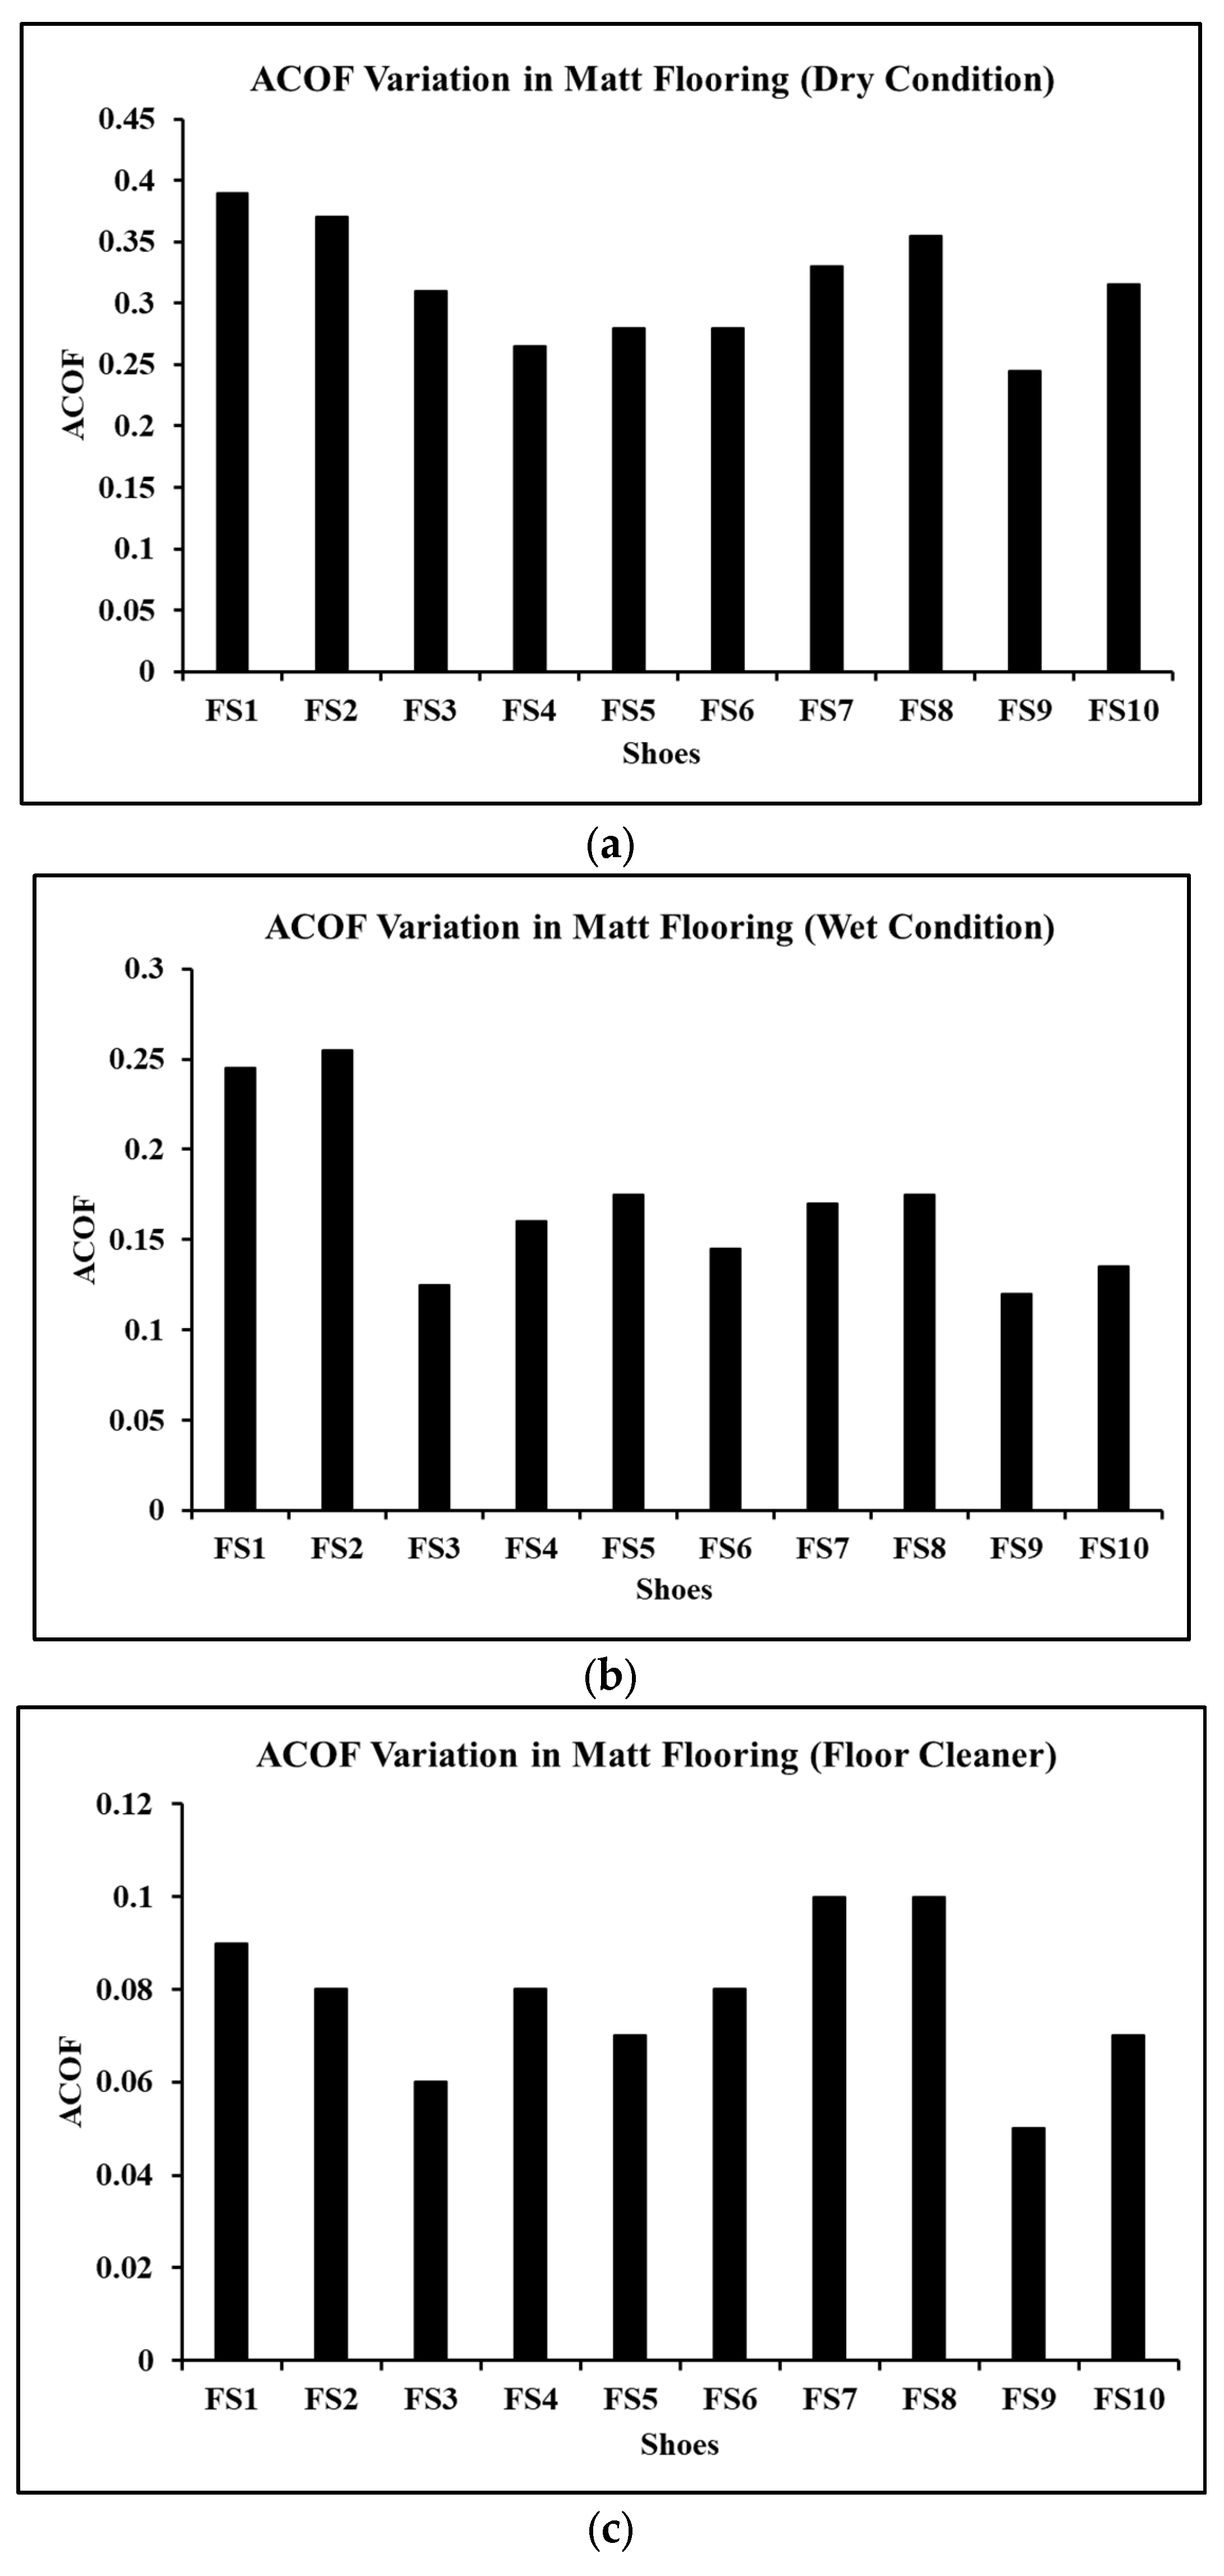
3.2. Traction Performance of Shoes across Matt Flooring

The ACOF of shoes tested on the matt flooring across all the slipping conditions ranged between 0.05 to 0.39 (Figure 5). The ACOF of shoes across dry matt flooring varied between 0.24 to 0.39 (Figure 5a). Shoes FS1 showed the highest ACOF (i.e., 0.39), whereas FS9 showed the lowest ACOF (i.e., 0.24) when tested on dry matt flooring. After FS1, FS2 exhibited the highest ACOF (i.e., 0.37). As compared to the traction performance of FS9, FS1 exhibited increased ACOF by 59%, FS2 by 51%, FS3 by 26%, FS4 by 8%, FS5 by 14%, FS6 by 14%, FS7 by 35%, FS8 by 45%, and FS10 by 28%. Overall, more than 50% of the shoes showed a high increase in the ACOF as compared to the lowest recorded ACOF.
In the case of matt flooring contaminated with water, the ACOF values across shoes ranged from 0.12 to 0.25 (Figure 5b). FS2 exhibited the highest ACOF (i.e., 0.25) and FS9 showed the lowest ACOF (i.e., 0.12). After FS2, FS1 showed the highest ACOF of 0.24. As compared to FS9, FS1 and FS2 showed an approximate 100% increase in the ACOF values; FS3 by 4%, FS4 by 33%, FS5 by 46%, FS6 by 21%, FS7 by 42%, FS8 by 46%, and FS10 by 12.5%.
In the case of matt flooring contaminated with floor cleaner, the ACOF values were observed from 0.05 to 0.10 (Figure 5c). FS9 showed the lowest ACOF (i.e., 0.05) and FS7 showed the highest ACOF (i.e., 0.10). As compared to FS9, FS1 exhibited an increase in ACOF by 80%; FS2 by 60%, FS3 by 20%, FS4 by 60%, FS5 by 40%, FS6 by 60%, FS7 by 100%, FS8 by 100%, and FS10 by 40%. Overall, generalized ACOF outcomes were observed in the case of matt flooring contaminated with floor cleaner.

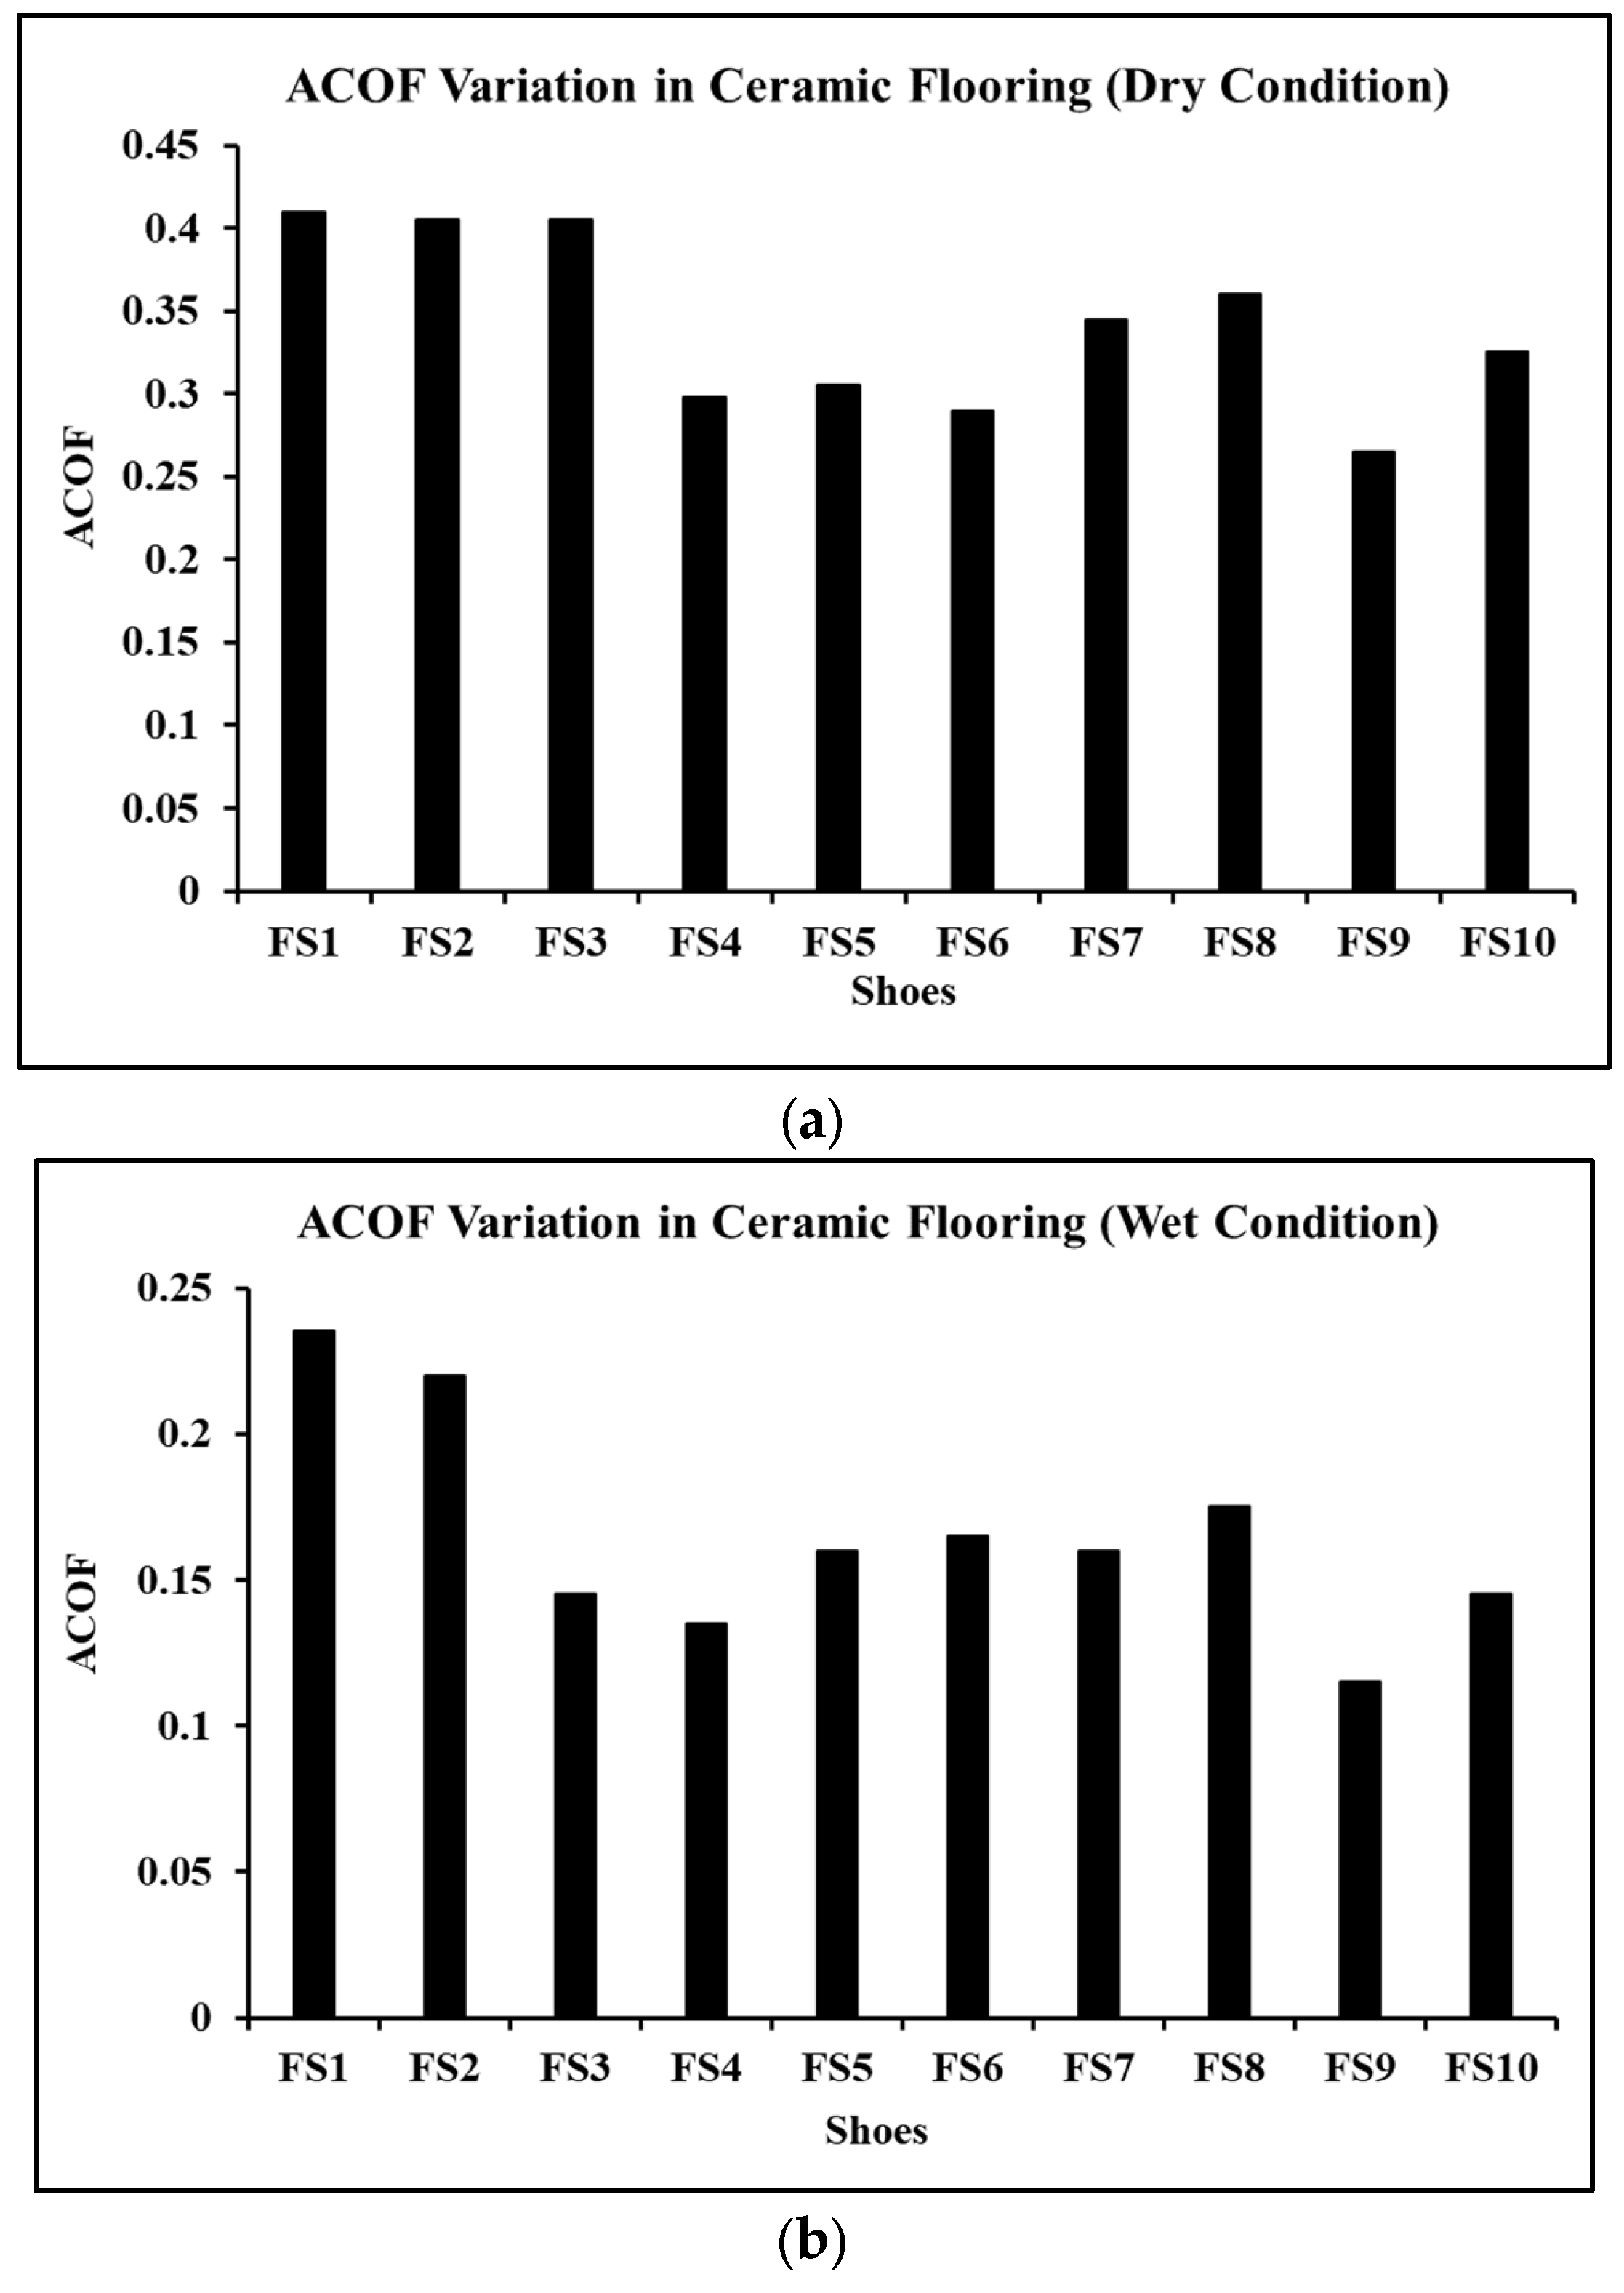
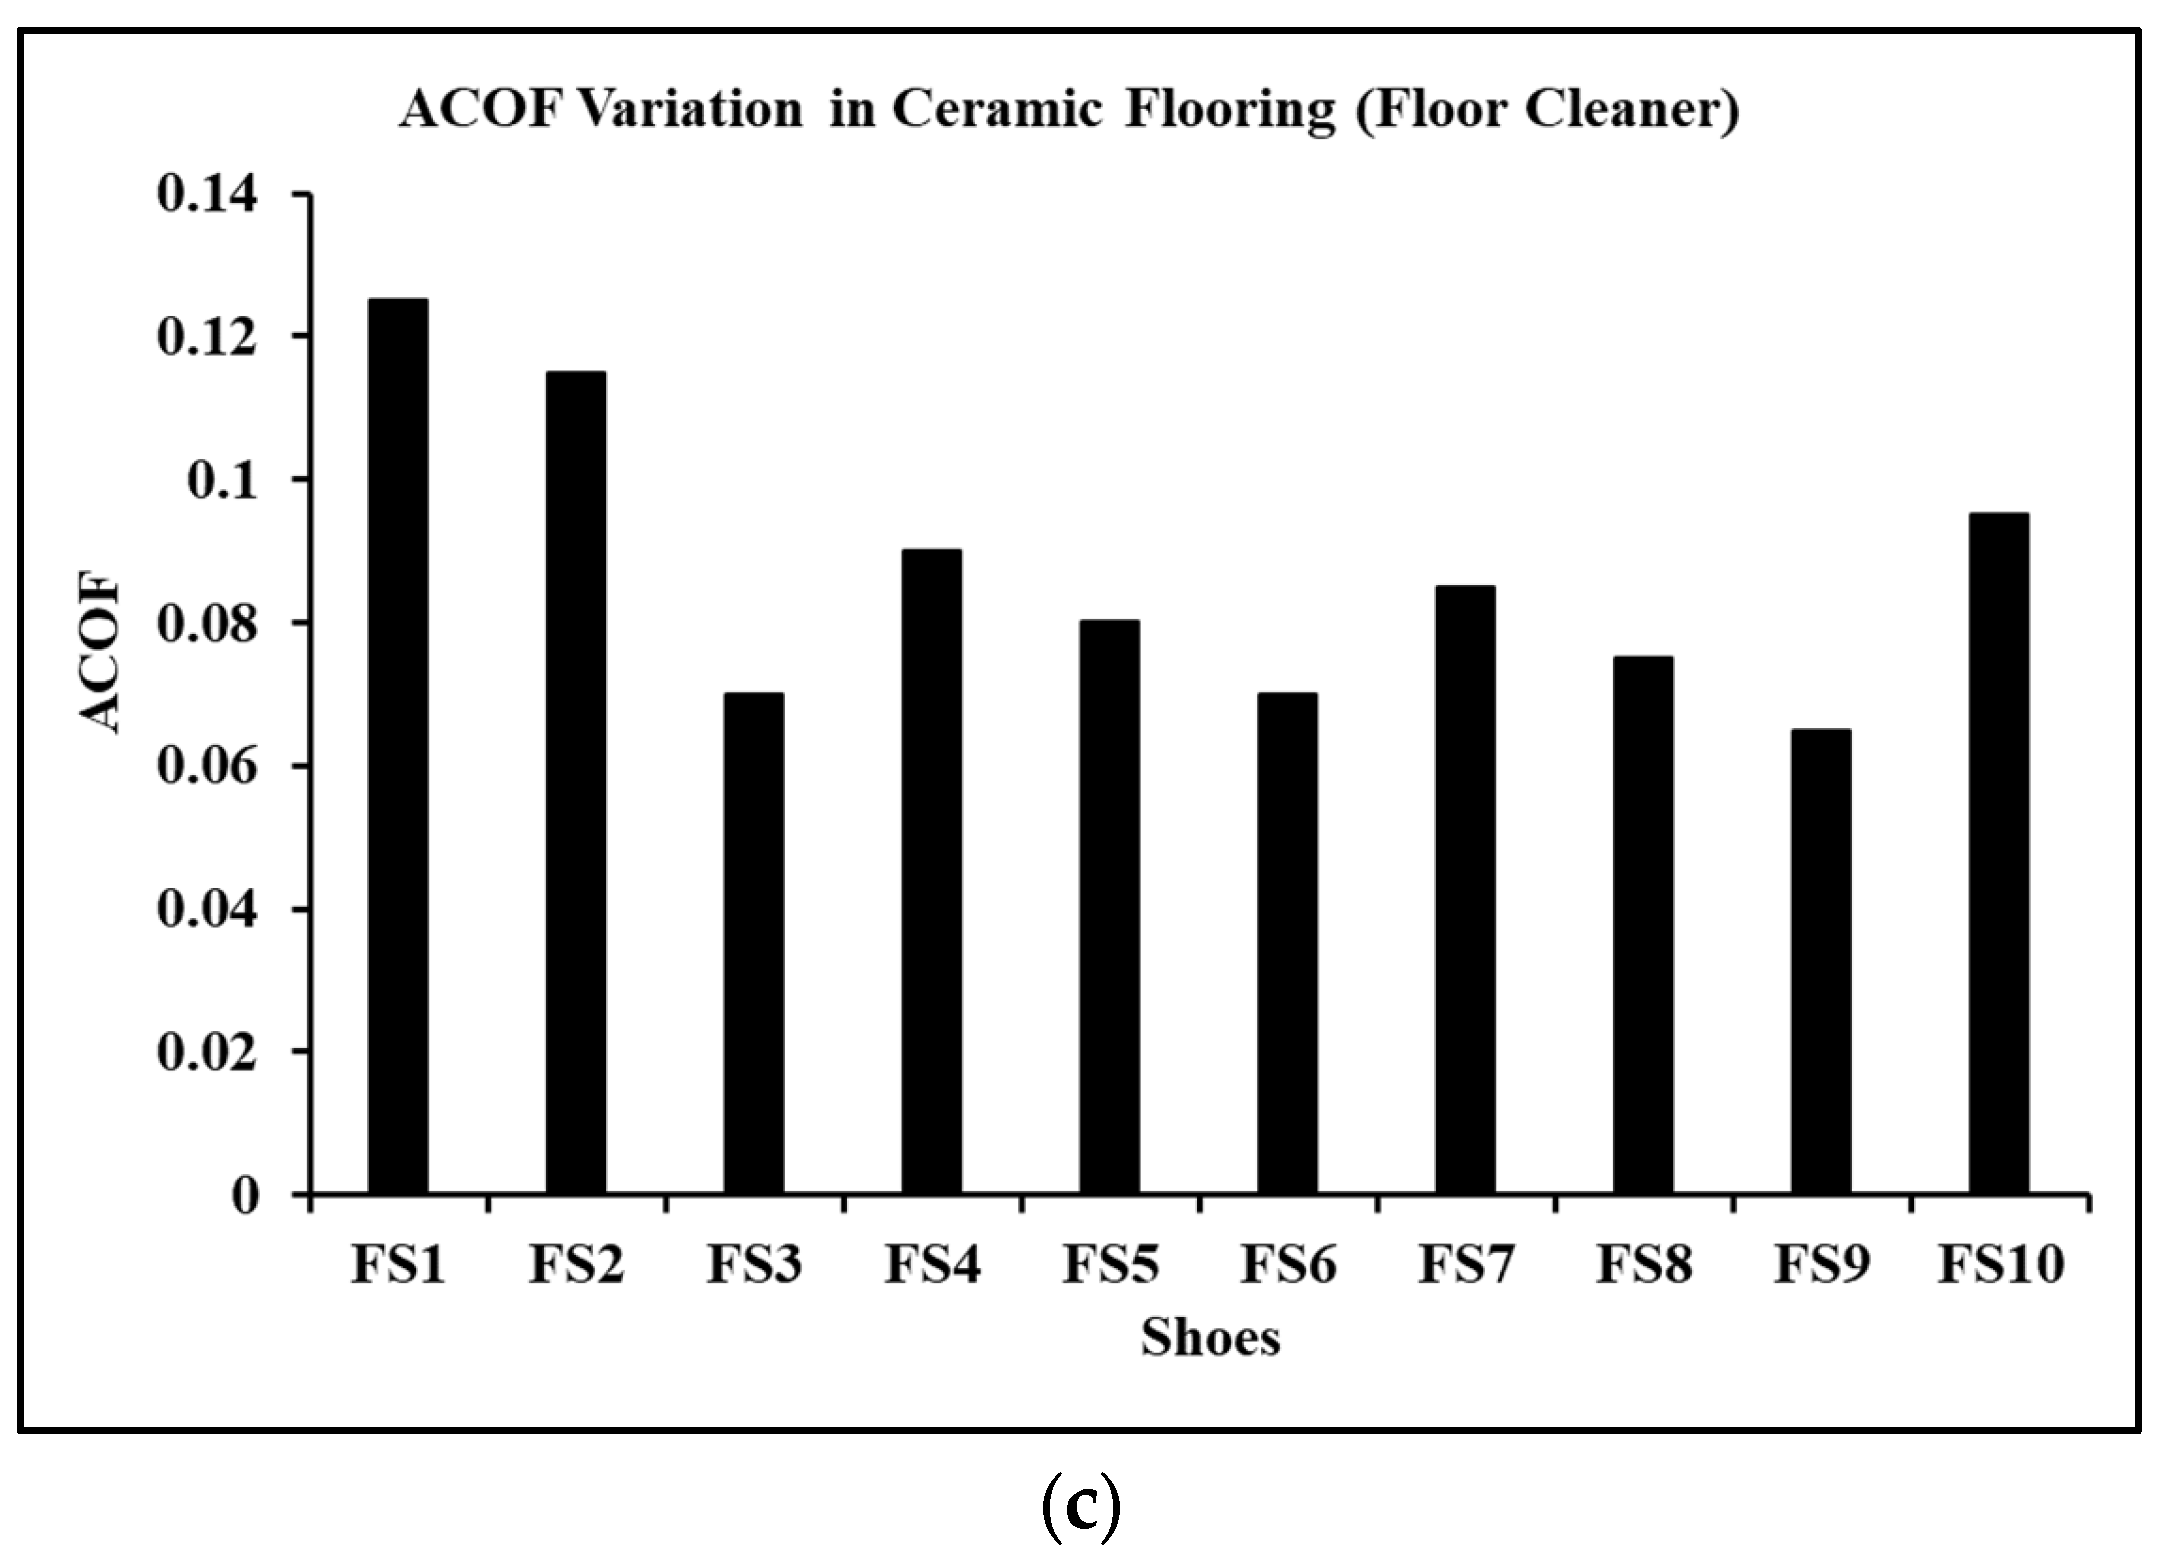
3.3. Traction Performance of Shoes across Ceramic Flooring

The ACOF of shoes tested on the ceramic flooring across all the slipping conditions ranged between 0.06 to 0.41 (Figure 6). The ACOF of shoes across dry ceramic flooring ranged between 0.26 to 0.41 (Figure 6a). Shoes FS1 showed the highest ACOF (i.e., 0.41), whereas FS9 showed the lowest ACOF (i.e., 0.26) when tested on dry ceramic flooring. After FS1, FS2 and FS3 exhibited the highest ACOF (i.e., 0.40). As compared to the ACOF of FS9, FS1 exhibited increased ACOF by 55%; FS2 and FS3 by 53%, FS4 by 12%, FS5 by 15%, FS6 by 9%, FS7 by 30%, FS8 by 36%, and FS10 by 23%.
The friction values of shoes tested on ceramic flooring contaminated with water ranged from 0.11 to 0.23 (Figure 6b). Similar to the ACOF performances in dry conditions, FS1 exhibited the highest ACOF (i.e., 0.23) and FS9 showed the lowest ACOF (i.e., 0.10). After FS1, FS2 exhibited the highest ACOF (i.e., 0.22) followed by FS8 (i.e., 0.17). As compared to FS9, FS1 exhibited a 105% increase in the ACOF values; FS2 by 91%, FS3 by 26%, FS4 by 17%, FS5 by 39%, FS6 by 43%, FS7 by 39%, FS8 by 52%, and FS10 by 26%. Overall, high variations in the ACOF, across the tested shoes, were observed on wet ceramic flooring. In the case of ceramic flooring contaminated with floor cleaner, the ACOF values varied from 0.06 to 0.12 (Figure 6c). FS9 showed the lowest ACOF (i.e., 0.06) and FS1 showed the highest ACOF (i.e., 0.12). As compared to FS9, FS1 exhibited an increase in ACOF by 92%; FS2 by 77%, FS3 by 8%, FS4 by 38%, FS5 by 23%, FS6 by 8%, FS7 by 31%, FS8 by 15%, and FS10 by 46%.
In the case of matt flooring contaminated with floor cleaner, the ACOF values were observed from 0.05 to 0.10 (Figure 6c). FS9 showed the lowest ACOF (i.e., 0.05) and FS7 showed the highest ACOF (i.e., 0.10). As compared to FS9, FS1 exhibited an increase in ACOF by 80%; FS2 by 60%, FS3 by 20%, FS4 by 60%, FS5 by 40%, FS6 by 60%, FS7 by 100%, FS8 by 100%, and FS10 by 40%. Overall, generalized ACOF outcomes were observed in the case of matt flooring contaminated with floor cleaner.

3.4. Effect of Footwear Characteristics on the Traction Performance

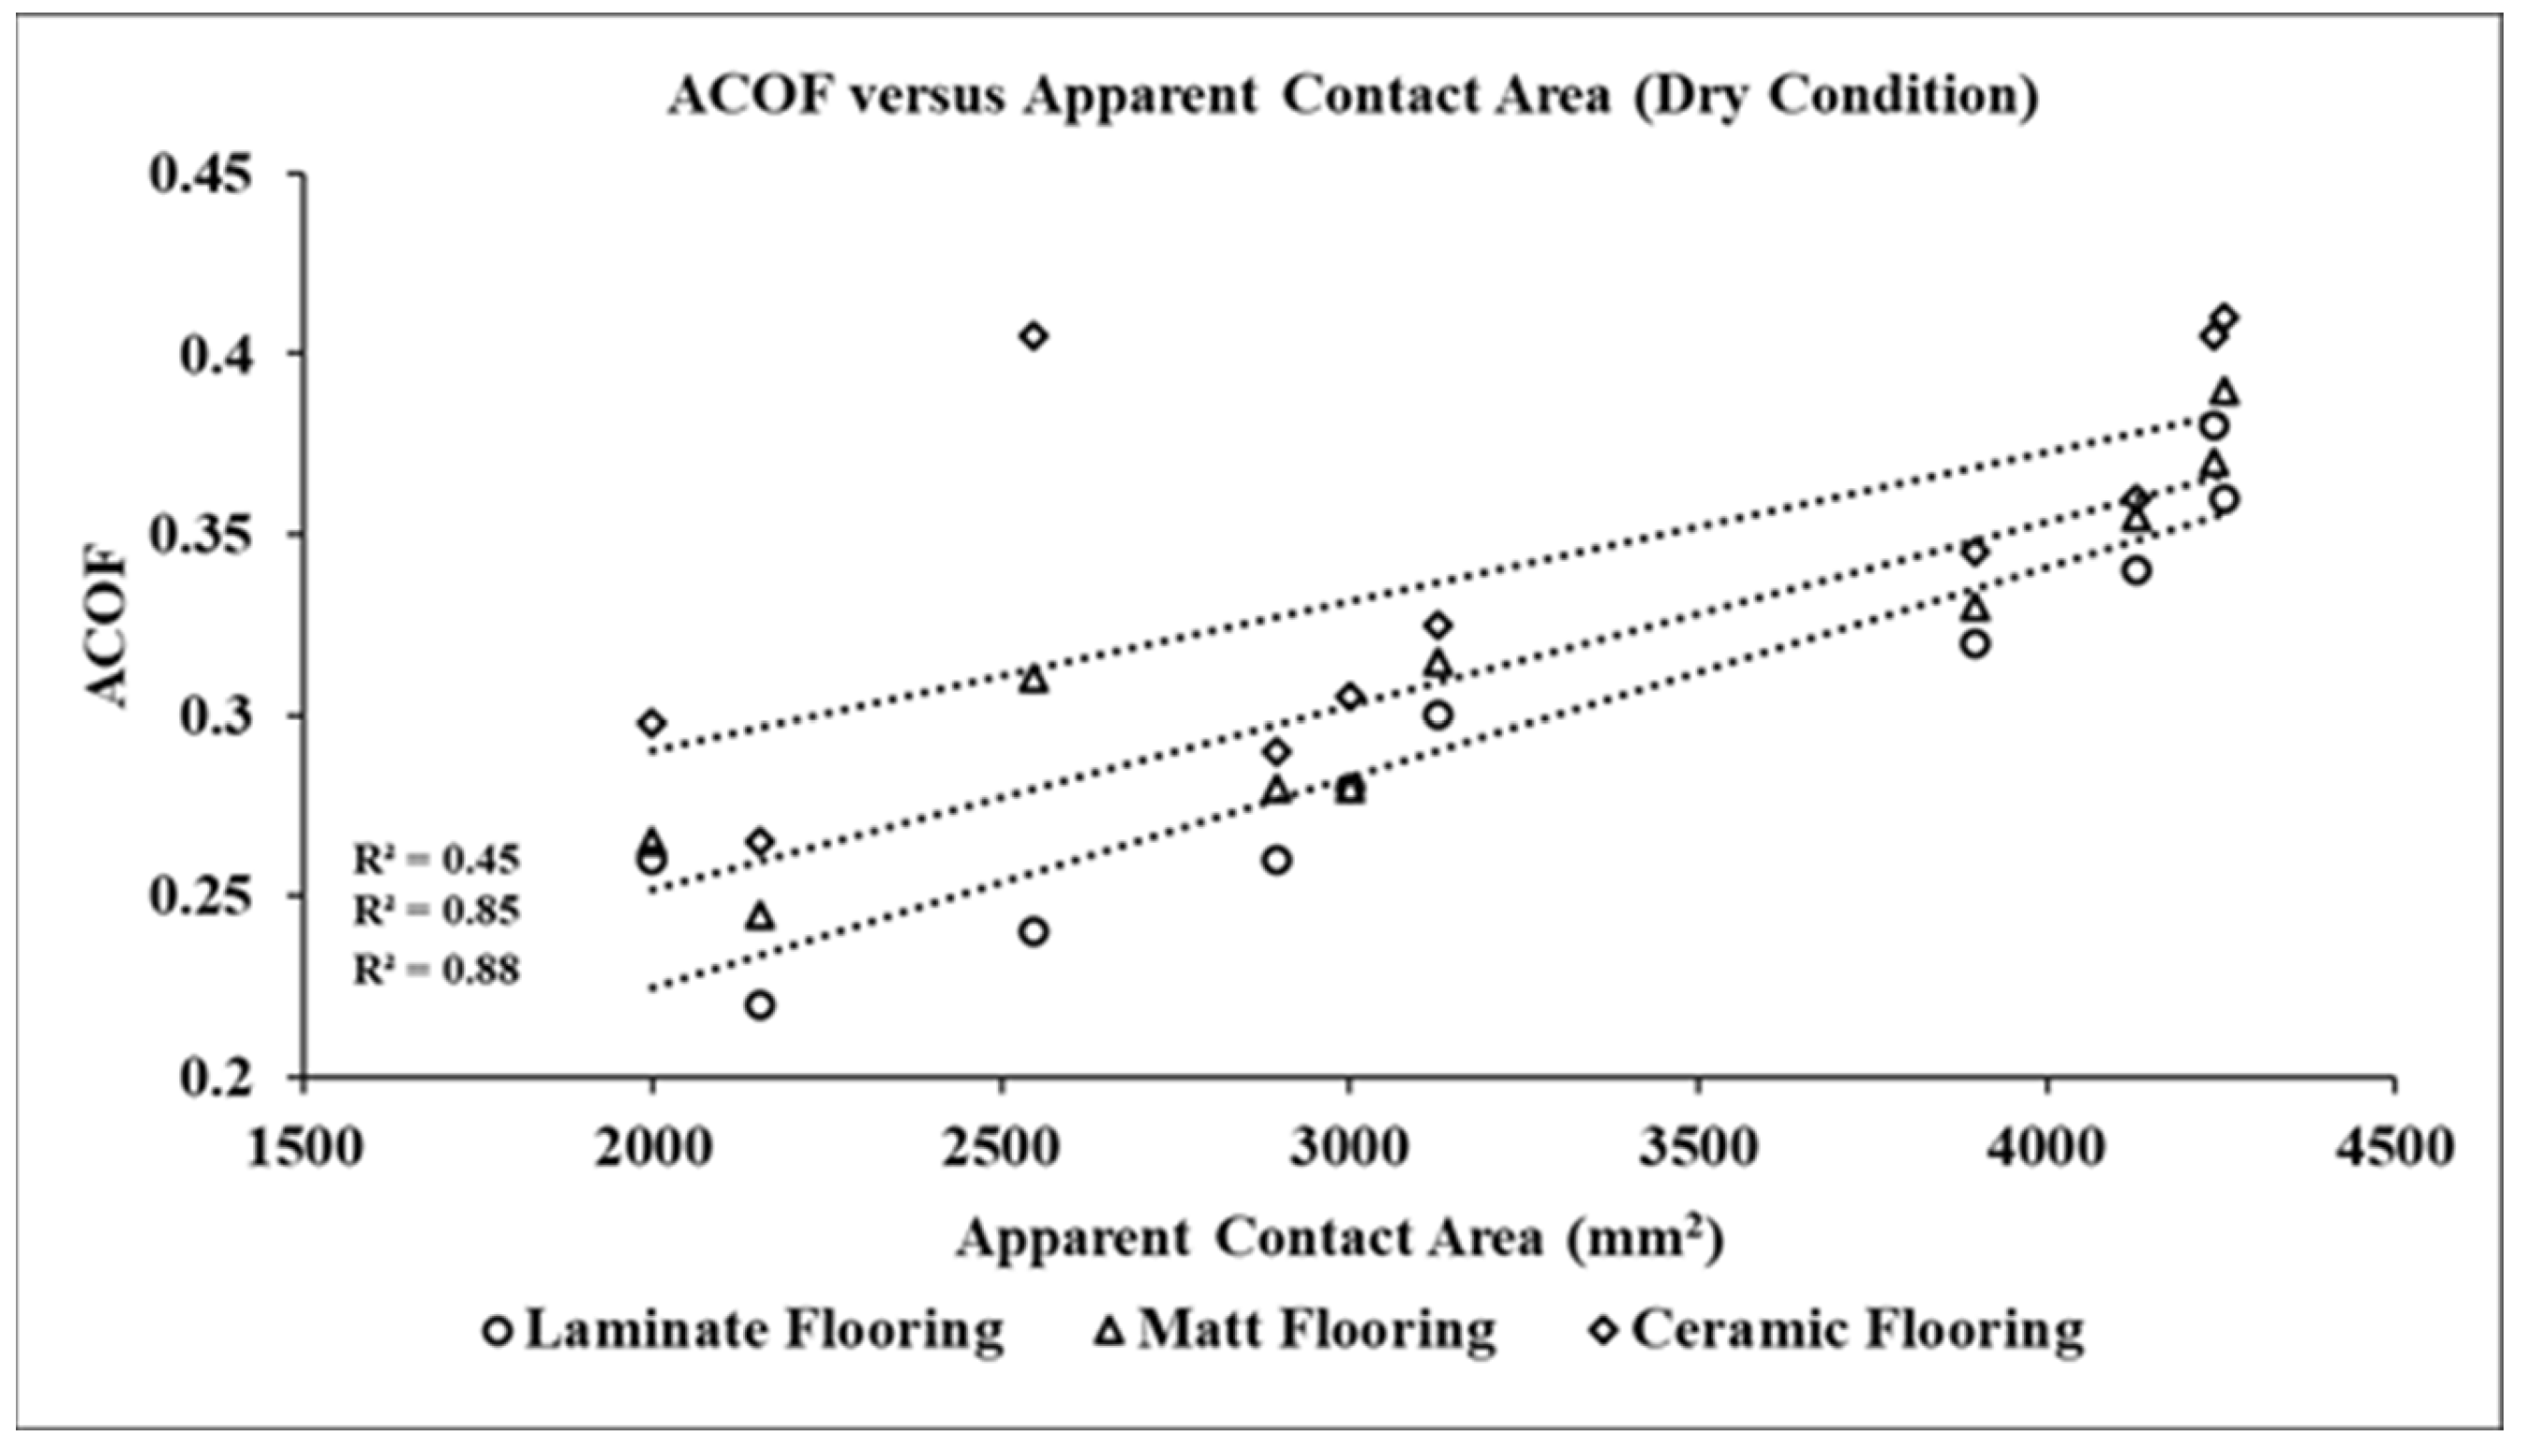
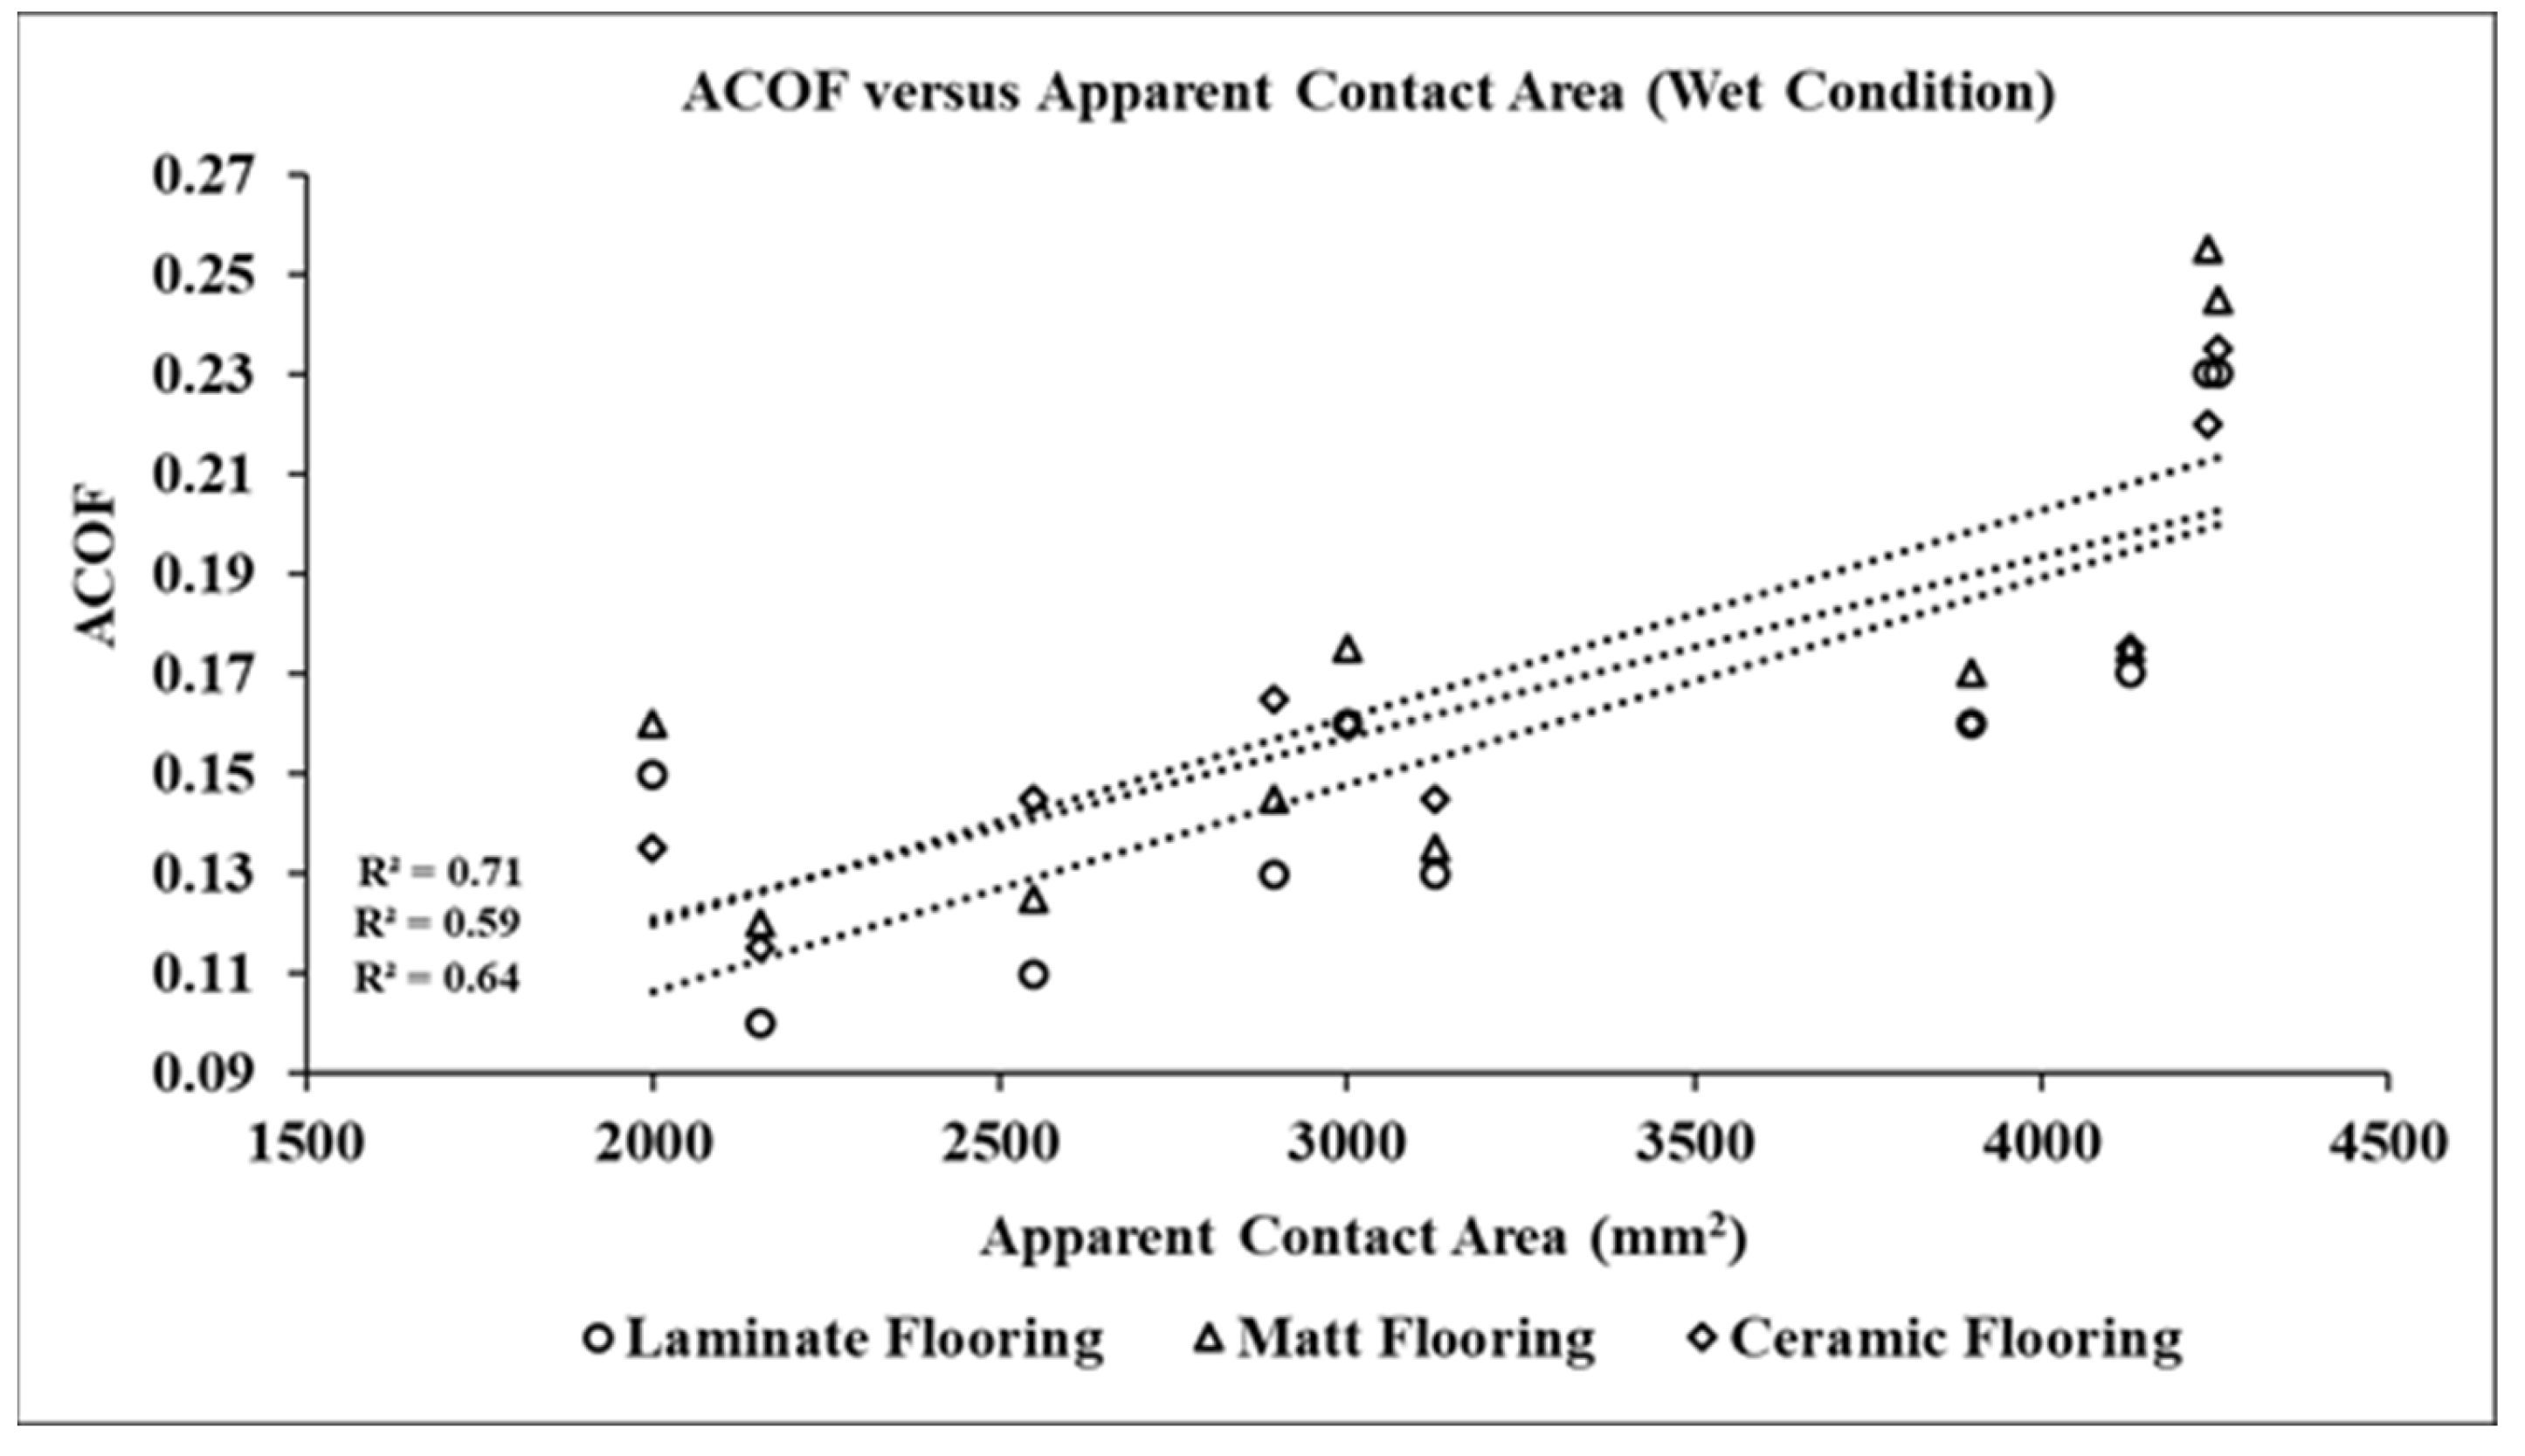
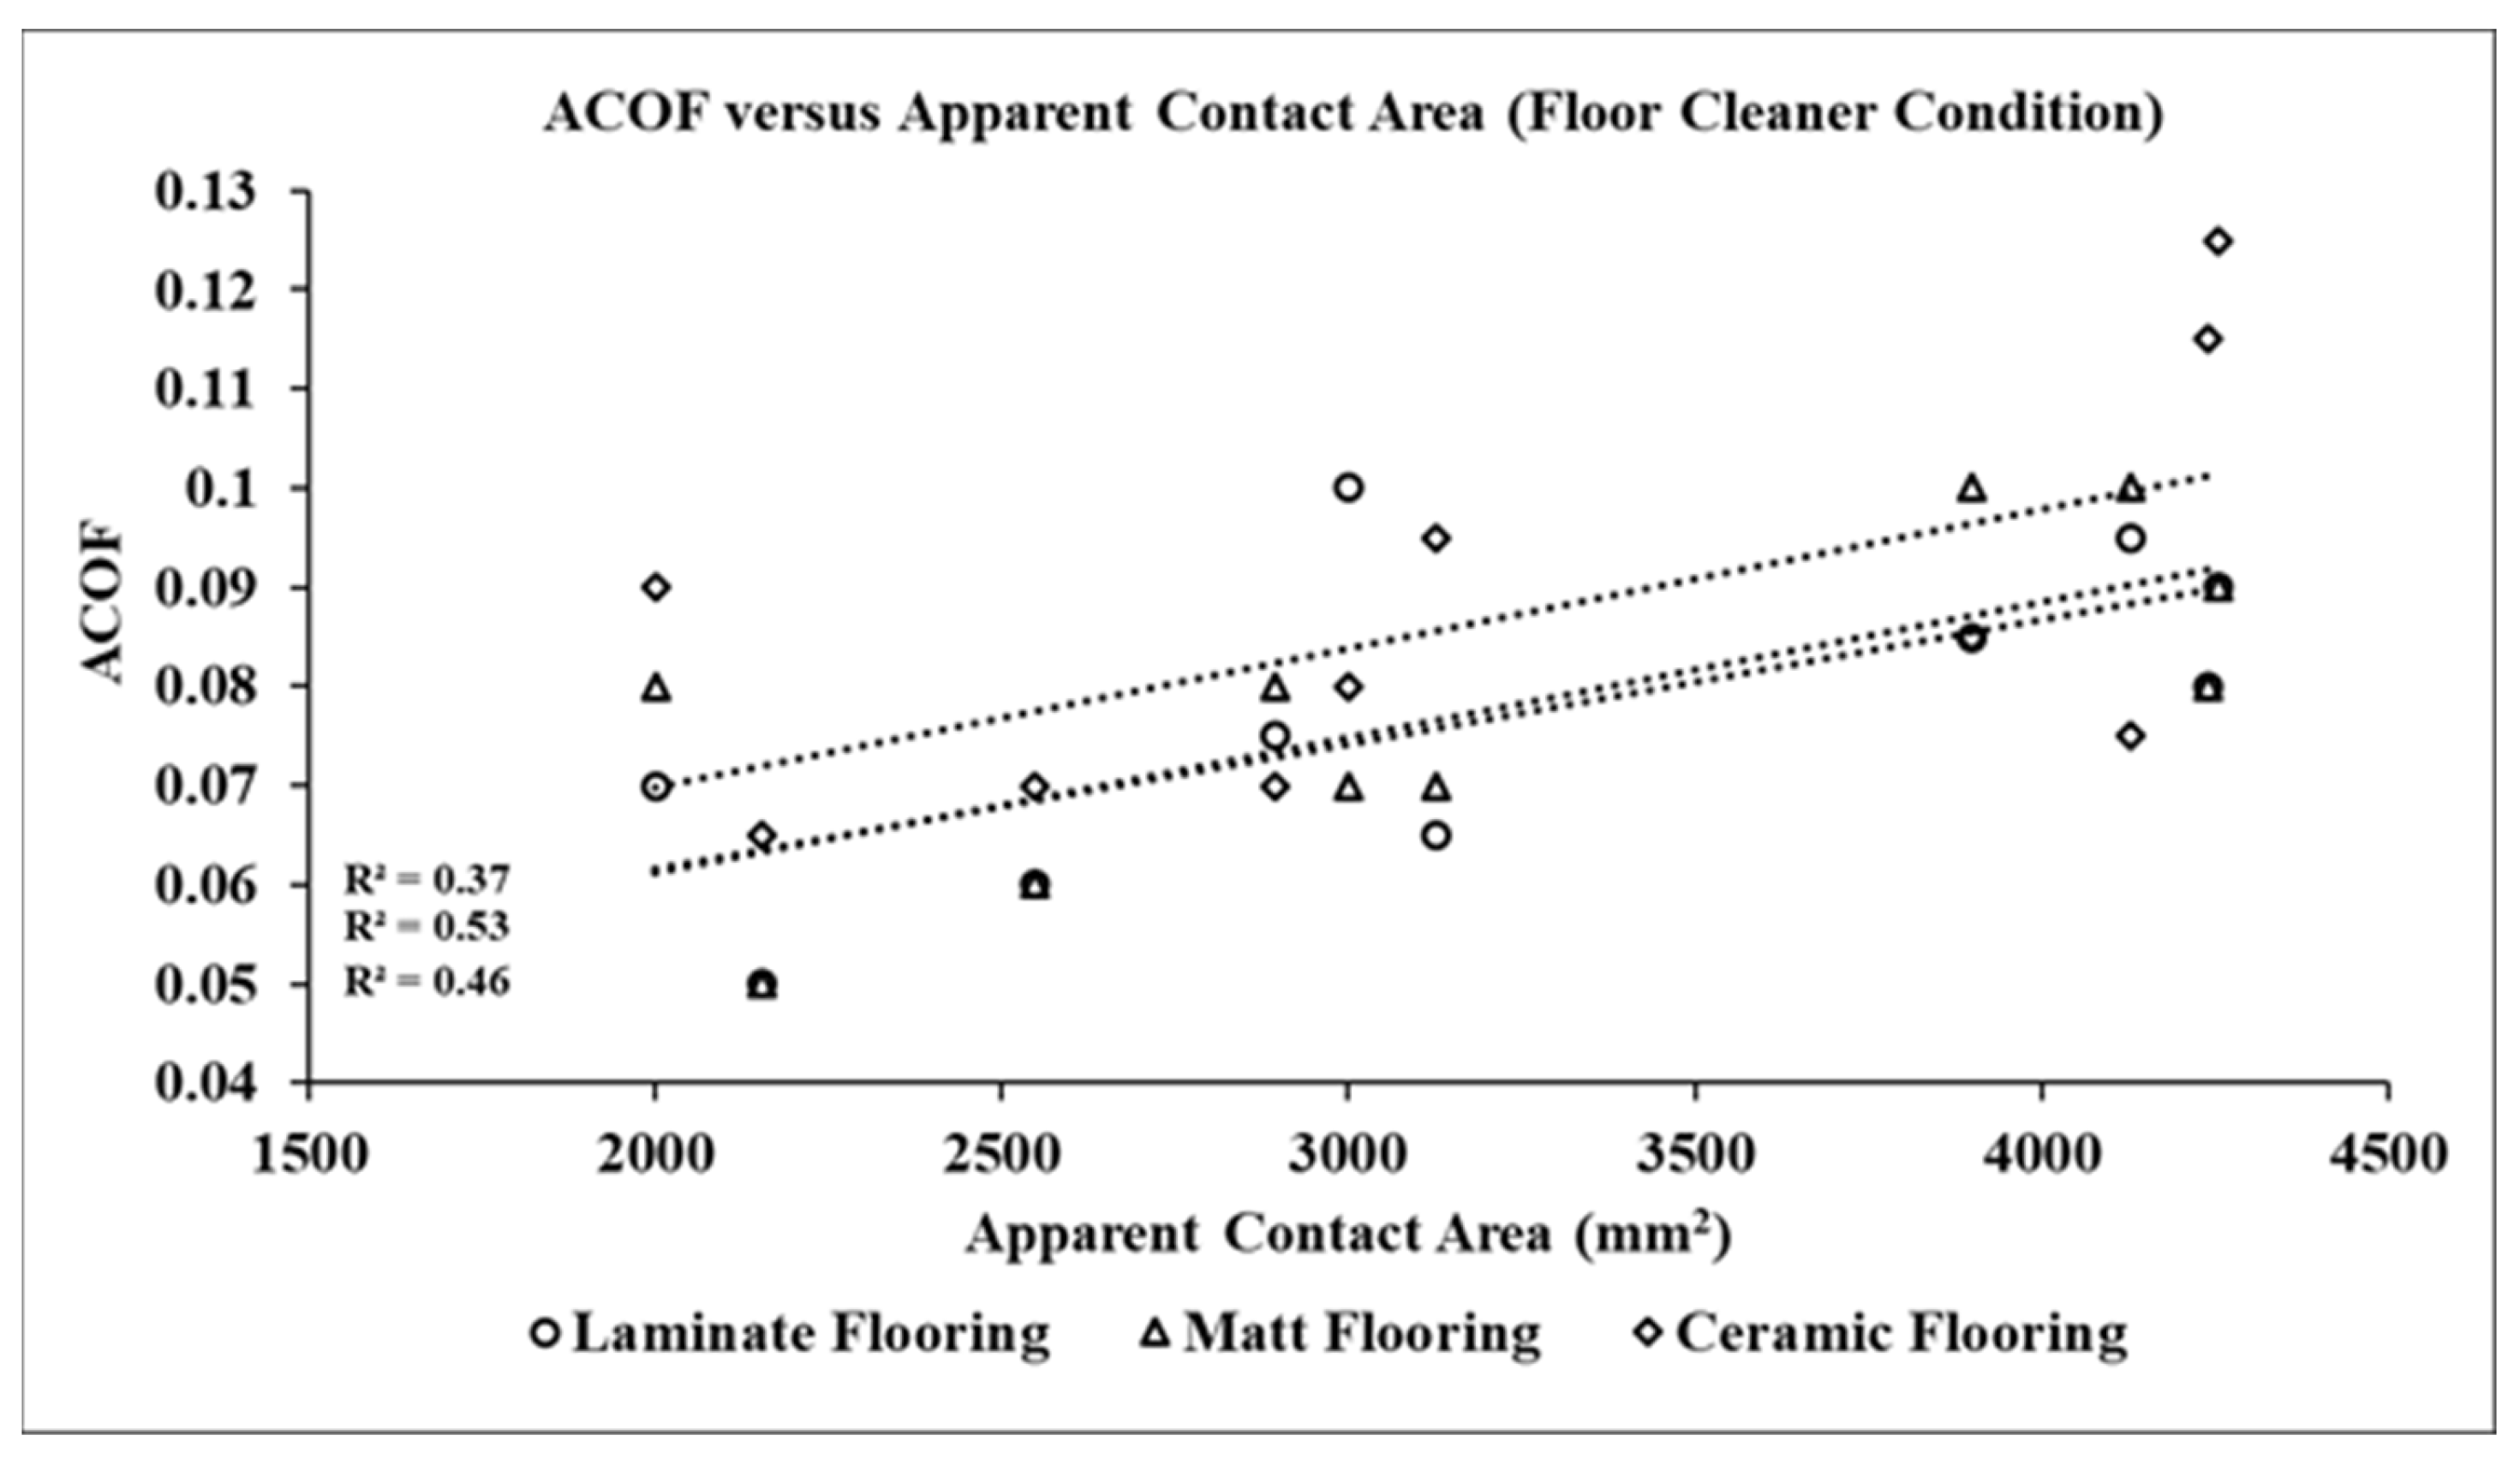
3.4.1. Effect of Apparent Contact Area on ACOF

Figure 7 represents the correlation between ACOF and apparent contact area across the shoes in dry slipping conditions. In the case of dry laminate flooring, the apparent contact area positively and strongly correlated (R2 = 0.88) with the overall traction performance of the shoes. Specifically, FS1 showed the highest apparent contact area (i.e., 4253 mm2) and highest ACOF. While nine shoes followed this trend, shoes FS6 was the only exception, which showed a low apparent contact area (i.e., 2000 mm2) but a moderate ACOF (i.e., 0.26). Similarly, in the case of dry matt flooring, the apparent contact area was found to be positively and strongly correlated (R2 = 0.85) with the overall traction performance of the shoes. Increased apparent contact areas produced high ACOF outcomes. Similar trends were followed by nine shoes, except FS3, which exhibited high ACOF (i.e., 0.31) while having a low apparent contact area (i.e., 2546 mm2). On the contrary, the apparent contact area was not found to correlate well (R2 = 0.45) with the ACOF outcomes of the shoes on dry ceramic flooring. In this case, only 40% of the shoes experienced high ACOF at low apparent contact areas; the remaining shoes showed low ACOF at high apparent contact areas.
Figure 8 represents the correlation between ACOF and apparent contact area across the shoes in water contaminated slipping condition. In case of wet laminate flooring, the apparent contact area showed moderate correlation (R2 = 0.64) with the overall traction performance of the shoes. Less than 50% of the shoes showed low ACOF at high apparent contact area whereas, the remaining performed the opposite. Similarly, in the case of wet matt flooring, the apparent contact area was found moderately correlate (R2 = 0.59) with the ACOF of formal shoes. On the contrary, the apparent contact area was found to strongly (R2 = 0.71) and positively correlate with the traction values of the shoes on wet ceramic flooring. In this case, increased apparent contact areas produced high ACOF outcomes. Figure 9 represents the correlation between the apparent contact area and ACOF across the shoes tested in floor cleaner contaminated condition. In the condition of floor cleaner as a pollutant substance on laminate, matt, and ceramic flooring, insignificant correlation of apparent contact area with the ACOF was observed. Shoes tested on laminated floor contaminated with floor cleaner showed low correlation (R2 = 0.46), matt flooring showed moderate correlation (R2 = 0.53), and ceramic flooring showed very low correlation (R2 = 0.37) with the apparent contact areas.

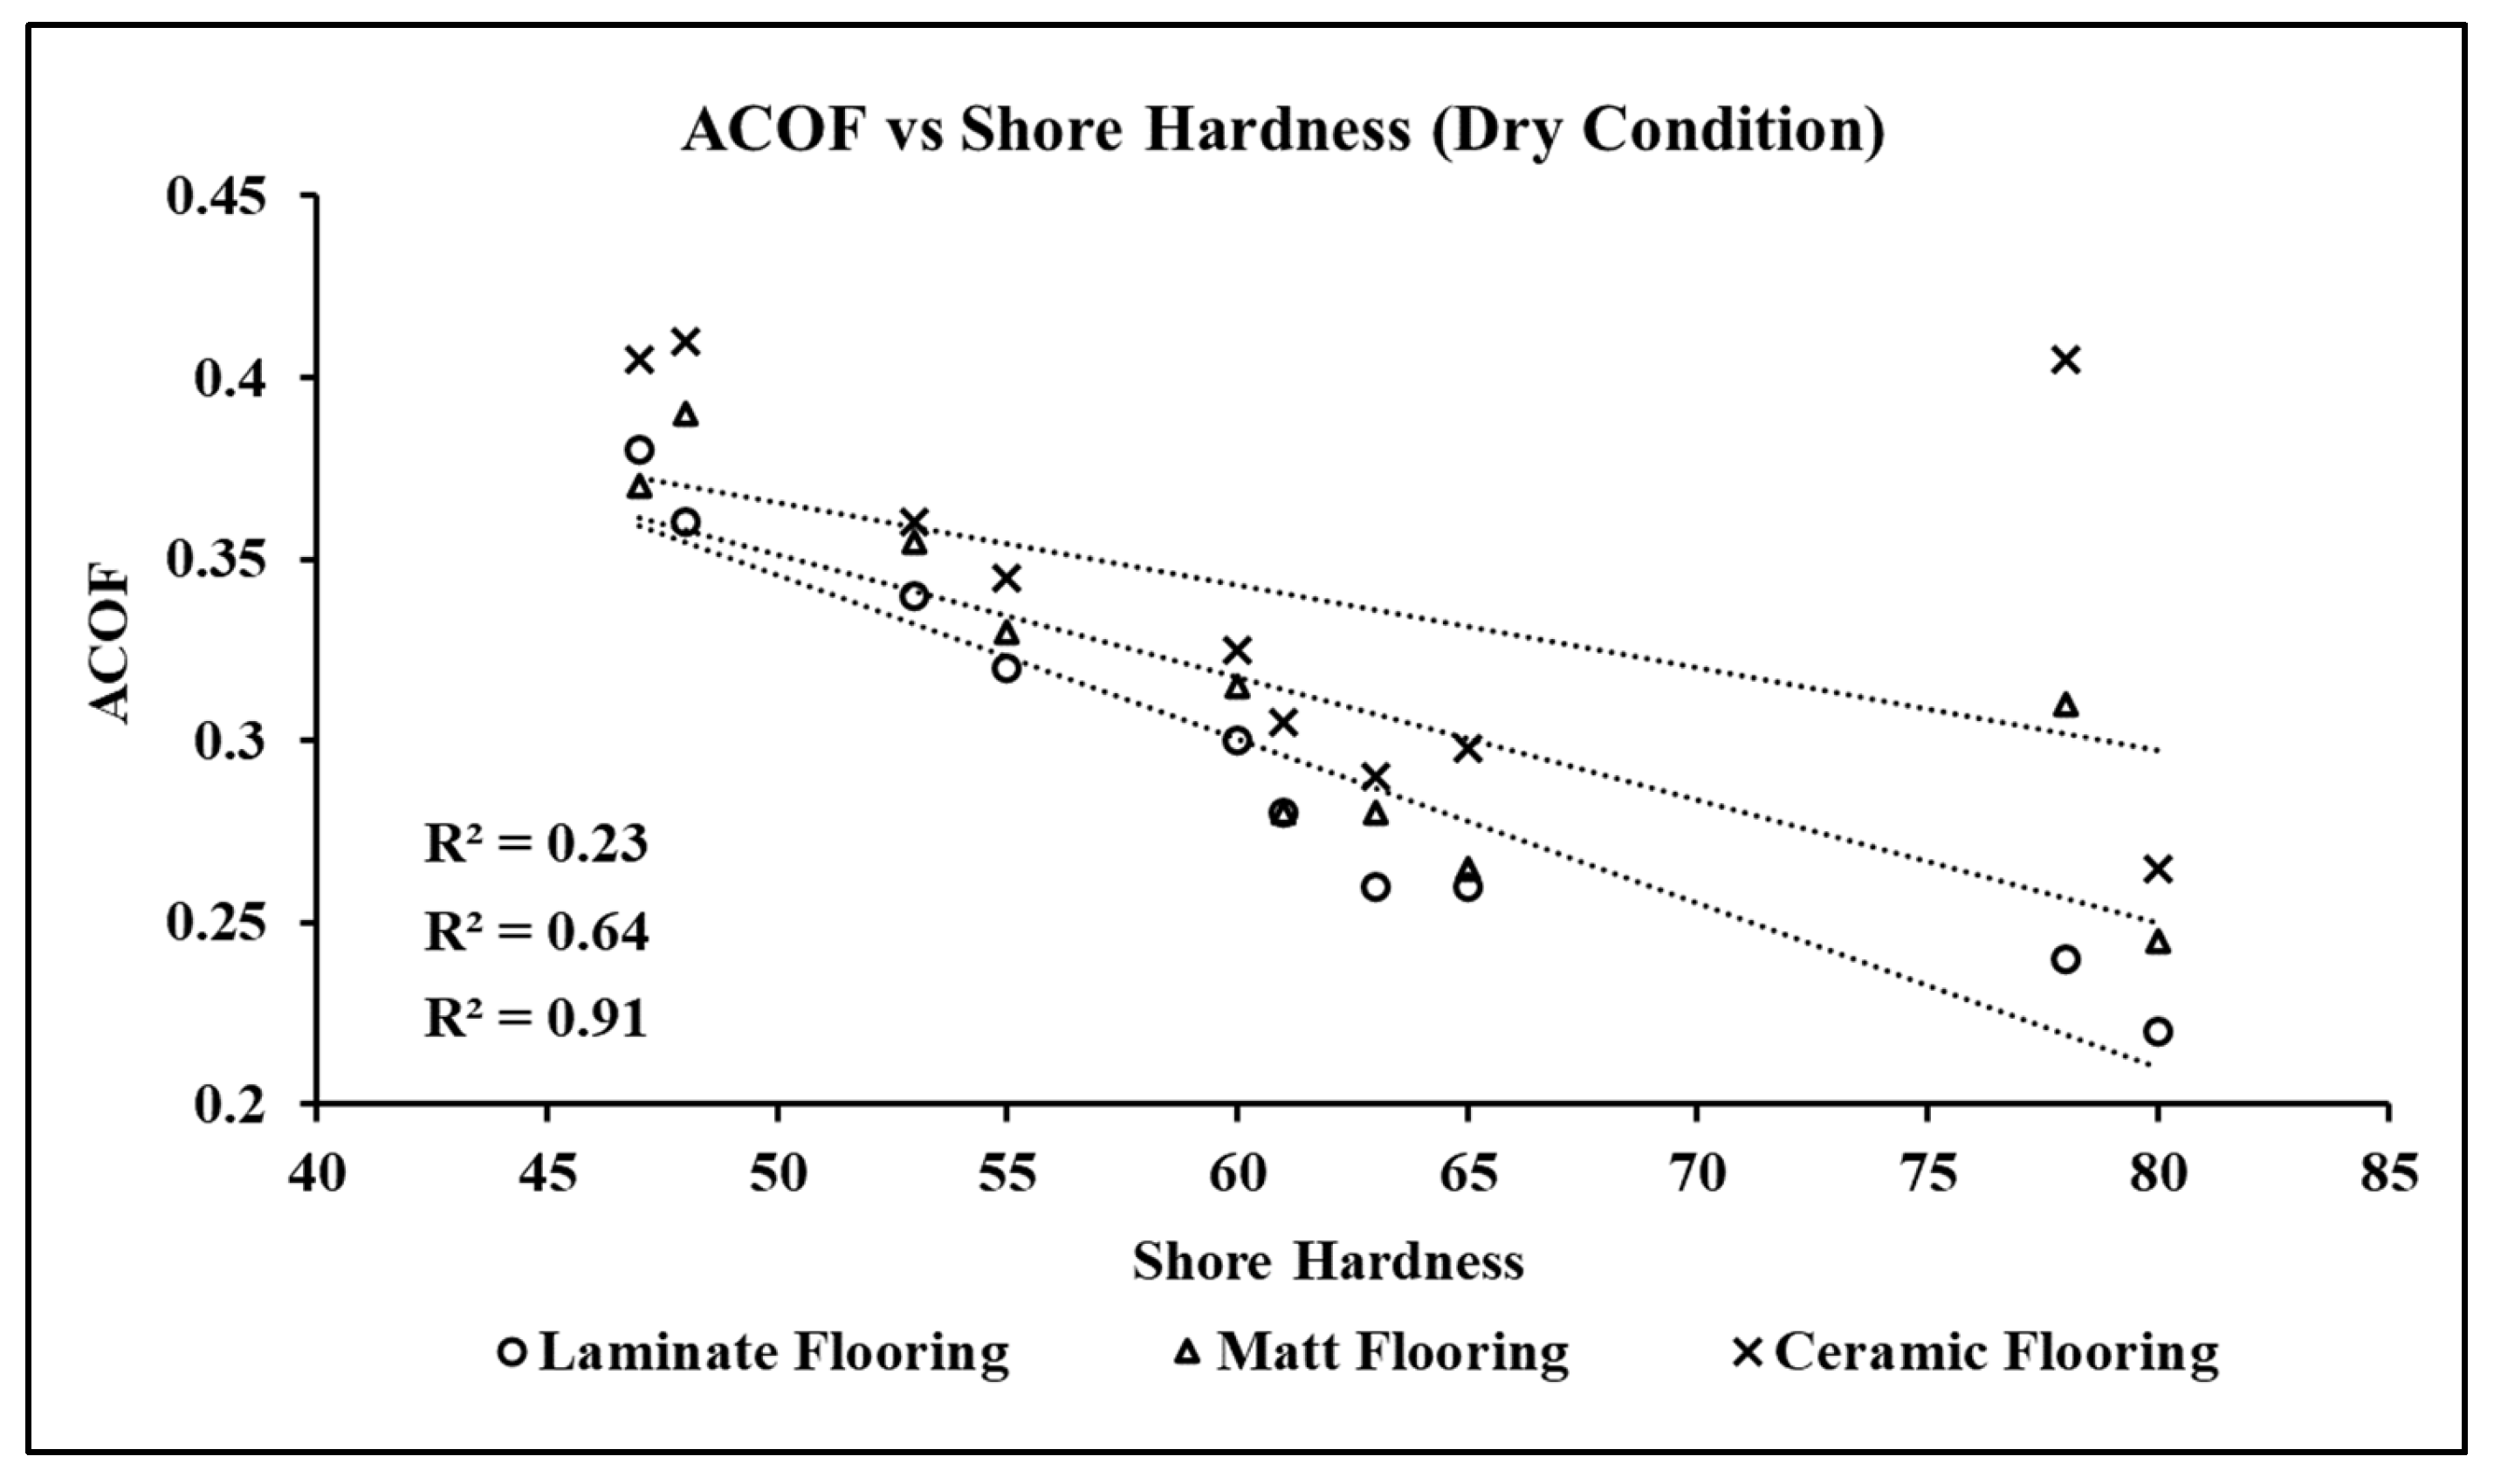
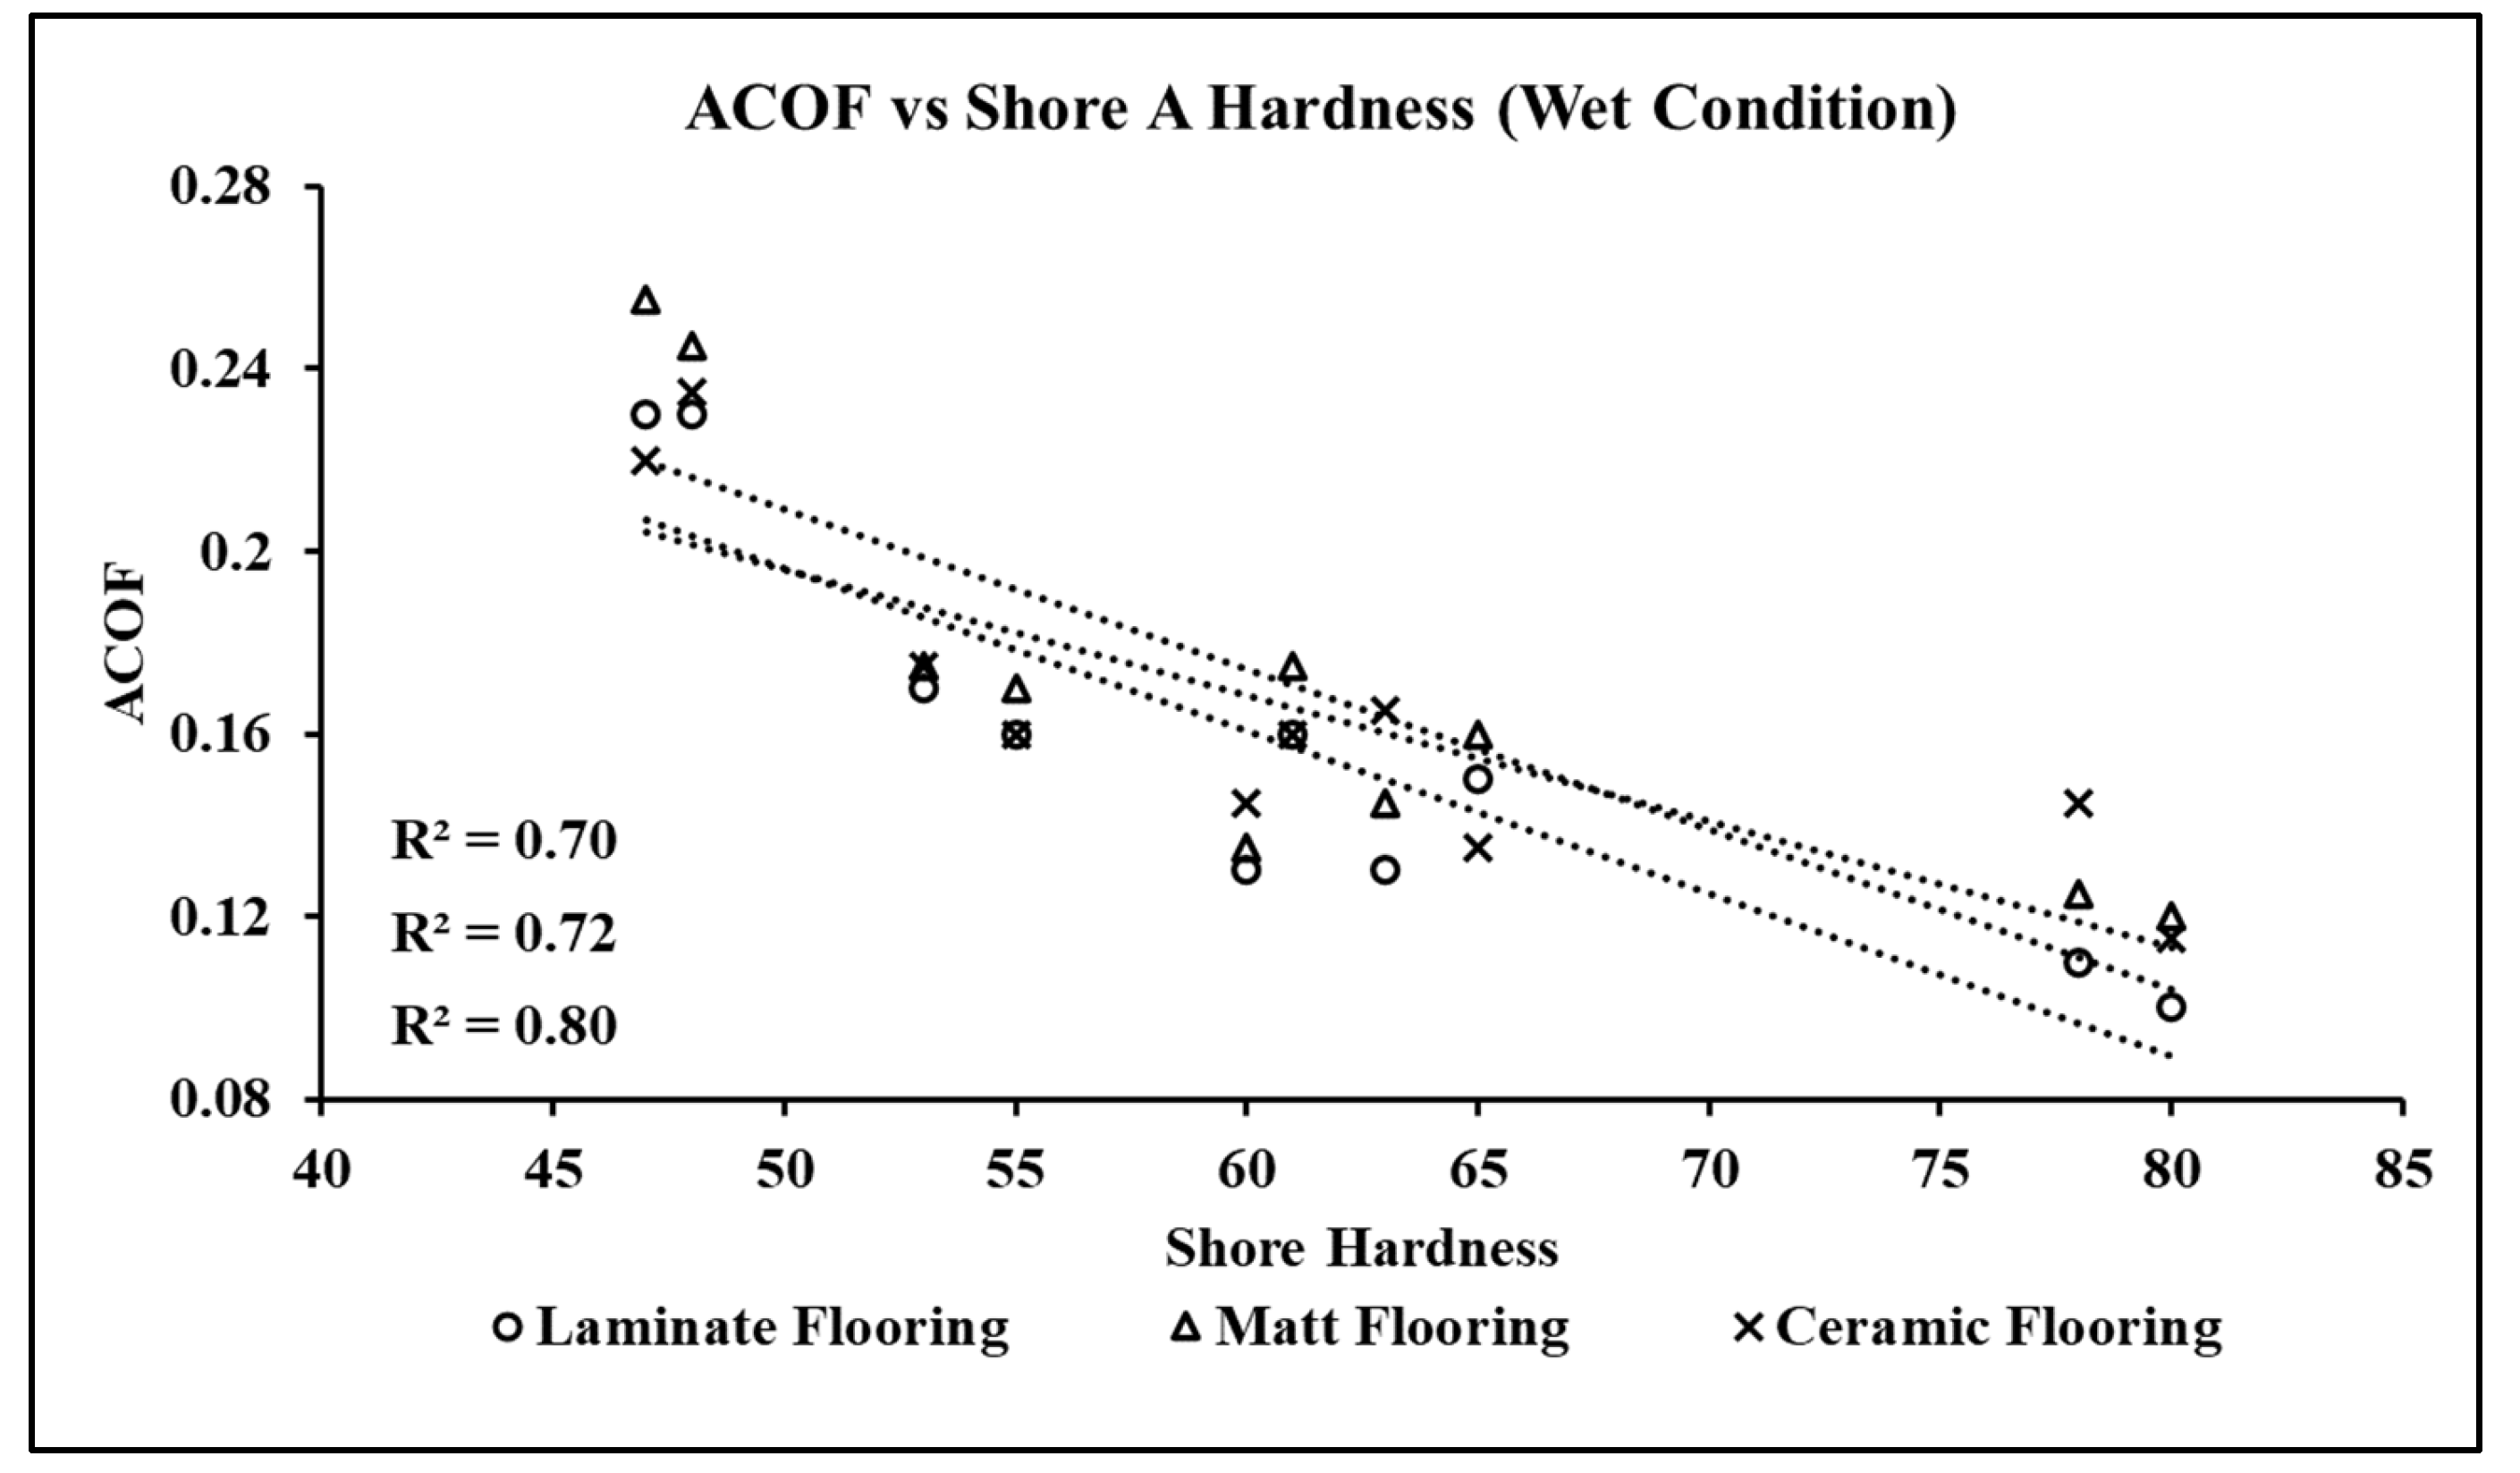
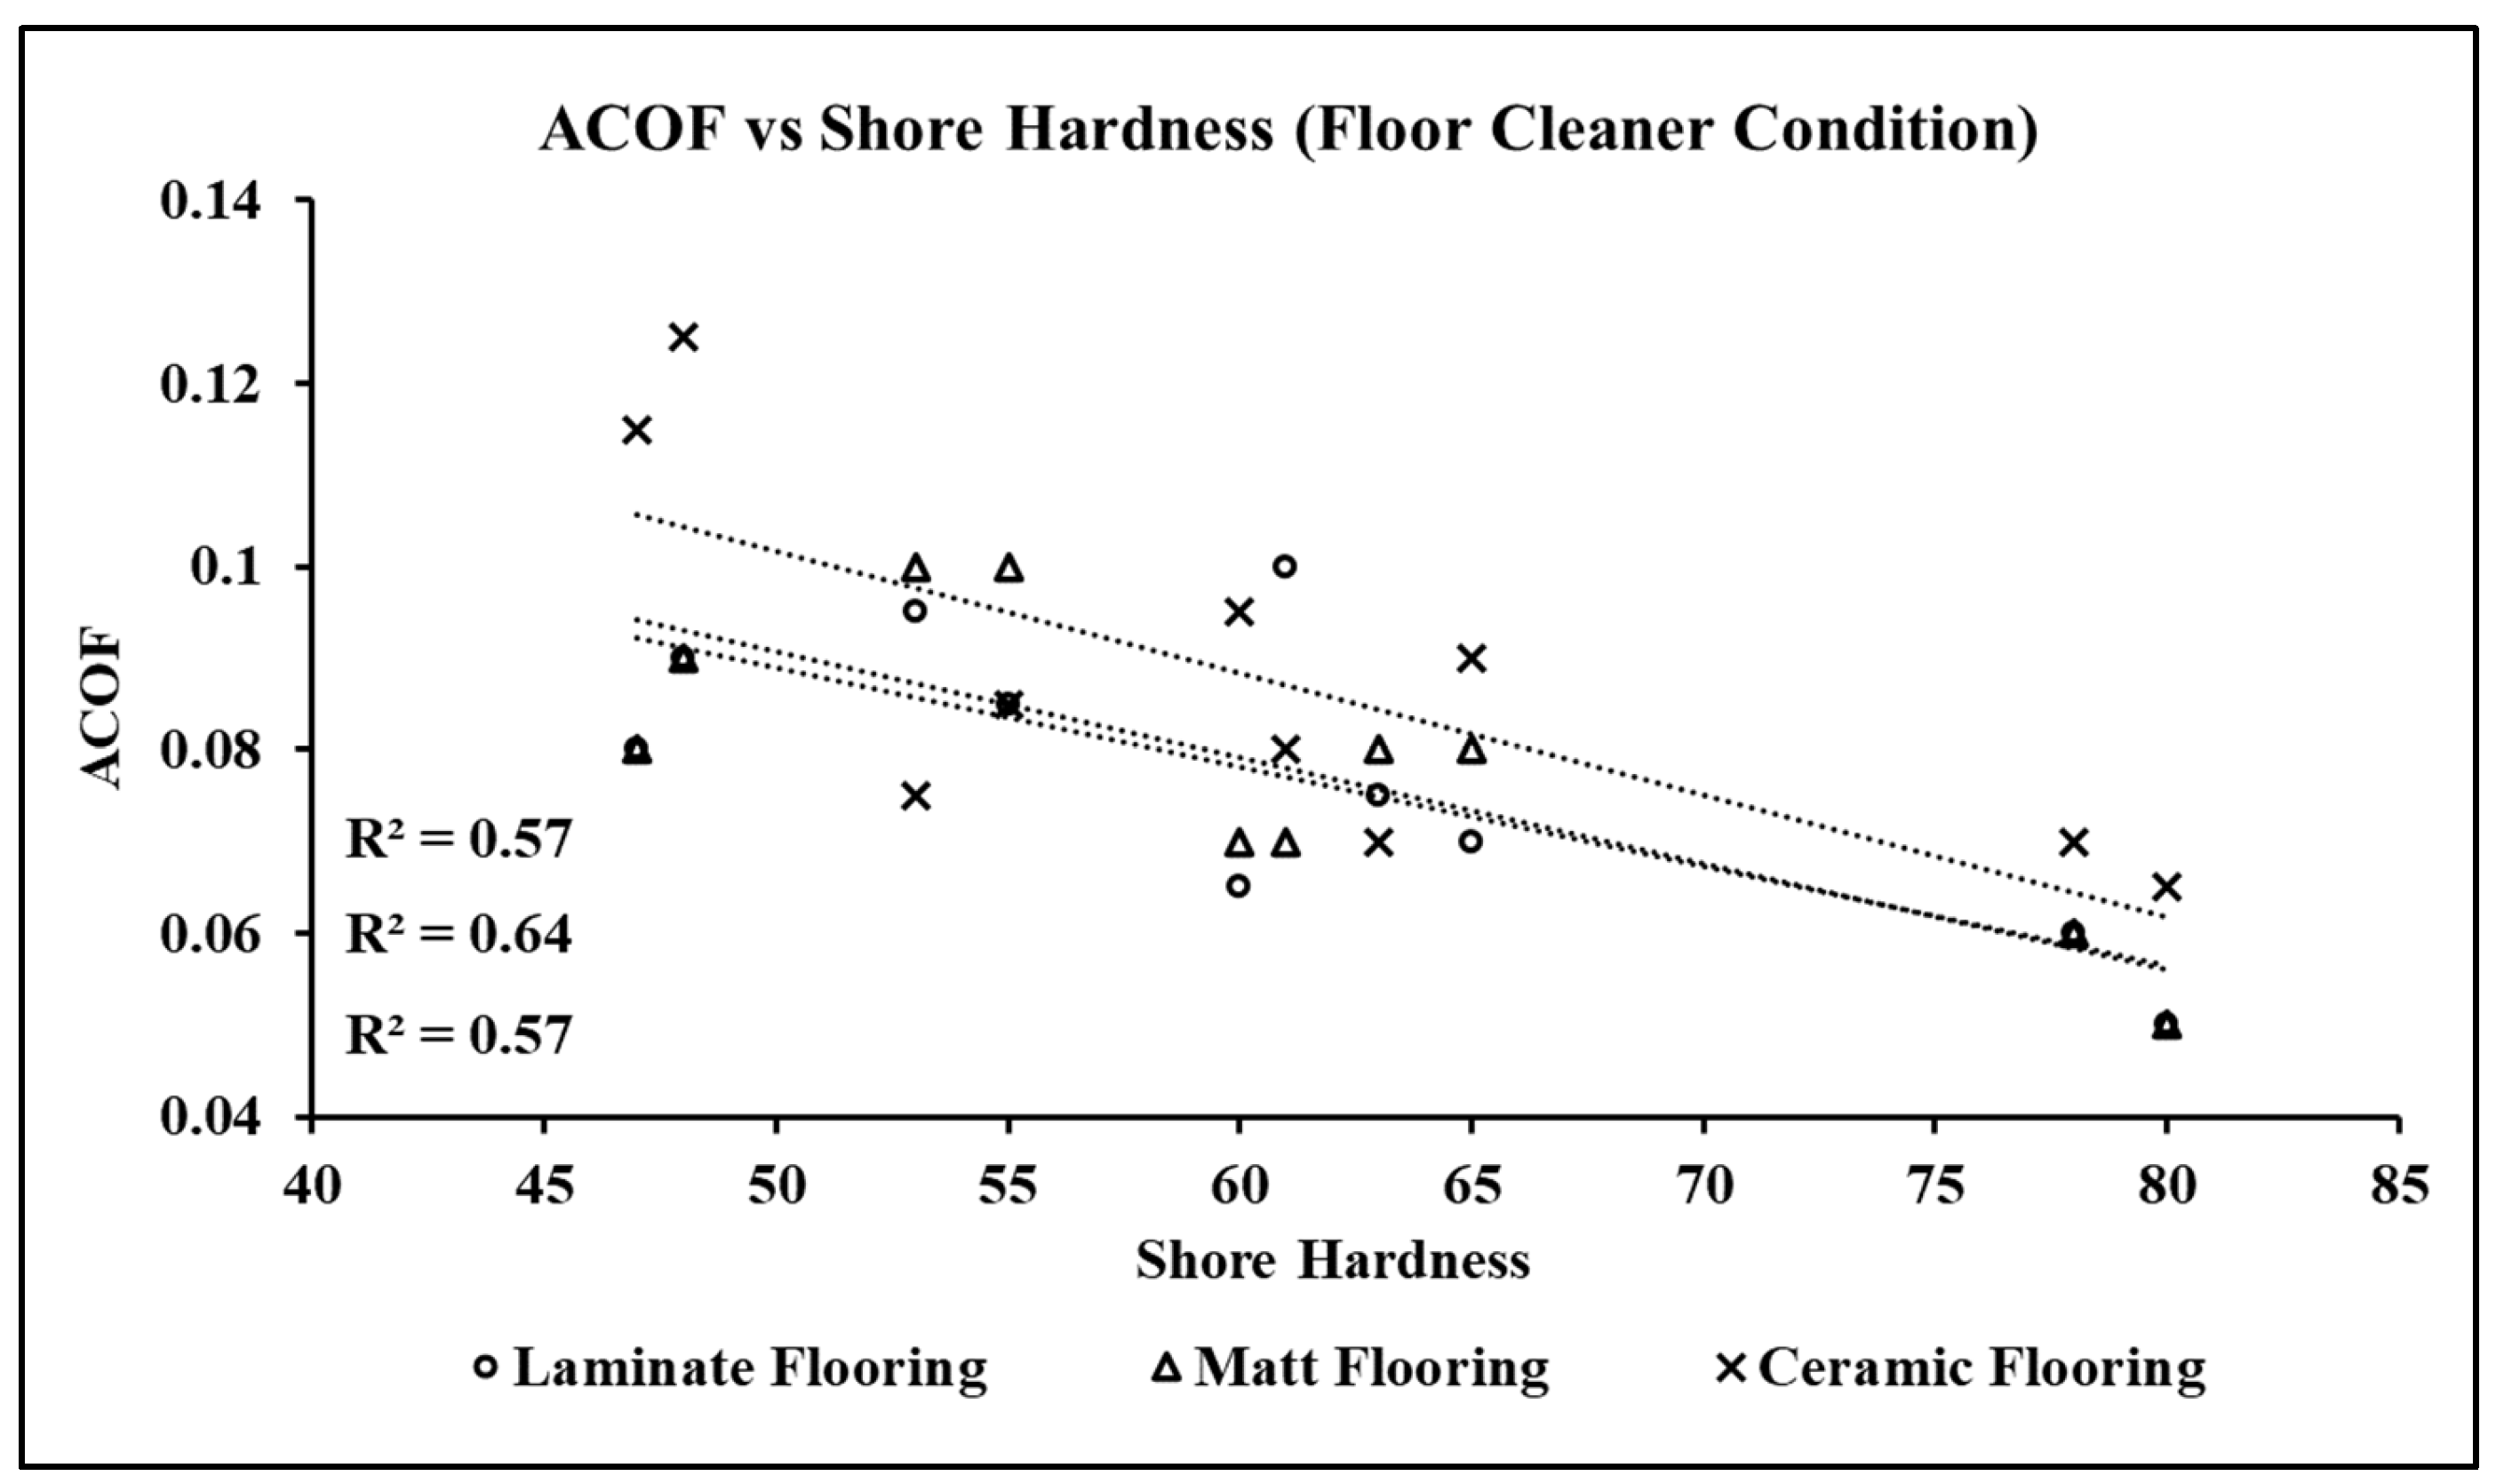
3.4.2. Effect of Shore Hardness on ACOF

Figure 10 represents the correlation between ACOF and shore hardness across the shoes in dry slipping conditions. In the case of dry laminate flooring, the shore hardness positively and strongly correlated (R2 = 0.91) with the overall traction performance of the shoes. Specifically, FS1 and FS2 showed the lowest shore A hardness values (i.e., 48 and 47, respectively) and the highest ACOF. Other shoes, such as FS7, FS8, and FS10, had moderate shore hardness values ranging from 55 to 60 and exhibited ACOF values of more than 0.3. The remaining shoes had shore hardness values greater than 60 and showed lower ACOF values. Comparing the shore hardness and ACOF of shoes tested on dry matt flooring, results showed a moderate correlation value (R2 = 0.64). In this case, around 40% of the shoes showed a low correlation of outsole hardness with the ACOF. In the case of dry ceramic flooring, ACOF showed low correlation (R2 = 0.23) with the shore hardness values of the shoes.
Figure 11 represents the correlation between ACOF and shore hardness across the shoes in wet slipping conditions. In the case of wet laminate flooring, shore hardness negatively and strongly correlated (R2 = 0.80) with the overall traction performance of the shoes. Shoes FS1 and FS2, with low shore hardness (i.e., 48 and 47, respectively) exhibited a high ACOF of 0.23. Apart from FS1 and FS2, shoes with shore hardness ranging from 53 to 60 (i.e., FS8, FS7, FS10) showed moderate ACOF ranging from 0.13 to 0.16. The remaining shoes with a shore hardness greater than 60 showed progressively lower ACOF values. Shoes FS4, FS5, FS6, FS3, and FS9, with a shore hardness of more than 60, showed low ACOF values in wet conditions. In the case of wet matt flooring, shore hardness was found to strongly (R2 = 0.72) and negatively correlate with the ACOF across all the shoes. As compared to wet laminate flooring, FS3, FS9, FS4 were the only exceptions which showed slight increases in the ACOF despite having high shore hardness. In the case of wet ceramic flooring, shore hardness was found to moderately (R2 = 0.70) and negatively correlate with the ACOF across all the shoes. In the case where floor cleaner was used as a pollutant on laminate, matt, and ceramic flooring, insignificant correlations of shore hardness with the ACOF were observed (Figure 12). Shoes tested on the laminated floor contaminated with floor cleaner showed moderate correlation (R2 = 0.57); matt flooring showed moderate correlation (R2 = 0.64); and ceramic flooring showed moderate correlation (R2 = 0.54) with the shore hardness.

4. Discussions

The objective of this study was to quantify the traction performance of low-cost and commonly available Indian formal shoes across common slipping conditions. Ten formal shoes were selected and tested across three floorings: laminate, matt, and ceramic in dry, water-contaminated, and floor-cleaner-contaminated conditions. Friction at the shoe-contaminant-floor interface was quantified by employing a whole-shoe portable and biofidelic slip testing device. Results from this study indicated high variations in the traction performance of the considered shoes with increased slipping risks across fluid contaminant conditions.
In the case of slip testing results across the flooring in dry conditions, only half of the formal shoes were found to cross the ACOF of 0.3, over which the danger of a fall is significantly reduced [42]. In the case of fluid-contaminated flooring (i.e., water and floor cleaner), none of the shoes showed slip-resistant performance, which correlates to a high risk of slips and falls. Several novel scientific findings were reported, such as an increase in the apparent contact area (i.e., above 3500 mm2) significantly leading to an increase in the overall traction on rough floorings (i.e., ceramic flooring and matt flooring) regardless of the tread geometries. Other key findings include: an increase in the shore hardness of the outsoles leads to a decrease in the footwear-surface traction on smooth floorings (i.e., laminate flooring) in dry and wet conditions. Moreover, it was also observed that within the 50 mm distance from the posterior point of the heel, when the treads were missing in certain footwear outsoles, it resulted in significantly reduced traction. Additionally, a low correlation value (R2 = 0.45) was observed between apparent contact area and traction on ceramic flooring, which possibly suggests a greater effect of surface roughness of the flooring on ACOF, over the apparent contact area. However, in the case of laminate and matt floorings, strong correlations (R2 > 0.85) suggest the possible dominance of the apparent contact area (or tread designs) in influencing ACOF, over the surface roughness of the flooring.
Some of our findings were comparable with reports in the literature; the dominance of surface roughness over the apparent contact area in ceramic flooring and the dominance of apparent contact area on surface roughness in the case of laminate and matt flooring; these are in line with a study by Meehan et al. [49]. This literature study investigated the effects of several different floorings on the available friction of footwear, and also showed that the floorings with high surface roughness lead to minimal changes in the ACOF values; whereas floorings with lower surface roughness generate comparatively higher changes in the ACOF values. In another study by Grönqvist [51], three different types of footwear materials (compact nitrile rubber, compact styrene rubber, and polyurethane, with worn-out shore A hardnesses of 65, 75, and 53, respectively) were tested on steel and plastic floorings. The study reported higher friction values for the polyurethane outsoles as compared to the other two materials. Polyurethane, as compared to other materials, was the softest and had the lowest shore A hardness values. The shoes considered in our work were made of polyurethane with properties ranging between 47A to 80A. This study is also consistent with a previous investigation by Jones et al. [43], which reported the significant impact of contact area and shoe outsole hardness on the overall ACOF. Soft outsoles (or lower hardness outsoles) showed high deformations, and thus, high contact areas led to increased friction values. In a study by Strobel et al. [41], the effect of changes in adhesion and hysteresis friction components across three different materials, i.e., two rubber-based and one polyurethane-based having shore A hardness values of 70, 60 and 40, respectively, were extensively studied. High hysteresis and lubricated adhesion friction were reported for low shore hardness material (i.e., polyurethane) across several contaminants. In our work, similar observations were reported, where the microcellular structure of the low shore hardness polyurethane could have led to increased apparent contact areas, and finally an increase in adhesion and hysteresis friction components in slipping conditions.

5. Conclusions

In conclusion, the majority of the low-cost Indian-manufactured formal shoes were not found to exhibit slip-resistant performance across common slippery conditions. Shoes having softer outsoles comparatively exhibited increased slip-resistant performance. Shoe outsoles with limited treads at the heel region showed poor traction performance as compared to other shoes. Low correlations were observed between apparent contact area and traction on ceramic flooring, which possibly suggests the greater effect of surface roughness of the flooring on ACOF, more so than the apparent contact area. However, in the case of laminate and matt floorings, strong correlations suggest the possible dominance of apparent contact area (or tread designs) in influencing ACOF, more than the surface roughness of the flooring. This work not only led to novel findings, but could help to better understand how footwear design features affect traction in common Indian footwear, which has not yet been investigated to the best of our knowledge. Additionally, the results are expected to provide guidelines to the general public and footwear manufacturers in the selection and development of safer shoes to mitigate the global problem of slips and falls.

Author Contributions

S.G.: Methodology; Validation; Investigation; Formal Analysis; Writing—Original Draft; Writing—Review and Editing. S.C.: Methodology; Data Curation; Formal Analysis; Investigation. A.M.: Data Curation; Investigation; Formal Analysis. A.C.: Conceptualization; Methodology; Formal Analysis; Supervision; Writing-Review and Editing. All authors have read and agreed to the published version of the manuscript.

Funding

This research received no external funding.

Institutional Review Board Statement

Not applicable.

Informed Consent Statement

Not applicable.

Data Availability Statement

The datasets generated during and/or analyzed during the current study are not publicly available due to large data-set but are available from the corresponding author on reasonable request.

Conflicts of Interest

The authors declare no conflict of interest.

References

  1. WHO—World Health Organization. Falls. Available online: https://www.who.int/news-room/fact-sheets/detail/falls (accessed on 30 July 2022).
  2. Berg, W.P.; Alessio, H.M.; Mills, E.M.; Tong, C. Circumstances and consequences of falls in independent community-dwelling older adults. Age Ageing 1997, 26, 261–268. [Google Scholar] [CrossRef] [PubMed] [Green Version]
  3. Bell, J.L.; Collins, J.W.; Wolf, L.; Grönqvist, R.; Chiou, S.; Chang, W.-R.; Sorock, G.S.; Courtney, T.; Lombardi, D.A.; Evanoff, B.A. Evaluation of a comprehensive slip, trip and fall prevention programme for hospital employees. Ergonomics 2009, 51, 1906–1925. [Google Scholar] [CrossRef] [PubMed]
  4. Campbell, A.J.; Borrie, M.J.; Spears, G.F.; Jackson, S.L.; Brown, J.S.; Fitzgerald, J.L. Circumstances and Consequences of Falls Experienced by a Community Population 70 Years and over during a Prospective Study. Age Ageing 1990, 19, 136–141. [Google Scholar] [CrossRef] [PubMed]
  5. Joseph, A.; Kumar, D.; Bagavandas, M. A Review of Epidemiology of Fall among Elderly in India. Indian J. Community Med. 2019, 44, 166. [Google Scholar] [CrossRef] [PubMed]
  6. Sirohi, A.; Kaur, R.; Goswami, A.K.; Mani, K.; Nongkynrih, B.; Gupta, S.K. A study of falls among elderly persons in a rural area of Haryana. Indian J. Public Health 2017, 61, 99–104. [Google Scholar] [CrossRef]
  7. Chacko, P.H.V. Epidemiology of fall and its risk factors among elders in a rural area of Coimbatore, India. Int. J. Community Med. Public Health 2017, 4, 3864–3869. [Google Scholar] [CrossRef] [Green Version]
  8. Sharma, P.K.; Bunker, C.H.; Singh, T.; Ganguly, E.; Reddy, P.S.; Newman, A.B.; Cauley, J.A. Burden and Correlates of Falls among Rural Elders of South India: Mobility and Independent Living in Elders Study. Curr. Gerontol. Geriatr. Res. 2017, 2017, 1290936. [Google Scholar] [CrossRef] [Green Version]
  9. Bhatt, H.; Sharma, P. Slip, trip and falls among women of different age groups: A case study from the northern hills of India. J. Appl. Nat. Sci. 2017, 9, 614–620. [Google Scholar] [CrossRef] [Green Version]
  10. Liberty Manual Insurance. Liberty Mutual Workplace Safety Index; Liberty Manual Insurance: Boston, MA, USA, 2017. [Google Scholar]
  11. Di Pilla, S. Slip, Trip, and Fall Prevention: A Practical Handbook, 2nd ed.; CRC Press: Boca Raton, FL, USA, 2016. [Google Scholar] [CrossRef]
  12. Jabbour, R.; Turner, S.; Hussey, L.; Page, F.; Agius, R. Workplace injury data reported by occupational physicians and general practitioners. Occup. Med. 2015, 65, 296–302. [Google Scholar] [CrossRef]
  13. Strandberg, L.; Lanshammar, H. The dynamics of slipping accidents. J. Occup. Accid. 1981, 3, 153–162. [Google Scholar] [CrossRef]
  14. Hanson, J.P.; Redfern, M.S.; Mazumdar, M. Predicting slips and falls considering required and available friction. Ergonomics 2010, 42, 1619–1633. [Google Scholar] [CrossRef]
  15. Beschorner, K.E.; Li, Y.S.; Yamaguchi, T.; Ells, W.; Bowman, R. The Future of Footwear Friction. In Lecture Notes in Networks and Systems; Springer: Cham, Switzerland, 2021; Volume 223, pp. 841–855. [Google Scholar] [CrossRef]
  16. Beschorner, K.E.; Iraqi, A.; Redfern, M.S.; Cham, R.; Li, Y. Predicting slips based on the STM 603 whole-footwear tribometer under different coefficient of friction testing conditions. Ergonomics 2019, 62, 668–681. [Google Scholar] [CrossRef]
  17. Beschorner, K.E.; Redfern, M.S.; Porter, W.L.; Debski, R.E. Effects of slip testing parameters on measured coefficient of friction. Appl. Ergon. 2007, 38, 773–780. [Google Scholar] [CrossRef]
  18. Chang, W.-R.; Grönqvist, R.; Leclercq, S.; Myung, R.; Makkonen, L.; Strandberg, L.; Brungraber, R.J.; Mattke, U.; Thorpe, S.C. The role of friction in the measurement of slipperiness, Part 1: Friction mechanisms and definition of test conditions. Ergonomics 2001, 44, 1217–1232. [Google Scholar] [CrossRef]
  19. Sundaram, V.H.; Hemler, S.L.; Chanda, A.; Haight, J.M.; Redfern, M.S.; Beschorner, K.E. Worn region size of shoe outsole impacts human slips: Testing a mechanistic model. J. Biomech. 2020, 105, 109797. [Google Scholar] [CrossRef]
  20. Chang, W.-R.; Grönqvist, R.; Leclercq, S.; Brungraber, R.J.; Mattke, U.; Strandberg, L.; Thorpe, S.C.; Myung, R.; Makkonen, L.; Courtney, T. The role of friction in the measurement of slipperiness, Part 2: Survey of friction measurement devices. Ergonomics 2001, 44, 1233–1261. [Google Scholar] [CrossRef]
  21. Aschan, C.; Hirvonen, M.; Mannelin, T.; Rajamäki, E. Development and validation of a novel portable slip simulator. Appl. Ergon. 2005, 36, 585–593. [Google Scholar] [CrossRef]
  22. Beschorner, K.E.; Siegel, J.L.; Hemler, S.L.; Sundaram, V.H.; Chanda, A.; Iraqi, A.; Haight, J.M.; Redfern, M.S. An observational ergonomic tool for assessing the worn condition of slip-resistant shoes. Appl. Ergon. 2020, 88, 103140. [Google Scholar] [CrossRef]
  23. Gupta, S.; Sidhu, S.S.; Chatterjee, S.; Malviya, A.; Singh, G.; Chanda, A. Effect of Floor Coatings on Slip-Resistance of Safety Shoes. Coatings 2022, 12, 1455. [Google Scholar] [CrossRef]
  24. Beschorner, K.E.; Chanda, A.; Moyer, B.E.; Reasinger, A.; Griffin, S.C.; Johnston, I.M. Validating the ability of a portable shoe-floor friction testing device, NextSTEPS, to predict human slips. Appl. Ergon. 2022, 106, 103854. [Google Scholar] [CrossRef]
  25. Jakobsen, L.; Lysdal, F.G.; Bagehorn, T.; Kersting, U.G.; Sivebaek, I.M. Evaluation of an actuated force plate-based robotic test setup to assess the slip resistance of footwear. Int. J. Ind. Ergon. 2022, 88, 103253. [Google Scholar] [CrossRef]
  26. Yamaguchi, T.; Katsurashima, Y.; Hokkirigawa, K. Effect of rubber block height and orientation on the coefficients of friction against smooth steel surface lubricated with glycerol solution. Tribol. Int. 2017, 110, 96–102. [Google Scholar] [CrossRef]
  27. Singh, G.; Beschorner, K.E. A Method for Measuring Fluid Pressures in the Shoe–Floor–Fluid Interface: Application to Shoe Tread Evaluation. IIE Trans. Occup. Ergon. Hum. Factors 2014, 2, 53–59. [Google Scholar] [CrossRef] [PubMed]
  28. Li, K.W.; Chen, C.J. The effect of shoe soling tread groove width on the coefficient of friction with different sole materials, floors, and contaminants. Appl. Ergon. 2004, 35, 499–507. [Google Scholar] [CrossRef] [PubMed]
  29. Li, K.W.; Chin, J.C. Effects of tread groove orientation and width of the footwear pads on measured friction coefficients. Saf. Sci. 2005, 43, 391–405. [Google Scholar] [CrossRef]
  30. Yamaguchi, T.; Umetsu, T.; Ishizuka, Y.; Kasuga, K.; Ito, T.; Ishizawa, S.; Hokkirigawa, K. Development of new footwear sole surface pattern for prevention of slip-related falls. Saf. Sci. 2012, 50, 986–994. [Google Scholar] [CrossRef]
  31. Yamaguchi, T.; Hokkirigawa, K. Development of a High Slip-resistant Footwear Outsole Using a Hybrid Rubber Surface Pattern. Ind. Health 2014, 52, 414–423. [Google Scholar] [CrossRef] [Green Version]
  32. Jakobsen, L.; Lysdal, F.G.; Bagehorn, T.; Kersting, U.G.; Sivebaek, I.M. The effect of footwear outsole material on slip resistance on dry and contaminated surfaces with geometrically controlled outsoles. Ergonomics 2022. ahead of print. [Google Scholar] [CrossRef]
  33. Nishi, T.; Yamaguchi, T.; Hokkirigawa, K. Development of high slip-resistant footwear outsole using rubber surface filled with activated carbon/sodium chloride. Sci. Rep. 2022, 12, 267. [Google Scholar] [CrossRef]
  34. Gupta, S.; Chatterjee, S.; Chanda, A. Effect of footwear material wear on slips and falls. Mater. Today Proc. 2022, 62, 3508–3515. [Google Scholar] [CrossRef]
  35. Hemler, S.L.; Pliner, E.M.; Redfern, M.S.; Haight, J.M.; Beschorner, K.E. Effects of natural shoe wear on traction performance: A longitudinal study. Footwear Sci. 2021, 14, 1–12. [Google Scholar] [CrossRef]
  36. Iraqi, A.; Vidic, N.S.; Redfern, M.S.; Beschorner, K.E. Prediction of coefficient of friction based on footwear outsole features. Appl. Ergon. 2020, 82, 102963. [Google Scholar] [CrossRef]
  37. Derler, S.; Huber, R.; Kausch, F.; Meyer, V.R. Effectiveness, durability and wear of anti-slip treatments for resilient floor coverings. Saf. Sci. 2015, 76, 12–20. [Google Scholar] [CrossRef]
  38. Chatterjee, S.; Gupta, S.; Chanda, A. Barefoot Slip Risk in Indian Bathrooms: A Pilot Study. Tribol. Trans. 2022, 1–15. [Google Scholar] [CrossRef]
  39. Chatterjee, S.; Gupta, S.; Chanda, A. Barefoot slip risk assessment of Indian manufactured ceramic flooring tiles. Mater. Today Proc. 2022, 62, 3699–3706. [Google Scholar] [CrossRef]
  40. Chatterjee, S.; Chanda, A. Development of a Tribofidelic Human Heel Surrogate for Barefoot Slip Testing. J. Bionic Eng. 2022, 19, 429–439. [Google Scholar] [CrossRef]
  41. Strobel, C.M.; Menezes, P.L.; Lovell, M.R.; Beschorner, K.E. Analysis of the contribution of adhesion and hysteresis to shoe-floor lubricated friction in the boundary lubrication regime. Tribol. Lett. 2012, 47, 341–347. [Google Scholar] [CrossRef]
  42. Chanda, A.; Jones, T.G.; Beschorner, K.E. Generalizability of Footwear Traction Performance across Flooring and Contaminant Conditions. Tribol. Lett. 2018, 6, 98–108. [Google Scholar] [CrossRef]
  43. Jones, T.; Iraqi, A.; Beschorner, K. Performance testing of work shoes labeled as slip resistant. Appl. Ergon. 2018, 68, 304–312. [Google Scholar] [CrossRef]
  44. Albert, D.; Moyer, B.; Beschorner, K.E. Three-Dimensional Shoe Kinematics During Unexpected Slips: Implications for Shoe–Floor Friction Testing. IISE Trans. Occup. Ergon. Hum. Factors 2017, 5, 1–11. [Google Scholar] [CrossRef]
  45. Redfern, M.S.; Cham, R.; Gielo-Perczak, K.; Grönqvist, R.; Hirvonen, M.; Lanshammar, H.; Marpet, M.; Pai, C.Y.C.; Powers, C.J. Biomechanics of slips. Ergonomics 2001, 44, 1138–1166. [Google Scholar] [CrossRef] [PubMed]
  46. ASTM F2913-19; Standard Test Method for Measuring the Coefficient of Friction for Evaluation of Slip Performance of Footwear and Test Surfaces/Flooring Using a Whole Shoe Tester. ASTM International: West Conshohocken, PA, USA, 2019.
  47. Iraqi, A.; Cham, R.; Redfern, M.S.; Beschorner, K.E. Coefficient of friction testing parameters influence the prediction of human slips. Appl. Ergon. 2018, 70, 118–126. [Google Scholar] [CrossRef] [PubMed]
  48. Hemler, S.L.; Charbonneau, D.N.; Iraqi, A.; Redfern, M.S.; Haight, J.M.; Moyer, B.E.; Beschorner, K.E. Changes in under-shoe traction and fluid drainage for progressively worn shoe tread. Appl. Ergon. 2019, 80, 35–42. [Google Scholar] [CrossRef] [PubMed]
  49. Meehan, E.E.; Vidic, N.; Beschorner, K.E. In contrast to slip-resistant shoes, fluid drainage capacity explains friction performance across shoes that are not slip-resistant. Appl. Ergon. 2022, 100, 103663. [Google Scholar] [CrossRef]
  50. Hemler, S.L.; Pliner, E.M.; Redfern, M.S.; Haight, J.M.; Beschorner, K.E. Traction performance across the life of slip-resistant footwear: Preliminary results from a longitudinal study. J. Saf. Res. 2020, 74, 219–225. [Google Scholar] [CrossRef]
  51. Grönqvist, R. Mechanisms of friction and assessment of slip resistance of new and used footwear soles on contaminated floors. Ergonomics 2007, 38, 224–241. [Google Scholar] [CrossRef]
Figure 1. Heel region of the selected Indian formal shoes. Starting from top left (FS1) to bottom right (FS10).
Surfaces 05 00035 g001
Figure 2. Flooring Surfaces: (a) laminate, (b) matt, and (c) ceramic.
Surfaces 05 00035 g002
Figure 3. Whole-shoe portable slip tester.
Surfaces 05 00035 g003
Figure 4. Traction performance of shoes on laminate flooring in: (a) dry condition, (b) water-contaminated condition, and (c) floor-cleaner-contaminated condition.
Surfaces 05 00035 g004aSurfaces 05 00035 g004b
Figure 5. Traction performance of shoes on matt flooring in: (a) dry condition, (b) water-contaminated condition, and (c) floor-cleaner-contaminated condition.
Surfaces 05 00035 g005
Figure 6. Traction performance of shoes on ceramic flooring in: (a) dry condition, (b) water-contaminated condition, and (c) floor-cleaner-contaminated condition.
Surfaces 05 00035 g006aSurfaces 05 00035 g006b
Figure 7. Correlation between apparent contact area and ACOF across the shoes in dry condition.
Surfaces 05 00035 g007
Figure 8. Correlation between apparent contact area and ACOF across tested shoes in wet condition.
Surfaces 05 00035 g008
Figure 9. Correlation between apparent contact area and ACOF across tested shoes in the floor cleaner contaminant condition.
Surfaces 05 00035 g009
Figure 10. Correlation between shore hardness and ACOF across the shoes in dry slipping condition.
Surfaces 05 00035 g010
Figure 11. Correlation between shore hardness and ACOF across the shoes in wet slipping condition.
Surfaces 05 00035 g011
Figure 12. Correlation between shore hardness and ACOF across the shoes in the floor cleaner contaminant condition.
Surfaces 05 00035 g012
Table 1. Shore A hardness of formal shoes.
Formal FootwearShore Hardness
FS148A
FS247A
FS378A
FS465A
FS561A
FS663A
FS755A
FS853A
FS980A
FS1060A
Publisher’s Note: MDPI stays neutral with regard to jurisdictional claims in published maps and institutional affiliations.

