Surface Plasmon Resonance-Based Temperature Sensor with Outer Surface Metal Coating on Multi-Core Photonic Crystal Fibre


Abstract
:1. Introduction
2. Design and Numerical Method
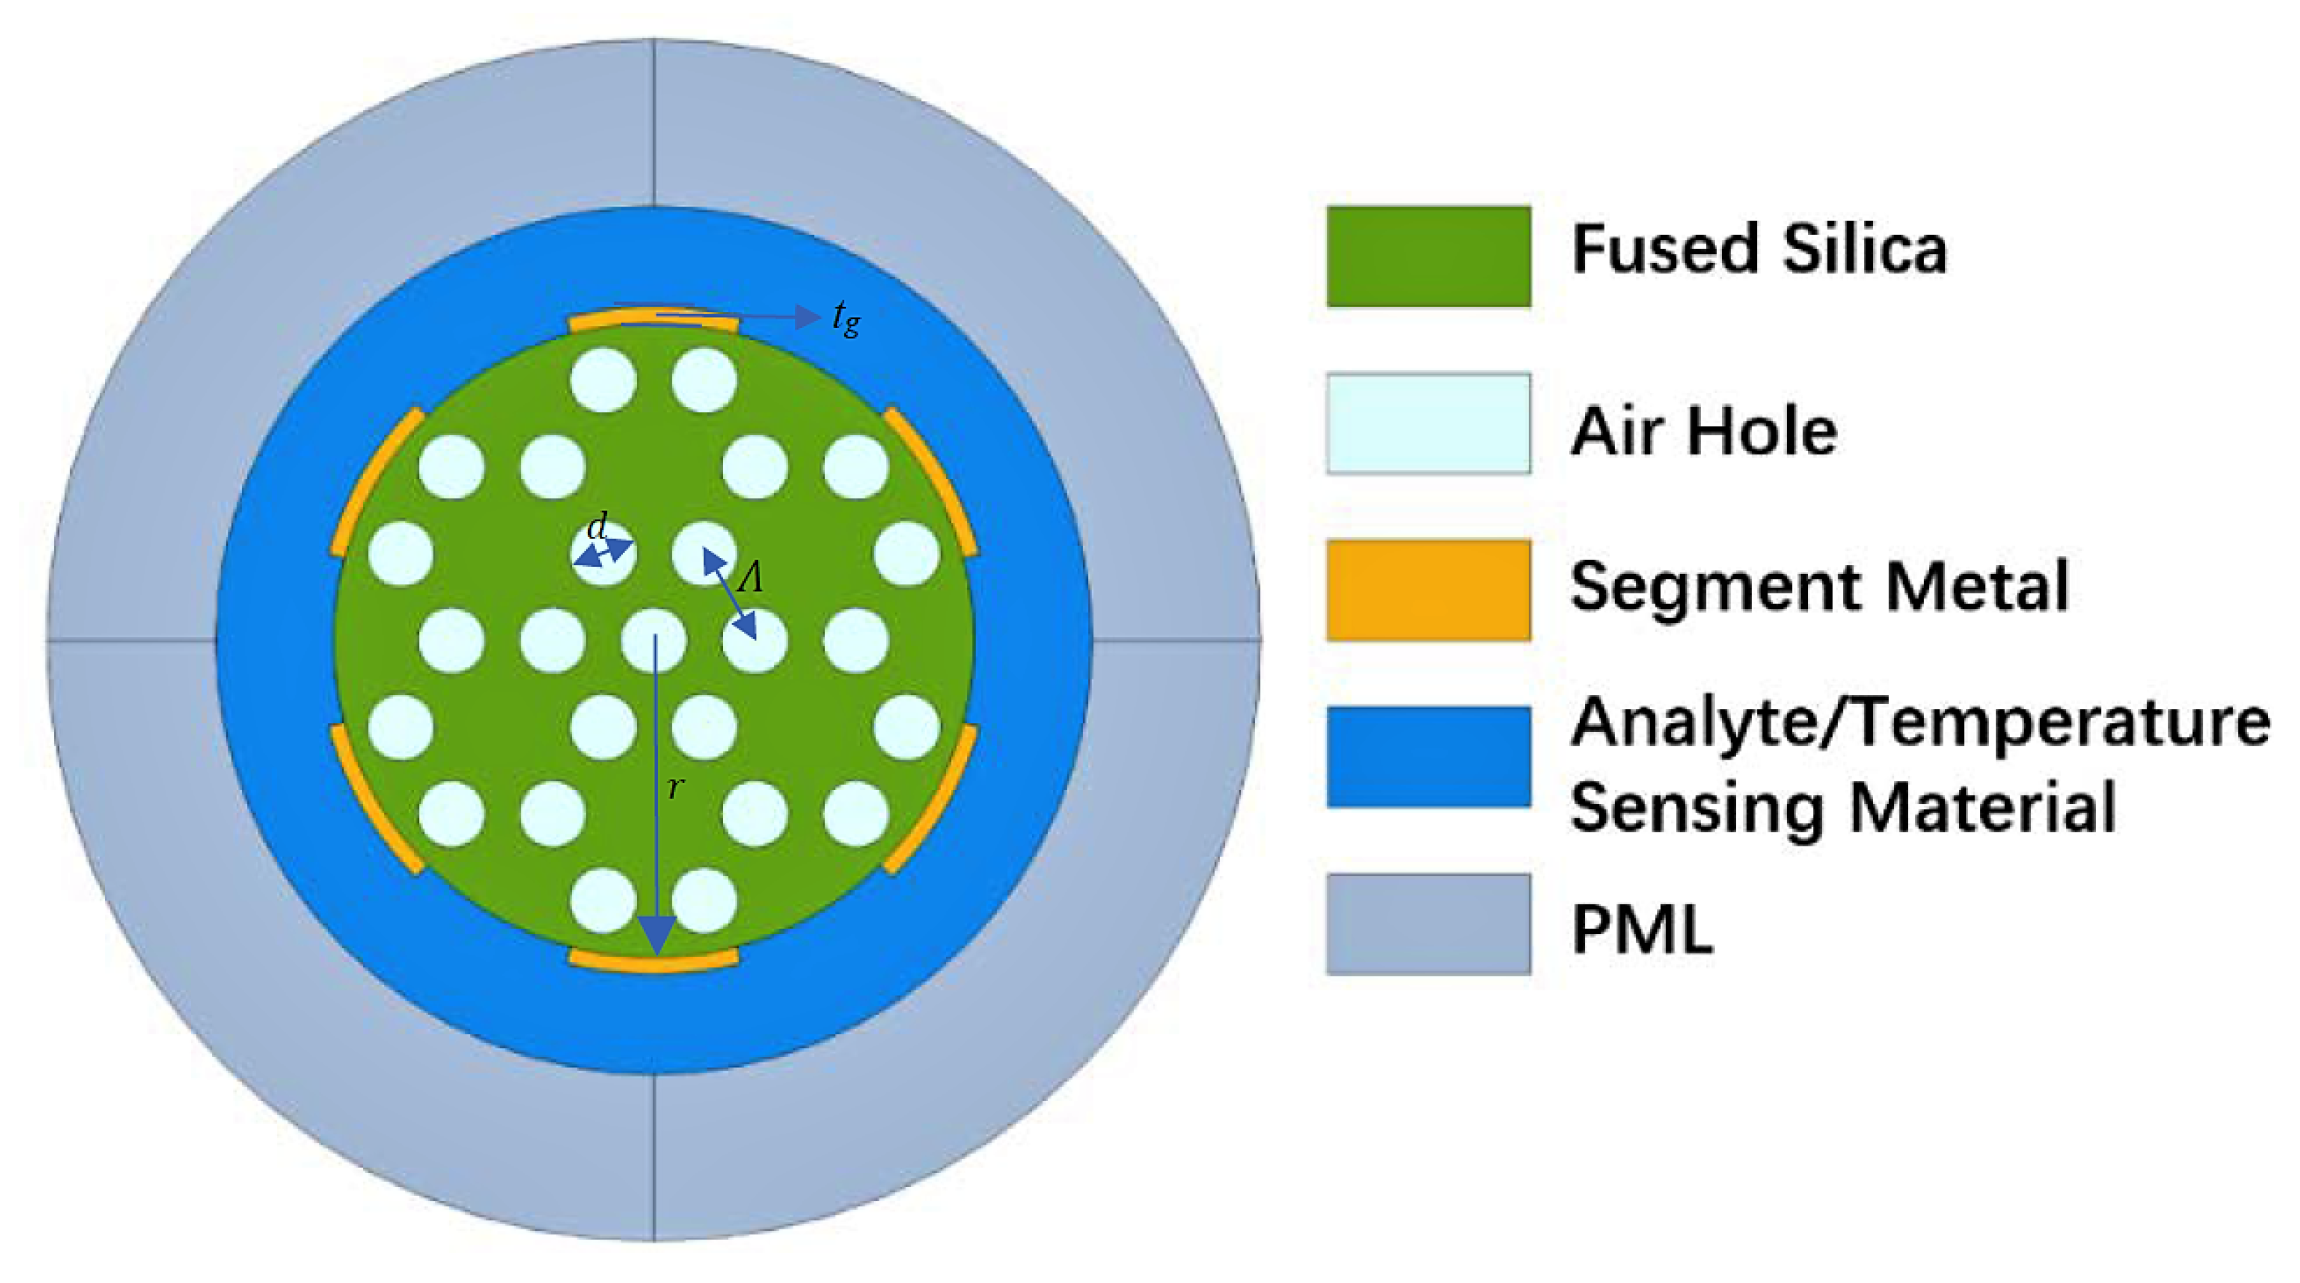
2.1. Design Principles of the Two-Dimensional Fibre Sensor
2.2. Numerical Analysis
3. FEM Simulation Results and Discussion
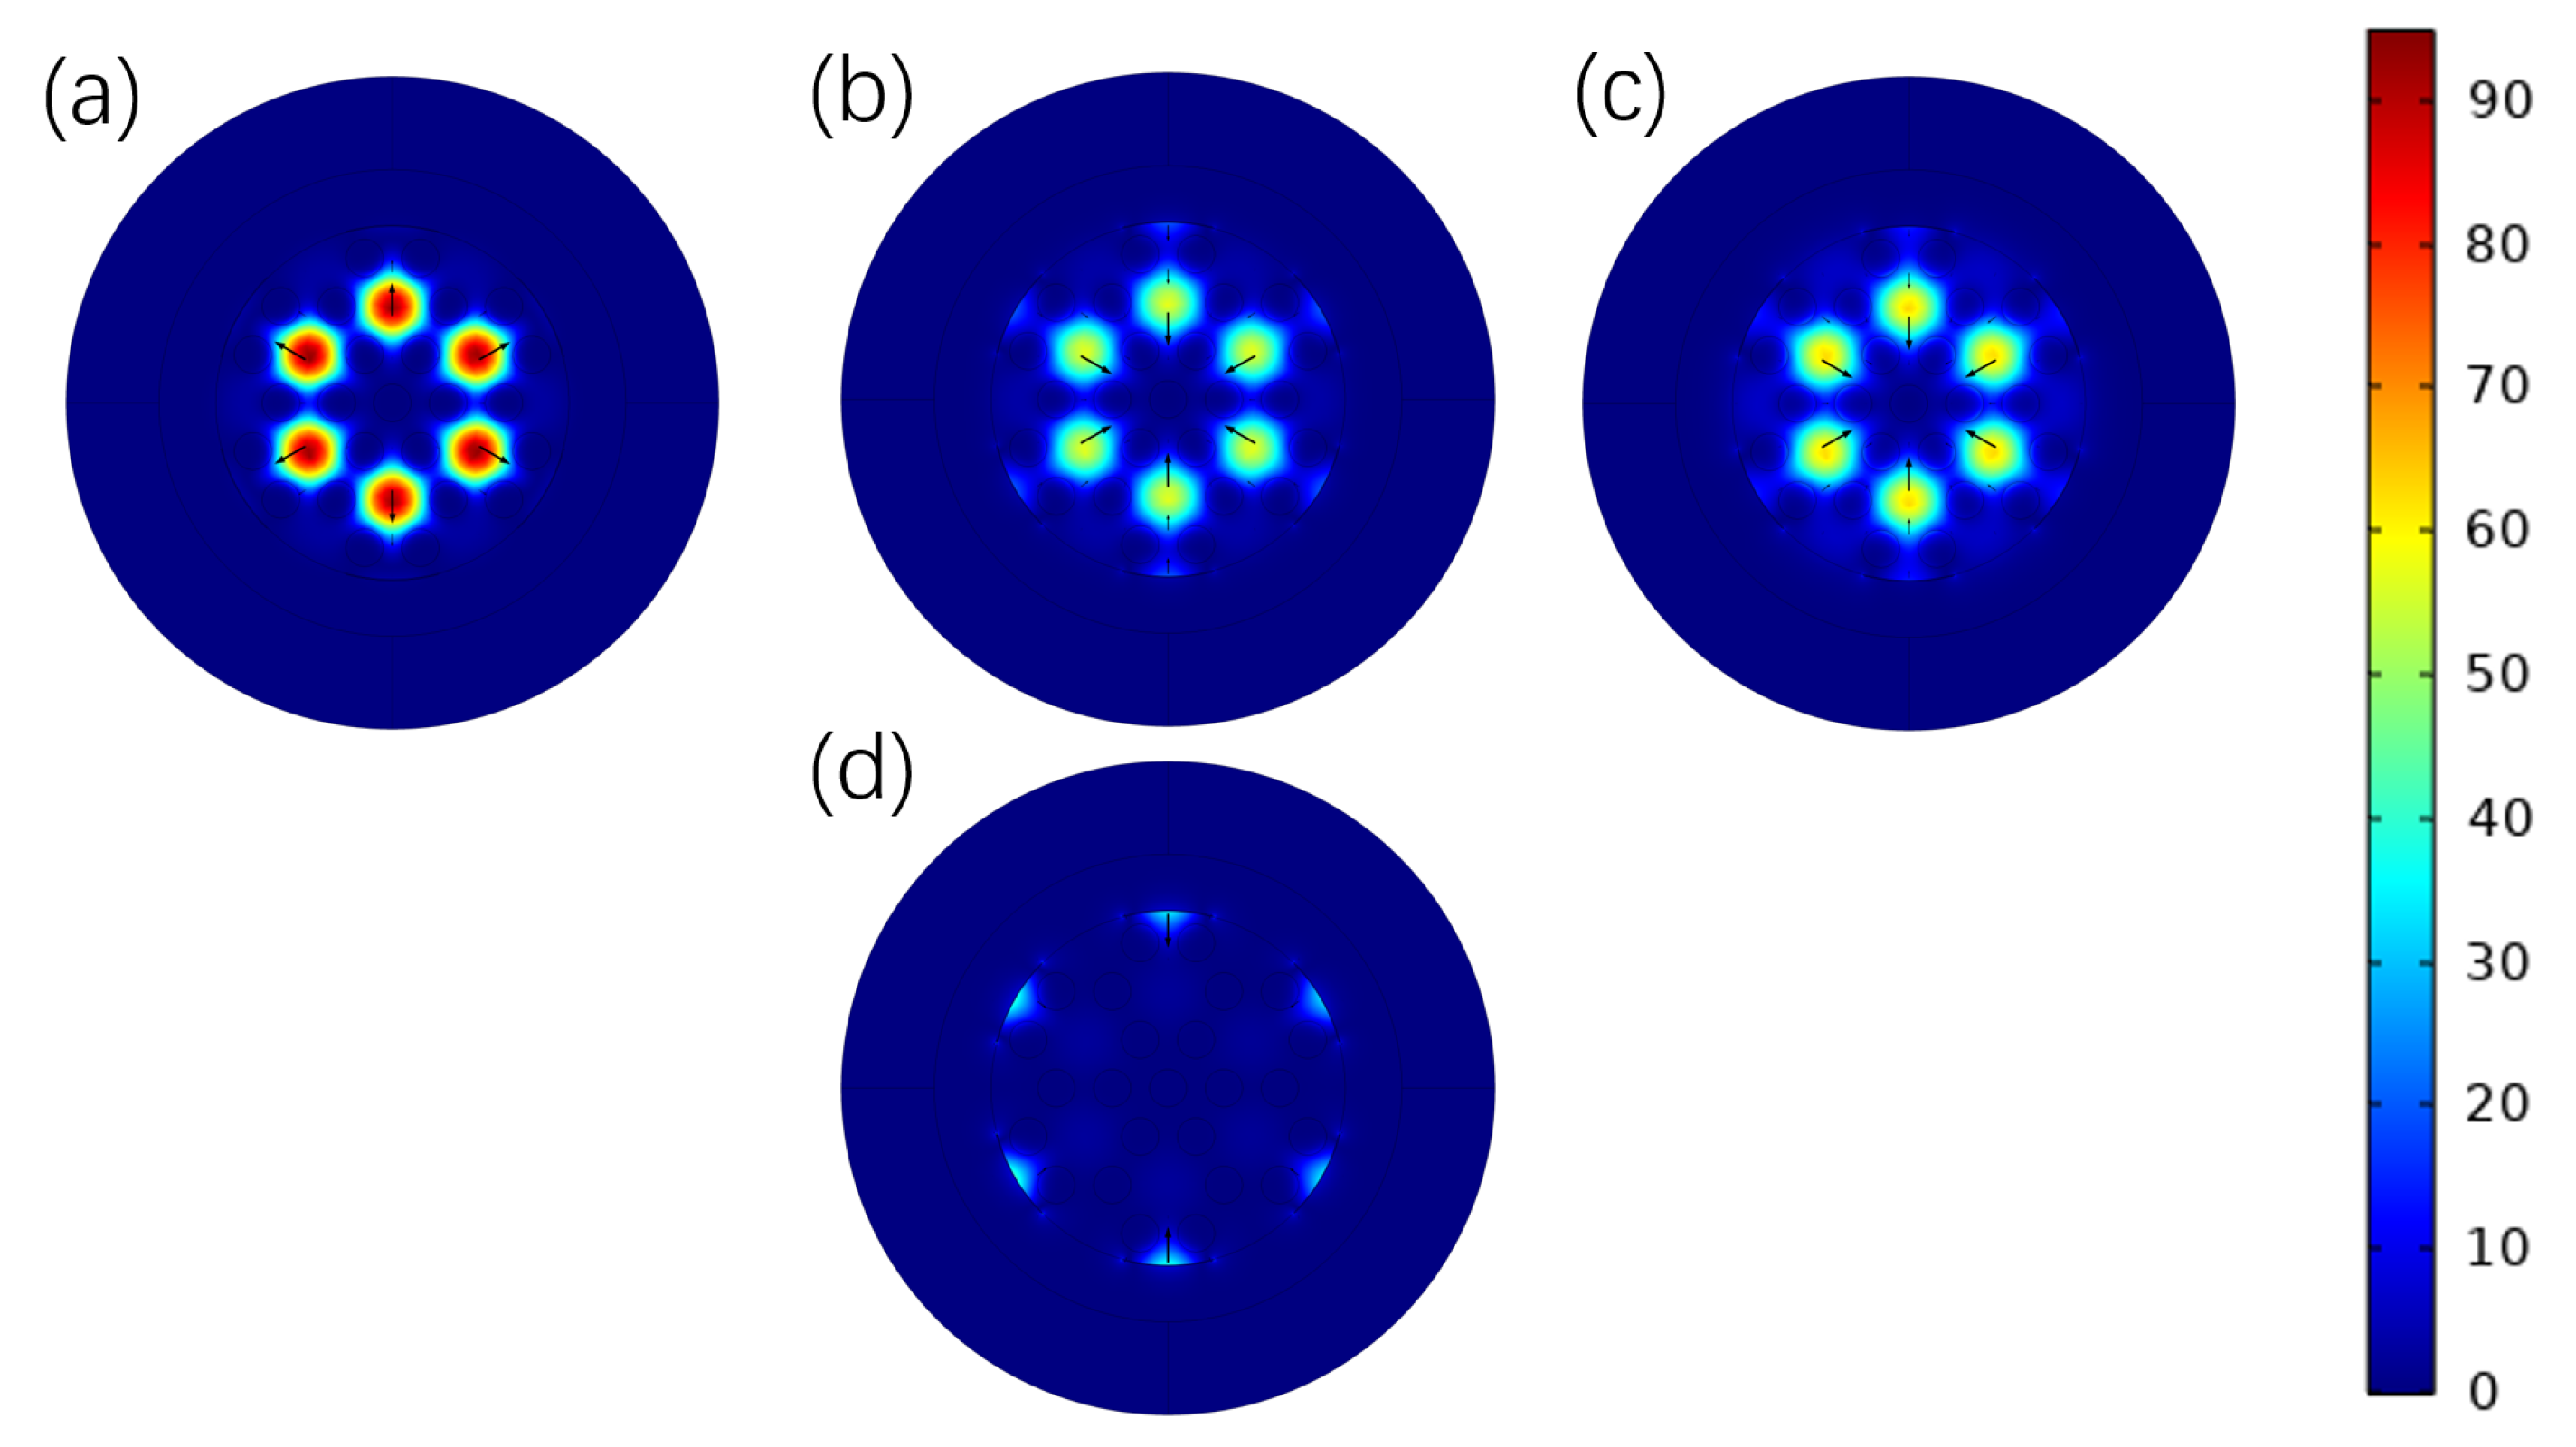
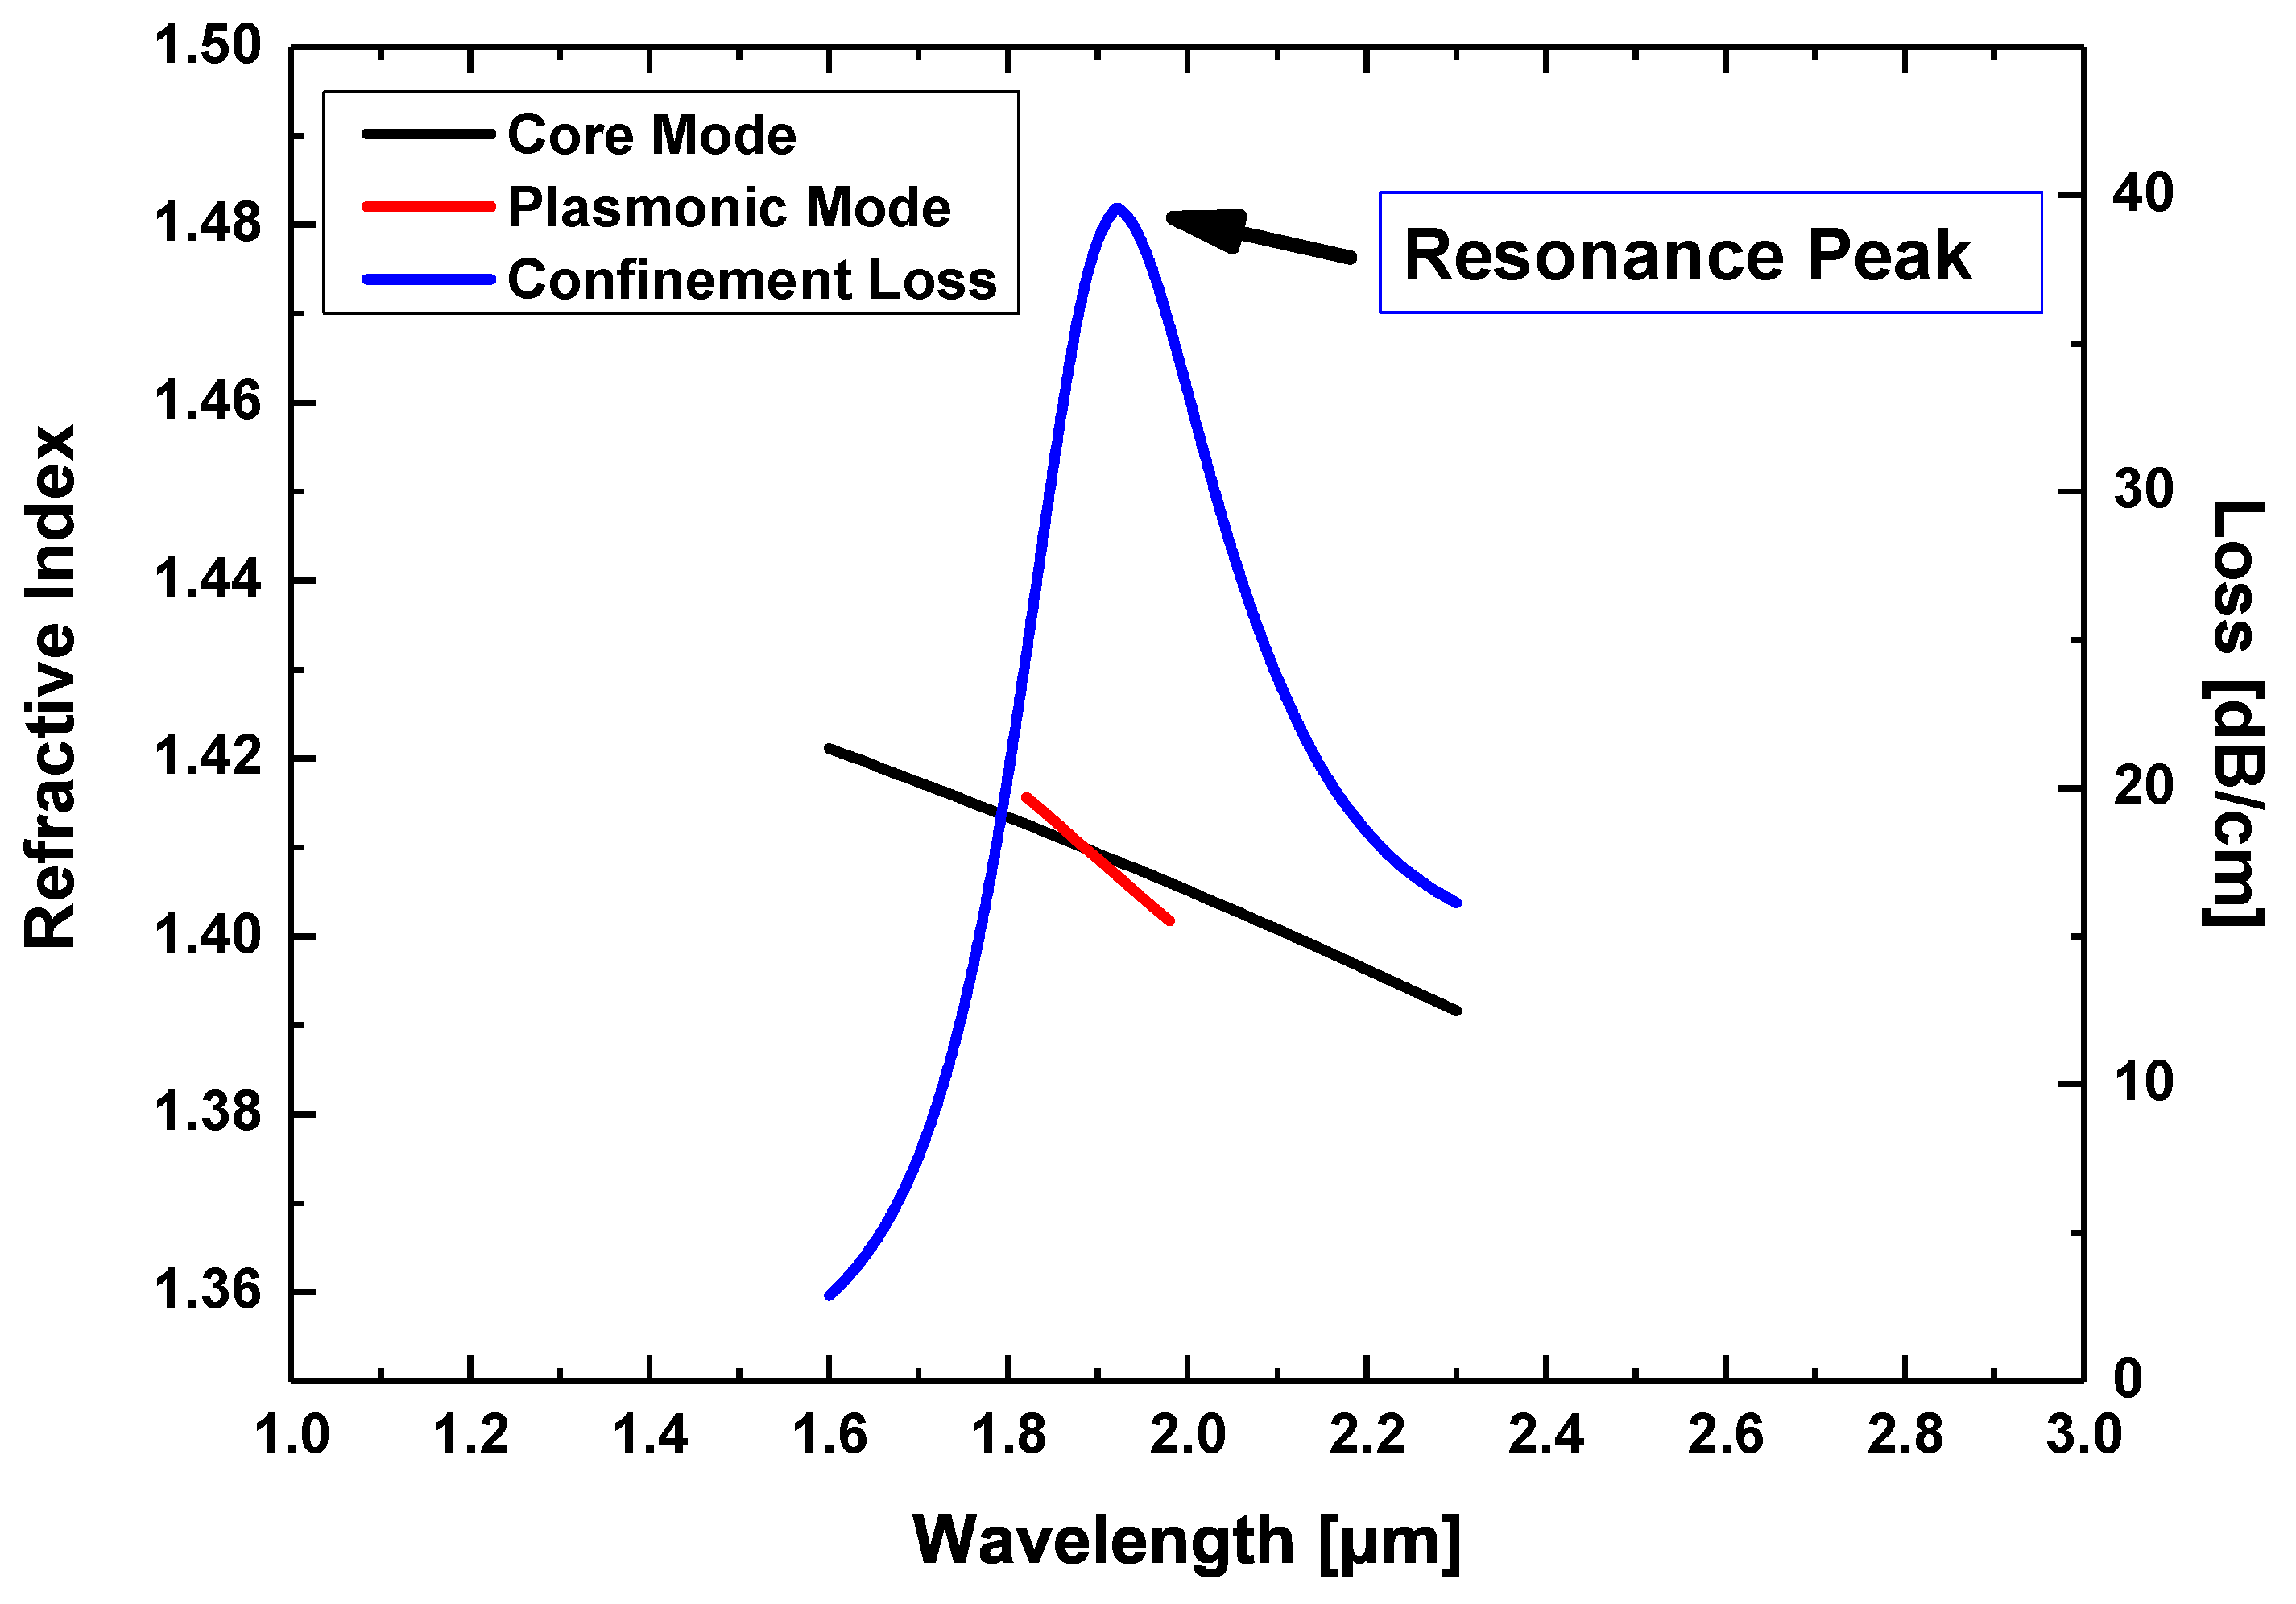
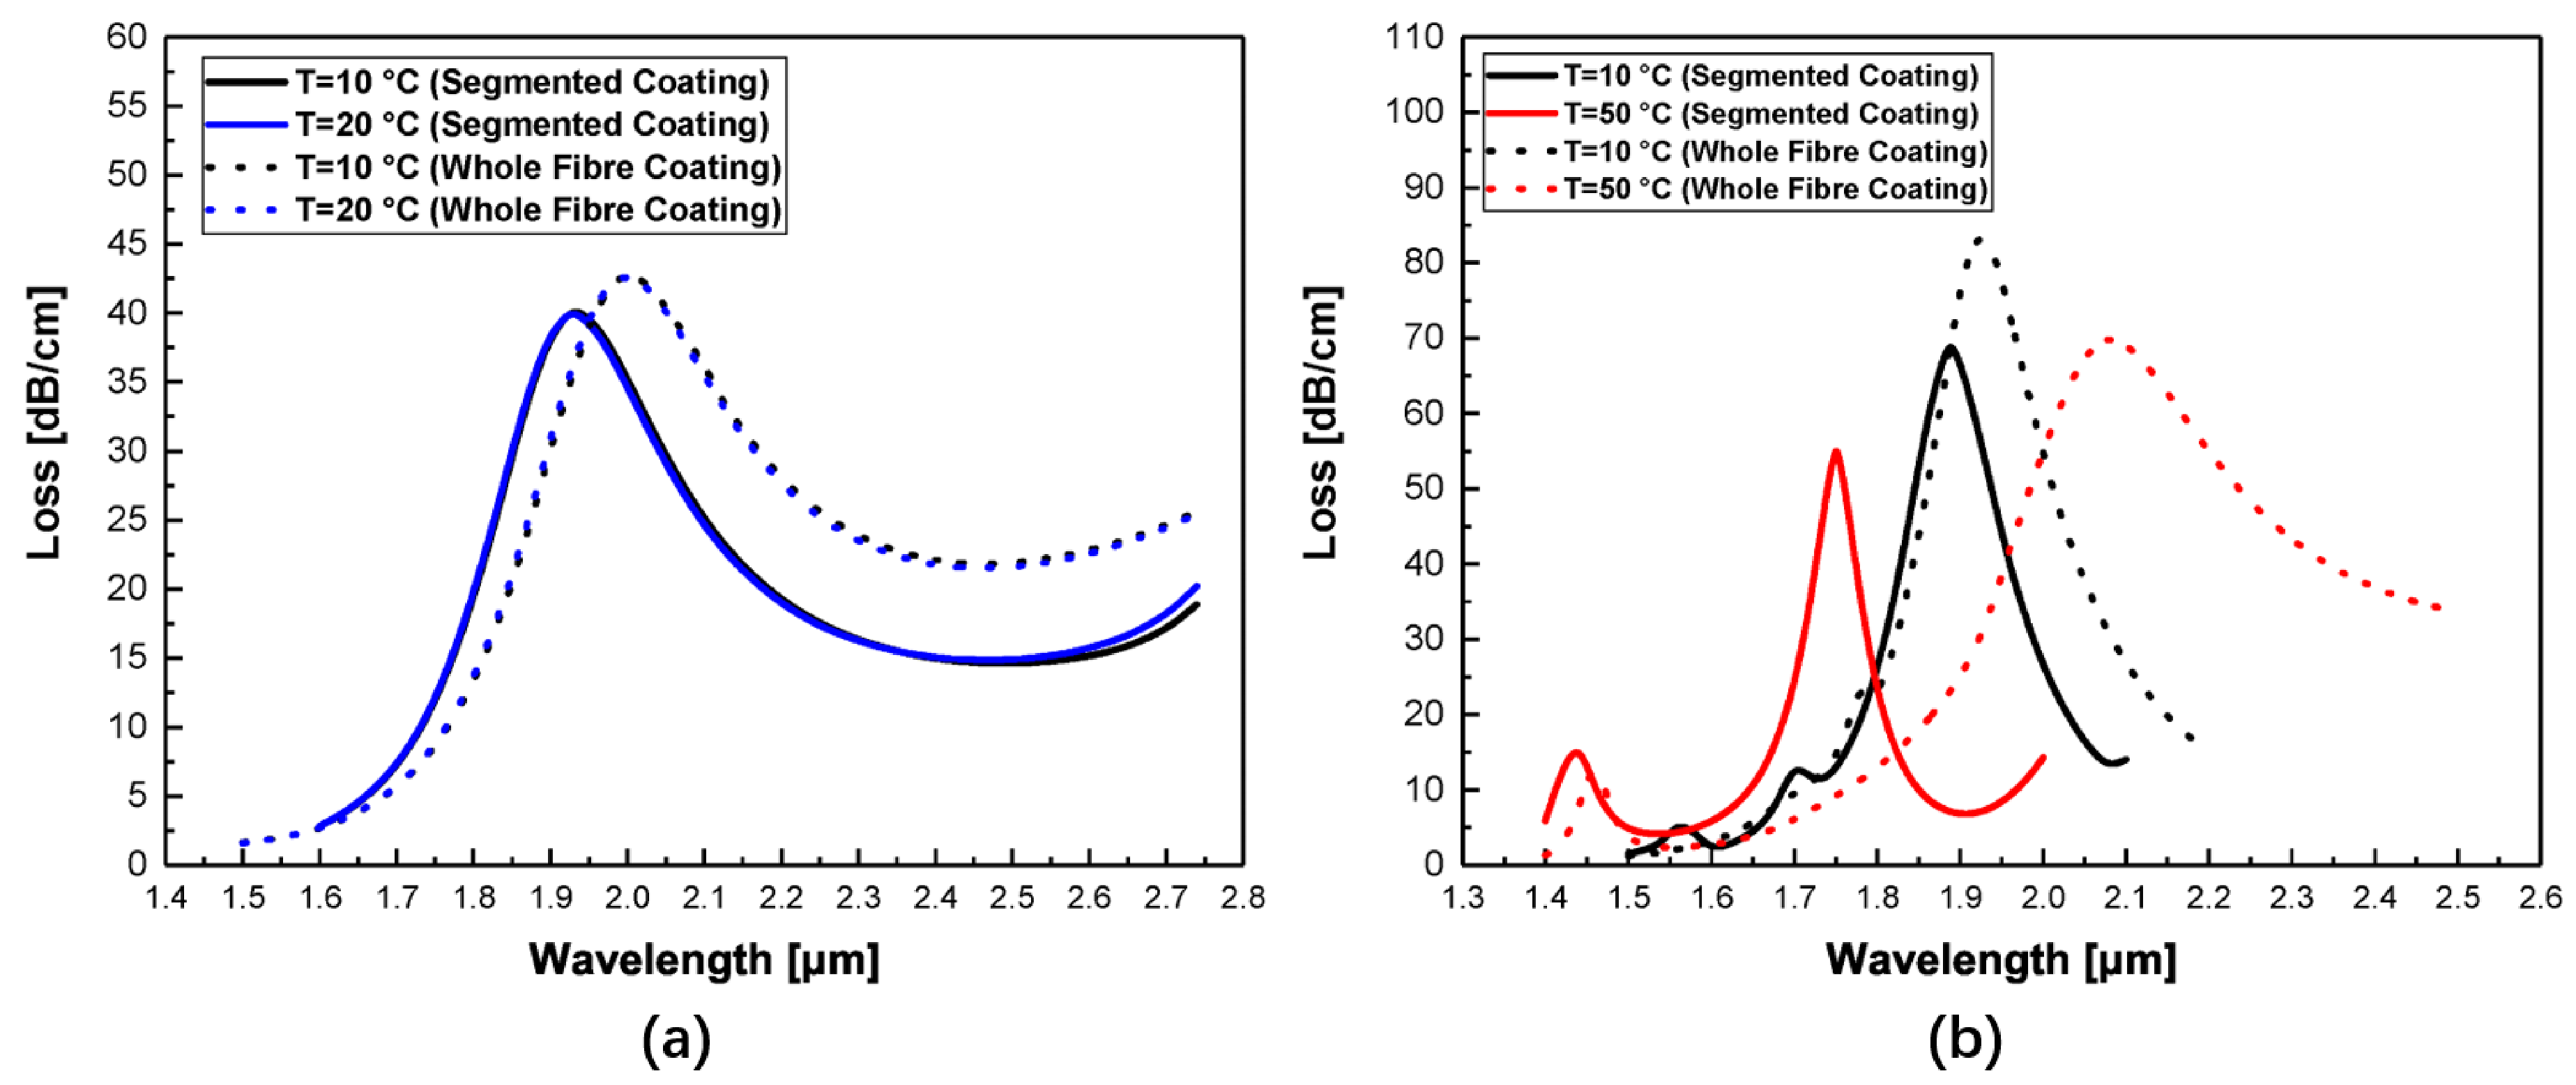
3.1. Modal Analysis
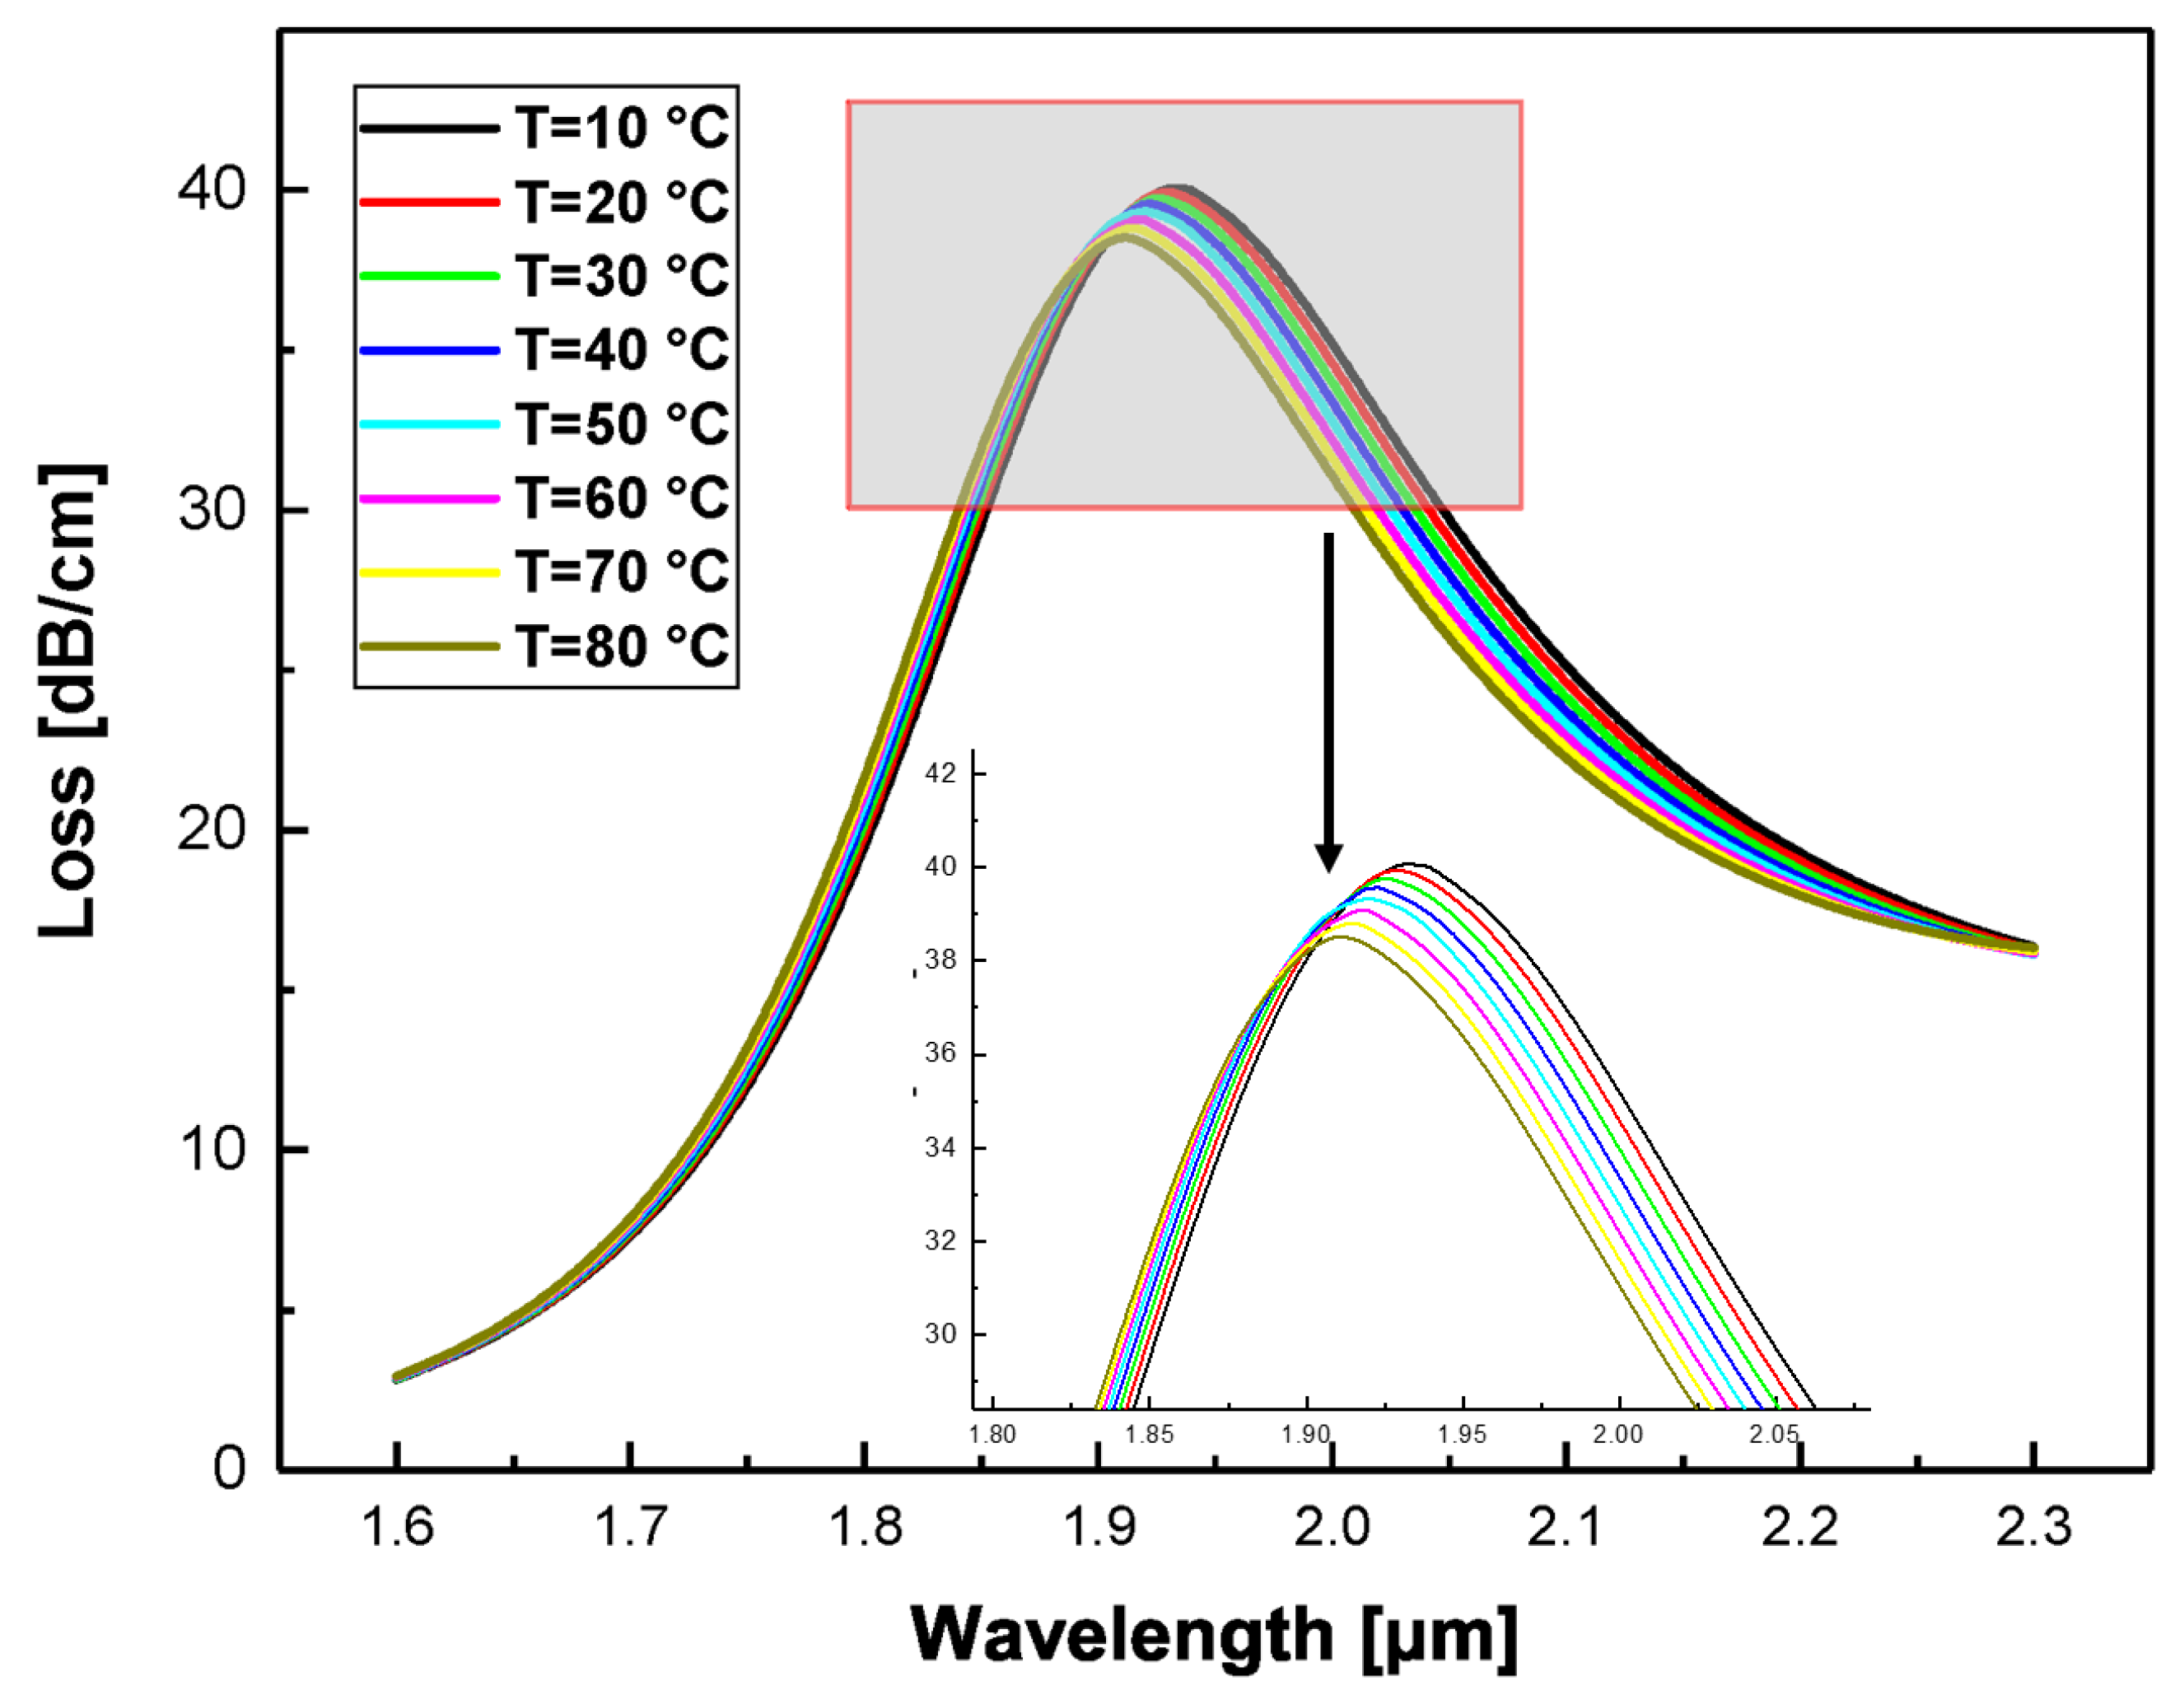
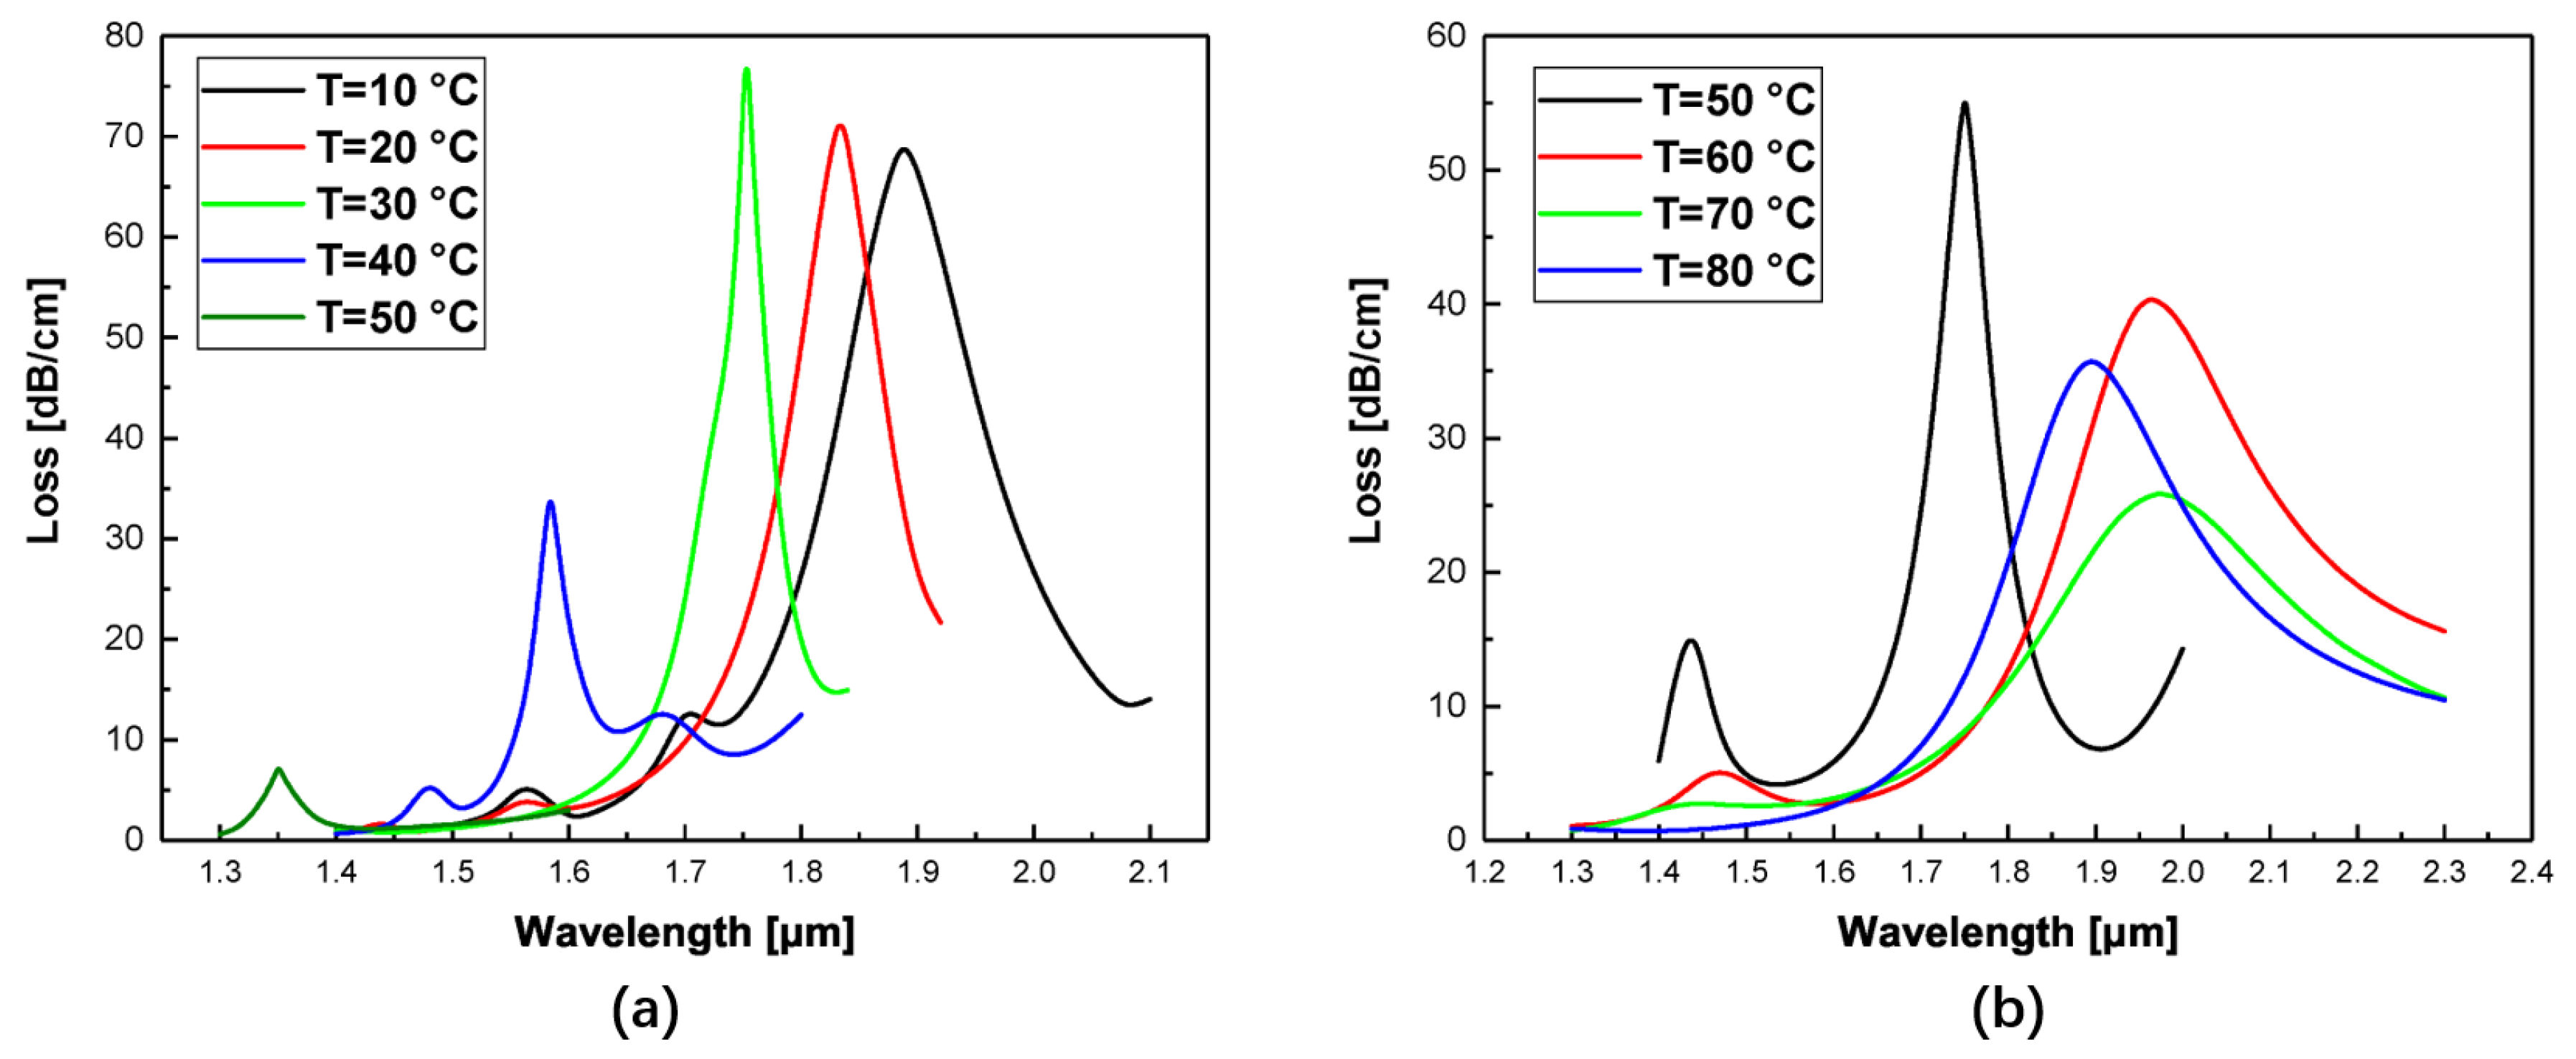
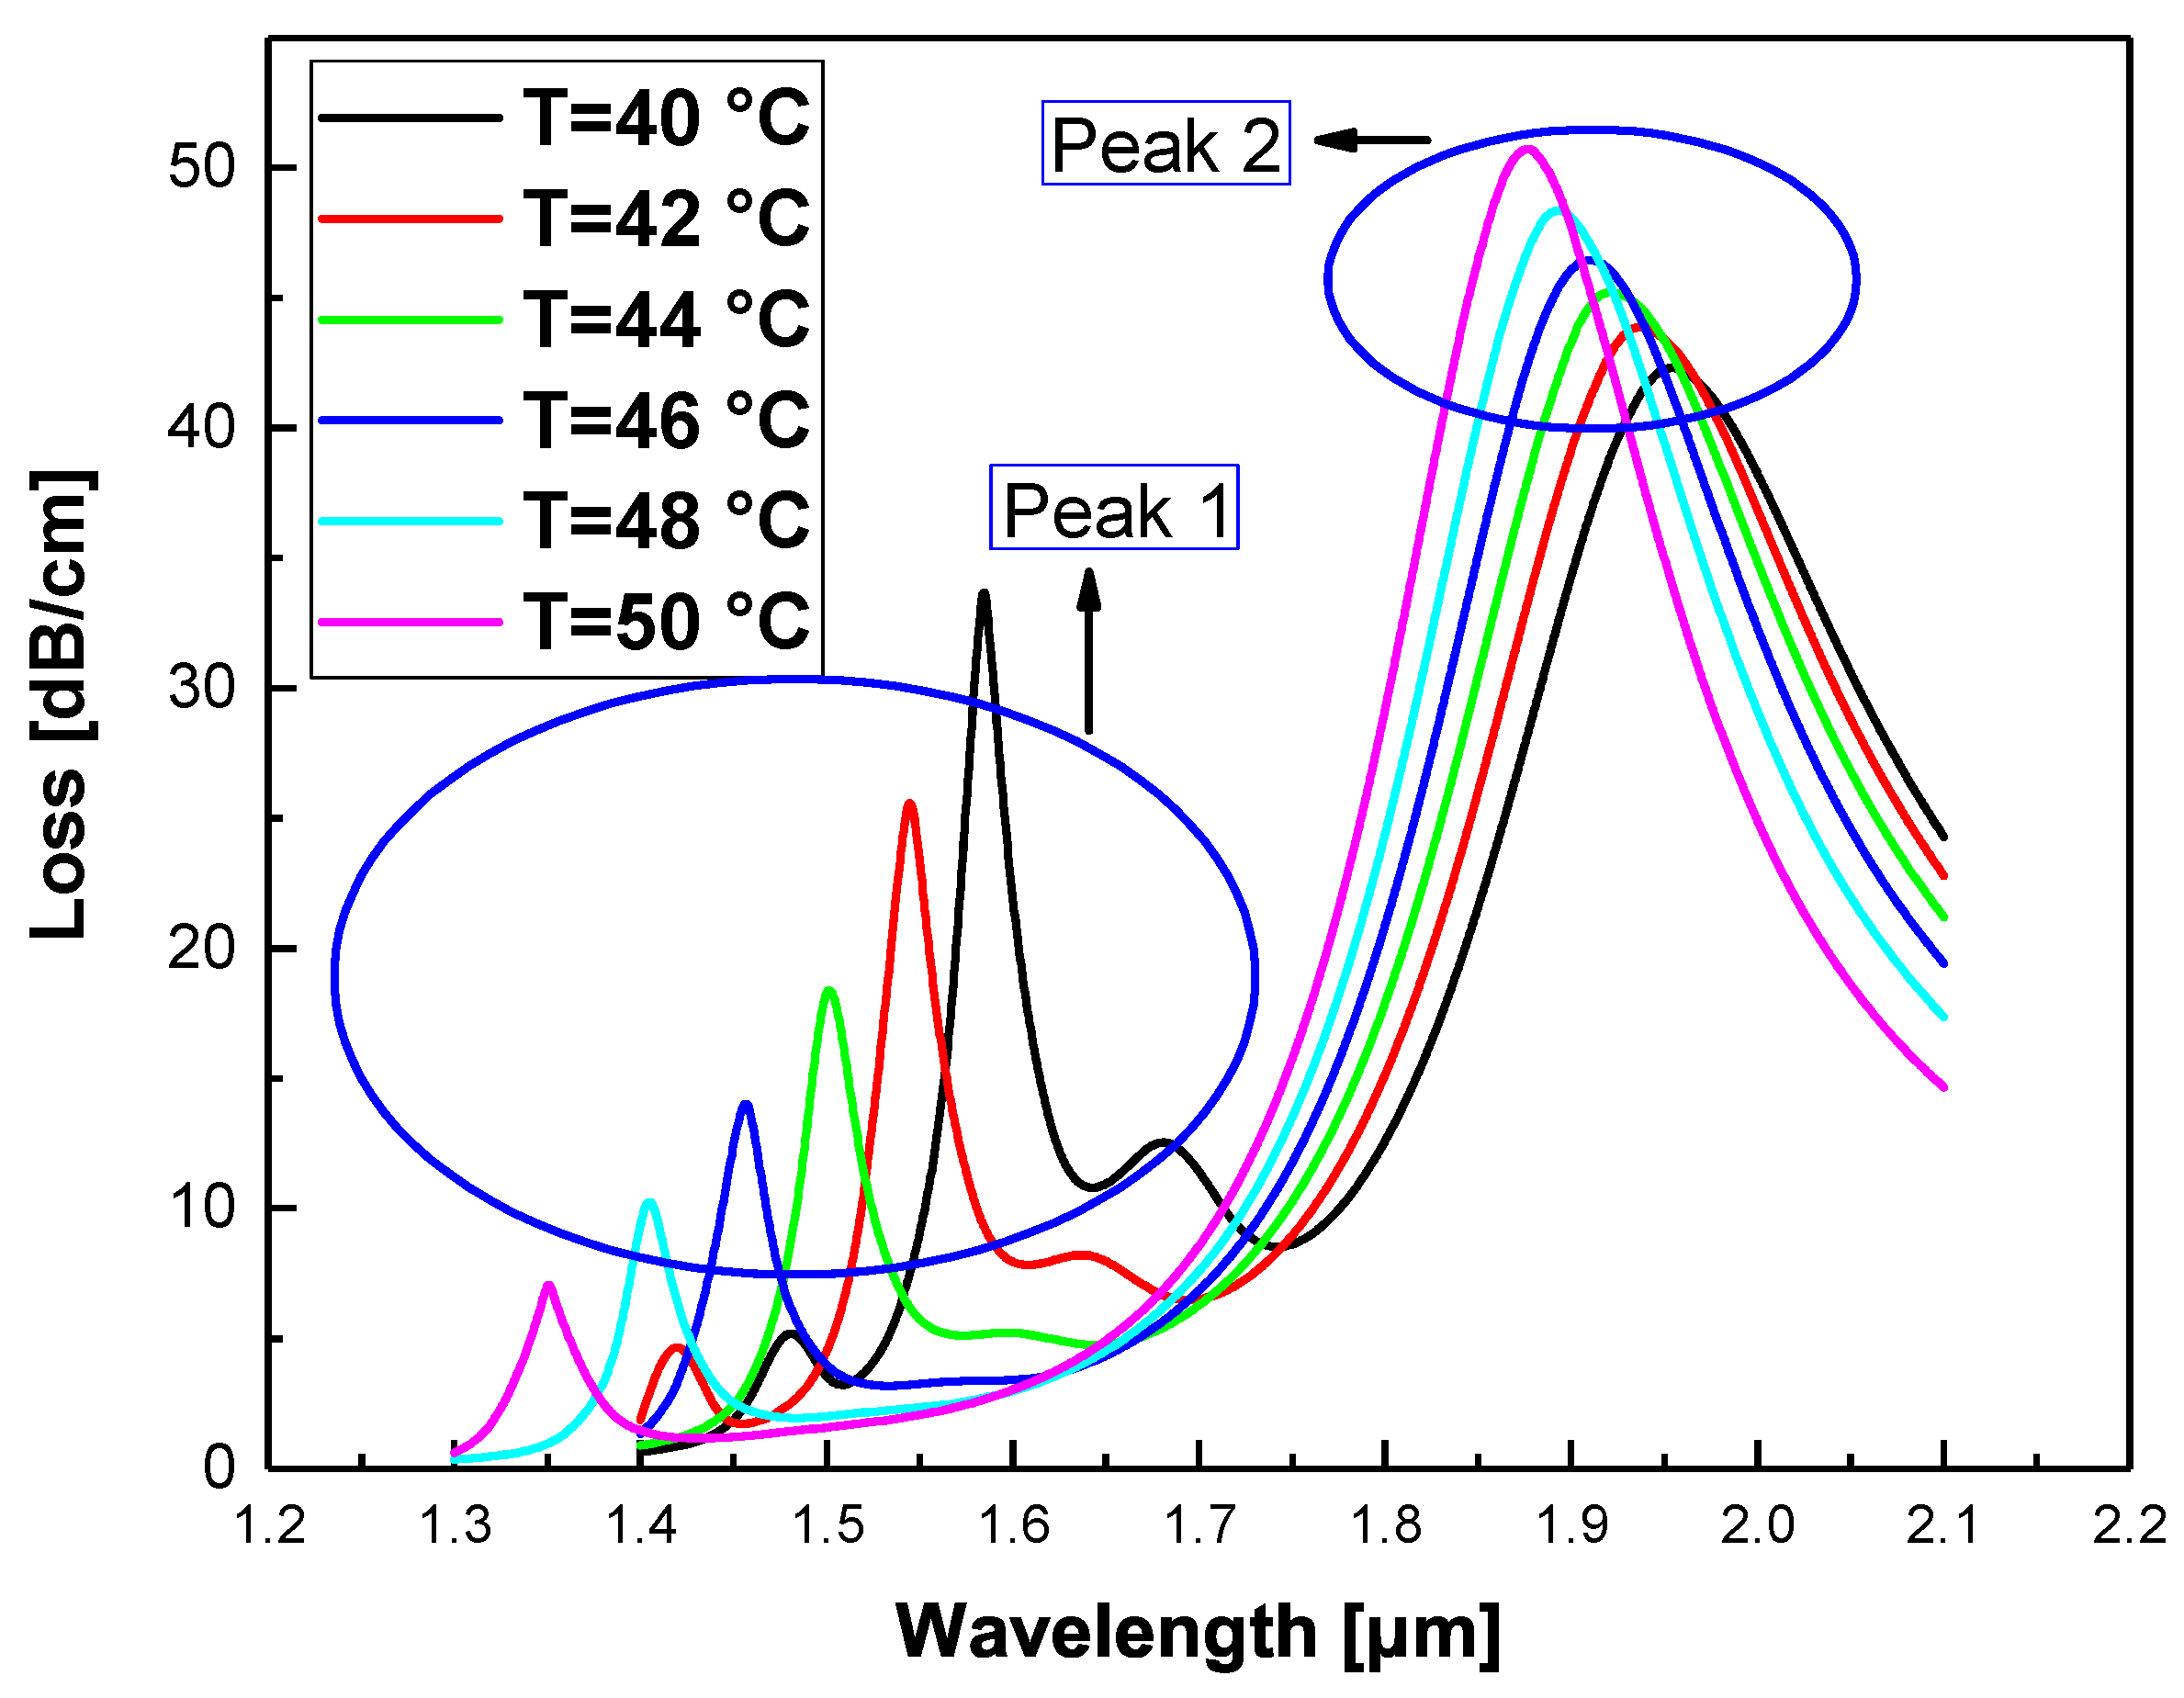
3.2. Sensitivity
3.3. Resolution
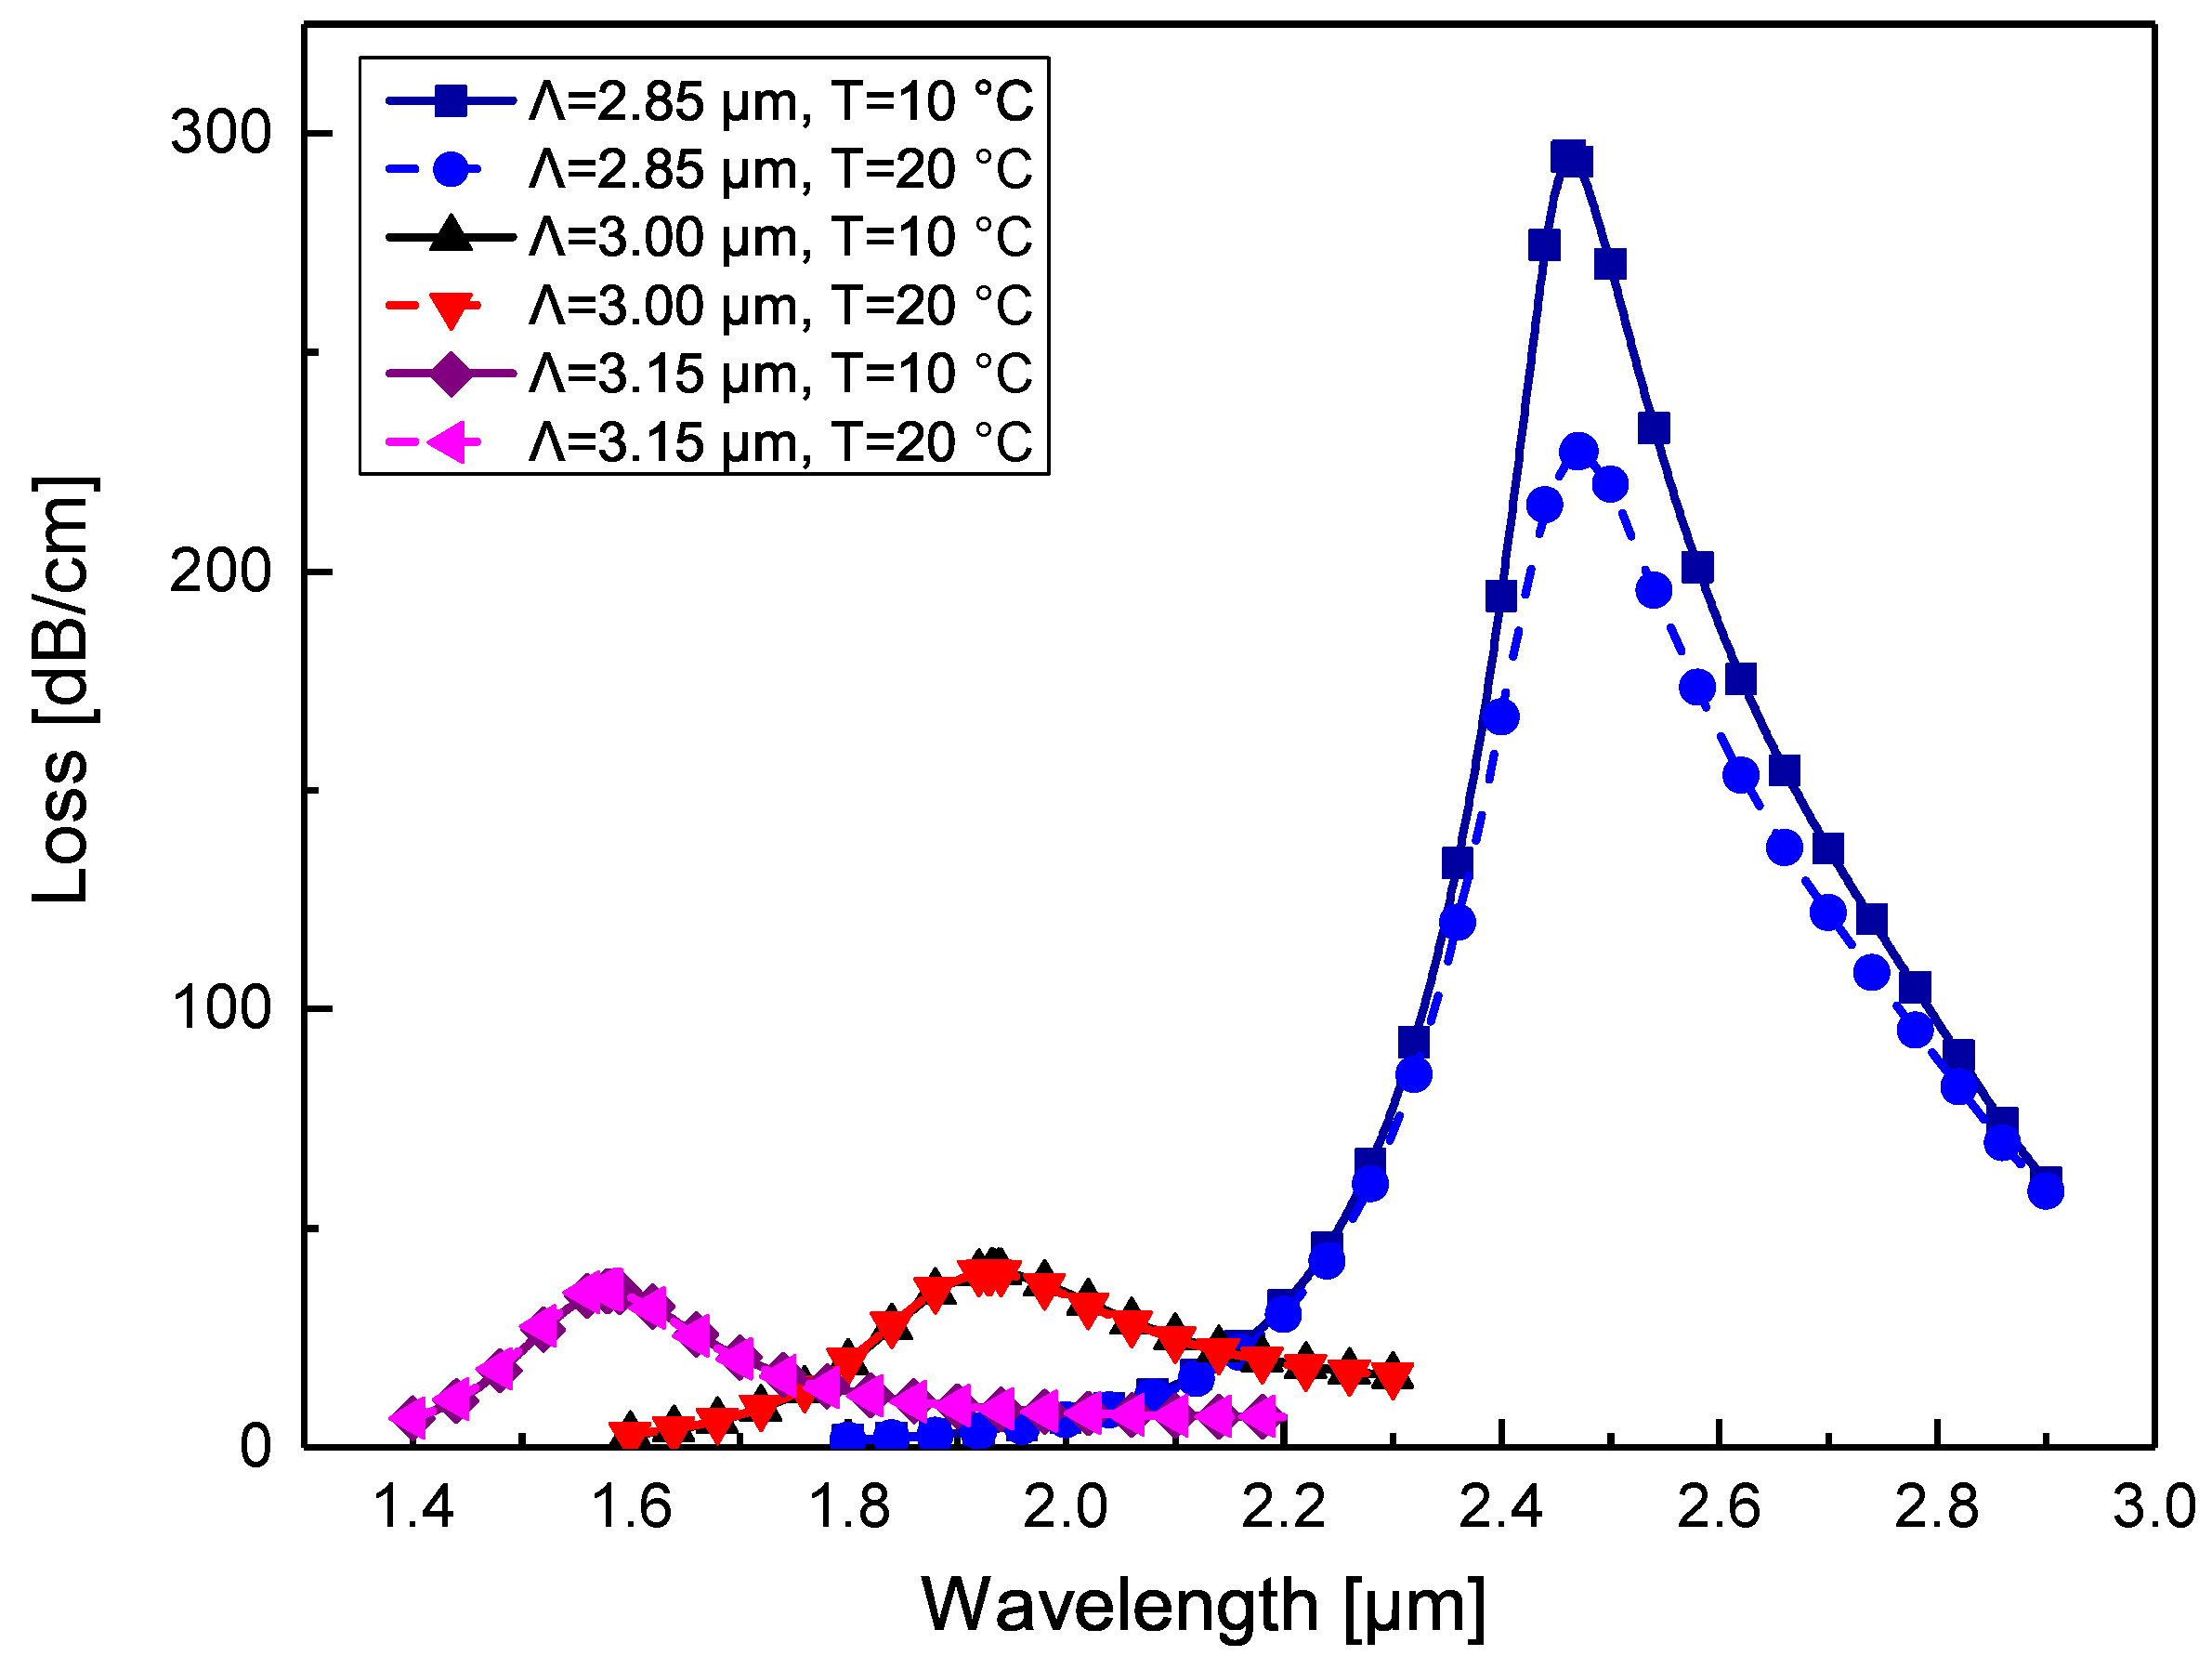
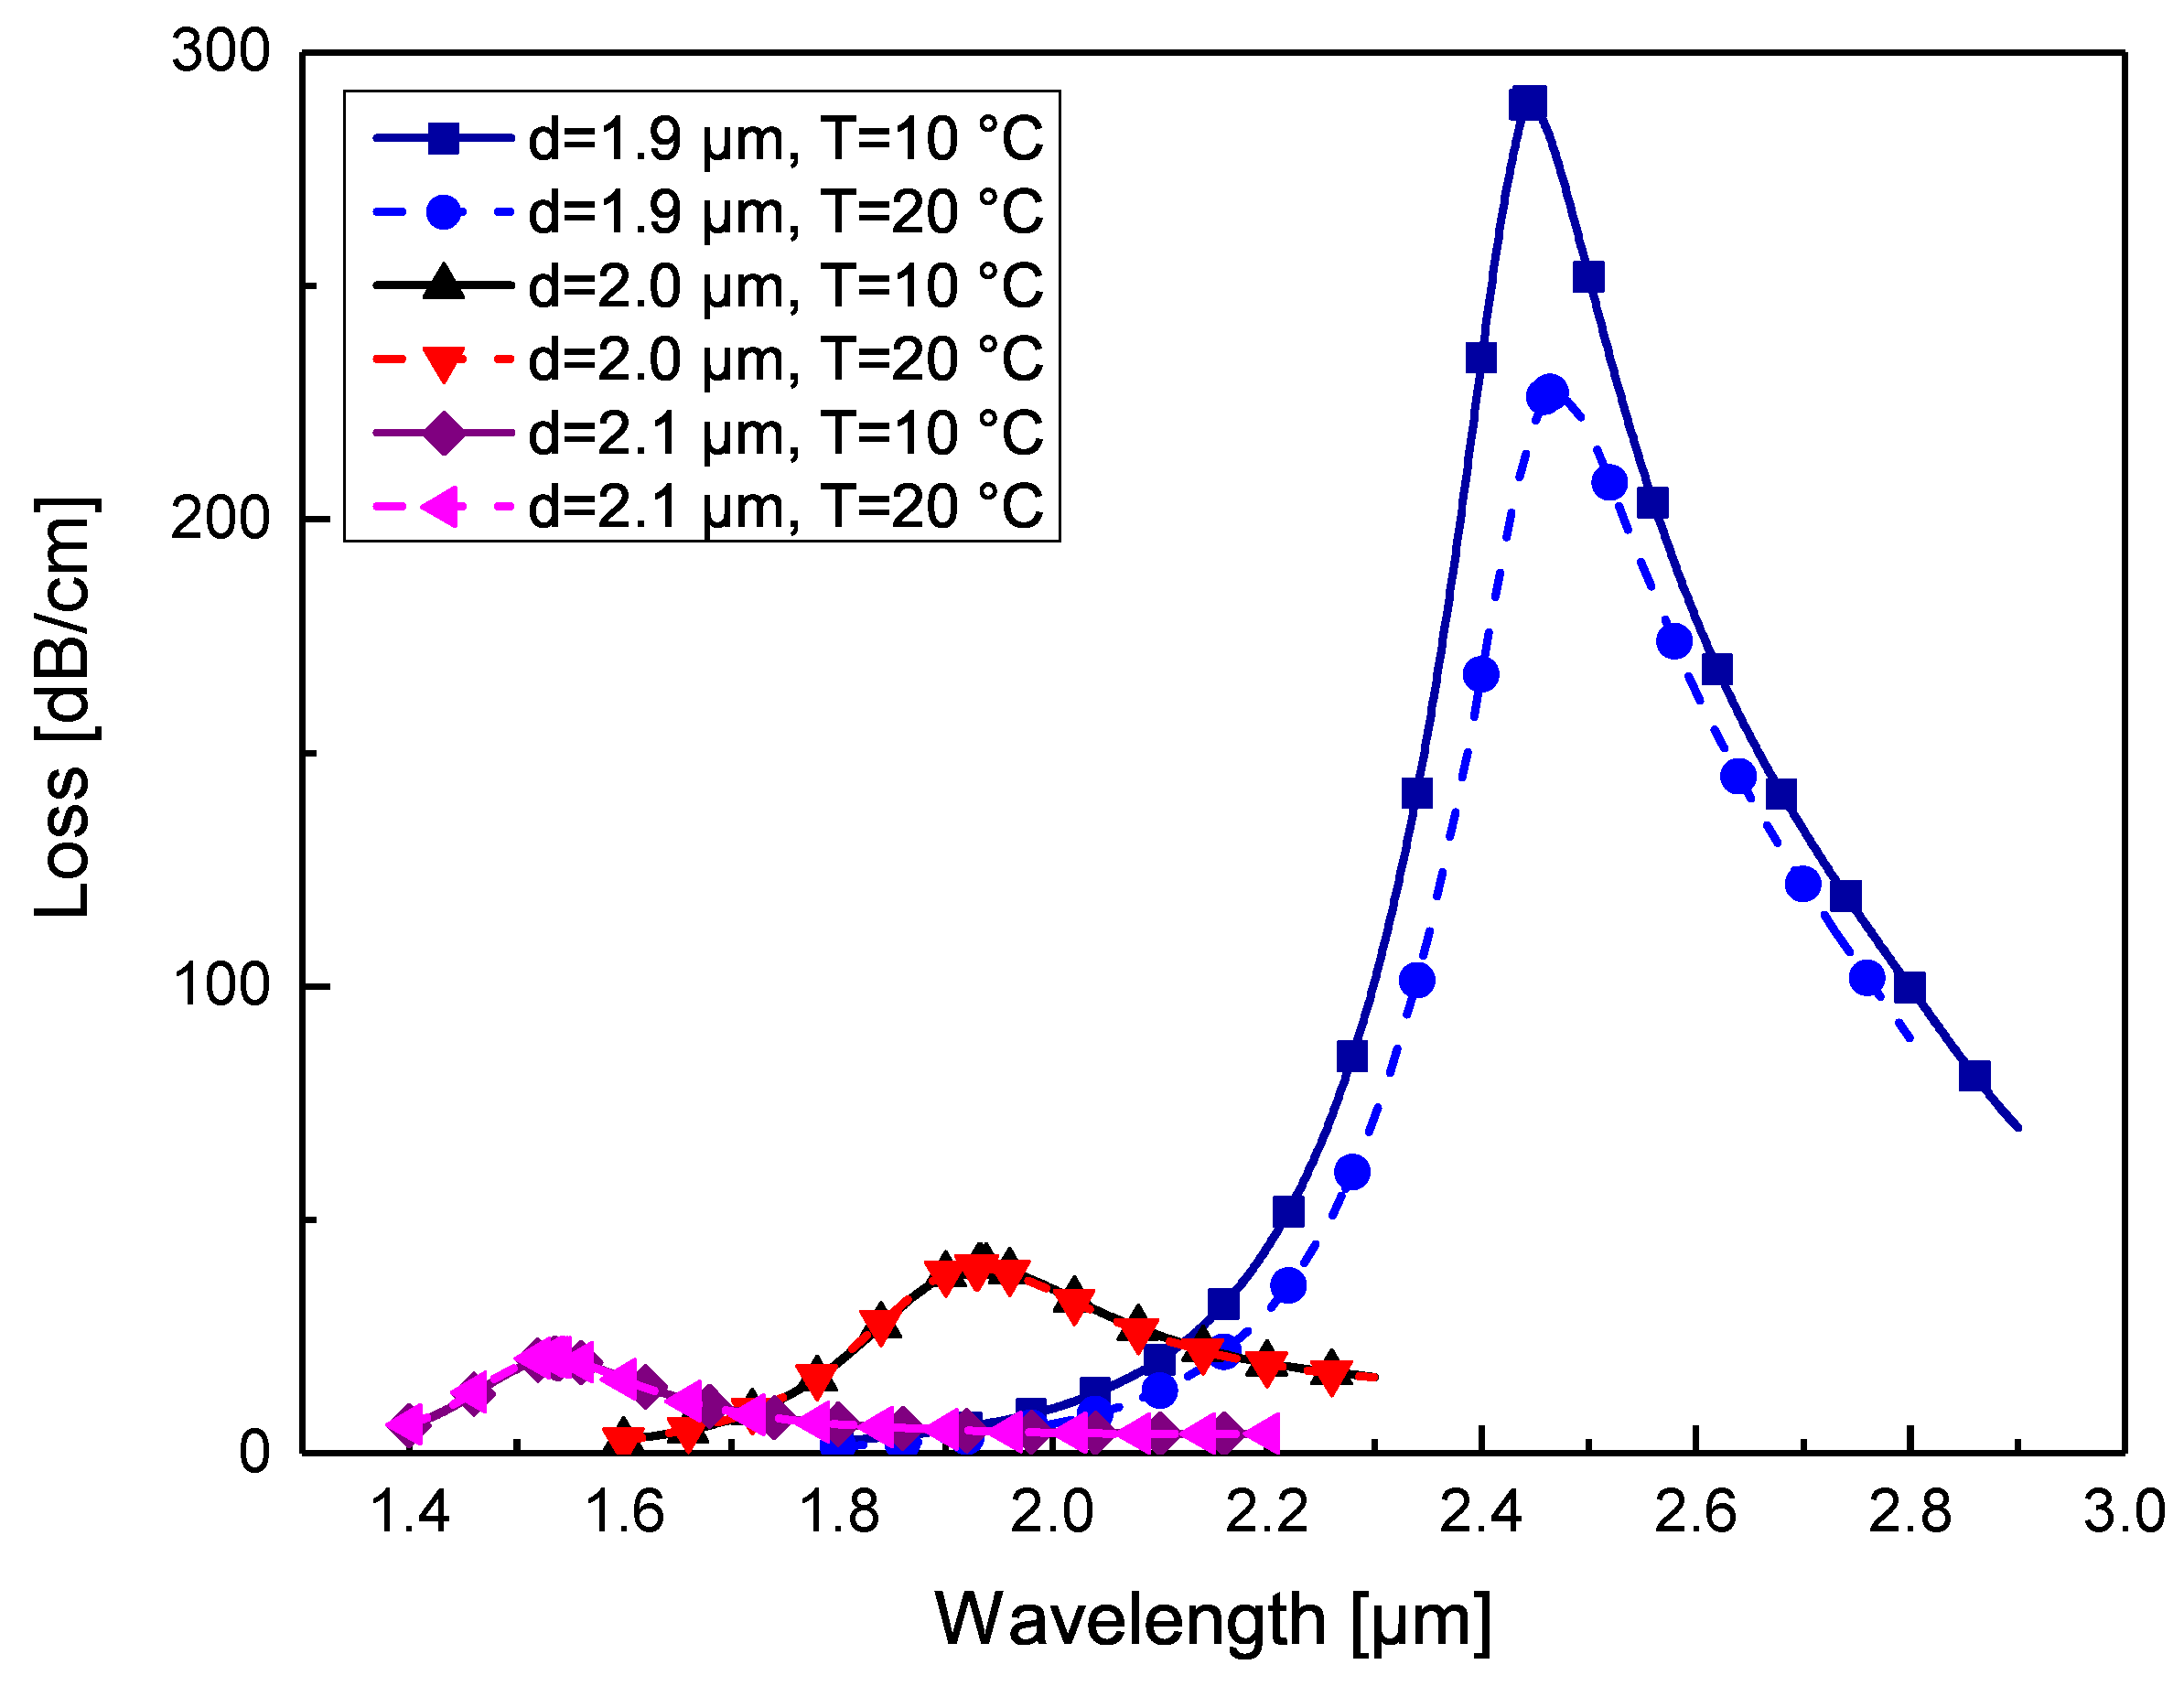
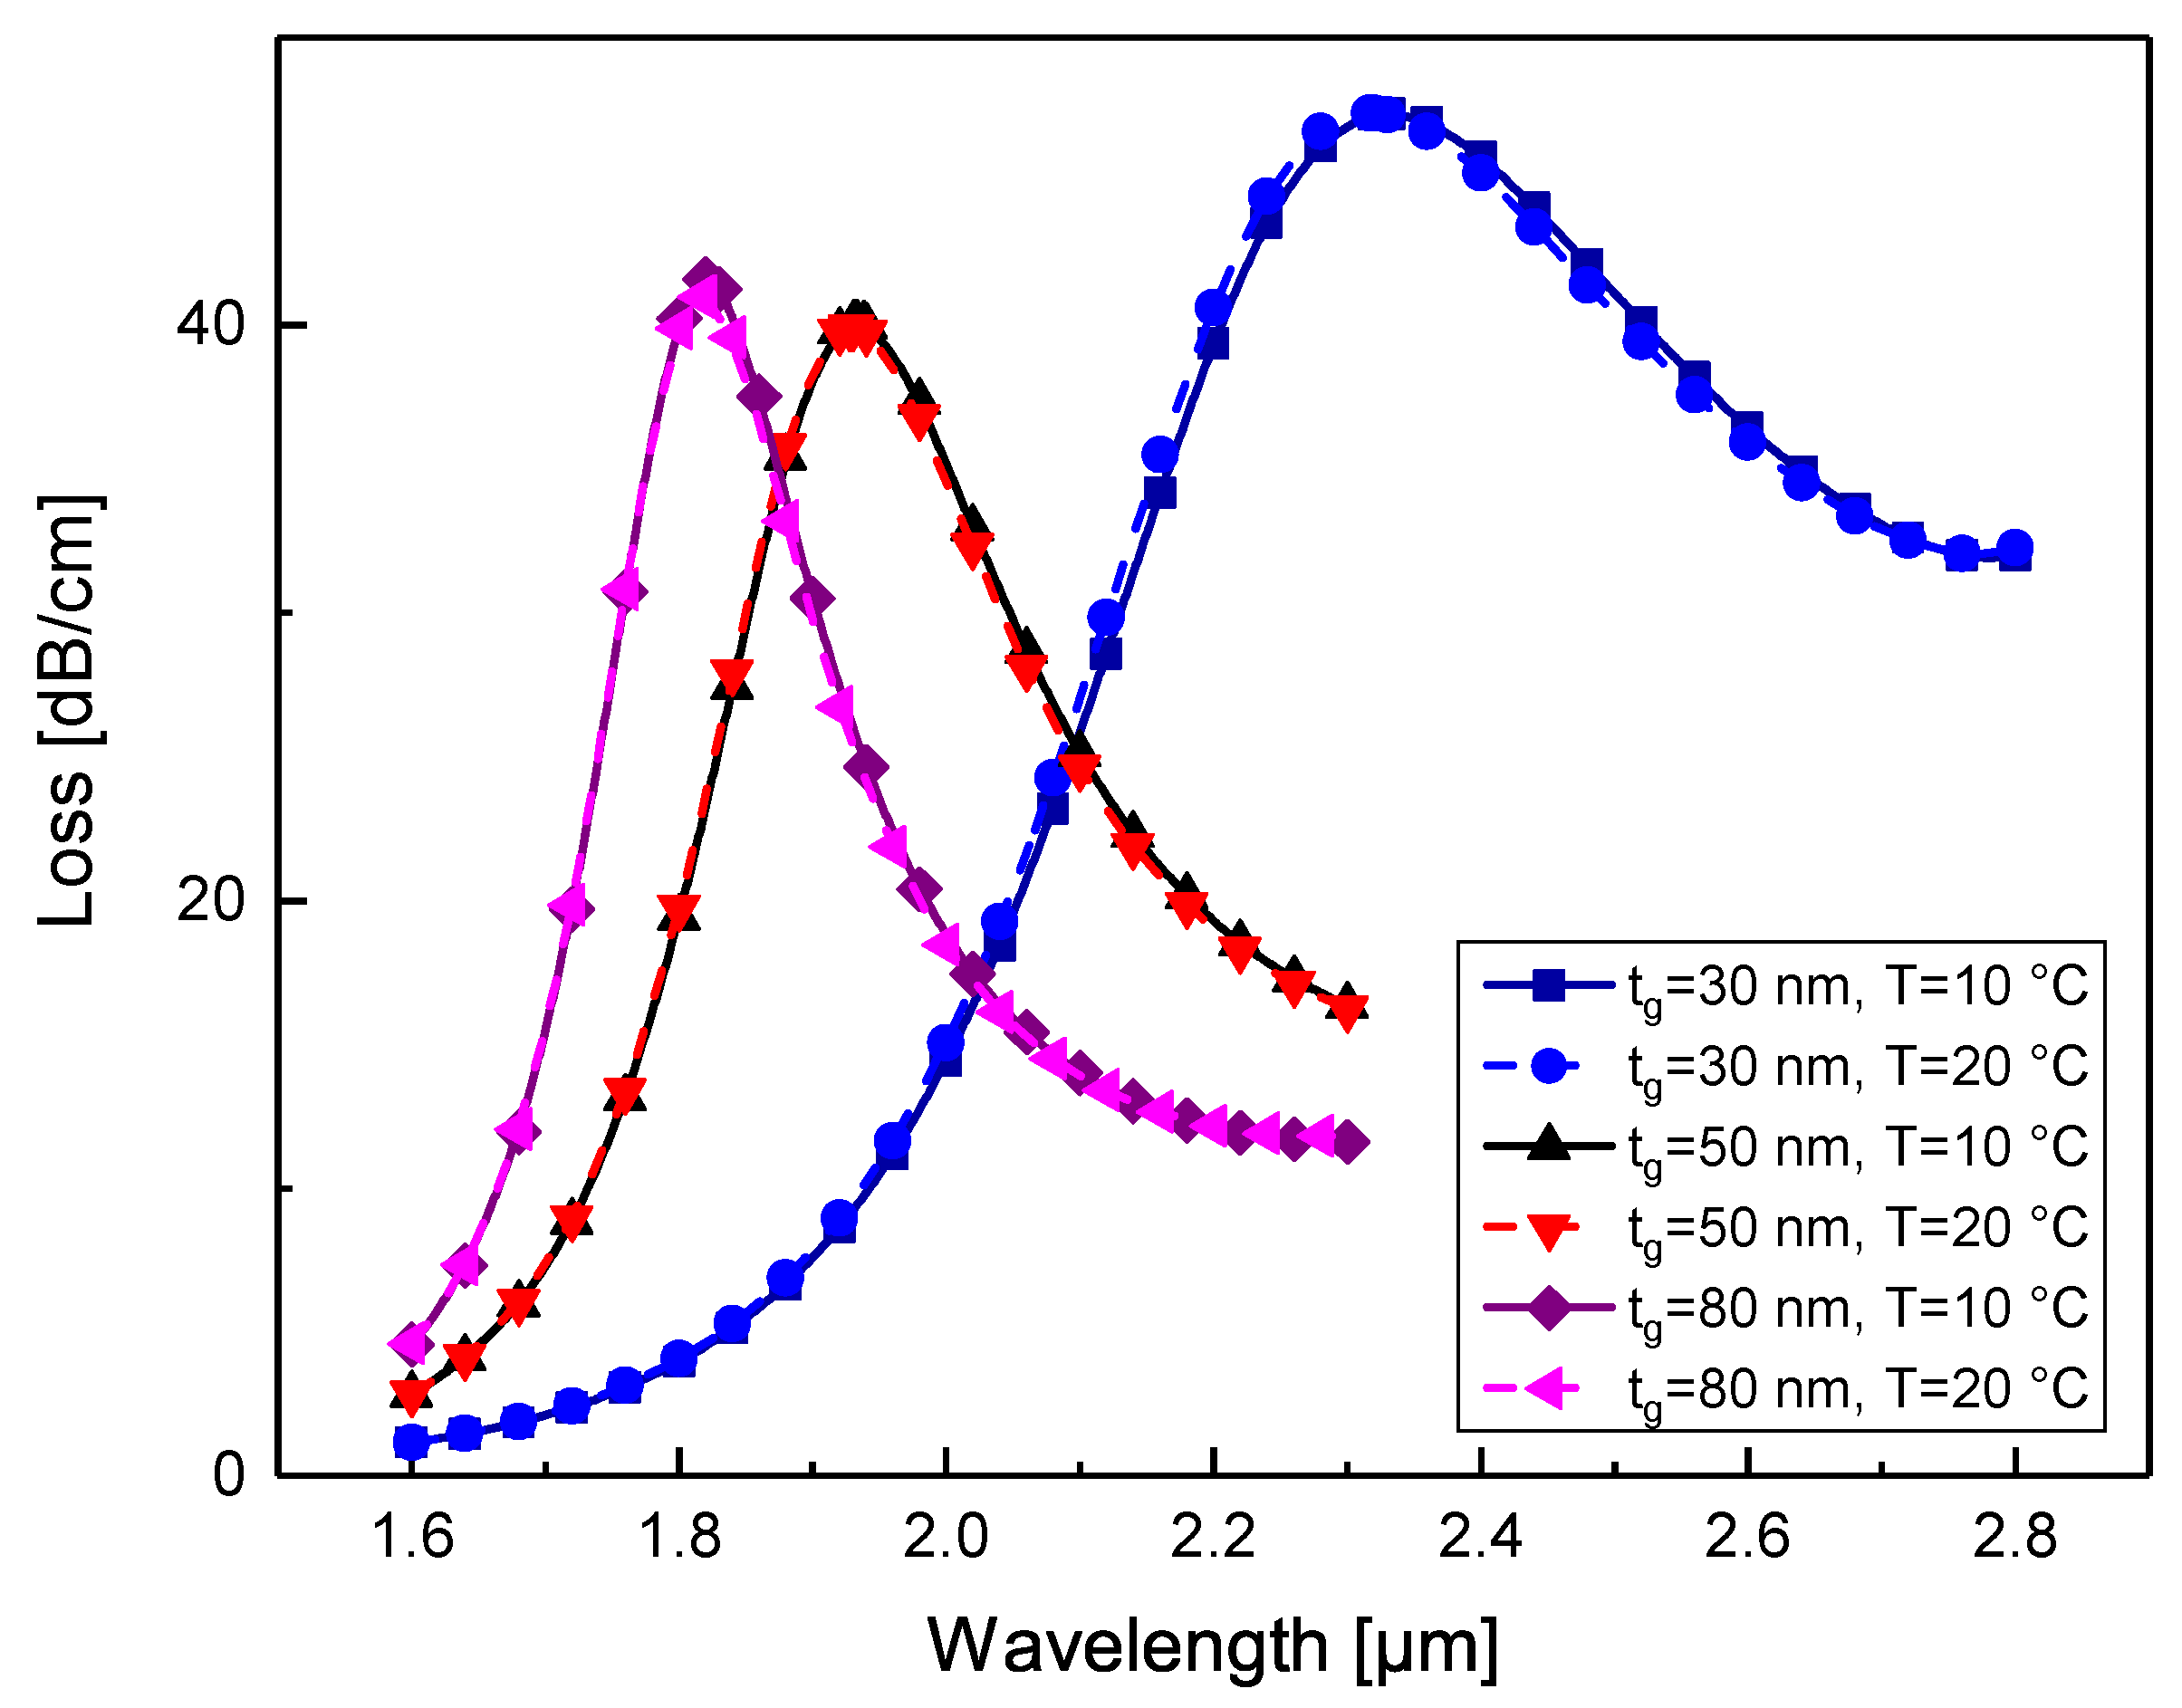
3.4. Optimisation of the Sensor Structural Parameters
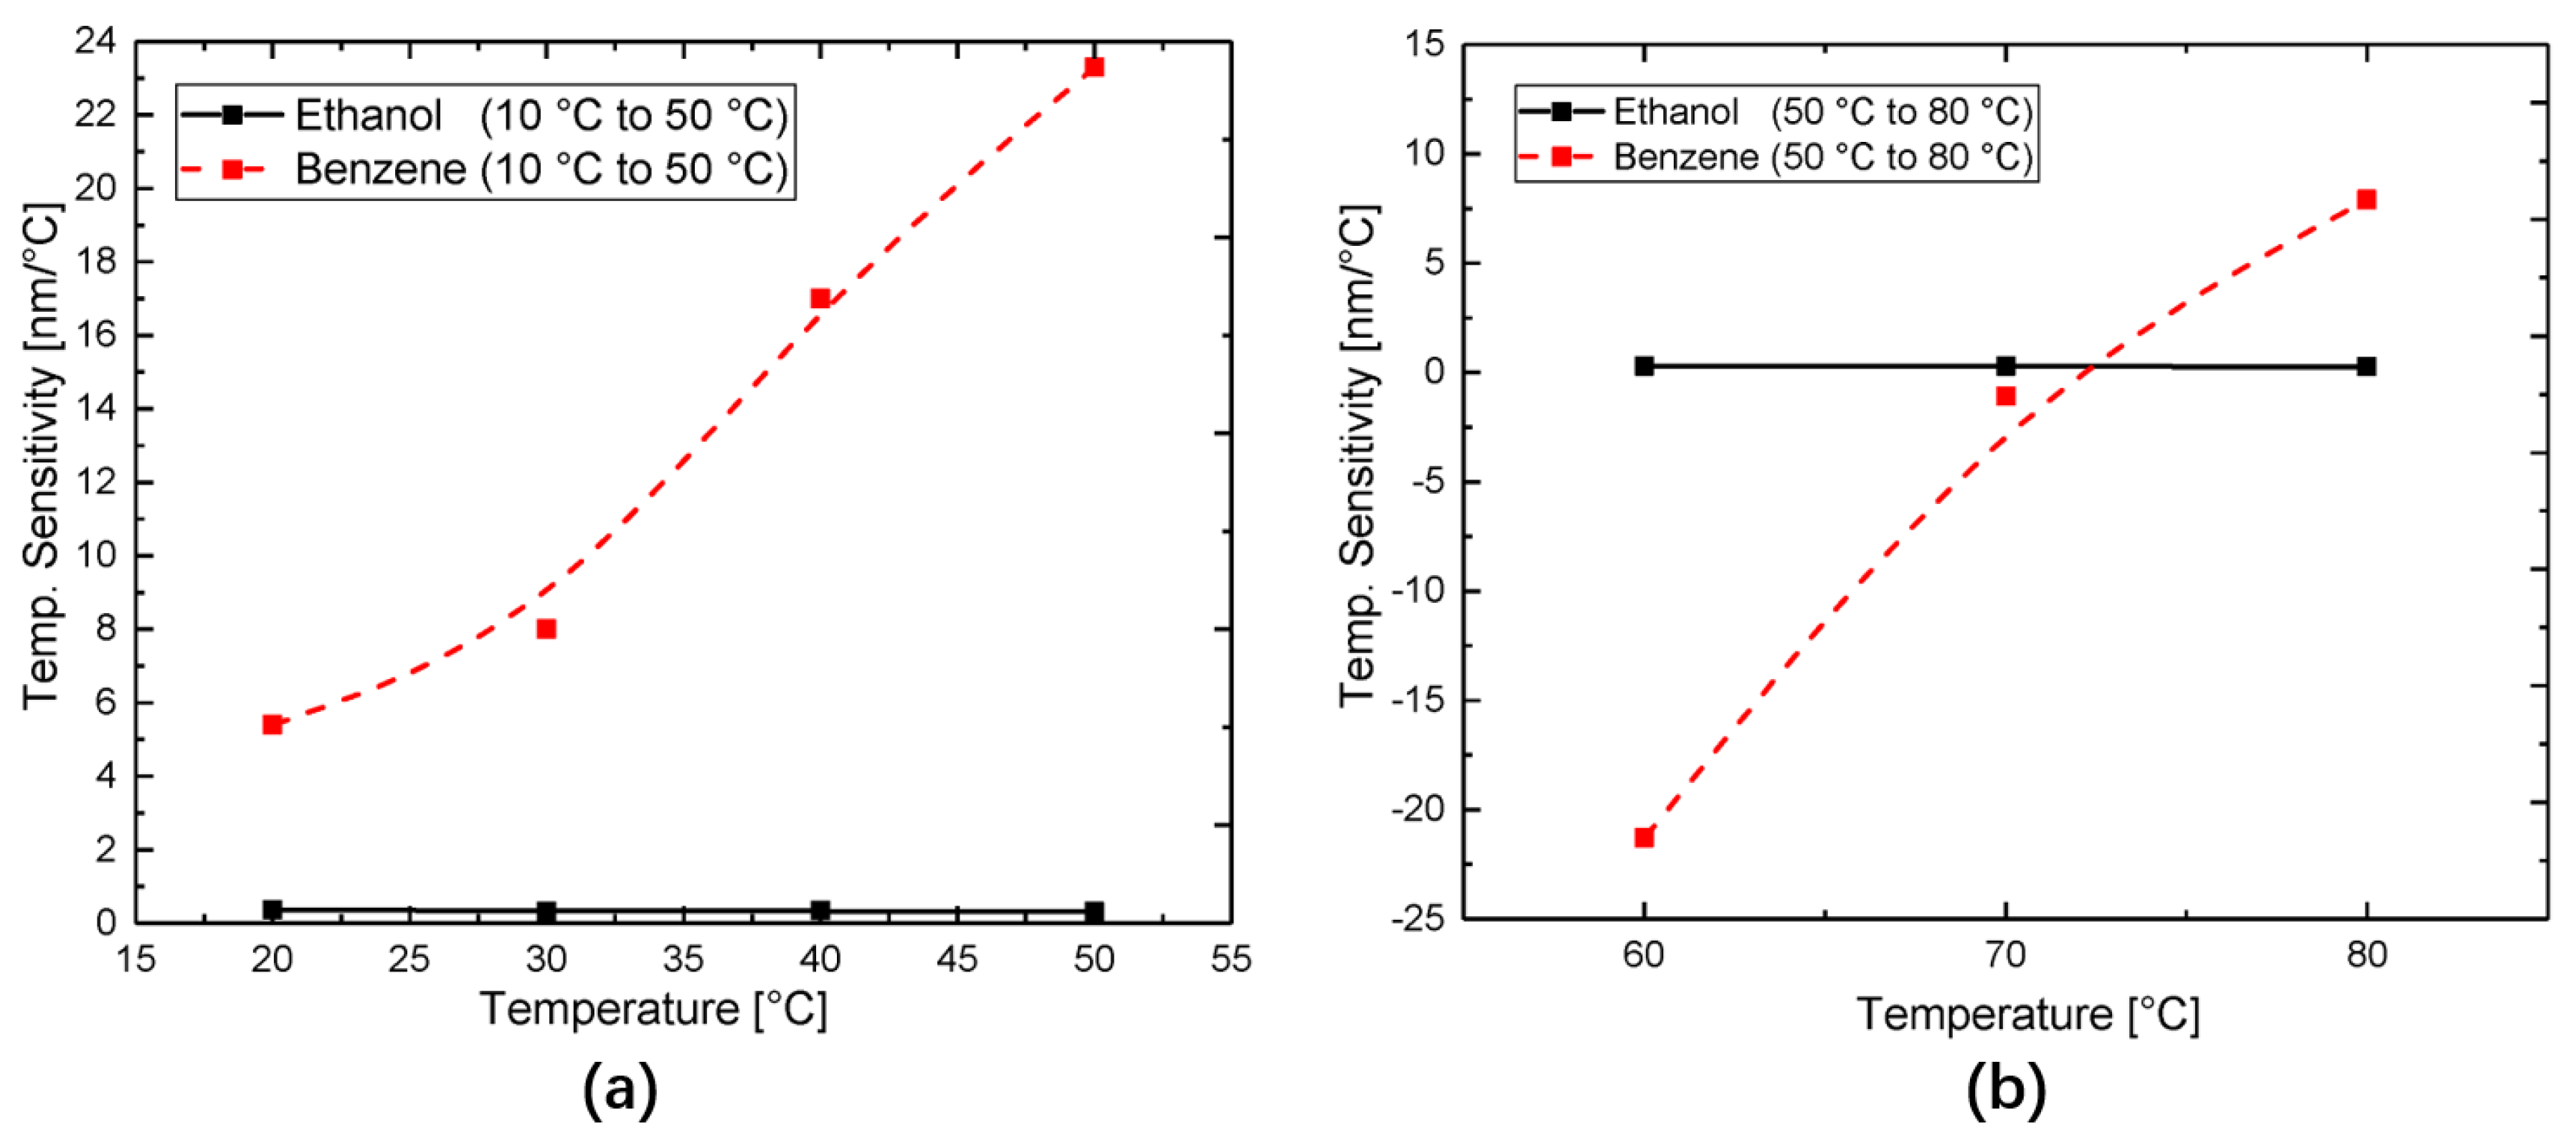
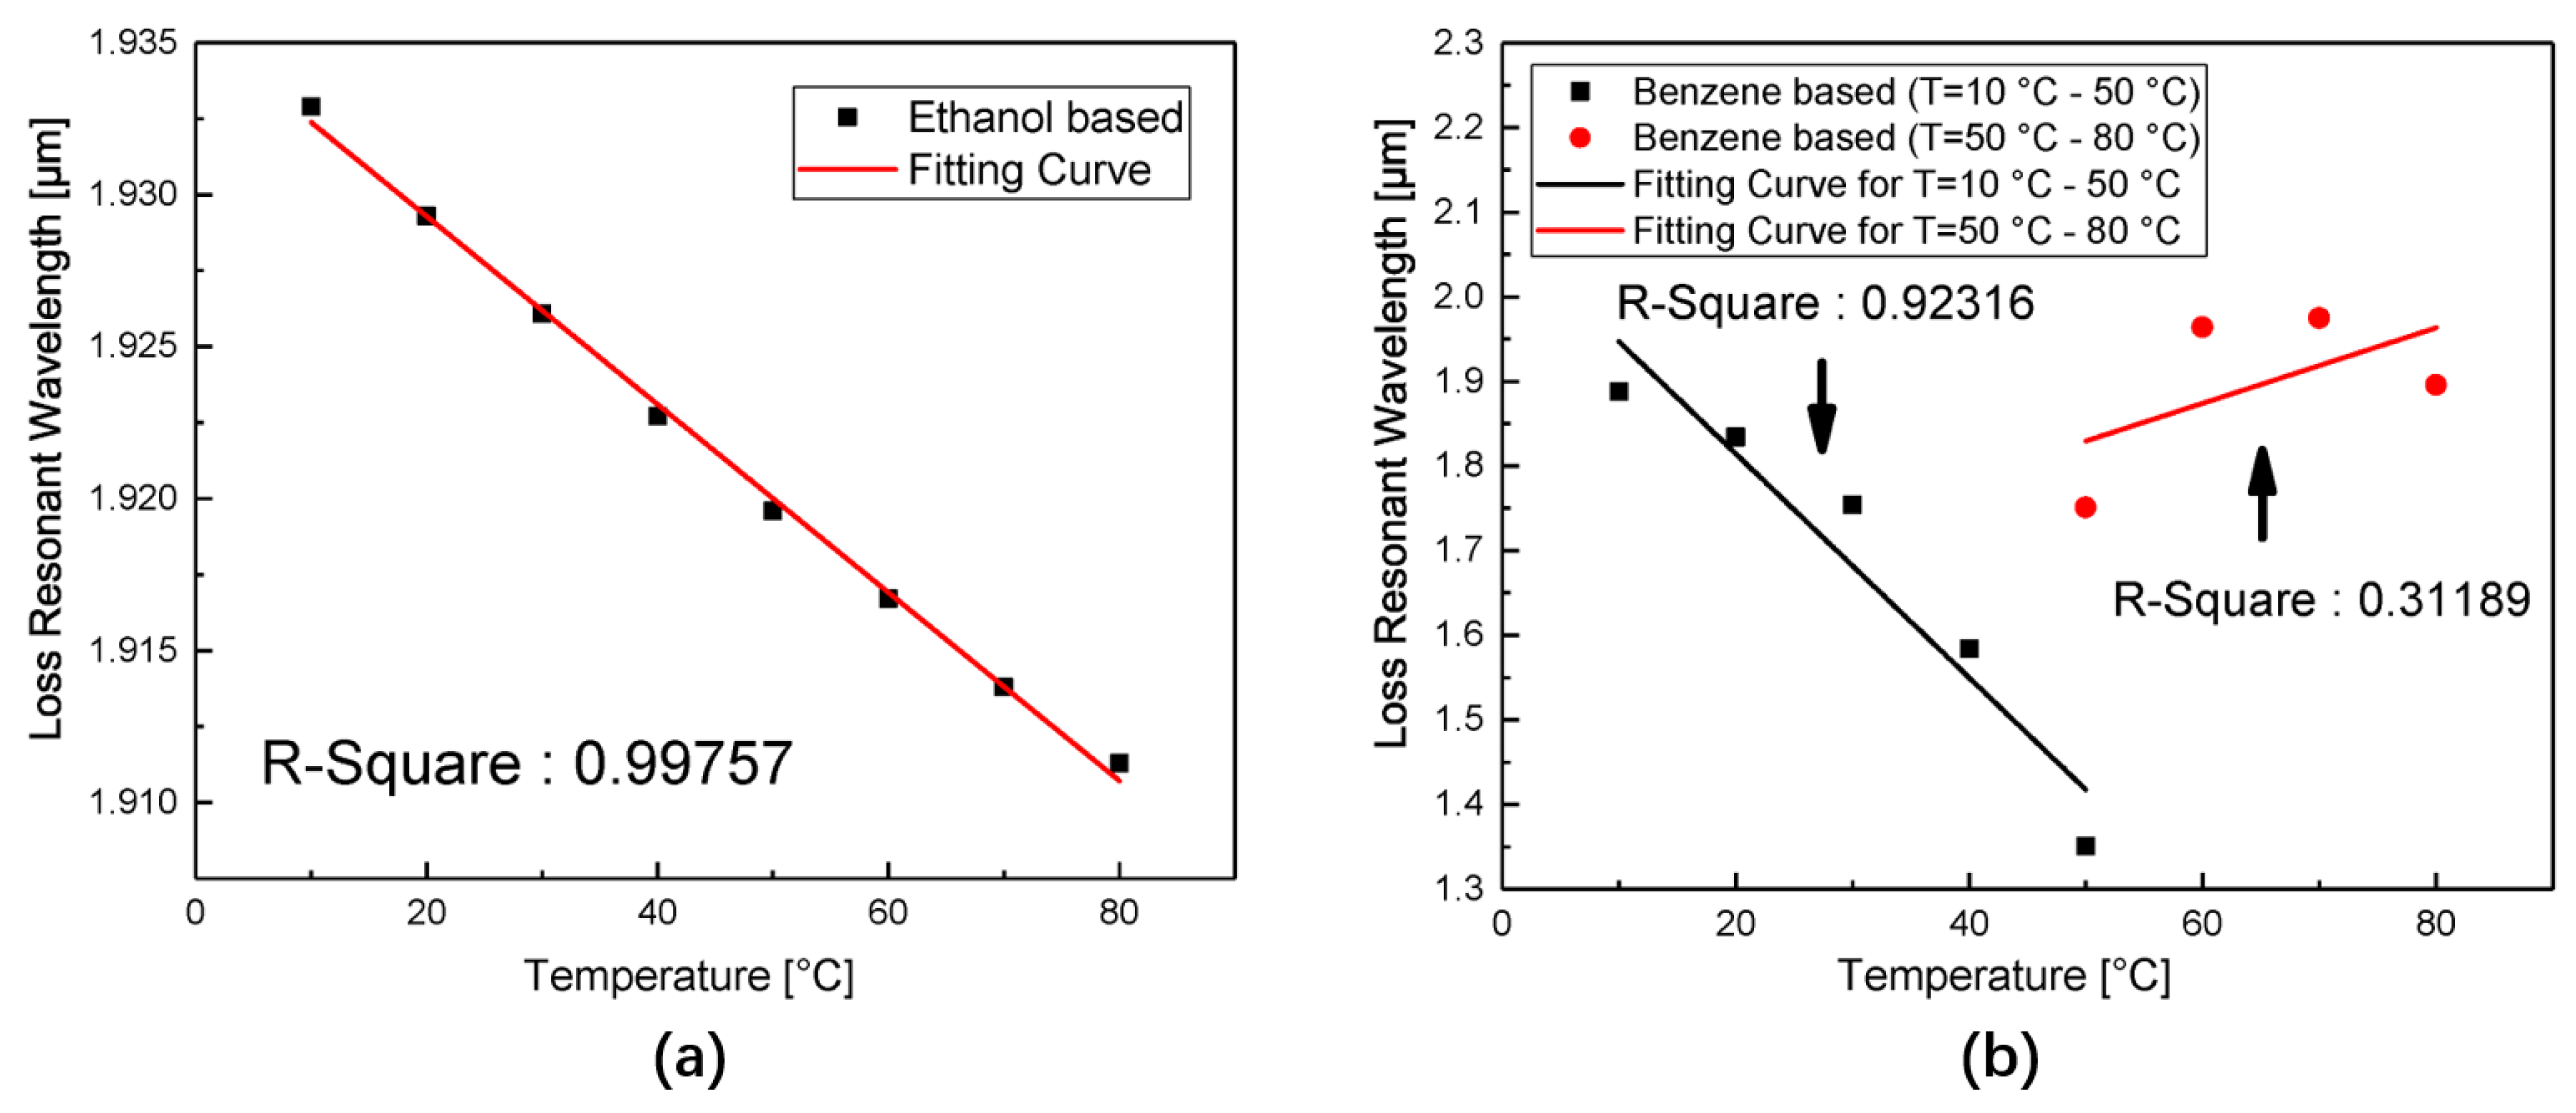
3.5. Sensitivity Comparison of the Proposed Temperature Sensor with Ethanol or Benzene
4. Conclusions
Author Contributions
Funding
Conflicts of Interest
References
- Addanki, S.; Amiri, I.; Yupapin, P. Review of optical fibers-introduction and applications in fiber lasers. Results Phys. 2018, 10, 743–750. [Google Scholar] [CrossRef]
- Gangopadhyay, T.K.; Kumbhakar, P.; Mandal, M.K. Photonics and Fiber Optics: Foundations and Applications; CRC Press: Boca Raton, FL, USA, 2019. [Google Scholar]
- Wu, D.K.C.; Kuhlmey, B.T.; Eggleton, B.J. Ultrasensitive photonic crystal fiber refractive index sensor. Opt. Lett. 2009, 34, 322–324. [Google Scholar] [CrossRef] [PubMed]
- Hammon, T.; Stokes, A. Optical fibre bragg grating temperature sensor measurements in an electrical power transformer using a temperature compensated optical fibre bragg grating as a reference. In Optical Fiber Sensors; Optical Society of America: Washington, DC, USA, 1996; p. Th337. [Google Scholar] [CrossRef]
- Irace, A.; Breglio, G. All-silicon optical temperature sensor based on Multi-Mode Interference. Opt. Express 2003, 11, 2807–2812. [Google Scholar] [CrossRef] [PubMed]
- Buckle, P.; Davies, R.; Kinning, T.; Yeung, D.; Edwards, P.; Pollard-Knight, D.; Lowe, C. The resonant mirror: A novel optical sensor for direct sensing of biomolecular interactions part II: Applications. Biosens. Bioelectron. 1993, 8, 355–363. [Google Scholar] [CrossRef]
- Kim, H.T.; Yu, M. Cascaded ring resonator-based temperature sensor with simultaneously enhanced sensitivity and range. Opt. Express 2016, 24, 9501–9510. [Google Scholar] [CrossRef] [PubMed]
- Jung, W.G.; Kim, S.W.; Kim, K.T.; Kim, E.S.; Kang, S.W. High-sensitivity temperature sensor using a side-polished single-mode fiber covered with the polymer planar waveguide. IEEE Photonics Technol. Lett. 2001, 13, 1209–1211. [Google Scholar] [CrossRef]
- Rifat, A.A.; Ahmed, R.; Yetisen, A.K.; Butt, H.; Sabouri, A.; Mahdiraji, G.A.; Yun, S.H.; Adikan, F.M. Photonic crystal fiber based plasmonic sensors. Sens. Actuators B Chem. 2017, 243, 311–325. [Google Scholar] [CrossRef]
- Momota, M.R.; Hasan, M.R. Hollow-core silver coated photonic crystal fiber plasmonic sensor. Opt. Mater. 2018, 76, 287–294. [Google Scholar] [CrossRef]
- Hoa, X.; Kirk, A.; Tabrizian, M. Towards integrated and sensitive surface plasmon resonance biosensors: A review of recent progress. Biosens. Bioelectron. 2007, 23, 151–160. [Google Scholar] [CrossRef]
- Du, C.; Wang, Q.; Zhao, Y.; Li, J. Highly sensitive temperature sensor based on an isopropanol-filled photonic crystal fiber long period grating. Opt. Fiber Technol. 2017, 34, 12–15. [Google Scholar] [CrossRef] [Green Version]
- Liu, Q.; Li, S.; Chen, H.; Fan, Z.; Li, J. Photonic Crystal Fiber Temperature Sensor Based on Coupling Between Liquid-Core Mode and Defect Mode. IEEE Photonics J. 2015, 7, 1–9. [Google Scholar] [CrossRef]
- Peng, Y.; Hou, J.; Zhang, Y.; Huang, Z.; Xiao, R.; Lu, Q. Temperature sensing using the bandgap-like effect in a selectively liquid-filled photonic crystal fiber. Opt. Lett. 2013, 38, 263–265. [Google Scholar] [CrossRef] [PubMed]
- Chen, H.; Li, S.; Li, J.; Han, Y.; Wu, Y. High Sensitivity of Temperature Sensor Based on Ultracompact Photonics Crystal Fibers. IEEE Photonics J. 2014, 6, 1–6. [Google Scholar] [CrossRef]
- Zuo, J.; Han, T.; Yang, J.; Chen, Y.; Lin, Y.; Cai, J. High Sensitivity Temperature Sensor With an Avoided-Crossing Based Selective-Filling High Birefringent Photonic Crystal Fiber Sagnac Interferometer. IEEE Access 2018, 6, 45527–45533. [Google Scholar] [CrossRef]
- Wang, G.; Lu, Y.; Yang, X.; Duan, L.; Yao, J. Square-lattice alcohol-filled photonic crystal fiber temperature sensor based on a Sagnac interferometer. Appl. Opt. 2019, 58, 2132–2136. [Google Scholar] [CrossRef]
- Liu, H.; Li, H.; Wang, Q.; Wang, M.; Ding, Y.; Zhu, C. Simultaneous measurement of temperature and magnetic field based on surface plasmon resonance and Sagnac interference in a D-shaped photonic crystal fiber. Opt. Quantum Electron. 2018, 50, 392. [Google Scholar] [CrossRef]
- Wang, Y.; Huang, Q.; Zhu, W.; Yang, M.; Lewis, E. Novel optical fiber SPR temperature sensor based on MMF-PCF-MMF structure and gold-PDMS film. Opt. Express 2018, 26, 1910–1917. [Google Scholar] [CrossRef]
- Canovi, M.; Lucchetti, J.; Stravalaci, M.; Re, F.; Moscatelli, D.; Bigini, P.; Salmona, M.; Gobbi, M. Applications of Surface Plasmon Resonance (SPR) for the Characterization of Nanoparticles Developed for Biomedical Purposes. Sensors 2012, 12, 16420–16432. [Google Scholar] [CrossRef] [Green Version]
- Gandhi, M.S.A.; Chu, S.; Senthilnathan, K.; Babu, P.R.; Nakkeeran, K.; Li, Q. Recent Advances in Plasmonic Sensor-Based Fiber Optic Probes for Biological Applications. Appl. Sci. 2019, 9, 949. [Google Scholar] [CrossRef] [Green Version]
- Hassani, A.; Skorobogatiy, M. Design of the Microstructured Optical Fiber-based Surface Plasmon Resonance sensors with enhanced microfluidics. Opt. Express 2006, 14, 11616–11621. [Google Scholar] [CrossRef] [Green Version]
- Chu, S.; Nakkeeran, K.; Abobaker, A.M.; Aphale, S.S.; Sivabalan, S.; Babu, P.R.; Senthilnathan, K. A Surface Plasmon Resonance Bio-Sensor based on Dual Core D-Shaped Photonic Crystal Fibre Embedded with Silver Nanowires for Multi-Sensing. IEEE Sens. J. 2020. [Google Scholar] [CrossRef] [Green Version]
- Mishra, A.K.; Mishra, S.K.; Verma, R.K. Graphene and Beyond Graphene MoS2: A New Window in Surface-Plasmon-Resonance-Based Fiber Optic Sensing. J. Phys. Chem. C 2016, 120, 2893–2900. [Google Scholar] [CrossRef]
- Zainuddin, N.; Ariannejad, M.; Arasu, P.; Harun, S.; Zakaria, R. Investigation of cladding thicknesses on silver SPR based side-polished optical fiber refractive-index sensor. Results Phys. 2019, 13, 102255. [Google Scholar] [CrossRef]
- Luan, N.N.; Wang, R.; Lu, Y.; Yao, J. Simulation of surface plasmon resonance temperature sensor based on liquid mixture-filling microstructured optical fiber. Opt. Eng. 2014, 53, 1–4. [Google Scholar] [CrossRef]
- Peng, Y.; Hou, J.; Huang, Z.; Lu, Q. Temperature sensor based on surface plasmon resonance within selectively coated photonic crystal fiber. Appl. Opt. 2012, 51, 6361–6367. [Google Scholar] [CrossRef]
- Luan, N.; Wang, R.; Lv, W.; Lu, Y.; Yao, J. Surface Plasmon Resonance Temperature Sensor Based on Photonic Crystal Fibers Randomly Filled with Silver Nanowires. Sensors 2014, 14, 16035–16045. [Google Scholar] [CrossRef] [Green Version]
- Sani, E.; Dell’Oro, A. Spectral optical constants of ethanol and isopropanol from ultraviolet to far infrared. Opt. Mater. 2016, 60, 137–141. [Google Scholar] [CrossRef]
- Moutzouris, K.; Papamichael, M.; Betsis, S.C.; Stavrakas, I.; Hloupis, G.; Triantis, D. Refractive, dispersive and thermo-optic properties of twelve organic solvents in the visible and near-infrared. Appl. Phys. B 2014, 116, 617–622. [Google Scholar] [CrossRef]
- Shuai, B.; Xia, L.; Zhang, Y.; Liu, D. A multi-core holey fiber based plasmonic sensor with large detection range and high linearity. Opt. Express 2012, 20, 5974–5986. [Google Scholar] [CrossRef]
- Mollah, M.A.; Islam, S.R.; Yousufali, M.; Abdulrazak, L.F.; Hossain, M.B.; Amiri, I. Plasmonic temperature sensor using D-shaped photonic crystal fiber. Results Phys. 2020, 16, 102966. [Google Scholar] [CrossRef]
- Li, X.G.; Zhao, Y.; Zhou, X.; Cai, L. High sensitivity all-fiber Sagnac interferometer temperature sensor using a selective ethanol-filled photonic crystal fiber. Instrum. Sci. Technol. 2018, 46, 253–264. [Google Scholar] [CrossRef]
- Liu, B.H.; Jiang, Y.X.; Zhu, X.S.; Tang, X.L.; Shi, Y.W. Hollow fiber surface plasmon resonance sensor for the detection of liquid with high refractive index. Opt. Express 2013, 21, 32349–32357. [Google Scholar] [CrossRef] [PubMed]
- Luan, N.; Yao, J. High Refractive Index Surface Plasmon Resonance Sensor Based on a Silver Wire Filled Hollow Fiber. IEEE Photonics J. 2016, 8, 1–9. [Google Scholar] [CrossRef]
- Rifat, A.; Mahdiraji, G.A.; Shee, Y.; Shawon, M.J.; Adikan, F.M. A Novel Photonic Crystal Fiber Biosensor Using Surface Plasmon Resonance. Procedia Eng. 2016, 140, 1–7. [Google Scholar] [CrossRef] [Green Version]
- Hossen, M.N.; Ferdous, M.; Khalek, M.A.; Chakma, S.; Paul, B.K.; Ahmed, K. Design and analysis of biosensor based on surface plasmon resonance. Sens. Bio-Sens. Res. 2018, 21, 1–6. [Google Scholar] [CrossRef]
- Li, Y.; Wang, Y.; Wen, C. Temperature and strain sensing properties of the zinc coated FBG. Optik 2016, 127, 6463–6469. [Google Scholar] [CrossRef]
- Zhao, Y.; Deng, Z.; Hu, H. Fiber-Optic SPR Sensor for Temperature Measurement. IEEE Trans. Instrum. Meas. 2015, 64, 3099–3104. [Google Scholar] [CrossRef]
- Wang, Q.; Du, C.; Zhang, J.; Lv, R.; Zhao, Y. Sensitivity-enhanced temperature sensor based on PDMS-coated long period fiber grating. Opt. Commun. 2016, 377, 89–93. [Google Scholar] [CrossRef] [Green Version]
- Zhao, Y.; Tong, R.; Chen, M.; Xia, F. Fluorescence Temperature Sensor Based on GQDs Solution Encapsulated in Hollow Core Fiber. IEEE Photonics Technol. Lett. 2017, 29, 1544–1547. [Google Scholar] [CrossRef]
- Irawati, N.; Harun, S.W.; Rahman, H.A.; Chong, S.S.; Hamizi, N.A.; Ahmad, H. Temperature sensing using CdSe quantum dot doped poly(methyl methacrylate) microfiber. Appl. Opt. 2017, 56, 4675–4679. [Google Scholar] [CrossRef]
- Chu, S.; Nakkeeran, K.; Abobaker, A.M.; Aphale, S.S.; Sivabalan, S.; Babu, P.R.; Senthilnathan, K. Influence of the Sub-peak of Secondary Surface Plasmon Resonance onto the Sensing Performance of a D-shaped Photonic Crystal Fibre Sensor. IEEE Sens. J. 2019. [Google Scholar] [CrossRef] [Green Version]


| S/N | Temp. [C] | Reso. Wavelength [nm] | Conf. Loss [dB/cm] | [nm] | Temp. Sensitivity [nm/C] | Resolution [C] | |
|---|---|---|---|---|---|---|---|
| 1 | 10 | 1932.9 | 1.4080 | 40.0658 | N/A | N/A | N/A |
| 2 | 20 | 1929.3 | 1.4081 | 39.9305 | 3.6 | 0.36 | 2.78 × |
| 3 | 30 | 1926.1 | 1.4083 | 39.7599 | 3.2 | 0.32 | 3.12 × |
| 4 | 40 | 1922.7 | 1.4084 | 39.5594 | 3.4 | 0.34 | 2.94 × |
| 5 | 50 | 1919.6 | 1.4085 | 39.3323 | 3.1 | 0.31 | 3.23 × |
| 6 | 60 | 1916.7 | 1.4086 | 39.0815 | 2.9 | 0.29 | 3.45 × |
| 7 | 70 | 1913.8 | 1.4088 | 38.8091 | 2.9 | 0.29 | 3.45 × |
| 8 | 80 | 1911.3 | 1.4089 | 38.5164 | 2.5 | 0.25 | 4.00 × |
| S/N | Temp. [C] | Reso. Wavelength [nm] | Conf. Loss [dB/cm] | [nm] | Temp. Sensitivity [nm/C] | Resolution [C] | |
|---|---|---|---|---|---|---|---|
| 1 | 10 | 1888 | 1.4094 | 68.7349 | N/A | N/A | N/A |
| 2 | 20 | 1834 | 1.4117 | 71.0958 | 54.00 | 5.4 | 1.85 × |
| 3 | 30 | 1754 | 1.415 | 76.8213 | 80.00 | 8 | 1.25 × |
| 4 | 40 | 1584 | 1.4215 | 33.6976 | 170.00 | 17 | 5.88 × |
| 5 * | 50 | 1351 | 1.4298 | 7.0533 | 233 | 23.3 | 4.29 × |
| 5 ** | 50 | 1751 | 1.4154 | 54.9956 | N/A | N/A | N/A |
| 6 | 60 | 1964 | 1.4067 | 40.3456 | −213 | −21.3 | −4.69 × |
| 7 | 70 | 1975 | 1.4062 | 25.8258 | −11 | −1.1 | −9.09 × |
| 8 | 80 | 1896 | 1.4095 | 35.6852 | −79 | −7.9 | 1.27 × |
| Sensor Type | Temperature Sensing Material | Temperature Sensing Range [C] | Maximum Sensitivity [nm/C] | Year |
|---|---|---|---|---|
| FBG [38] | Zinc | 35–80 | 0.0496 | 2006 |
| SPR [27] | Liquid(RI = 1.35) | 0–100 | 0.72 | 2012 |
| SPR [26] | Ethanol and chloroform | −20–58 | 5.6 | 2014 |
| SPR [39] | Anhydrous Ethanol | 35–70 | 1.5745 | 2015 |
| LPFG [40] | Poly-dimethylsiloxane | 20–80 | 0.2554 | 2016 |
| HCF [41] | Graphene Quantum Dots | 10–80 | 0.1237 | 2017 |
| PMF [42] | CdSe Quantum Dot | 25–48 | 0.0585 | 2017 |
| PCF-LPG [12] | Isopropanol | 20–50 | 1.356 | 2017 |
| MMF-PCF-MMF [19] | Gold-PDMS | 35–100 | −1.551 | 2018 |
| Proposed sensor | Ethanol | 10–80 | 0.36 | 2020 |
| Proposed sensor | Benzene | 10–50 | 23.3 | 2020 |
© 2020 by the authors. Licensee MDPI, Basel, Switzerland. This article is an open access article distributed under the terms and conditions of the Creative Commons Attribution (CC BY) license (http://creativecommons.org/licenses/by/4.0/).
Share and Cite
Osifeso, S.; Chu, S.; Prasad, A.; Nakkeeran, K. Surface Plasmon Resonance-Based Temperature Sensor with Outer Surface Metal Coating on Multi-Core Photonic Crystal Fibre. Surfaces 2020, 3, 337-351. https://doi.org/10.3390/surfaces3030025
Osifeso S, Chu S, Prasad A, Nakkeeran K. Surface Plasmon Resonance-Based Temperature Sensor with Outer Surface Metal Coating on Multi-Core Photonic Crystal Fibre. Surfaces. 2020; 3(3):337-351. https://doi.org/10.3390/surfaces3030025
Chicago/Turabian StyleOsifeso, Samuel, Suoda Chu, Ashwini Prasad, and K. Nakkeeran. 2020. "Surface Plasmon Resonance-Based Temperature Sensor with Outer Surface Metal Coating on Multi-Core Photonic Crystal Fibre" Surfaces 3, no. 3: 337-351. https://doi.org/10.3390/surfaces3030025
APA StyleOsifeso, S., Chu, S., Prasad, A., & Nakkeeran, K. (2020). Surface Plasmon Resonance-Based Temperature Sensor with Outer Surface Metal Coating on Multi-Core Photonic Crystal Fibre. Surfaces, 3(3), 337-351. https://doi.org/10.3390/surfaces3030025