Article

A Simple Method for the Quantification of Free Isocyanates on the Surface of Cellulose Nanocrystals upon Carbamation using Toluene Diisocyanate

by
Hatem Abushammala
Fraunhofer Institute for Wood Research (WKI), Bienroder Weg 54E, 38108 Braunschweig, Germany
Surfaces 2019, 2(2), 444-454; https://doi.org/10.3390/surfaces2020032
Submission received: 9 May 2019 / Revised: 31 May 2019 / Accepted: 4 June 2019 / Published: 13 June 2019

Abstract

:
In many reports, cellulose and nanocellulose have been carbamated using 2,4-toluene diisocyanate (2,4-TDI) to allow the grafting of molecules or polymers onto their surfaces. Such a process usually involves the reaction of the more reactive isocyanate group of TDI (para-NCO) selectively with a hydroxyl group from the cellulose surface, followed by the reaction of the free isocyanate (ortho-NCO) with a desired molecule. After the first step, it is not possible, using elemental analysis, to determine the amount of ortho-NCO on the cellulosic surface, as an ideal para/ortho selectivity is difficult to obtain. This paper presents a simple method for the quantification of ortho-NCOs on the surface of cellulose nanocrystals upon TDI-based carbamation. It relies on the pH increase upon a complete hydrolysis of ortho-NCOs to amine groups using acidified dimethylsulfoxide. The method was found to be accurate and valid for a degree of substitution of up to 20%.

Graphical Abstract

1. Introduction

The surface modification of cellulose and nanocellulose is often used to significantly increase their potential. A wide range of functionalities have been placed on cellulose surfaces through simple modifications such as acetylation, oxidation, and carboxymethylation or through a more-complicated grafting of polymers such as polycaprolactone and poly(ethylene glycol) [1,2,3,4,5,6,7,8]. In some cases, chemical linkers were needed to bind certain functionalities to nanocellulose; among these are aromatic diisocyanates [9,10]. 2,4-toluene diisocyanate (2,4-TDI, or TDI) is one of the most commonly used isocyanates for the production of polyurethanes [11]. It is a very useful linker to bind different chemicals together due to the reported difference in reactivity of its two isocyanate groups; o-NCO and p-NCO. It has been reported that o-NCO is 5–10 times less reactive than p-NCO due to the stearic hindrance from the neighboring methyl group [12,13]. A typical TDI-based binding process includes 1) the carbamation of a certain chemical (cellulose in this case) using the more reactive p-NCO of TDI followed by 2) the carbamation of a desired chemical to the cellulose surface using the free o-NCO (Figure 1).
TDI was used for the first time with cellulose in 1977 to bind it to certain biomolecules [14]. Before being applied for the first time on cellulose nanocrystals (CNCs) [15], it was used to graft certain polymers on the surface of starch nanocrystals [16,17]. Since then, TDI has been used more frequently for grafting polymers on the surface of CNCs [18,19,20,21]. However, most of these studies have not reported the amount of TDI on the CNC surface after the first carbamation reaction, i.e., degree of carbamation [4]. The degree of carbamation is mainly determined using elemental analysis, which relies on the increase in the nitrogen/carbon ratio (N/C) upon carbamation. Still, elemental analysis does not provide an accurate information about the amount of o-NCO available on the CNC surface after the first carbamation as the calculations that follow elemental analysis assume an ideal p-NCO/o-NCO selectivity, which means no o-NCO reacts at all at that stage (no crosslinking). This assumption is certainly invalid, as it is known that a certain amount of o-NCO still reacts, reducing the efficiency of carbamation [22]. Here, a simple method is developed for the determination of the free isocyanates of TDI-carbamated CNCs using a pH meter. It relies on the pH increase upon hydrolyzing the free isocyanates on the CNC surface to amine groups. Such a method could be useful in optimizing carbamation reactions and to accurately proceed with any later grafting of desired chemicals.
The hydrolysis of isocyanates is a topic of strong interest. Due to health and environmental concerns, environmentalists have investigated the fate of commonly used isocyanates in water and soil by studying their hydrolysis kinetics [23]. Both aromatic and aliphatic isocyanates get hydrolyzed in aqueous solutions to their corresponding amines, which readily react with neighboring isocyanates forming a polyurea. This side reaction can be fully hindered in acidic media due to the instant protonation of the generated amine groups [24]. The hydrolysis in acidic media is, however, slow, but can be strongly catalyzed by the addition of organic solvents such as dimethylsulfoxide (DMSO) [25]. Moreover, such organic solvent unlike water can to a good extent disperse carbamated CNCs. This work, therefore, proposes acidified DMSO as an organic system that can disperse TDI-carbamated CNCs and hydrolyze their free isocyanates to amine groups in order to quantify them using a pH-meter.

2. Materials and Methods

2.1. Materials

Cellulose nanocrystals suspension (10.4 % w/w) was purchased from the University of Maine, which was prepared using the sulfuric acid method. Acetone (≥99%), Toluene (≥99%), DMSO (≥99%), trimethylamine (TEA) (≥99%), and hydrochloric acid 37% were purchased from VWR (Darmstadt, Germany). 2,4-toluene diisocyanate (≥98%), o-toluene isocyanate (≥98%), p-toluene isocyanate (≥98%), and o-toluidine (≥99%) were purchased from TCI Chemicals (Eschborn, Germany) and were stored in sealed bottles in the fridge. DMSO, TEA, and toluene were stored over A4 molecular sieve, while acetone was stored under A3 molecular sieve. Both molecular sieves were purchased from Carl Roth (Karlsruhe, Germany) and regenerated before use.

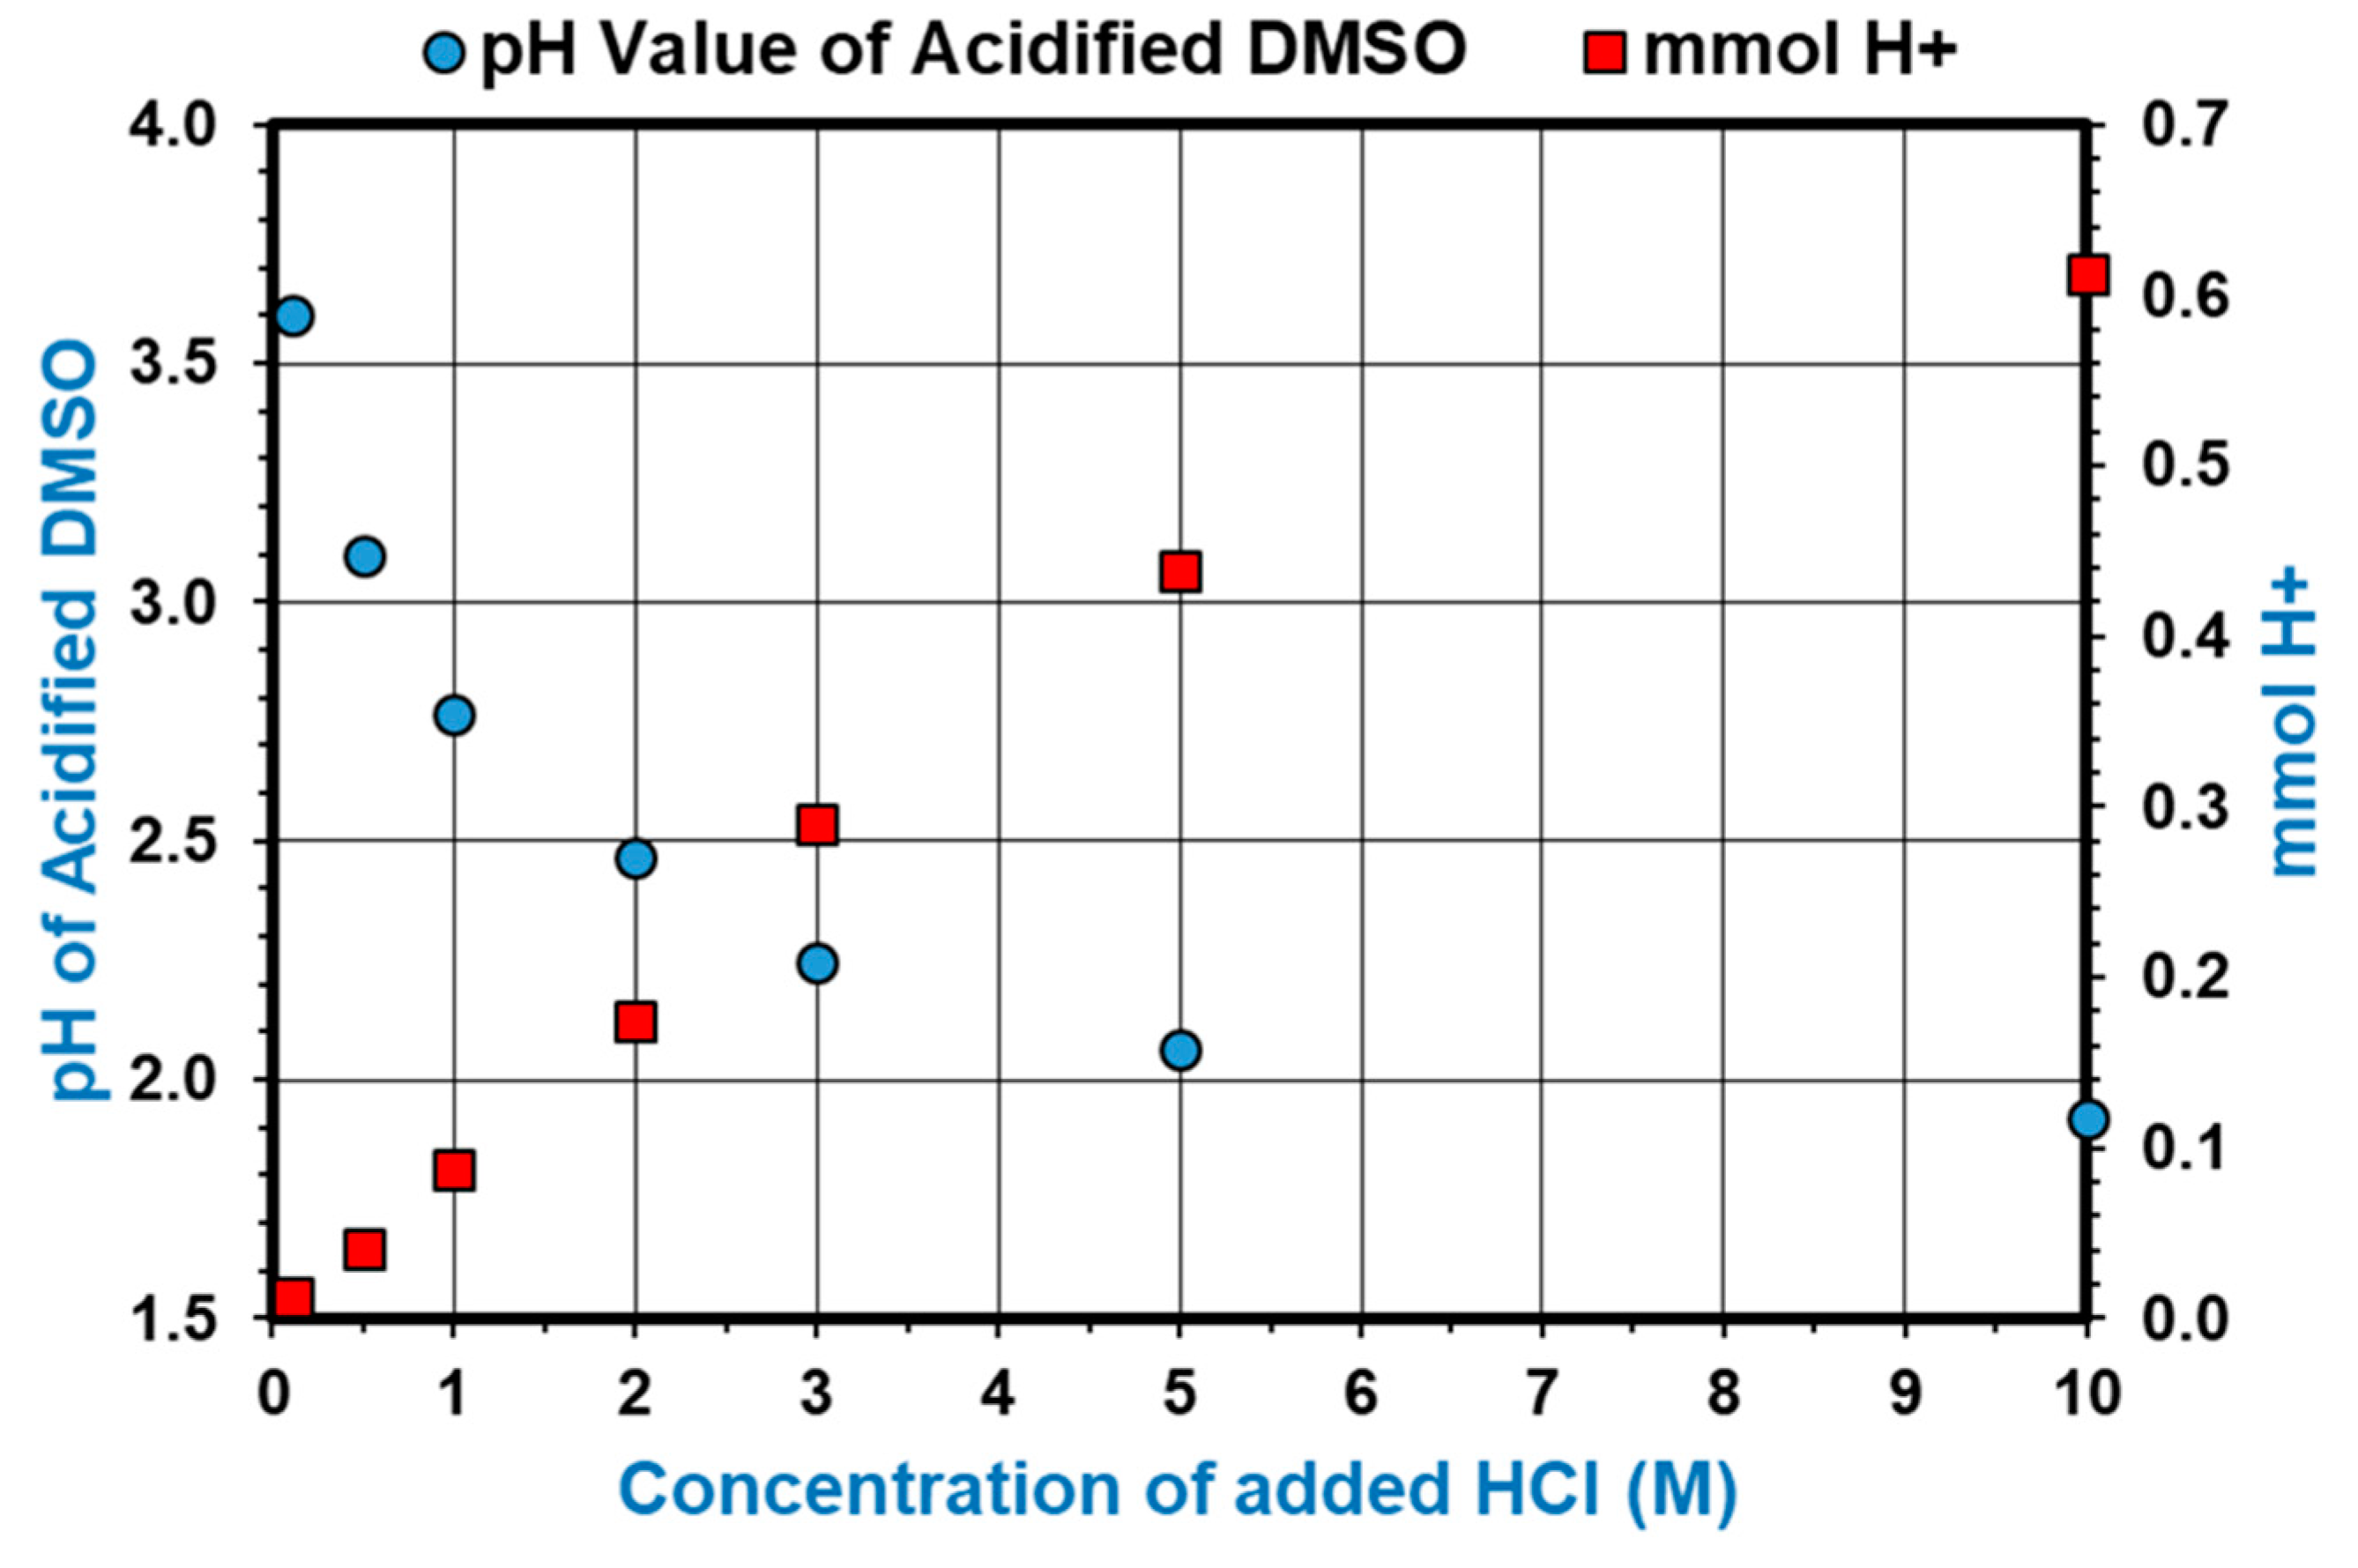
2.2. Optimization of Acidified DMSO as Hydrolysis Medium

Two milliliters of HCl solutions of varying molarities (0.1–10 M) was transferred to 100 mL of DMSO and mixed for an hour. The pH was recorded using a SevenEasy S20-KS pH meter equipped with an InLab® Routine Pro electrode (Mettler Toledo, Giessen, Germany). All measurements were recorded in duplicate at a temperature of 25 ± 0.5 °C.

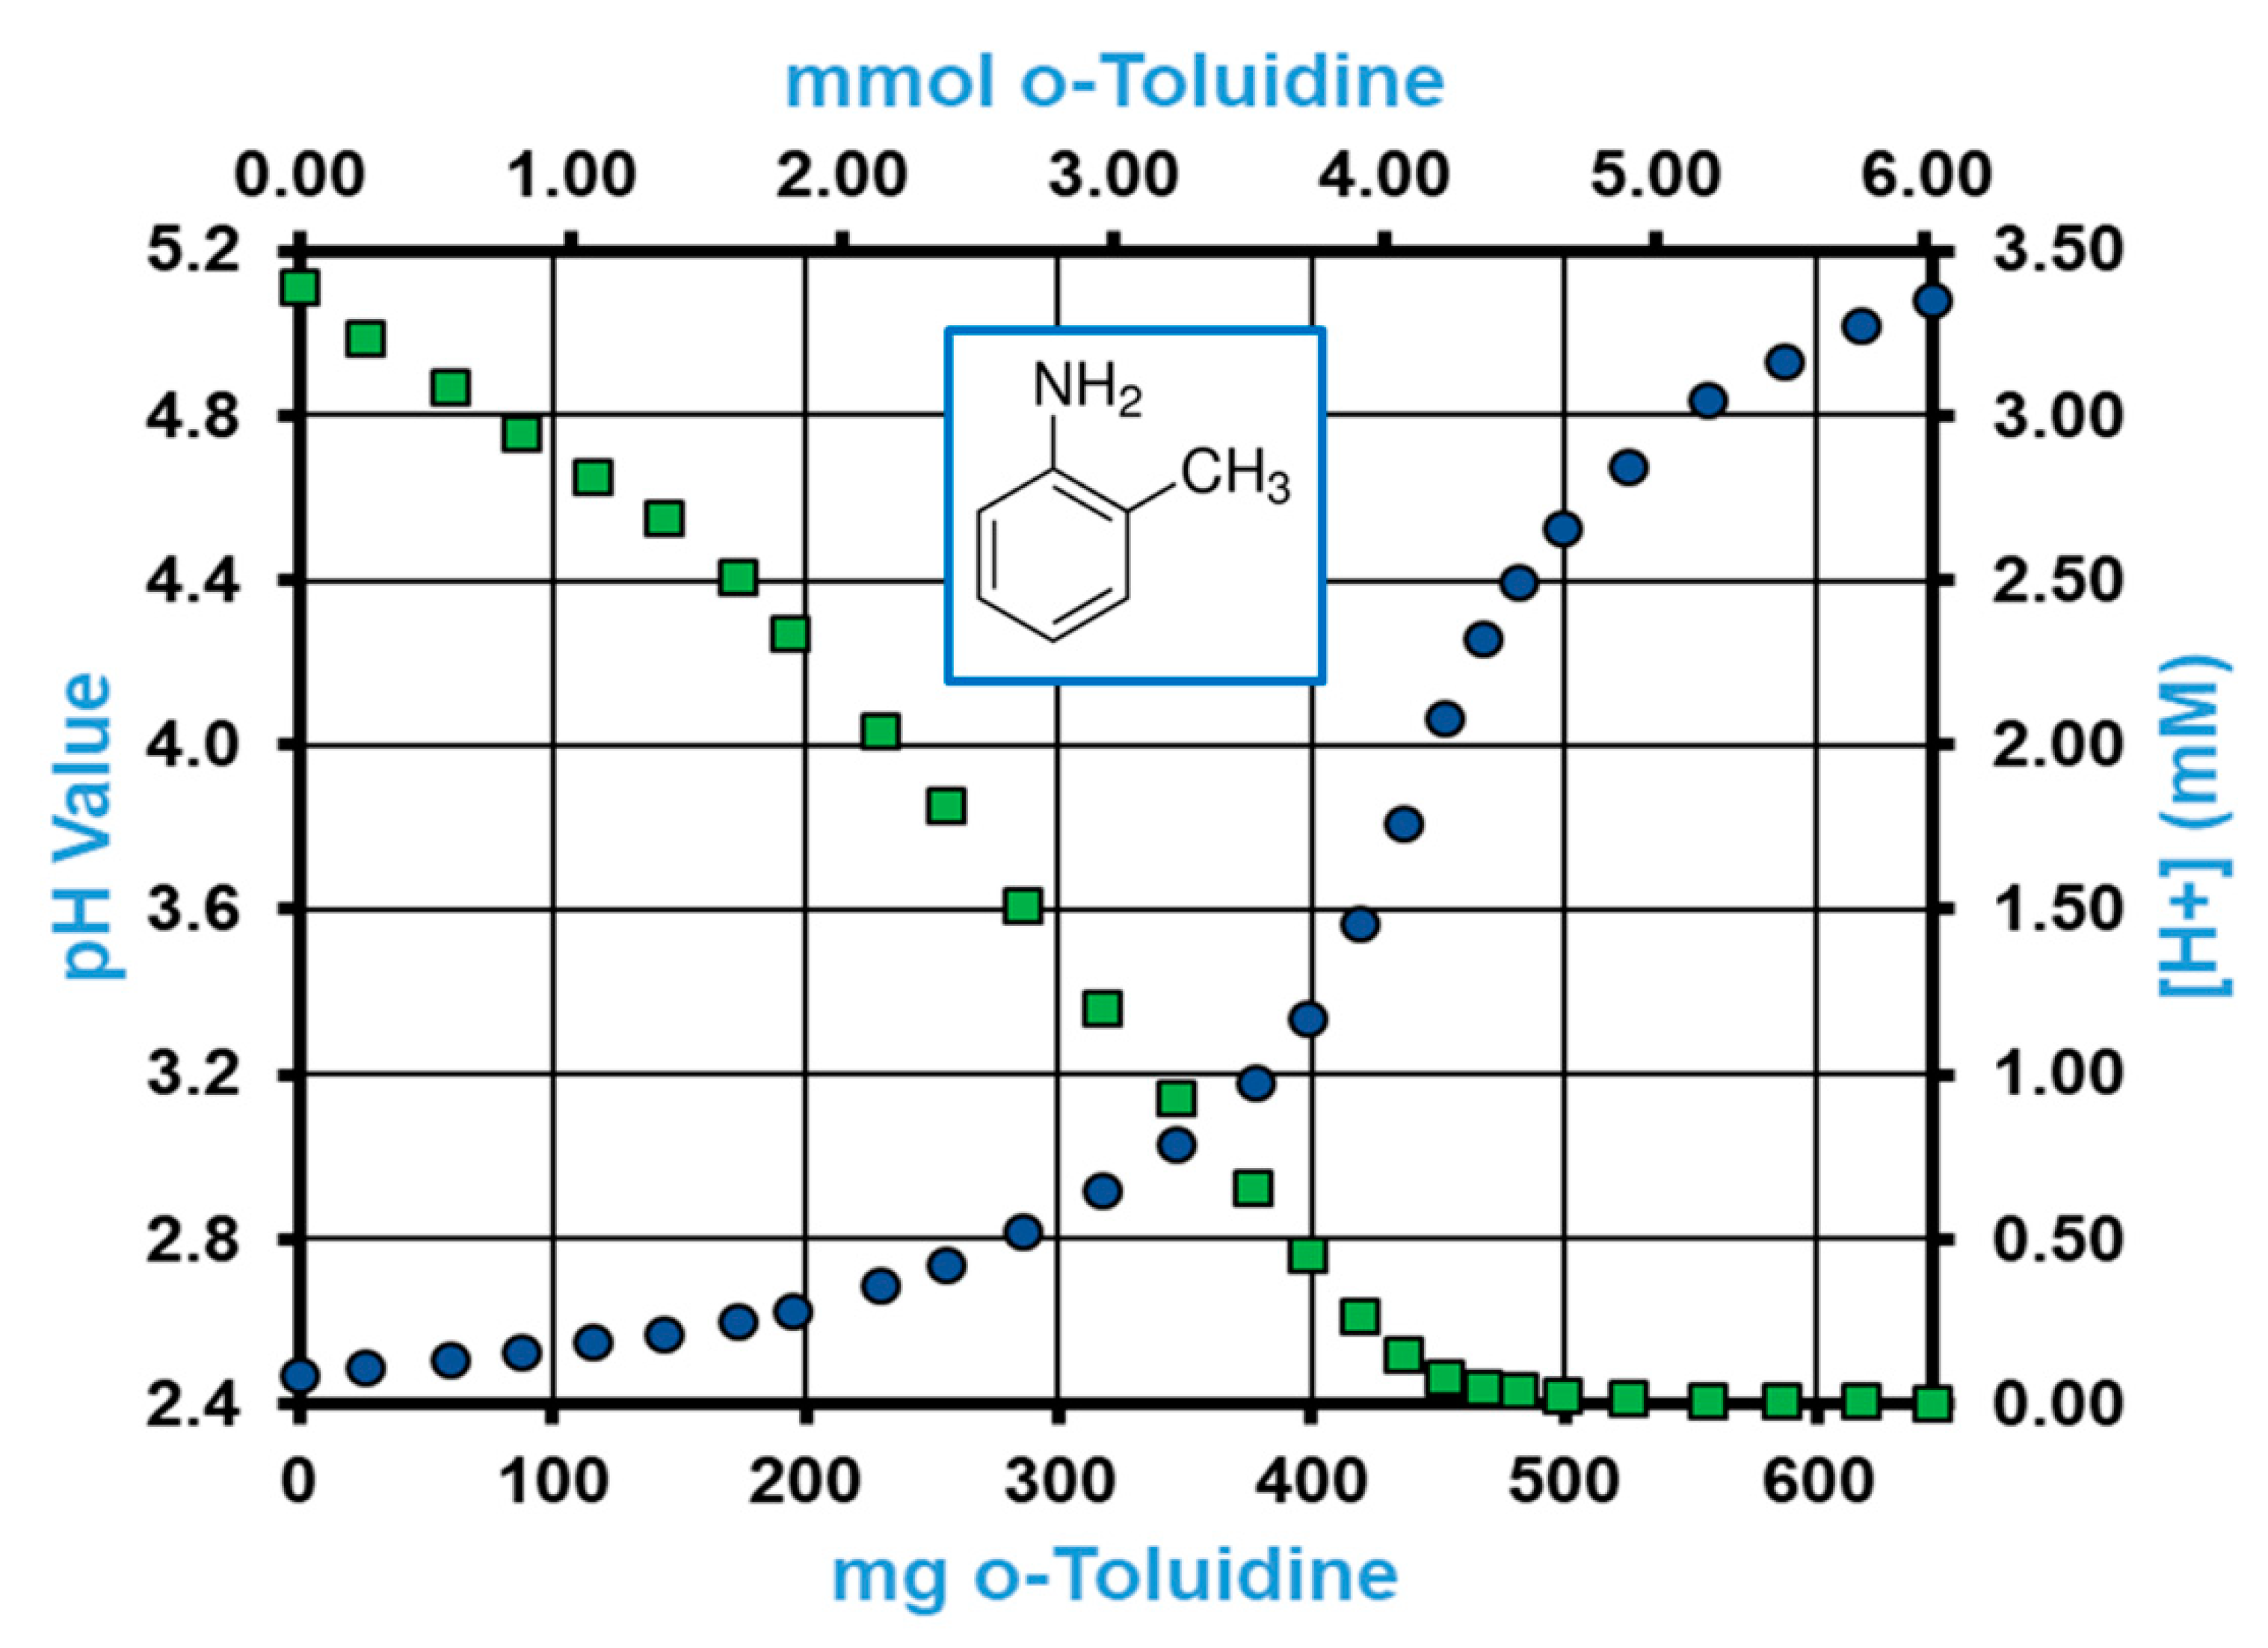
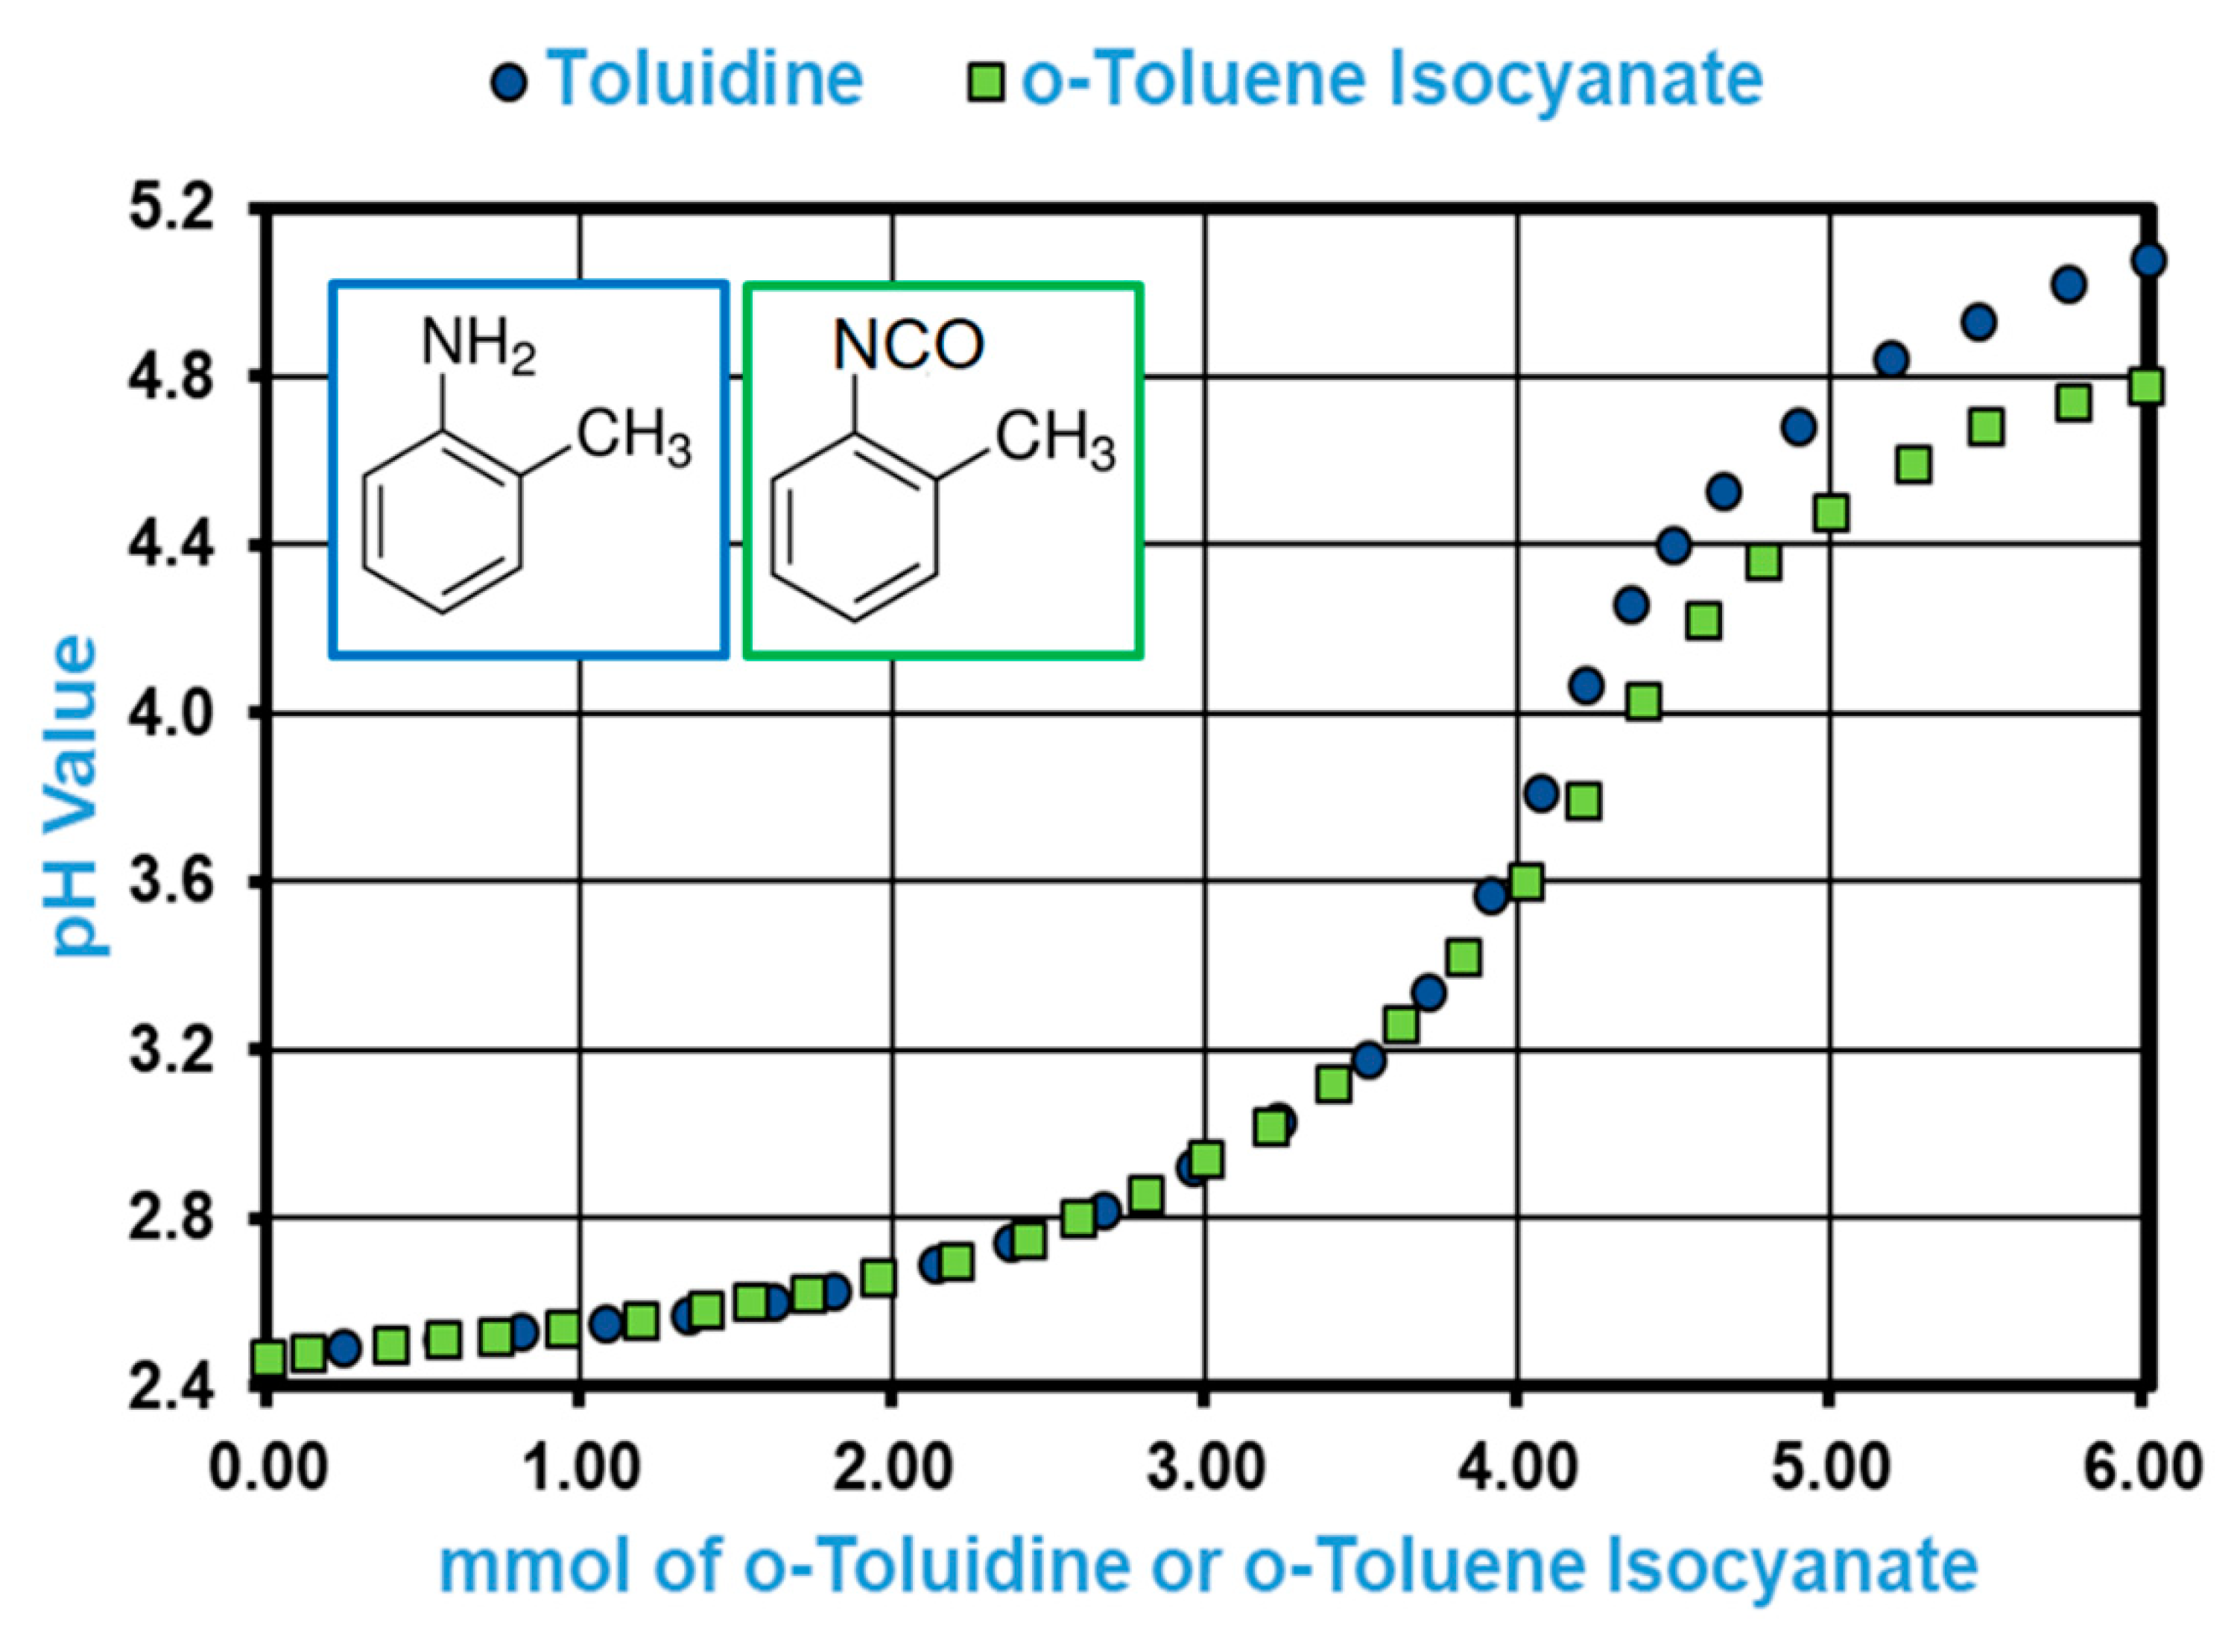
2.3. pH Profile of o-Toluidine and o-Toluene Isocyanate in Acidified DMSO

Two milliliters of 2 M HCl was transferred to 100 mL of DMSO. A certain amount of o-toluidine or o-toluene isocyanate (ca. 20 mg) was transferred dropwise to the acidified DMSO using a syringe. The pH value was recorded after 15 min using a SevenEasy S20-KS pH meter equipped with an InLab® Routine Pro electrode (Mettler Toledo, Giessen, Germany). Similar amounts were added every 15 min until a total amount of ca. 6 mmol was added. All measurements were recorded at a temperature of 25 ± 0.5 °C.

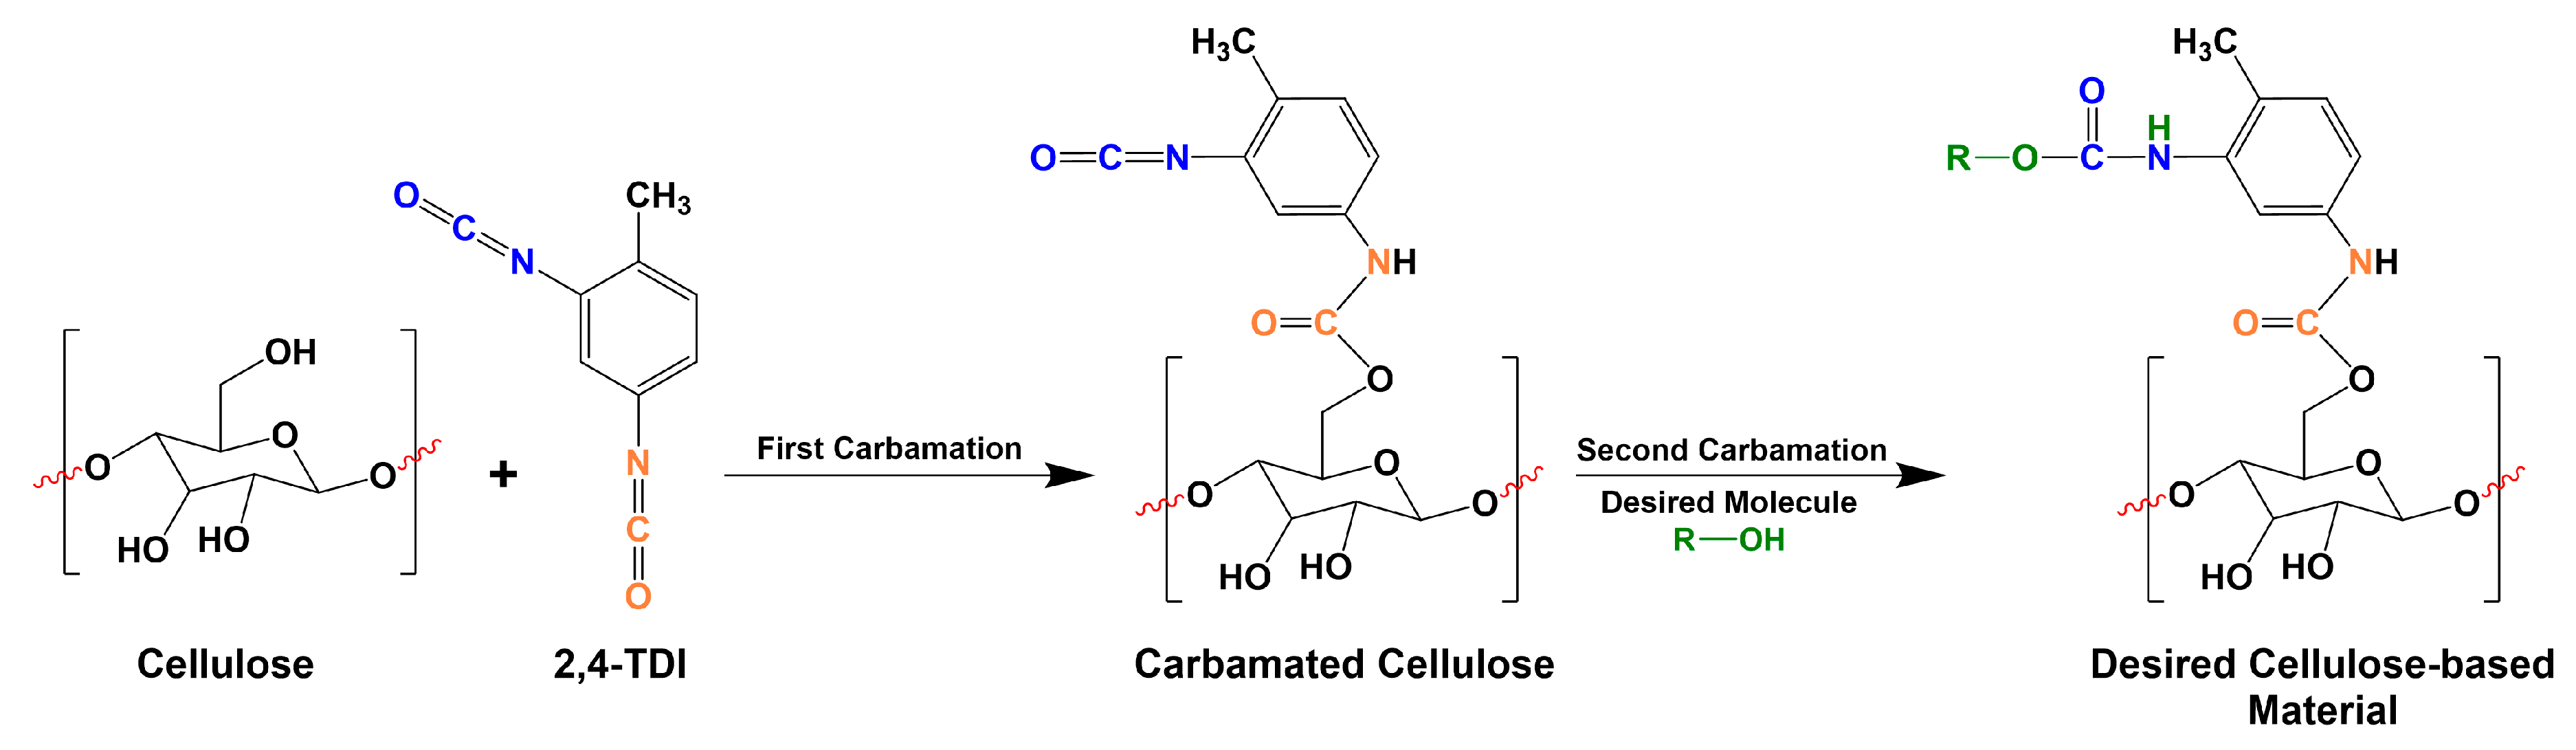
2.4. Carbamation of Cellulose Nanocrystals using TDI

The CNCs were carbamated following the method of Habibi after minor modifications [15]. 9.6 g of 10.4% CNC suspension (equivalent to 1.0 g of dried CNCs (6.2 mmol)) was solvent-exchanged to anhydrous toluene using a washing/precipitation procedure starting with anhydrous acetone (three times) then anhydrous toluene (twice). The precipitation was performed by centrifugation using a Sigma 3-16P centrifuge (g-force of 4472, 5000 rpm for 30 min) (Sigma Laborzentrifugen, Osterode am Harz, Germany). After final washing, the precipitated CNCs were transferred to a 100 mL round-bottom flask using 50 mL of anhydrous toluene. 1.1 g of 2,4-TDI (6.2 mmol) and 1.0 mL of triethylamine (TEA) as catalyst were added to the reaction flask. The reaction proceeded at 35, 55, or 75 °C for 24 h in a moisture-free environment (under nitrogen). The reaction mixture was then centrifuged to collect the carbamated CNCs from the unreacted TDI and TEA. The carbamated CNCs were then washed once with anhydrous toluene and twice with anhydrous DMSO before transferred to acidified DMSO for hydrolysis and quantification of free isocyanates. For characterization, the carbamated CNCs were not washed with DMSO, but only with toluene (three times), and then dried overnight at 50 °C under vacuum.

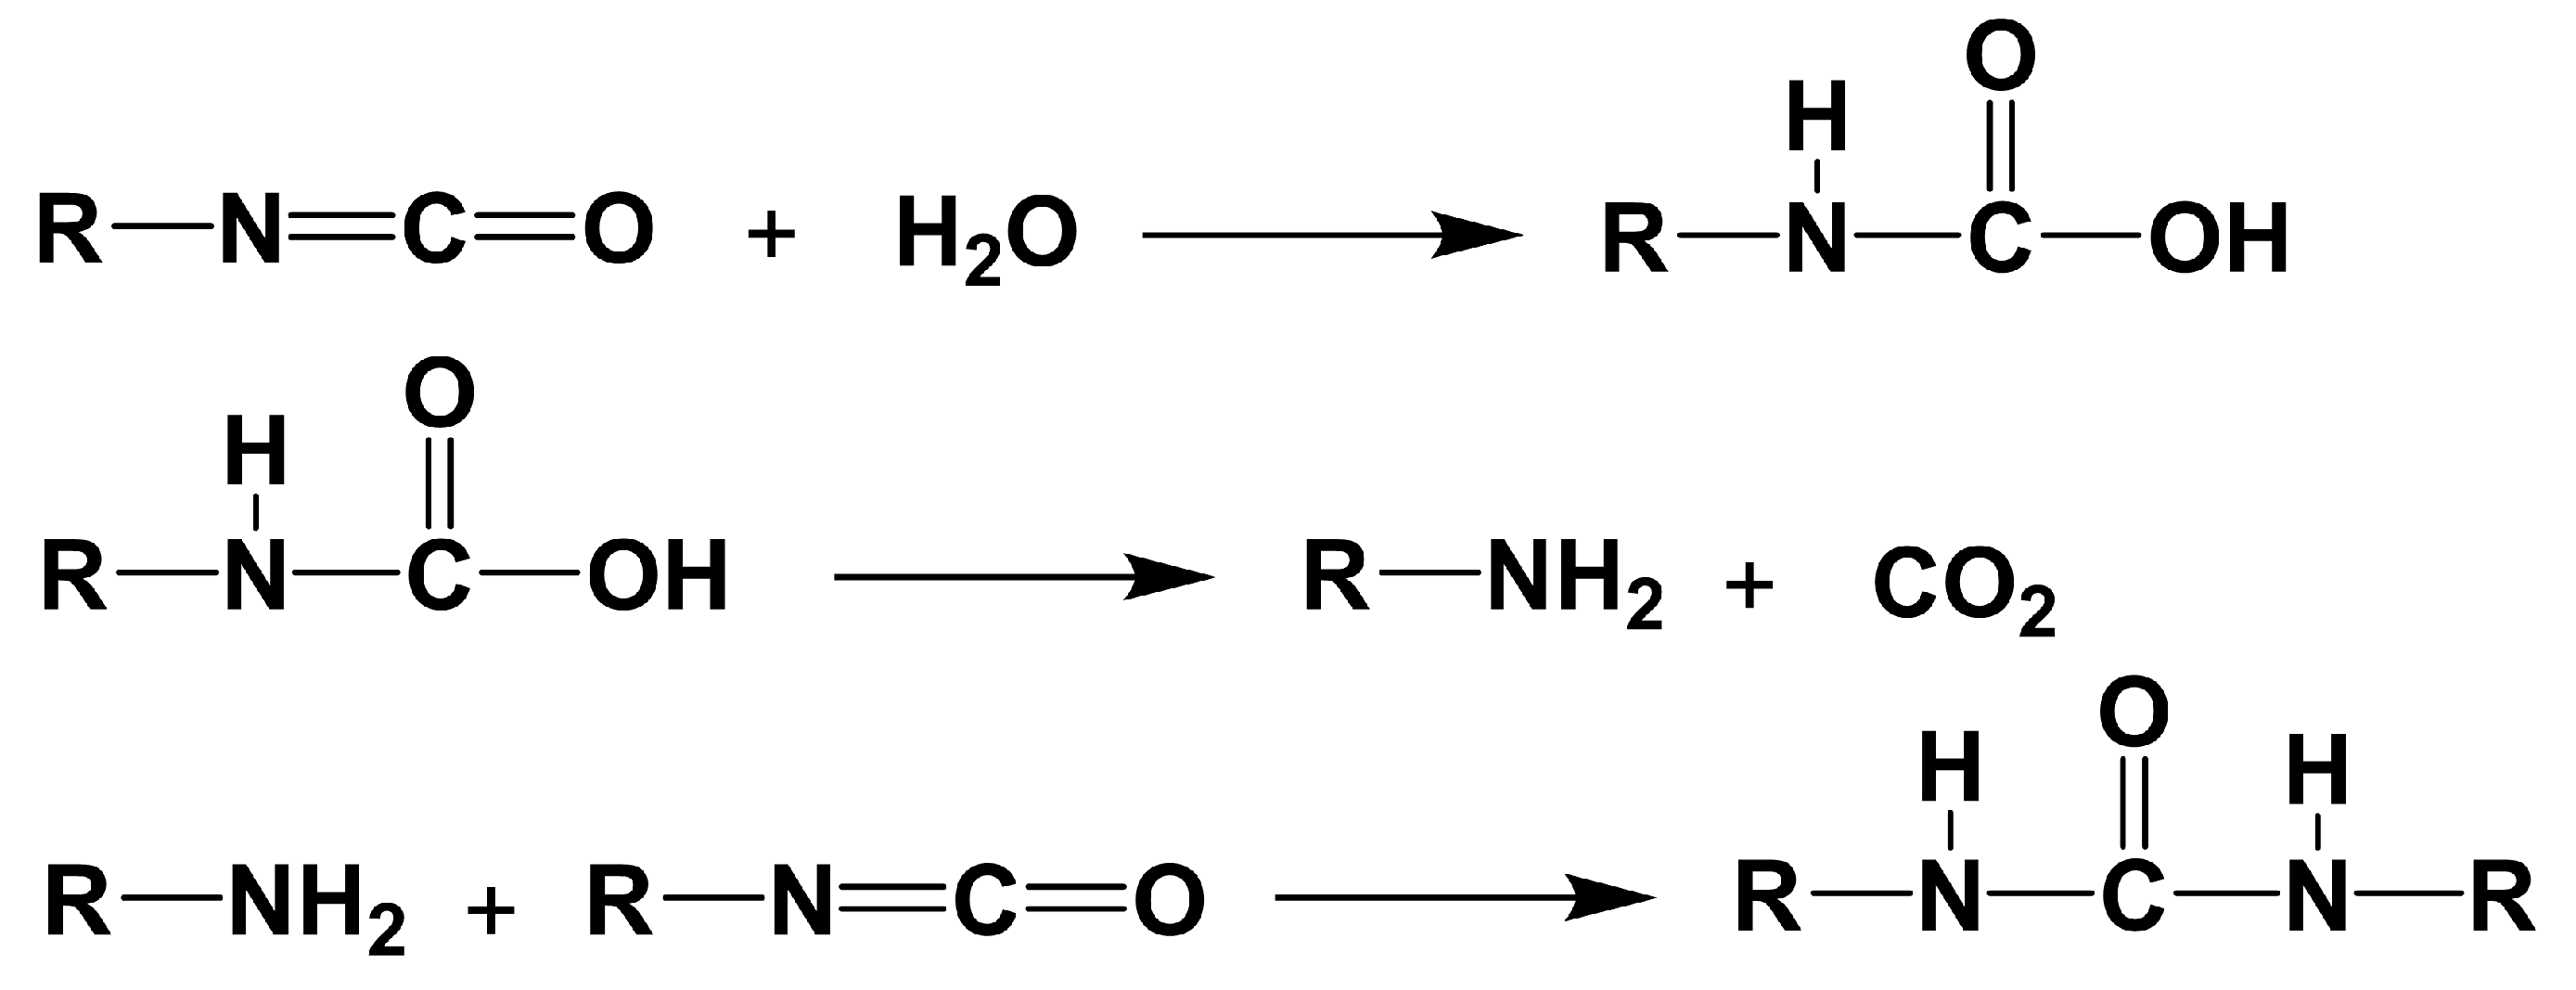
2.5. Hydrolysis of the Carbamated CNCs for the Determination of Free Isocyanates Degree of Substitution (DSNCO)

One hundred milliliters of DMSO was transferred to a 200 mL beaker before being acidified to a pH of 2.47 ± 0.01 using 2 mL of 2 M HCl. The carbamated CNCs, after washed with DMSO, were transferred to the beaker. The pH started to increase because of isocyanate hydrolysis to amine groups. The hydrolysis was complete when no further increase in pH was observed (a maximum of 1 h). All pH measurements were recorded at a temperature of 25 ± 0.5 °C. The hydrolysis was performed in duplicate to assure reproducibility. The amount of free isocyanates (DSNCO) available on the surface of the carbamated CNCs (moles of NCO/moles of CNC hydroxyl groups*100%) was determined based on the final pH value.

2.6. Determination of the Degree of Carbamation (DSTDI) using SEM-EDX

The elemental analysis (C, N, O, S, Na) of the CNCs, before and after carbamation, was determined using the scanning electron microscope (SEM) ZEISS GeminiSEM Crossbeam 340 (ZEISS, Oberkochen, Germany) equipped with the energy dispersive X-ray (EDX) detector X-MaxN (Oxford Instruments, Abingdon, UK) and operating at a voltage of 10 kV. The samples in the powder form were pressed in a FT-IR-KBr mold using a mild force to obtain discs of smooth surfaces. The degree of carbamation (moles of TDI/moles of CNC hydroxyl groups*100%) was determined based on the increase in the nitrogen/carbon ratio (see the Supplementary Materials). The results were confirmed using the elemental analyzer VarioMICRO V3.1.1 CHNS-Modus (Elementar Analysensysteme, Langenselbold, Germany) and using the mass yield of the carbamation reaction (see Supplementary Materials).

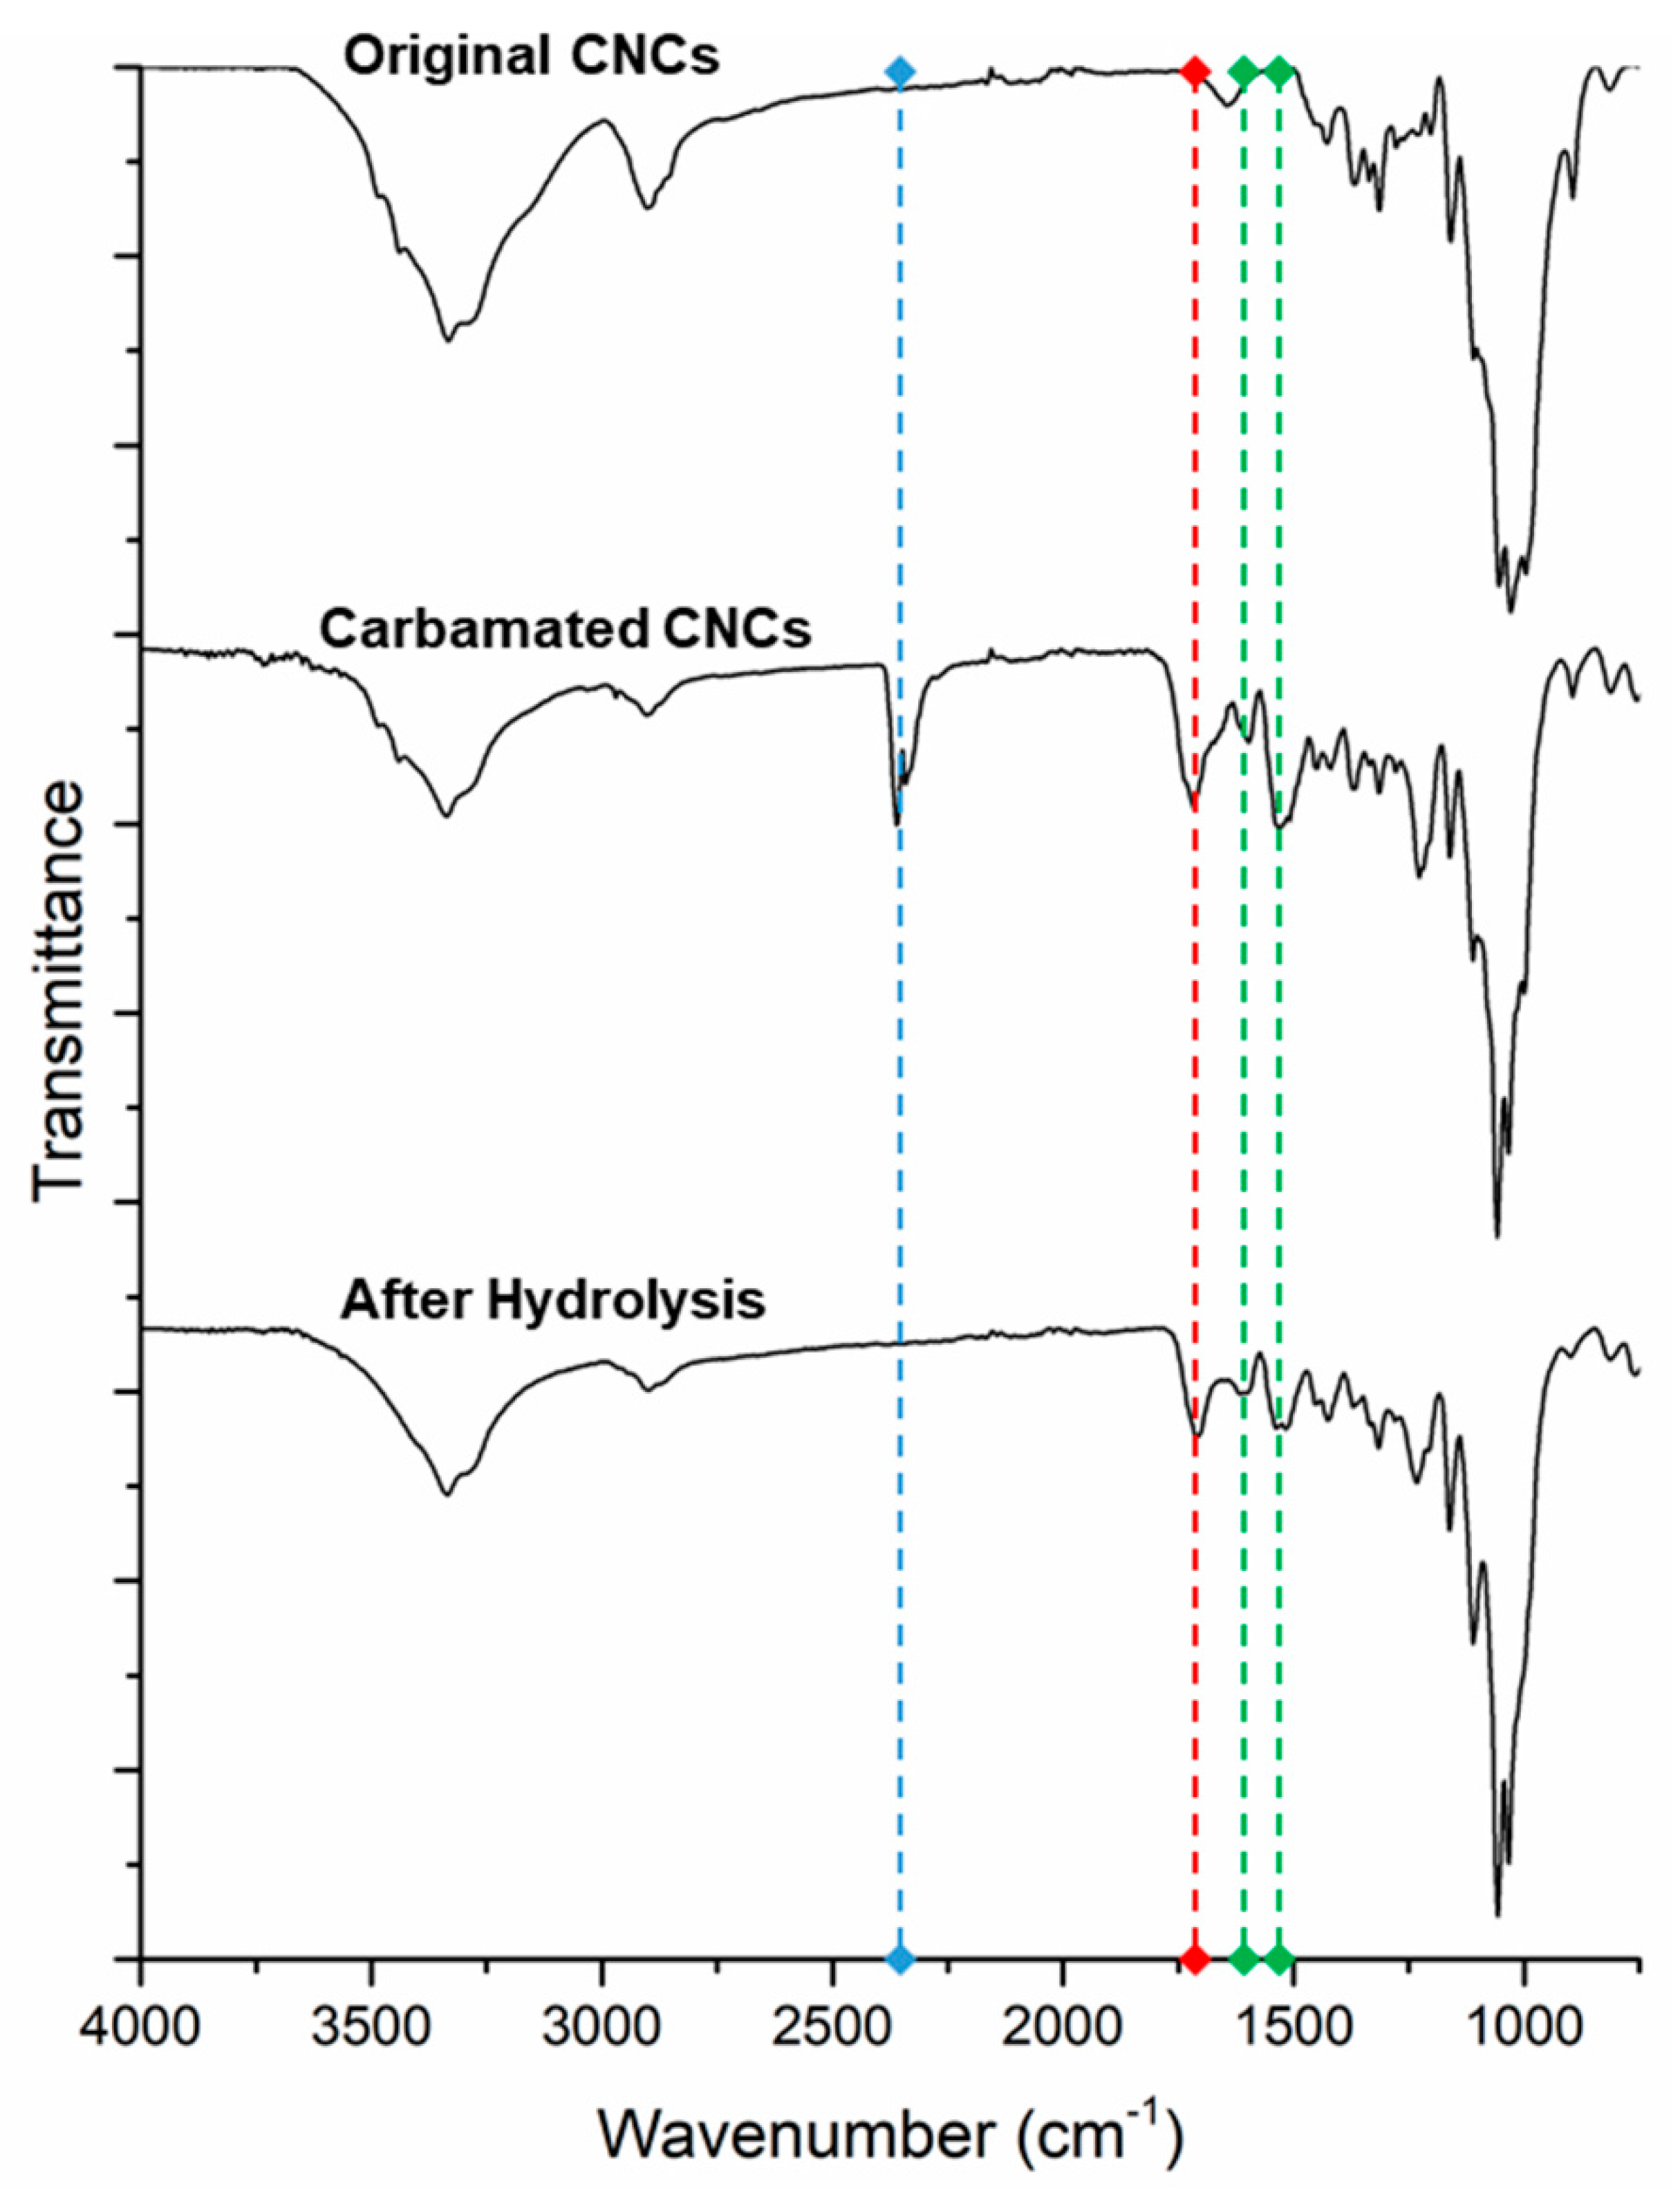
2.7. Characterization of the Carbamated and Hydrolyzed CNCs using FT-IR

Vacuum-dried samples of the CNCs, before and after carbamation and after hydrolysis, were characterized using Tensor 27 FT-IR spectrometer (Bruker, Billerica, Massachusetts, USA) in the 750–4000 cm−1 range (resolution of 2 cm−1) using the ATR transmission mode. The spectra were obtained as the average of 64 scans and processed using OPUS 6.5 software.

2.8. Determination of CNC Thickness using Atomic Force Microscopy

A drop of a diluted suspension (10−4 %) of the original CNCs in water, prior to solvent exchange, was deposited on a fresh mica surface and kept to air-dry overnight. The surface was imaged in the tapping mode using the atomic force microscope Agilent 5500 (Keysight Technologies, Santa Rosa, California, USA). The silicon tips PPP-NCH (Nanoandmore, Wetzler, Germany) were used which had a resonance frequency of ca. 350 kHz and a spring constant of ca. 50 N.m−1. The CNC thickness was determined using Gwyddion software (version 2.26) using a sample size of 100 particles.

3. Results and Discussion

3.1. Method Development

3.1.1. Optimization of the Hydrolysis Medium

Three reactions take place during the hydrolysis of isocyanates: (1) the reaction of isocyanate with water to form carbamic acid; (2) spontaneous decomposition of carbamic acid into amine; and (3) a side-reaction of the generated amine with not-yet hydrolyzed isocyanates forming a polyurea (Figure 2). The third reaction can be fully blocked if the generated amines get instantly protonated, which can be successfully achieved by performing the hydrolysis in acidic medium [24]:
In order to develop a simple pH-based method for determining the amount of free isocyanates (o-NCO) on the surface of CNCs upon carbamation using 2,4-TDI, a complete hydrolysis of the free isocyanates should be achieved without any side reactions. I propose in this work the use of HCl-acidified DMSO as an efficient hydrolysis medium, as I believe that (1) the water from the HCl solution will hydrolyze the isocyanates into amines; (2) HCl can then keep the generated amines protonated preventing them from reacting with not-yet hydrolyzed isocyanates; and (3) DMSO prevents the aggregation of the carbamated CNCs and accelerates the hydrolysis [25]. It is worth mentioning here that HCl-acidified DMSO has been used before but for different purposes [26,27].
DMSO can be easily acidified using any concentration or volume of HCl. However, it is important to use a minimum volume of HCl solution as the carbamated CNCs, unlike neat CNCs, are not water-dispersible. Based on few trials, 2 mL of any HCl concentration were found enough to acidify 100 mL of DMSO. The impact of HCl concentration on the acidity of the resulting DMSO was then investigated (Figure 3). The pH was found to significantly decrease by the addition of 2 mL of low concentrations of HCl (0.1 M–2 M) but almost reach a plateau using concentrations higher than 2 M. As a sensitive method should show a significant pH change in response to a minimal amount of analyte (isocyanate groups here), HCl concentrations higher than 2 M were rejected. At the same time, it is important to have a high proton concentration to protonate a maximum amount of the generated amines upon isocyanate hydrolysis to allow the determination of relatively high amounts of free isocyanates. Therefore, HCl concentration of 2 M seemed to be optimum. 2 mL of 2M HCl (4 mmol) can acidify DMSO to a pH of 2.47 ± 0.01. It is important to mention here that the activity of H+ in this system is low (activity coefficient of ca. 0.07) as DMSO represents the major component of this hydrolysis medium. That is the reason why the mmoles of H+ calculated from the measured pH are significantly less than the theoretical amount of 4 mmol (Figure 3).
Based on the crystallographic results of Nishiyama, CNCs with a thickness of 5 nm are made of ca. 100 cellulose chains (10 × 10), out of which only 36 are on the surface (36%) [28]. 32 of these 36 surface chains have half of their hydroxyl groups accessible on the surface while the other four chains, which are the corners of the crystal, have all their hydroxyl groups on the surface. So CNCs with a thickness of 5 nm have 20% of their hydroxyls on the surface (32%*50% + 4%*100% = 20%). To obtain a maximum DS of 20%, 1 g of CNCs (6.2 mmol) should react with 3.7 mmoles of TDI, which also means a maximum of 3.7 mmol of free isocyanates can exist on such CNC surface upon a complete surface carbamation. Therefore, 4 mmoles of HCl are enough to protonate all possible free isocyanate groups after being hydrolyzed.

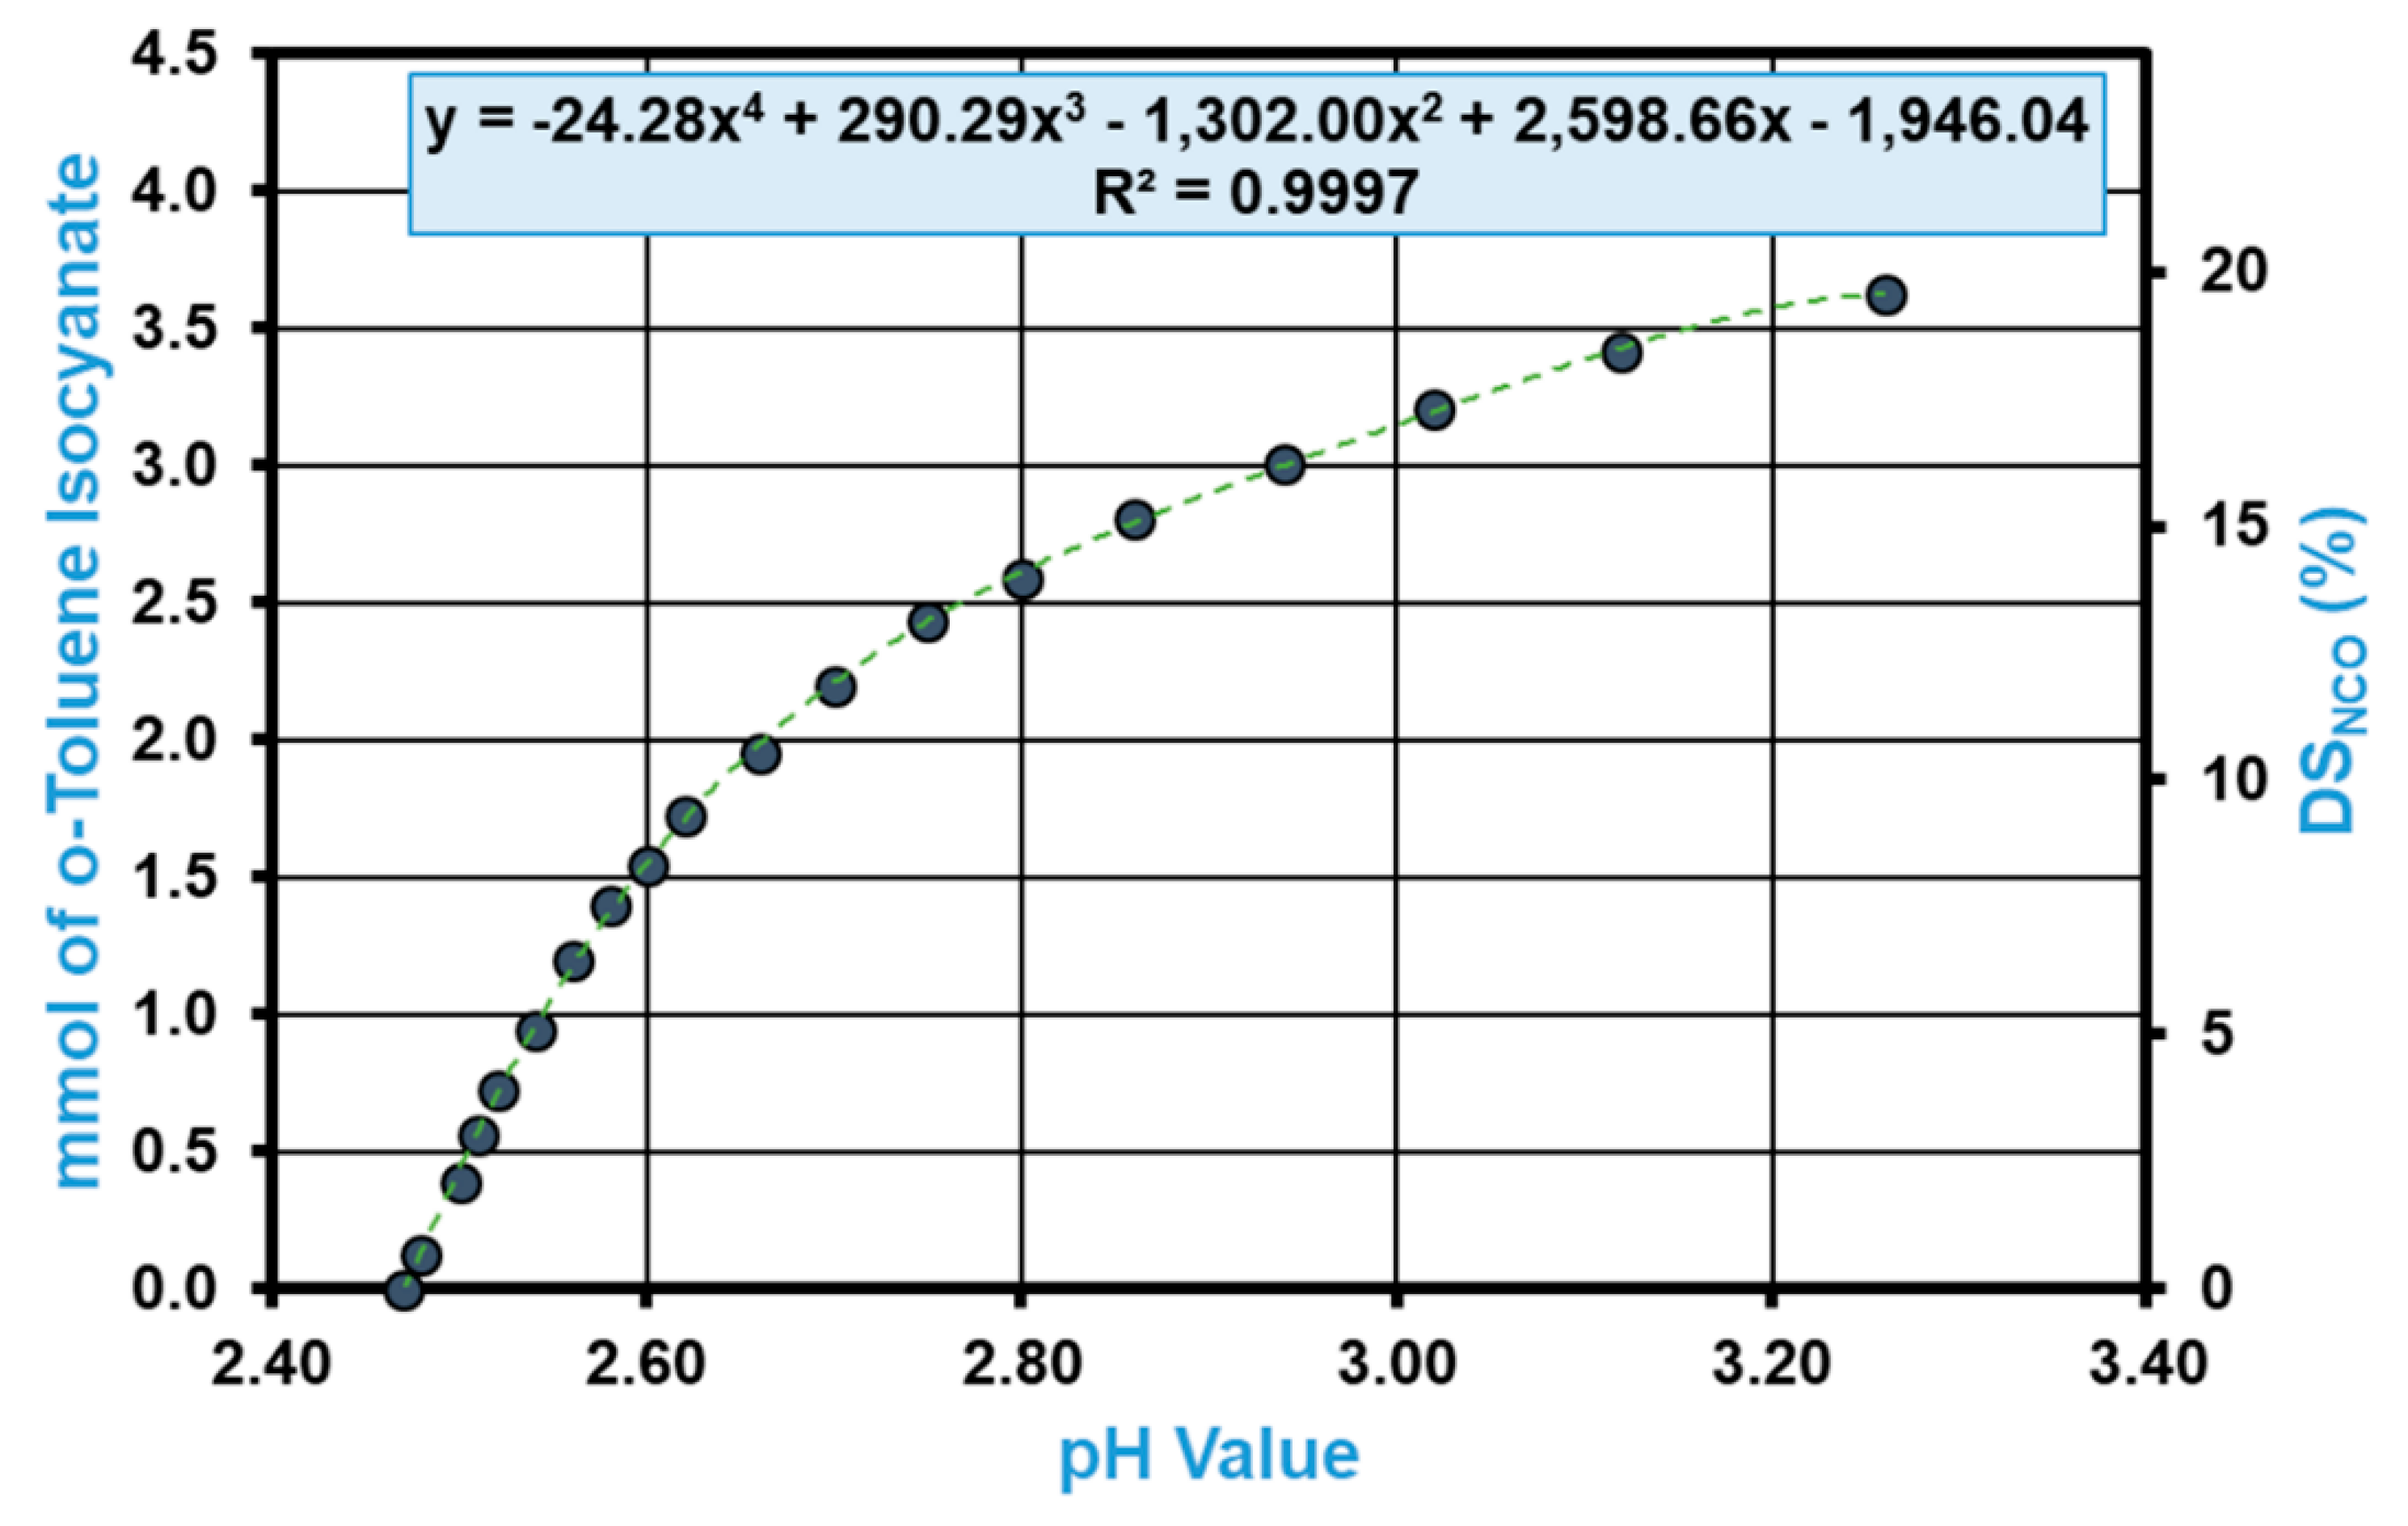
3.1.2. pH Profiles of TDI Model Compounds in the Proposed Hydrolysis Medium

Before studying the hydrolysis of isocyanates and carbamated CNCs in the acidified DMSO, it is important to have an idea about the pH profile of the corresponding aromatic amine in this medium. Upon TDI-carbamation of CNCs and hydrolysis of o-NCO, the surface of a CNC can be visualized as o-aminotoluene (or o-toluidine) molecules. Therefore, the pH of the acidified DMSO was studied upon the addition of o-toluidine (Figure 4). The results showed a typical acid/base titration-like behavior starting with neutralizing the existing protons of HCl until an equivalent point is reached (upon the addition of ca. 425 mg o-Toluidine (or 4.0 mmol)) followed by a gradual increase in pH by further addition of o-toluidine. The amount of o-toluidine (4.0 mmol) needed to reach the equivalent point is in agreement with the amount of HCl in DMSO (2 mL of 2 M HCl = 4 mmol), i.e., each toluidine molecule was protonated.
For this method to succeed in determining the amount of isocyanates on the surface of CNCs upon carbamation, the acidified DMSO should efficiently hydrolyze the isocyanate groups (o-NCO) to amines in order to quantify them. Otherwise, this method would not be useful at all. After carbamation, the surface of CNCs can be visualized as o-toluene isocyanate molecules. Upon hydrolysis, o-toluene isocyanate becomes o-toluidine and both should, therefore, show similar pH profiles (Figure 5). Until the equivalent point, o-toluene isocyanate had a similar pH profile to that for o-toluidine, i.e., both profiles showed similar pH values at equivalent molar amounts (a maximum standard deviation of 0.01). This confirms that acidified DMSO can efficiently hydrolyze isocyanates to amines. After the equivalent point, the pH profile of o-toluene isocyanate showed lower pH values, which is expected, as the generated amine groups at that stage tend to react with not-yet hydrolyzed isocyanate groups as they don’t get instantly protonated due to the absence of protons. This was evident by the appearance of white polyurea particles in the hydrolysis medium. In conclusion, it is possible using this procedure to quantify a maximum of ca. 4.0 mmol of aromatic isocyanates placed on the surface of CNCs (or a DSNCO of ca. 20% as mentioned earlier).
It is clear that acidified DMSO can efficiently hydrolyze aromatic isocyanates and that the pH upon hydrolysis is directly linked to their amount: the higher the pH value after hydrolysis, the higher the amount of isocyanates got hydrolyzed. The relationship until the equivalent point was best fit as a polynomial function of power 4 (Figure 6). Using this equation, it should be possible to quantify the amount of free isocyanates on CNC surface upon carbamation. Finally, it is of a great importance to check if cellulose, itself without free isocyanates, could have an effect on the pH of the acidified DMSO. For that purpose, CNCs were carbamated using p-toluene isocyanate (TDI with no o-NCO) so the resultant CNCs have no free isocyanates at all (blank sample). When added to the acidified DMSO, no change in pH was detected. This confirms that only free isocyanate groups, when they exist, would have an effect on the pH of the acidified DMSO.

3.2. Quantification of the Free Isocyanates of TDI-Carbamated CNCs (DSNCO)

Now that the method is developed, it is time to apply it on carbamated CNC samples. CNCs of a thickness of 7.0 nm (determined using AFM) were carbamated at 35, 55, and 75 °C following the method of Habibi in order to have an initial idea about the effect of temperature on p-NCO/o-NCO reactivity [15]. Upon carbamation, the CNCs were collected, transferred to the hydrolysis medium, and the final pH was determined.
The carbamation of CNCs and the later hydrolysis of the free isocyanates can be confirmed using FT-IR (Figure 7) by monitoring the appearance and disappearance of NCO asymmetric vibration bands around 2320 and 2370 cm−1, the urethane carbonyl stretching vibration band at 1720 cm−1, and the bands of aromatic ring at 1520 and 1620 cm−1 [29]. The original CNCs showed the typical glycosidic vibration bands ca 1100 cm−1, the C-H stretching band at 2880 cm−1, and the O-H stretching band at 3350 cm−1. After carbamation, the vibration bands of isocyanate, urethane carbonyl, and aromatic ring can be seen as the 2,4-TDI molecules reacted with the CNCs. After hydrolysis, the NCO vibration bands at 2320 and 2370 cm−1 expectedly disappeared as the NCO groups were hydrolyzed to amines. It was, however, not possible to monitor the N-H stretching vibration band of the generated amine groups at 3350 cm−1 as it overlaps with the O-H stretching band of the CNCs.
When a molecule of TDI reacts through its para-NCO with a hydroxyl group on the CNC surface, it is often assumed that o-NCO will stay free and will not be involved in any side reactions. This assumption is based on the reported 5–10 times difference in p-NCO/o-NCO reactivity, which is attributed to the steric hindrance imposed by the methyl group of TDI on the o-NCO [12,13]. However, in reality, this assumption is inaccurate as a significant amount of o-NCO still reacts minimizing the efficiency of the TDI-carbamation of CNCs and reducing the amount of desired molecules that can be grafted on the CNC surface at a later stage. This hypothesis can be confirmed by measuring the amount of free isocyanate groups available on the CNC surface after TDI-based carbamation (DSNCO) and comparing it to the actual amount of TDI reacted with CNCs (DSTDI). The degree of substitution of isocyanates (DSNCO) was calculated using the final pH value upon hydrolysis:
D S N C O = m m o l   N C O m m o l   C N C   H y d r o x y l s = 24.3 p H 4 + 290.3 p H 3 1302.0 p H 2 + 2598.7 p H 1946.0 3 ( m a s s   C N C s / 162 )   100 %
On the other hand, the degree of substitution of TDI (DSTDI) can be determined using EDX as a function of the increase in nitrogen/carbon molar ratio (N/C) (Please see the Supplementary Materials for more details about the estimation of DSTDI using EDX, elemental analysis, and the mass yield of the carbamation reaction).
The results showed that DSNCO is always lower than DSTDI, which confirms that the o-NCO groups of TDI are not unreactive during CNC carbamation (Table 1) and can still react with neighboring hydroxyl groups or undergo some side reactions [30]. This may explain the inability of some reports to graft certain functional polymers on a CNC surface in amounts equivalent to the amount of TDI placed earlier on that surface as not all of those TDIs had free isocyanate groups [19]. This also confirms that elemental analysis is not an accurate method for estimating the amount of NCO groups on a carbamated CNC surface as a perfect p-NCO/o-NCO selectivity could be impossible to achieve. For instance, the CNCs carbamated here at 75 °C had a DSTDI of 14.2%, which is close to the maximum possible DS on the surface of these 7.0 nm-thick CNCs (14.3 % assuming the C3 hydroxyl groups are also reactive). However, DSNCO is significantly lower (4.9%), which means that only one third (4.9%/14.2%) of o-NCO stayed unreacted after carbamation. The results also showed that a lower temperature of 55 °C leads to a higher amount of free isocyanates than the traditionally used 75 °C (Table 1) although 75 °C led to a higher amount of TDI reacting with the CNCs. A better selectivity can be achieved by further lowering the temperature to 35 °C. It is reported that the activation energy of the reaction of o-NCO with a hydroxyl group is significantly higher than that of p-NCO. The difference, however, can vanish by increasing the reaction temperature making both isocyanates react at comparable rates [22]. Therefore, a higher p-NCO/o-NCO selectivity can be achieved using low carbamation temperatures. These interesting outcomes triggered us to explore in a future publication the nature of TDI-carbamation of CNCs and optimize it towards the highest DSNCO/DSTDI.

4. Conclusions

A simple and accurate method was developed for the determination of the free isocyanates which are available on the surface of CNCs upon carbamation with 2,4-toluene diisocyanate. It relies on the increase in pH upon the hydrolysis of the free isocyanates to amine groups using HCl-acidified DMSO as a hydrolysis medium. Acidified DMSO was shown to be efficient to hydrolyze isocyanates to amine groups in a short time. The method showed that elemental analysis significantly overestimates the amount of free isocyanates on the surface of CNCs upon TDI-based carbamation, as it relies on the invalid assumption that only one of the two isocyanates of TDI is reactive during CNC carbamation. This method also showed that the carbamation temperature has a negative impact on the amount of free isocyanates and recommends, therefore, the use of a lower temperature (55 ⁰C for example) to increase the efficiency of such carbamation reaction.

Supplementary Materials

The following are available online at https://www.mdpi.com/2571-9637/2/2/32/s1, Figure S1: The estimation of DSTDI of carbamated CNCs using the N/C molar ratio obtained from EDX, Figure S2: An example of an EDX measurement of a carbamated CNC sample, Table S1: The estimation of DSTDI using EDX results based on N/C, N/O, and C/O Ratios, Table S2: The estimation of DSTDI using EDX, Elemental Analysis, and Mass Yield.

Funding

The author would like to thank the Fraunhofer Institute for Wood Research (WKI) for funding this research work through the Wilhelm-Klauditz Fellowship.

Acknowledgments

Many thanks to Kirsten Schiffmann and Nadine Nöcker from the Fraunhofer Institute for Surface Engineering and Thin Films (IST) for the EDX measurements, and to Janin Schloesser from the Technical University of Braunschweig for the elemental analysis measurements.

Conflicts of Interest

The author declares no conflict of interest.

References

  1. Badanova, A.K.; Taussarova, B.R.; Kutzhanova, A.Z. Hydrophobic finishing of cellulosic textile material. World Appl. Sci. J. 2014, 30, 1409–1416. [Google Scholar]
  2. Gwon, J.-G.; Cho, H.-J.; Chun, S.-J.; Lee, S.; Wu, Q.; Lee, S.-Y. Physiochemical, optical and mechanical properties of poly (lactic acid) nanocomposites filled with toluene diisocyanate grafted cellulose nanocrystals. RSC Adv. 2016, 6, 9438–9445. [Google Scholar] [CrossRef]
  3. Chen, L.F.; Tsao, G.T. Chemical procedures for enzyme immobilization on porous cellulose beads. Biotechnol. Bioeng. 1977, 19, 1463–1473. [Google Scholar] [CrossRef] [PubMed]
  4. Eyley, S.; Thielemans, W. Surface modification of cellulose nanocrystals. Nanoscale 2014, 6, 7764–7779. [Google Scholar] [CrossRef] [PubMed] [Green Version]
  5. Pang, L.; Gao, Z.; Zhang, S.; Li, Y.; Hu, S.; Ren, X. Preparation and anti-UV property of modified cellulose membranes for biopesticides controlled release. Ind. Crops Prod. 2016, 89, 176–181. [Google Scholar] [CrossRef]
  6. Gök, Ö.; Alkan, C.; Konuklu, Y. Developing a poly (ethylene glycol)/cellulose phase change reactive composite for cooling application. Sol. Energy Mater. Sol. Cells 2019, 191, 345–349. [Google Scholar] [CrossRef]
  7. Anghel, N.; Marius, N.; Spiridon, I. Heavy metal adsorption ability of a new composite material based on starch strengthened with chemically modified cellulose. Polym. Adv. Technol. 2019, 30, 1453–1460. [Google Scholar] [CrossRef]
  8. Bagheriasl, D.; Carreau, P.J.; Riedl, B.; Dubois, C. Enhanced properties of polylactide by incorporating cellulose nanocrystals. Polym. Compos. 2018, 39, 2685–2694. [Google Scholar] [CrossRef]
  9. Zoppe, J.O.; Peresin, M.S.; Habibi, Y.; Venditti, R.A.; Rojas, O.J. Reinforcing poly (ε-caprolactone) nanofibers with cellulose nanocrystals. ACS Appl. Mater. Interfaces 2009, 1, 1996–2004. [Google Scholar] [CrossRef] [PubMed]
  10. Dufresne, A.; Belgacem, M.N. Cellulose-reinforced composites: From micro-to nanoscale. Polímeros 2013, 23, 277–286. [Google Scholar] [CrossRef]
  11. Dounis, D.V.; Wilkes, G.L. Structure-property relationships of flexible polyurethane foams. Polymer 1997, 38, 2819–2828. [Google Scholar] [CrossRef]
  12. Belgacem, M.N.; Quillerou, J.; Gandini, A. Urethanes and polyurethanes bearing furan moieties—3. Synthesis, characterization and comparative kinetics of the formation of diurethanes. Eur. Polym. J. 1993, 29, 1217–1224. [Google Scholar] [CrossRef]
  13. Semsarzadeh, M.; Navarchian, A. Kinetic Study of the Bulk Reaction Between TDI and PPG in Prescence of DBTDL and FEAA Catalysts Using Quantitative FTIR Spectroscopy. J. Polym. Eng. 2003, 23, 225–240. [Google Scholar] [CrossRef]
  14. Gemeiner, P.; Augustin, J.; Drobnica, L. Reactions of cellulose isothiocyanates with thiol and amino compounds. Carbohydr. Res. 1977, 53, 217–222. [Google Scholar] [CrossRef]
  15. Habibi, Y.; Dufresne, A. Highly filled bionanocomposites from functionalized polysaccharide nanocrystals. Biomacromolecules 2008, 9, 1974–1980. [Google Scholar] [CrossRef] [PubMed]
  16. Thielemans, W.; Belgacem, M.N.; Dufresne, A. Starch nanocrystals with large chain surface modifications. Langmuir 2006, 22, 4804–4810. [Google Scholar] [CrossRef] [PubMed]
  17. Labet, M.; Thielemans, W.; Dufresne, A. Polymer grafting onto starch nanocrystals. Biomacromolecules 2007, 8, 2916–2927. [Google Scholar] [CrossRef] [PubMed]
  18. Shang, W.; Huang, J.; Luo, H.; Chang, P.R.; Feng, J.; Xie, G. Hydrophobic modification of cellulose nanocrystal via covalently grafting of castor oil. Cellulose 2013, 20, 179–190. [Google Scholar] [CrossRef]
  19. Morandi, G.; Thielemans, W. Synthesis of cellulose nanocrystals bearing photocleavable grafts by ATRP. Polym. Chem. 2012, 3, 1402–1407. [Google Scholar] [CrossRef]
  20. Yu, H.-Y.; Qin, Z.-Y. Surface grafting of cellulose nanocrystals with poly (3-hydroxybutyrate-co-3-hydroxyvalerate). Carbohydr. Polym. 2014, 101, 471–478. [Google Scholar] [CrossRef] [PubMed]
  21. Mano, V.; Chimenti, S.; Ruggeri, G.; Pereira, F.V.; de Paula, E.L. P (CL-b-LLA) diblock copolymers grafting onto cellulosic nanocrystals. Polym. Bull. 2017, 74, 3673–3688. [Google Scholar] [CrossRef]
  22. Aranguren, M.I.; Williams, R.J. Kinetic and statistical aspects of the formation of polyurethanes from toluene diisocyanate. Polymer 1986, 27, 425–430. [Google Scholar] [CrossRef]
  23. Gilbert, D. Fate of TDI and MDI in air, soil, and water. J. Cell. Plast. 1988, 24, 178–192. [Google Scholar] [CrossRef]
  24. Castro, E.A.; Moodie, R.B.; Sansom, P.J. The kinetics of hydrolysis of methyl and phenyl lsocyanates. J. Chem. Soc. Perkin Trans. 2 1985, 5, 737–742. [Google Scholar] [CrossRef]
  25. Brown, W.E.; Green, A.H.; Cedel, T.E.; Cairns, J. Biochemistry of protein-isocyanate interactions: A comparison of the effects of aryl vs. alkyl isocyanates. Environ. Health Perspect. 1987, 72, 5. [Google Scholar] [CrossRef]
  26. Li, Z.; Xu, X.; Peng, Y.; Jiang, Z.; Ding, C.; Qian, X. An Unusual Synthesis of Tröger’s Bases Using DMSO/HCl as Formaldehyde Equivalent. Synthesis 2005, 2005, 1228–1230. [Google Scholar] [CrossRef]
  27. Tanaka, S.-Y.; Yasuda, M.; Baba, A. Practical and simple synthesis of substituted quinolines by an HCl−DMSO system on a large scale: Remarkable effect of the chloride ion. J. Organ. Chem. 2006, 71, 800–803. [Google Scholar] [CrossRef] [PubMed]
  28. Nishiyama, Y.; Langan, P.; Chanzy, H. Crystal structure and hydrogen-bonding system in cellulose Iβ from synchrotron X-ray and neutron fiber diffraction. J. Am. Chem. Soc. 2002, 124, 9074–9082. [Google Scholar] [CrossRef] [PubMed]
  29. He, Y.; Zhang, X.; Zhang, X.; Huang, H.; Chang, J.; Chen, H. Structural investigations of toluene diisocyanate (TDI) and trimethylolpropane (TMP)-based polyurethane prepolymer. J. Ind. Eng. Chem. 2012, 18, 1620–1627. [Google Scholar] [CrossRef]
  30. Špírková, M.; Kubin, M.; Dušek, K. Side reactions in the formation of polyurethanes: Model reactions between phenylisocyanate and 1-butanol. J. Macromol. Sci. Chem. 1987, 24, 1151–1166. [Google Scholar] [CrossRef]
Figure 1. The functionalization of cellulose with a desired chemical using 2,4-TDI as a linker.
Surfaces 02 00032 g001
Figure 2. The mechanism of isocyanate hydrolysis and the possible formation of polyurea.
Surfaces 02 00032 g002
Figure 3. The pH of 100 mL of DMSO upon the addition of 2 mL of HCl of varying concentrations. The standard deviation of the pH values was not more than 0.01. The mmol of H+ is calculated from the pH value ([H+] = 10−pH, mmol H+ = [H+] * Volume (100 mL)).
Surfaces 02 00032 g003
Figure 4. The pH of acidified DMSO (blue circles) upon the addition of o-toluidine. [H+] (green squares) was calculated from the pH value ([H+] = 10−pH).
Surfaces 02 00032 g004
Figure 5. The pH profile of acidified DMSO upon the addition of o-toluidine (blue circles) or o-toluene isocyanate (green squares).
Surfaces 02 00032 g005
Figure 6. Best-Fit for the relationship between pH value after hydrolysis and the molar amount of isocyanates. DSNCO represents the moles of NCO groups divided by the moles of hydroxyl groups in a 1.0 g of CNCs (*100%).
Surfaces 02 00032 g006
Figure 7. FT-IR spectra of the CNCs before and after carbamation using 2,4-TDI and after hydrolysis using acidified DMSO.
Surfaces 02 00032 g007
Table 1. The effect of carbamation temperature on the amount of free isocyanates on the CNC surface.
T (°C)Final pHmmol NCODSNCO (%)N/C RatioDSTDI (%)DSNCO/DSTDI (%)
352.51 ± 0.000.59 ± 0.003.2 ± 0.00.045 ± 0.0014.5 ± 0.172 ± 1.6
552.55 ± 0.011.07 ± 0.115.8 ± 0.60.077 ± 0.0019.6 ± 0.261 ± 6.4
752.54 ± 0.000.91 ± 0.064.9 ± 0.30.096 ± 0.00114.2 ± 0.334 ± 2.2

