Article

Mould Growth Risk for Internal Retrofit Insulation of Heritage-Protected Timber Plank Frame Walls

by
Martha Eilertsen Harberg
1,
Silje Kathrin Asphaug
2 and
Tore Kvande
1,*
1
Department of Civil and Environmental Engineering, Norwegian University of Science and Technology (NTNU), 7034 Trondheim, Norway
2
SINTEF Community, 7465 Trondheim, Norway
*
Author to whom correspondence should be addressed.
Heritage 2025, 8(7), 278; https://doi.org/10.3390/heritage8070278
Submission received: 4 June 2025 / Revised: 4 July 2025 / Accepted: 7 July 2025 / Published: 14 July 2025

Abstract

A wave of energy efficiency-focused activity has spread across Europe in recent years, with ambitious goals for improving the energy performance of existing buildings through various directives. Among these existing buildings, there are older structures with heritage-protected facades. Some of the protected facades consist of timber plank frame walls, which were common in Norway in the 19th and early 20th centuries. Internal insulation is an option for increasing the energy efficiency of such walls while preserving their protected facades. However, this approach alters the moisture performance of the wall and introduces a potential risk for mould growth, which must be assessed. To better understand the performance of these walls, the s d values of traditional types of building paper have been tested, as timber plank frame walls comprise vertical planks covered in building paper. In addition, the risk of mould growth in timber plank frame walls has been evaluated using the one-dimensional simulation tool WUFI® Pro by modelling the wall with internal retrofitting and varying input parameters. The types of building paper used have a wide range of vapour resistance values (diffusion-equivalent air layer thicknesses, s d values), which range from 0.008 m to 5.293 m. Adding 50 mm of interior insulation generally resulted in a low risk of mould growth, except in cases involving the use of a moisture-adaptive vapour barrier (MAVB). The MAVB did not result in an acceptable mould growth risk in any of the tested scenarios.

1. Introduction

1.1. Climate Goals and Energy Consumption

The European Union (EU) aims to achieve climate neutrality by 2050 [1]. To reach this goal, specific targets have been set for various sectors, including the building sector [2]. As buildings are among the largest energy consumers, improving their energy efficiency offers substantial benefits [3]. Both international and national initiatives are in place to drive energy reduction. The Energy Performance of Buildings Directive (EPBD) and the Energy Efficiency Directive (EED) form part of the EU’s legislative framework, while the Renovation Wave for Europe strategy aims to renovate 35 million buildings in the EEA by 2030, including in Norway [2].
In Norway, new buildings must meet the minimum requirements of TEK17 [4]. Stricter energy efficiency standards mean that newly constructed buildings consume less energy than older ones. Residential buildings built before 1956 account for approximately 50% of total energy consumption in Norway’s housing sector [5]. This highlights the significant potential for improving the energy efficiency of older buildings. Older buildings are more vulnerable to changes that alter a building’s physical properties. Poorly executed alterations can compromise a building’s integrity, leading to costly and irreversible damage. Despite these challenges, upgrading older buildings remains essential for enhancing their usability and reducing their energy consumption [6]. Ensuring that these structures remain functional and attractive is crucial, as, otherwise, they risk being left vacant, which is neither economically nor environmentally sustainable. To account for these critical factors when modifying older buildings, a directive for EEA members states that there should be less stringent energy efficiency requirements for historical buildings [3].

1.2. Heritage Protection

Around 23% of all buildings in Europe were constructed before 1945, with many of them listed as heritage-protected buildings or holding cultural and historical value [7]. Different countries have different ways of classifying heritage-protected buildings. In Norway, each municipality is responsible for building management under the Planning and Building Act [8]. Municipalities can designate heritage protection through zoning plans and grant exemptions for modifications to protected buildings. Heritage-protected buildings are often categorised into different classes based on their heritage value. A common method, used in the municipality of Trondheim, classifies protected buildings into classes A, B, or C, where A has the highest protection status and C the lowest. In Trondheim, 3% of all cases fall under class A, 18% under class B, and 76% under class C [2]. For class C buildings, minor modifications are permitted as long as they do not significantly alter the architectural appearance [9]. Typically, the facade is the most protected element, meaning that changes must not be visible from the outside. Internal insulation is often a viable solution for improving these buildings’ energy efficiency. Old buildings can be vulnerable to extensive modifications, as such changes may affect the physical conditions such as moisture and temperature within the structure [6]. To assess the impacts of modifications, understanding a building’s composition and materials is crucial.

1.3. Historical Timber Plank Frame Buildings in Norway

Wood has a long tradition as a building material in Norway and other countries located in the far north [10,11], resulting in a large number of heritage-worthy timber buildings. Among these, buildings with timber plank frame walls represent a significant share in Norway, including heritage-listed buildings where the facade cannot be altered. Timber plank frame construction became common in Norway in the late 1800s and was in use until around 1950 [10]. Its construction consists of posts and sills, with inserted planks filling the frame. Before 1850, plank frame structures were built with coarse materials and larger vertical logs [12]. These comprised standing timber only, without multiple layers or cladding [13]. As these logs dried, the walls became increasingly draughty. Between 1850 and 1900, construction methods evolved into a more material-efficient design, replacing vertical logs with planks. Around 1870, building paper for windproofing became widespread, making plank frame construction more common [13]. This allowed for a windproof structure even as the planks shrank. The timber plank frame walls were built with building paper and panelling on both sides [12]. The exterior cladding was installed over an unventilated cavity, which was not an insulating air layer due to numerous leaks and convection [14]. From 1900 to 1950, a simpler plank frame method was used, where the planks became part of the load-bearing structure [12]. This meant that once the planks had dried, they could not be adjusted or sealed, often resulting in less windproof walls. Figure 1 shows a typical timber frame wall with vertical planks running between the bottom and top sill. The ends of the planks are placed into recesses cut into the plate and sill, ensuring that the surfaces of the planks, plate, and sill are level with each other. The U value for timber plank frame walls typically ranges from 0.7 to 1.2 W/(m2K) [13,15,16]. Several Norwegian buildings constructed according to Figure 1 have distinctive exterior cladding or are situated in a period-typical environment, placing them in heritage-protection class C.
According to Edvardsen [13], tar- or asphalt-impregnated sheathing paper and cellulose board was the exterior sheathing type most commonly used on timber plank framed walls (i.e., the layer of paper at the exterior side of the plank in Figure 1). For interior sheathing, newspaper, felt board, and unimpregnated cellulose board were used (i.e., the paper at the interior side of the plank in Figure 1). Table 1 shows common types of sheathing used in timber plank framed walls and the corresponding time periods and data for the materials.
The vapour resistance values of historical vapour and wind barriers were mapped by Bergheim et al. [17]. The overview was conducted through a literature review and interviews. No measurements were carried out. In 1954, however, Tveit [18] tested the water vapour diffusion rates of various building paper products and wood fibre products used in Norway during that period. He tested virgin materials from the 1950s, but only general product names were provided, with no images or additional explanations. This made it difficult for us to identify the exact types of products tested. In this study, older materials were examined, including those previously used in walls and aged building paper rolls. Over time, environmental exposure may have altered the properties of these materials. However, Tveit’s data remain valuable for comparison; while he applied basically the same testing methodology used today, modern test chambers likely minimise errors, making today’s measurements more reliable.

1.4. Internal Insulation and Moisture Damage

To improve energy efficiency in heritage buildings with protected facades, interior insulation is a possible measure [19]. However, modifying a building’s structure inevitably alters its properties, requiring careful planning to prevent construction defects. The standard NS-EN 16883:2017 provides guidance on improving the energy performance of historic buildings [20]. Moisture damage, accounting for an estimated 75% of all building-related issues [21], is a particular concern when retrofitting older structures. When adding interior insulation to walls, the water vapour permeability of the wall layers is crucial, especially in the outer section [19]. Due to limited knowledge of the permeability values of historic building papers, laboratory measurements are necessary to assess these properties. Understanding the full structure and material composition of the wall is crucial for assessing risks related to moisture. The cavity behind the exterior cladding and the rate of air exchange influence the wall’s drying potential, making it important to also gather data on these factors.
While the physical challenges of interior retrofit insulation for masonry walls have been widely explored in recent years (e.g., by [22,23,24,25,26,27,28,29,30,31,32,33,34,35]), the interior insulation of heritage timber walls has not been explored in as much detail. The works of Alec et al. [36] and Cho et al. [37] are among the few studies identified regarding the interior insulation of timber walls. These studies examined log walls and walls of cross-laminated timber (CLT) elements. According to Alev et al. [36], the moisture load and vapour barrier have the greatest impact on mould growth in timber walls, and internal insulation must be limited based on the original thermal resistance of the wall. Cho et al. [37] concluded that internally insulating CLT walls results in a higher water content and lower energy efficiency compared to external insulation, but they found that the mould growth risk was low for all tested cases.

1.5. Mould Growth Risk

To assess the moisture risk in walls, the potential for mould growth must be evaluated. Mould growth is considered a critical moisture-related issue, as it develops before condensation occurs [38]. Mould fungi are often the first indicator of increased humidity and moisture levels in buildings [39,40,41]. The process of mould growth is complex and influenced by multiple factors [42], including relative humidity, temperature, nutrient availability, and exposure time [42,43,44,45]. The local climate influences these factors, meaning that both the location and the construction design play significant roles in mould growth risk. As climate change leads to increasingly extreme weather conditions, it is crucial that buildings are resilient to future climates.
The standard NS-EN ISO 13788:2012 is followed by all CEB countries, including Norway [46]. According to this standard, the monthly mean relative humidity must not exceed 80% to prevent mould growth. In Norway, a critical temperature of 0 °C is also used as a threshold for mould growth [47]. There are considerable uncertainties regarding the critical values for mould growth, and different countries utilise different standards [42]. Due to the complexity of mould growth, relative humidity and temperature measures are highlighted as the most important and decisive parameters for assessing the risk of mould development.

1.6. Objective and Scope

This study will explore the hygrothermal challenges of retrofitting internal insulation on heritage-worthy timber plank frame walls. We hypothesise that the water permeability of the building paper used in the existing walls will influence the possibilities for internal insulation. To operationalise this general idea, the following research questions were outlined:
1.
What is the range of water vapour resistance for commonly used building papers in heritage-worthy buildings?
2.
What are the effects of the water vapour resistance of building paper on the moisture performance of internally insulated timber plank frame walls?
3.
What is the effect of moisture-adaptive vapour barriers on the possibilities for internal insulated timber plank frame walls?
To address the first of these questions, building papers from a number of old buildings from the late 19th century and the early to mid-20th century were collected. We determined the water vapour transmission properties of the building paper using the “wet cup method” set out in NS-EN ISO 12572:2016 [48]. To answer the second and third questions, WUFI® Pro [49] was used to calculate the theoretical drying capability of the wall.
The novelty of this study lies in determining the water vapour resistance of historical building papers used for timber walls and not on virgin papers. Earlier Norwegian studies of mould growth risk in retrofitted timber frame walls focused on external insulation using default values for the water vapour resistance of building papers [50]. Aiming to indicate the sensitivity for mould growth in internal retrofit insulated timber plank frame walls, this study brings new knowledge to decision makers for retrofitting such heritage-protected walls. It is beyond the scope of this study to provide a fully accurate assessment of the mould growth situation on the walls.

2. Materials and Methods

2.1. Laboratory Measurements

2.1.1. Selection of Products

Various older barrier layers made of building paper were collected for measurement. These samples were sourced from old timber walls undergoing renovation or old rolls of building paper from different locations in Norway. The research project HeriTACE [51] was responsible for collecting the samples. To obtain building paper samples, retrofit insulation companies in Trondheim were contacted. Additional outreach was achieved through popular science articles (e.g., [52]), and inquiries were sent to associations and museums that work with historic timber buildings. The collected samples were estimated to date from between 1880 and 1950, although several items had unknown dates of origin.
Various samples were tested, which align with what is assumed to have been commonly used in timber plank frame walls (see Table 1). Table 2 presents the types of building paper tested in the laboratory, categorised as either exterior or interior building paper according to where they were used in the construction. For more details, see Figure 1, where exterior paper is defined as paper used at the exterior side of the planks and interior paper is defined as paper used at the interior side. The paper samples were labelled with either an “E” for exterior building paper or an “I” for interior building paper, followed by an identification number, to easily distinguish the products. The accuracy of the samples’ descriptions could not be confirmed, as many items lacked descriptions of their intended use but were also used interchangeably. The current categorisation was, therefore, based on assumptions made to facilitate differentiation between the samples and their presumed placement, as well as information about their placement in the wall provided by those who supplied the different types of building paper.

2.1.2. Preparation of Samples

The delivered products varied in size and quality. This affected the number of test samples produced and their sizes. For the products that arrived in larger quantities, circular test samples with diameters of 0.174 m were punched out. For the products that arrived in smaller quantities, circular test samples with diameters of 0.090 m were punched out. As many test samples as possible were punched out for the different products. All test samples were stored at a temperature of 23 °C and an RH of 50 % until installation, which was carried out for conditioning. The storage period lasted, at minimum, for 24 h.
The thickness was measured for all samples by taking the average of multiple measurement points on the sample. Table 3 shows the measured thicknesses and their overall average values. Some test samples were difficult to measure due to uneven thickness, folded edges, and a grainy texture. For the newspaper samples (samples I3, I4, and I5) and sample I6, the thicknesses were even for all the samples. Table 3 also shows the grammage of the samples of building paper. Samples I1 and I2 were not measured and, therefore, have no values listed for grammage.
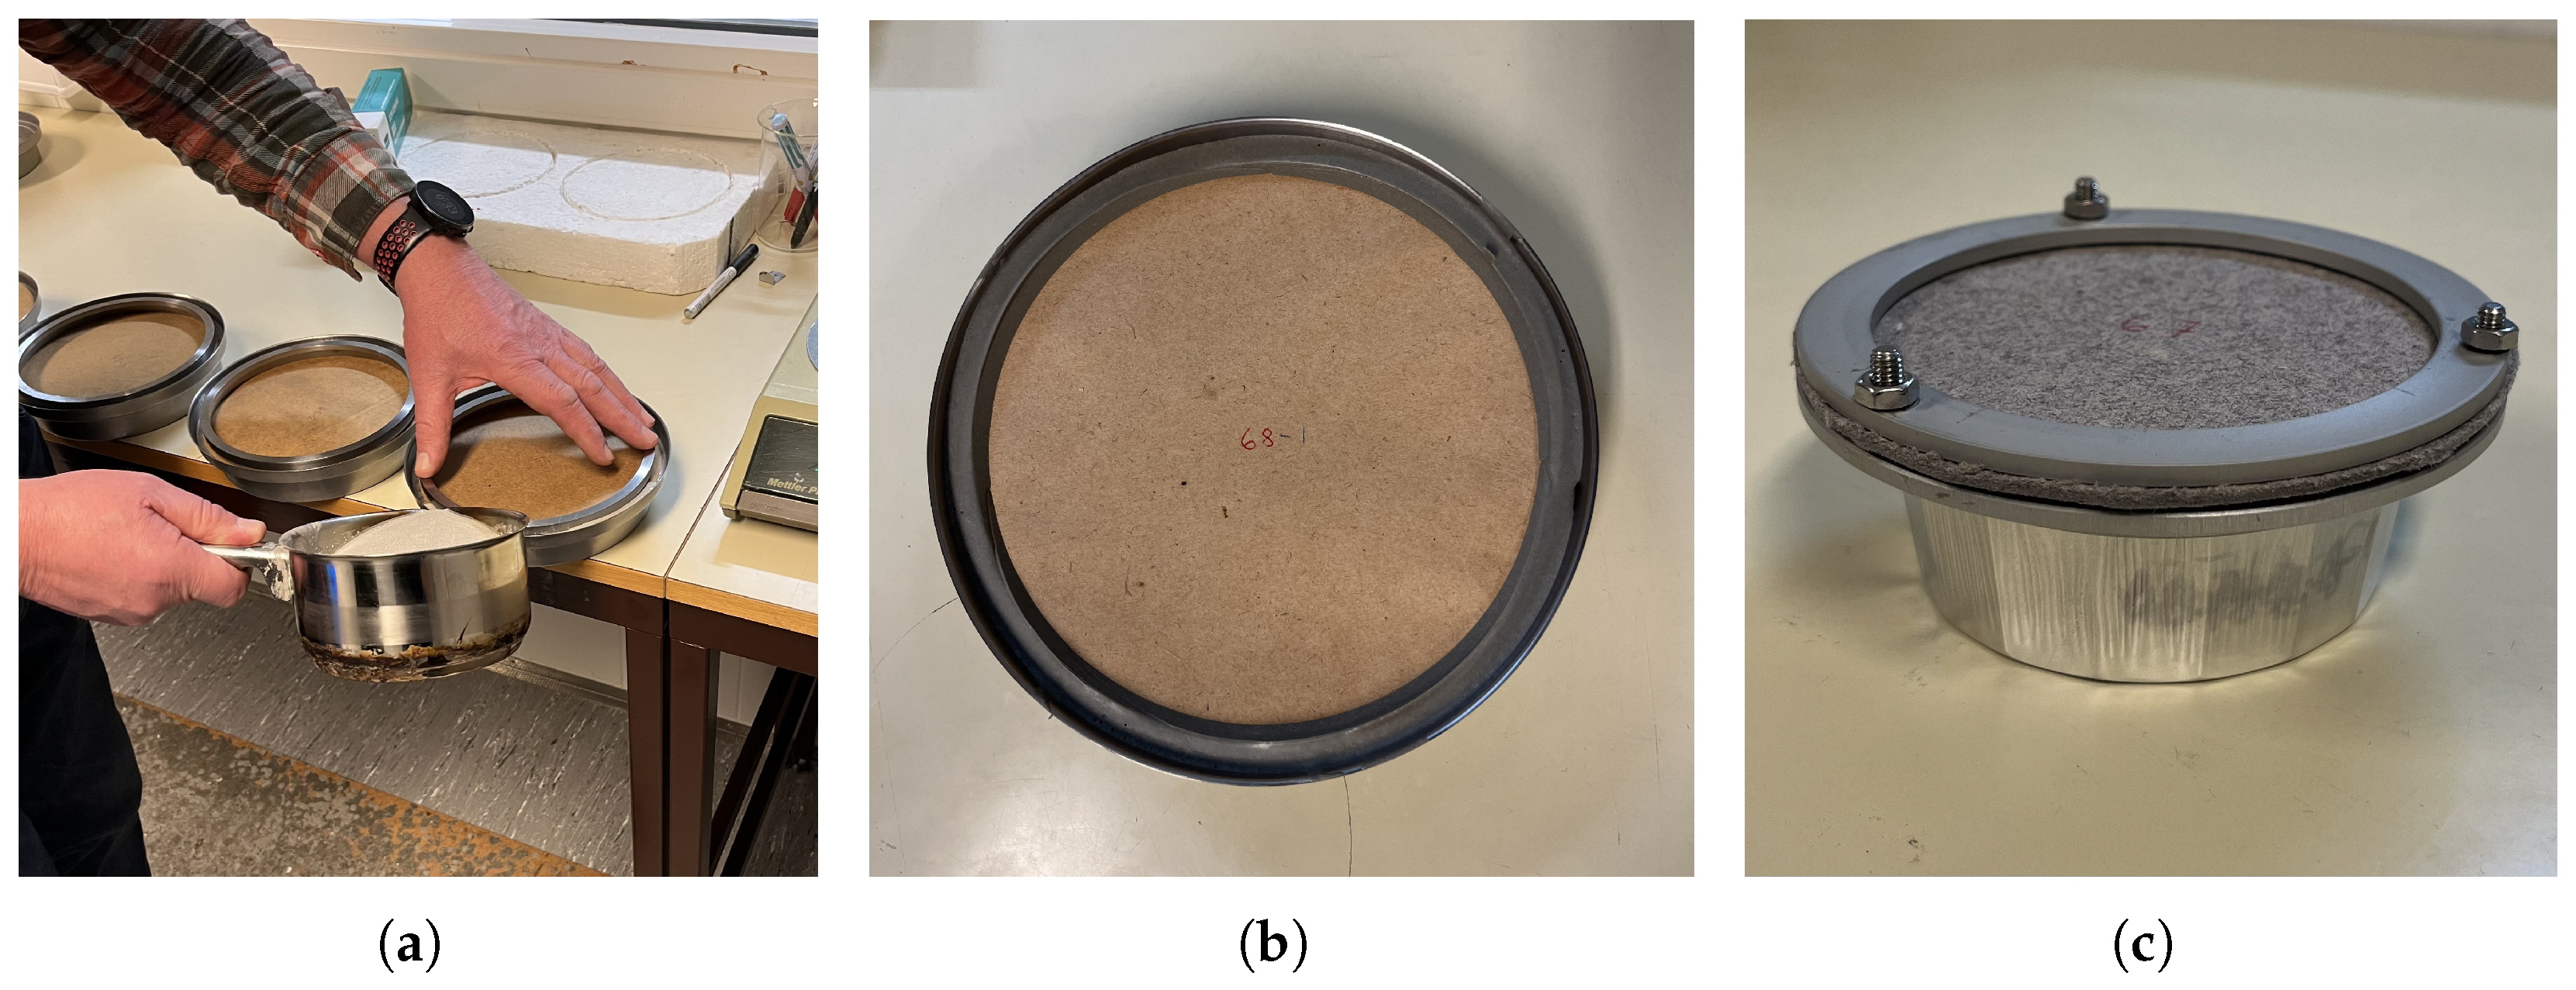
The test samples were tested using the cup method described in NS-EN ISO 12572:2016 [48]. The test cups were filled with a salt solution, with an air gap of 15 mm above the solution. The salt solution used for the test specimens was KNO3(VWR Chemicals, Chile), which provided a constant relative humidity (RH) of 94% [48]. The test samples with diameters of 0.174 m were then attached to the cups using a sealing compound, with the specimen test area diameter set to 0.164 m. The test samples with diameters of 0.090 m were attached to the cups using a gasket and a screwed-on metal ring, making the diameter of the specimen test area 0.075 m. Figure 2 shows the sealing compound on the test specimens.
Most of the test specimens were identical on both sides, so the installation orientation had no impact. For products with different surface finishes, the installation direction was documented (see Table 4).
Five specimens were prepared for products where sufficient material was available. According to NS-EN ISO 12572:2016 [48], a minimum of five specimens should be tested when the specimen area is less than 0.05 m2, which was the case for all the samples presented here. For products with less available material, three test specimens were prepared. Although a smaller number of test objects increases uncertainty in the results, the measured values are crucial for mapping old products that lack existing data. The number of test specimens for each product is shown in Table 3.

2.1.3. Test Procedure

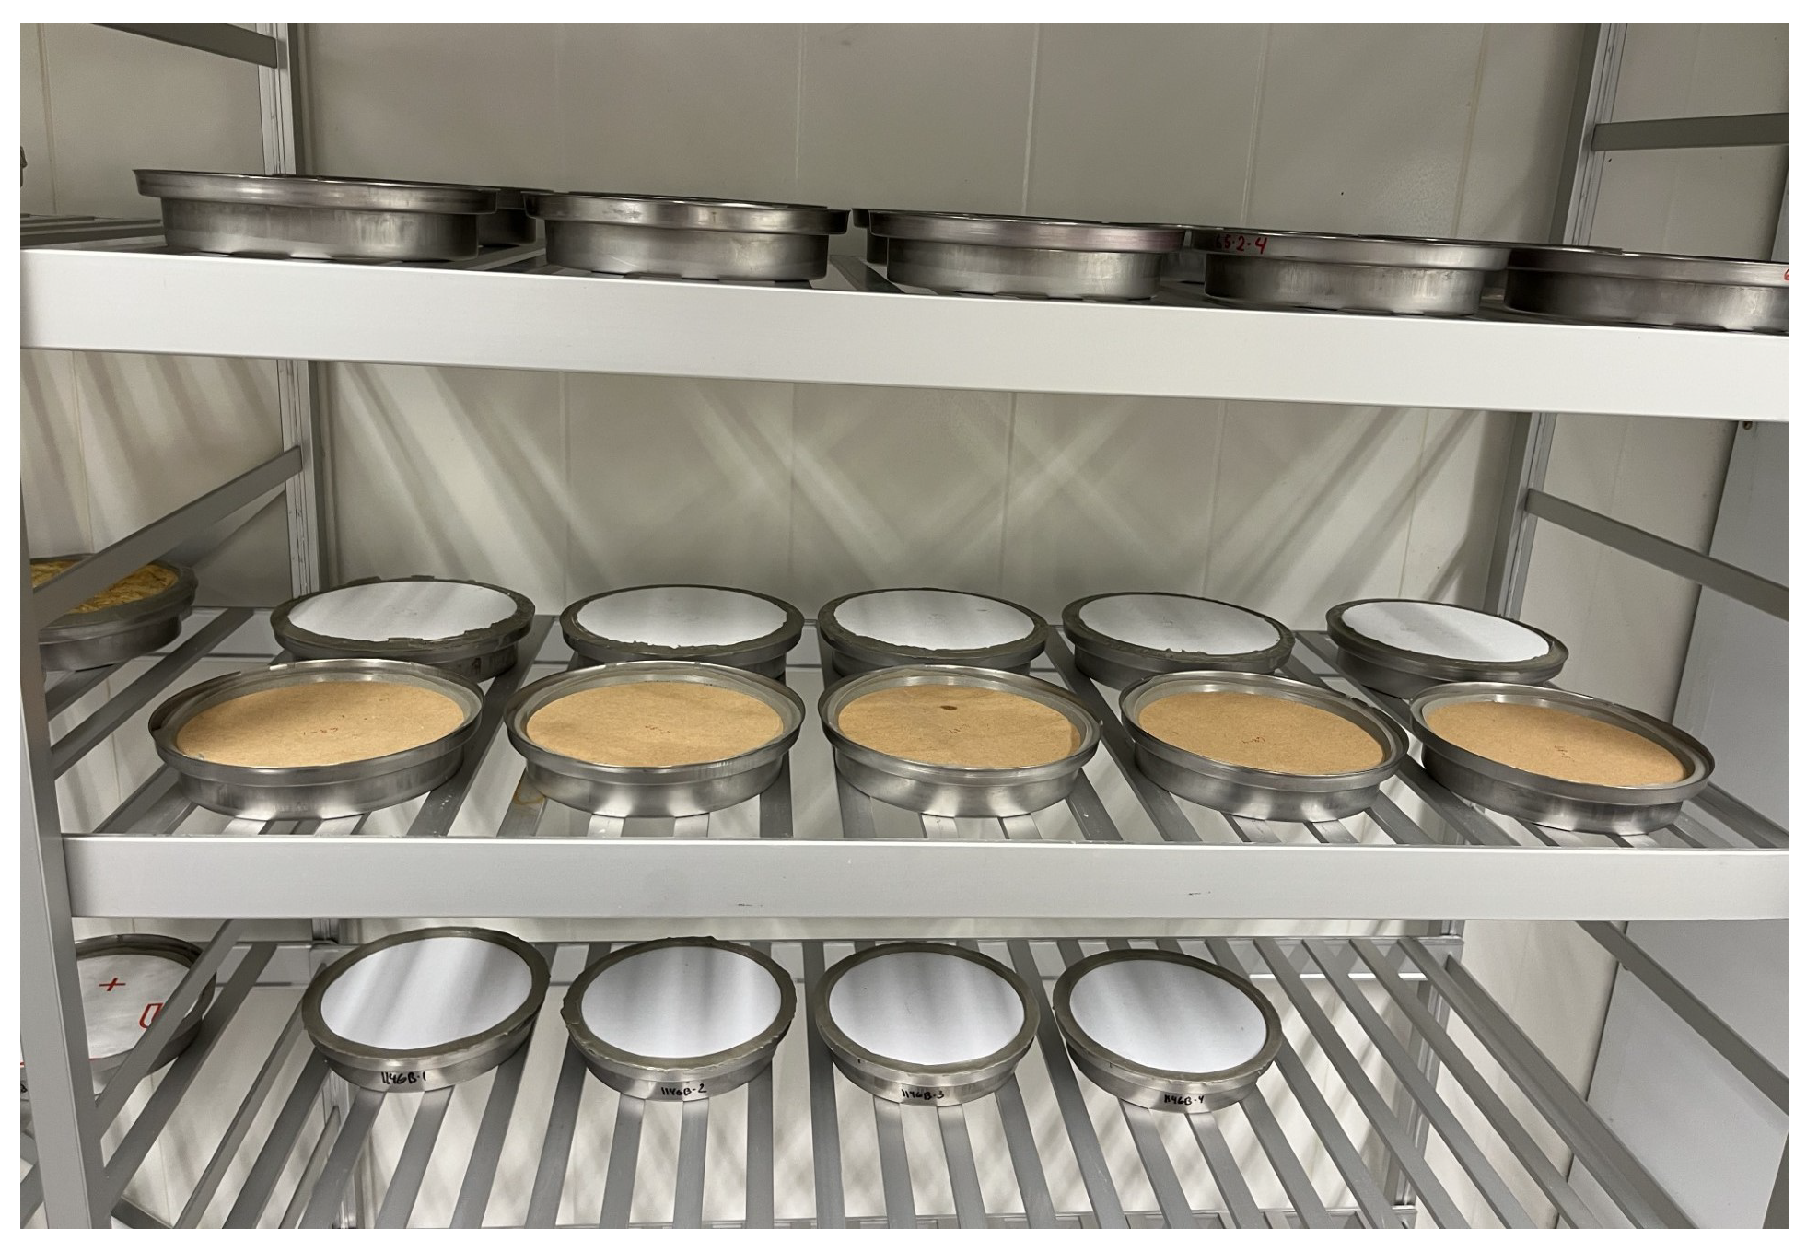
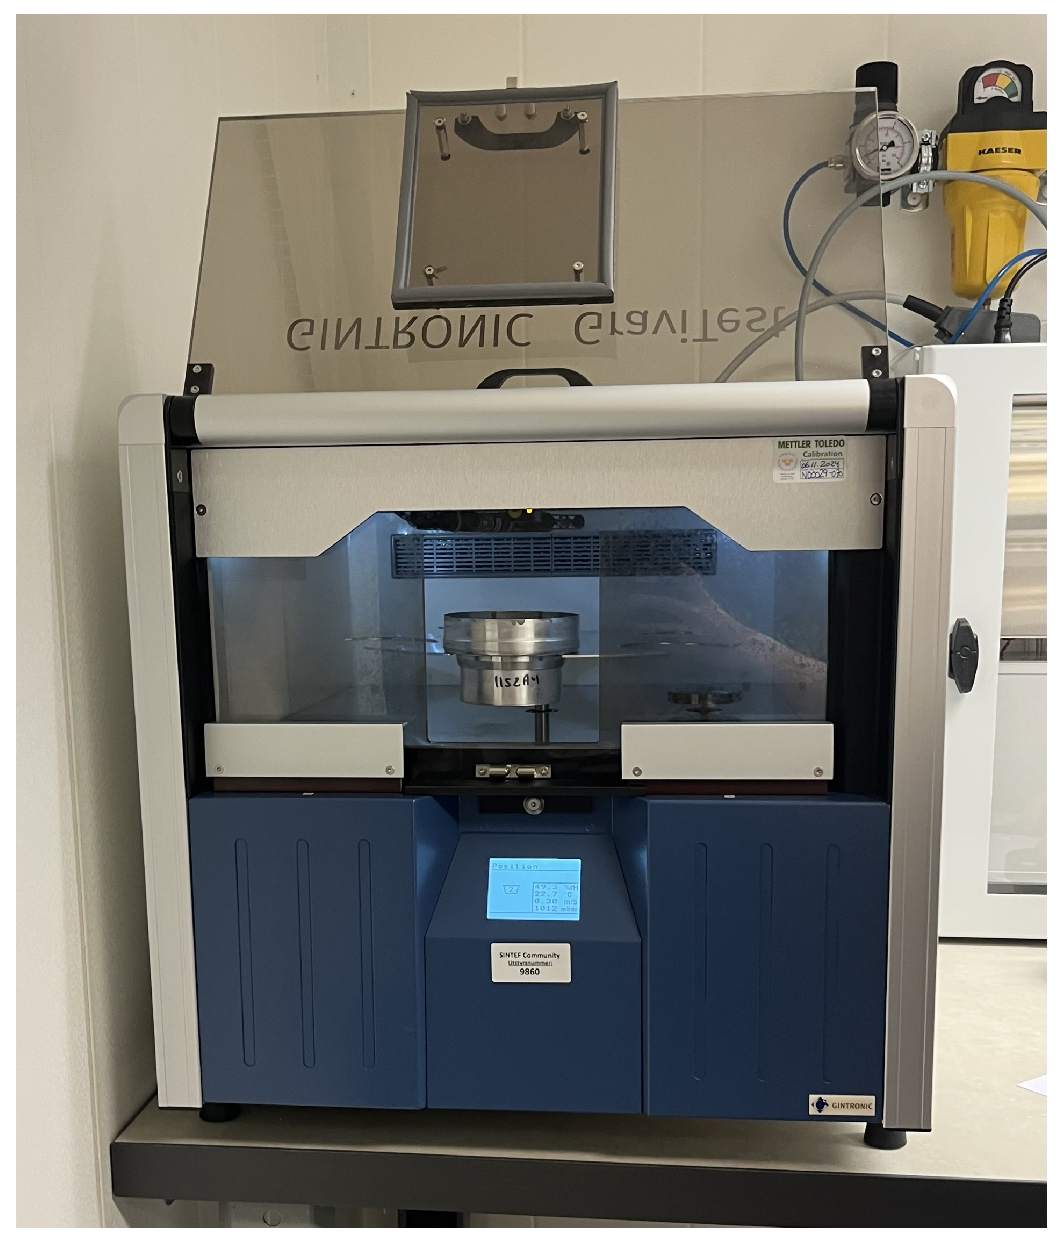
Two distinct test chambers were employed to evaluate the performance characteristics of the building papers. The test samples with a specimen diameter of 0.164 m were placed in a test enclosure with shelves, as shown in Figure 3. The test objects with a specimen diameter of 0.075 m were placed inside a Gintronic GraviTest, as shown in Figure 4. In both test chambers, the relative humidity (RH), temperature, and air velocity over the samples were kept constant. The RH was kept at (50 ± 5)%, the temperature was kept at (23 ± 2) °C, and the air velocity was kept at 0.3 m/s [48].
The different partial vapour pressure, Δ p v [Pa], between the test cup and the chamber forced a vapour flow to occur through the permeable specimens [48,54]. The vapour flow affected the mass change over time, which was measured by periodically weighing the specimens. The density of the water vapour flow rate, g [kg/(s m2)], was found by calculating the mean value of the mass change rate divided by the exposed area. δ a i r [kg/(m s Pa)] was the water vapour permeation coefficient of the air, affected by the temperature and barometric pressure. Finally, the diffusion-equivalent air layer thickness, in meters, was calculated according to NS-EN ISO 12572:2016, using Equation (1) [48], as follows:
s d = Δ p v · δ a i r g [ m ]
The mounted test specimens were placed in the test chambers at least one day before they were first weighed. During the first weighing, only the barometric pressure at the time of measurement was considered, while all other parameters were maintained at the chamber’s predetermined values. The specimens were weighed at time intervals adapted to each product. These intervals depended on the sample’s water vapour permeability and were determined based on estimated values and an evaluation after the second weighing. Table 5 presents the weighing intervals for the different samples. The table also presents the test chamber used for each type of building paper.
For the Gintronic GraviTest, a weighing interval was predefined, allowing the machine to automatically handle weighing and data recording throughout the test period. Samples I1 and I2 were tested using this method. For all other materials, weighing and data recording were performed manually. Before each weighing, the average temperature, relative humidity (RH), and barometric pressure since the previous weighing were noted, along with the barometric pressure at the exact time of weighing. These data were used as inputs in an Excel spreadsheet, which accounted for environmental variations when calculating the material’s hygrothermal properties.
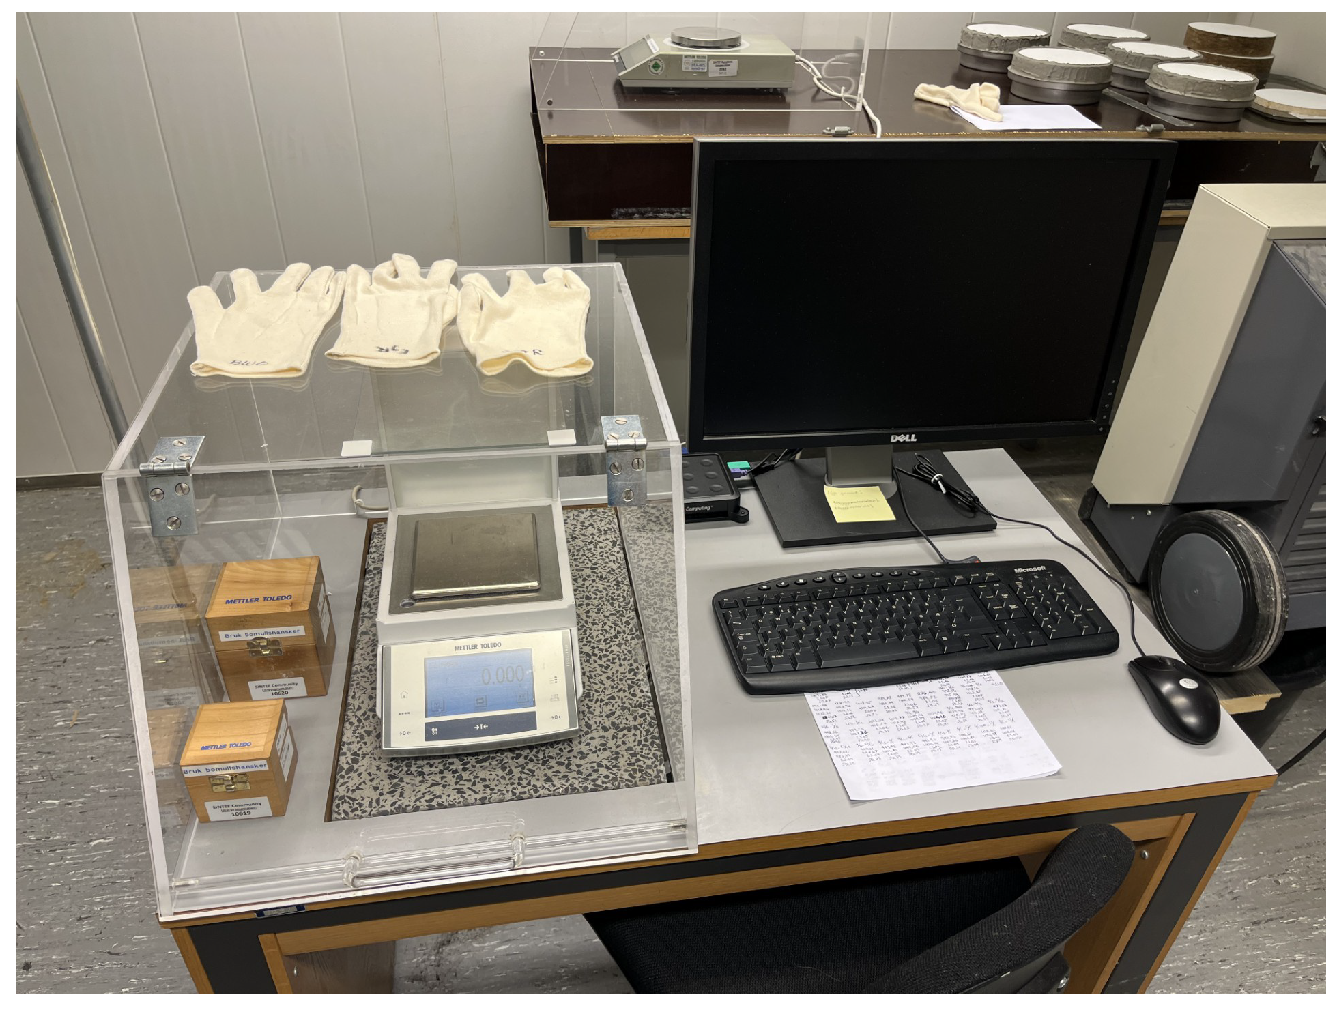
The weighing of the test specimens was conducted inside the test chambers to ensure that the samples were exposed to constant relative humidity and temperature throughout the test period. For the Gintronic GraviTest, the machine placed the test cups on an internal scale and then lifted them back into position. During weighing, the positions of the test objects were rotated. For manual weighing, a scale located inside the test room was used, specifically METTLER TOLEDO, with an accuracy of 0.001 g. The weight was connected to a computer, allowing the measured weight to be transferred directly into an Excel spreadsheet. A calibration weight was measured before and after each test set to correct the scale’s readings. Figure 5 illustrates the setup for manually weighing the test specimens. The scale was placed inside plastic housing to protect the measurements from disturbances.
After each weighing of the test specimens, preliminary calculations were reviewed to verify that the samples behaved as expected. The time intervals between weighings could be adjusted if deemed beneficial. After completing the experiment, we assessed whether the test specimens fell within the mean value with 5% uncertainty. If the test specimen remained within the measurement uncertainty parameter for all values, the result was considered valid.

2.2. WUFI® Pro Simulations

To investigate the hygrothermal performance of timber plank frame walls, one-dimensional coupled heat and moisture transfer simulations were carried out using WUFI® Pro 7.1 [49]. The calculations were performed according to the methodology outlined in NS-EN 15026:2023 [55].
First, the composition of the selected original wall assembly was presented. This wall assembly remained a constant input throughout the simulation, with only the type of building paper being varied. Accordingly, the wall assembly with an insulated interior was presented, wherein an additional insulation layer, with a vapour barrier and internal cladding, was added on the inner side of the wall. The type of insulation material and vapour barrier used varied. The constant and variable parameters defined using WUFI® Pro are presented in the following paragraphs.

2.2.1. Geometry and Materials of the Original Wall

The simulations were based on a standard timber plank frame wall, as shown in Figure 1. The thickness of the timber planks was set to 75 mm, which is roughly equivalent to 3 inches. A thickness of 2.5 inches to 3 inches is normally used for timber planks, with 3 inches being the most common thickness [12,14,15]. The thickness of the cavity was set to 50 mm. Cavities can vary from 35 to 70 mm large, with 50 mm being the most common size, roughly corresponding to 2 inches [13,14,16]. The internal and external timber cladding layer thicknesses were set to 19 mm. The building paper was modelled as a layered material by utilising the liquid transport properties of craft paper listed in the built-in WUFI® Pro material database [49]. The building paper’s thickness was set to 1 mm in WUFI® Pro due to numerical convergence reasons. The resistance factor μ was adjusted to match the s d values of the tested building paper. The monitor’s location was placed at the most vulnerable position on the wall, as marked with a green dot in Figure 6.

2.2.2. Geometry and Materials of Internally Retrofitted Wall

The wall configuration of the internally retrofitted timber plank frame wall is shown in Figure 7. The monitors were placed at the most vulnerable positions on the wall, the positions of which are marked with green dots. The original configuration was maintained, and the insulation was installed inside the original interior cladding. The construction was simulated with different insulation thicknesses and materials to evaluate their impact as the building became more energy efficient. The effects of 50 mm and 100 mm internal insulation thicknesses were controlled because these thicknesses are commonly used for retrofitting such walls (see Figure 1). In addition, a more extreme variant of 250 mm, fulfilling the U-value requirements of the Norwegian building code for new buildings [4], was controlled. The selected insulation products comprised mineral wool with modified thermal conductivity, from the Fraunhofer-IBP database, and wood fibre insulation from Pavaflex—with modifications made to align it with Hunton Nativo—from the Fraunhofer-IBP database [56,57]. Mineral wool was controlled due to the dominant share of the retrofitting insulation market for timber houses in Norway. The wood fibre insulation was also controlled, because it is supposed to be more vulnerable to moisture.
The vapour barriers tested comprised PE foil—measuring 0.2 mm thick—from the NTNU database in WUFI® Pro, as well as an Isola AirGuard Smart2 moisture-adaptive vapour barrier, for which the product Intello (ETA) from the Fraunhofer-IBP database was modified to have different s d values based on Table 2.3 in [58]. It is worth noting that a moisture-adaptive vapour barrier (MAVB) has also been referred to as a “smart vapour barrier” in the previous literature, e.g., [58,59,60]. The term MAVB is used in the present article, since it is a more precise description of the function of the product.
When insulation and a vapour barrier were added, interior cladding without a surface treatment was also added. For the exterior building paper samples, the results from the laboratory measurements of old building paper materials were used. The most and least vapour-permeable types of building paper were tested. Using two layers of building paper was historically common for both the interior and exterior sides of a wall [12]. Asphalt-impregnated paper was often used in combination with brown paper. As asphalt-impregnated paper has a much higher s d value than brown paper, the impact of brown paper is small; therefore, we only simulated the s d value of one layer of asphalt-impregnated paper.

2.2.3. Simulation Input Data

Input parameters, kept constant for all the simulations, are presented in Table 6. The air exchange rate in the cavity behind the cladding was determined based on measured data from a full-scale test setup developed within the HeriTACE project [51]. The test walls replicated historical stud-frame constructions with and without interior insulation and with unventilated painted timber cladding. Simulations were calibrated against measured temperature and wood moisture content at key positions in the wall assemblies and with temperature and RH within the airgap. The best agreement between measured and simulated data was found when assuming no air exchange in the cavity (0 h−1), consistent with the fact that the walls lacked ventilation openings at the top and bottom. Further information is given as supplementary results according to the Data Availability Statement.
The initial moisture content in the original timber wall was established through simulating the uninsulated wall over a 20-year period using climate data from Trondheim. The simulations showed a moisture profile ranging from approximately 55% relative humidity (RH) on the warm side to about 70% RH on the cold side of the wall. While implementing the full moisture profile was considered, we decided to apply a uniform initial value of 70% RH throughout the wall to simplify the setup and take a conservative approach. Simulations using Oslo climate data showed a comparable moisture profile, further supporting the choice of 70% RH as a representative and conservative initial value (see the supplementary results in accordance with the Data Availability Statement).
The variable input parameters are presented in Table 7. These parameters are represented in different combinations in Section 3.2 in the results section.
The simulations were performed for two different Norwegian climates, namely Kristiansund and Hamar. WUFI® Pro integrated MDRY files with climate data for different locations in Norway, created by [66], were used. Kristiansund is considered a worst-case scenario in terms of mould growth risk, as its location in coastal northwestern Norway leads to mild winters and cool summers, with frequent rain throughout the year [67,68]. Hamar has an inland climate, making it less vulnerable due to its relatively dry spring, summer, and autumn compared to the coastal climate of Kristiansund.
Different shortwave radiation absorptivity rates were tested, and they were assumed based on Sletfjerding [58] to examine the darkness of the exterior surface and its impact on the effect of the MAVB. Furthermore, different humidity classes were tested, as the interior moisture affects the moisture within the wall. Dwellings are normally placed in class 2 or 3 according to NS-EN ISO 13788:2012, depending on the type and ventilation system. Humidity class 3 was used as the basic input because the old houses originally did not have balanced supply–exhaust ventilation systems and, hence, may have sustained higher internal moisture excess.

2.2.4. Assessment of Mould Growth Risk

A simplified system for assessing moisture risk using colour codes was set up to enable the quick visual evaluation of indicated moisture risk. The colours red, yellow, and green represent different levels of moisture risk, as shown in Table 8. The optimal conditions for mould growth are a relative humidity of >80 % and a temperature between 5 and 30 °C [42,69]. The duration of a continuous time period of unfavourable conditions is also an important factor to consider, together with relative humidity and temperature [69]. The closer the relative humidity and temperature are to the optimal growth conditions, the shorter the time period is before mould growth appears.

3. Results

3.1. s d Values of Building Paper

The sd values for the tested types of building paper are presented in Table 9, along with a short description of each product to make them easily distinguishable. More detailed descriptions of the materials are given in Table 2.
Most tested objects were within the 5% uncertainty limit; the exceptions were products E3, I3, and I5. Product E3 exceeded the uncertainty limit for all test objects, but only by a minimal margin. Products I3 and I5 each had one of their five specimens outside the 5% uncertainty limit due to salt efflorescence. Since only a limited amount of data are available for these products, the measured sd value is considered to be a reliable indicator. It is also worth noting that a large difference was found between products E2 and E3, even though the products were obtained from the same building and the only visual difference between them was their texture.

3.2. WUFI® Pro Simulations

Table 10 and Table 11 present the combinations of the varied input parameters and their mould growth risk assessments. The rationale behind the different combinations of materials and exposures are based on the relevant configurations presented in Section 2.2.2 and Section 2.2.3. The combinations were further developed according to the explored mould growth risk, searching for measures to reduce the risk. The main findings from the simulations are listed below:
  • The exterior building paper was found to significantly affect the risk of mould growth for both the original wall and the internally retrofitted wall.
  • Cases 1–4 were simulations of the original wall in different climates and with different types of exterior building paper. Cases 2 and 4, with vapour-permeable building paper (two layers of E1; s d value: 0.040 m) on the exterior side, revealed a reduced risk of mould growth compared to Cases 1 and 3, in which a more vapour-tight building paper was used (sample E3; s d value: 5.293 m).
  • Cases 5–7 comprised different thicknesses of insulating mineral wool, with PE foil and building paper E3 ( s d value: 5.293 m) on the exterior side. From these simulations, it is clear that the thickness of the insulation has a large impact on the mould growth risk. An insulation thickness of 50 mm with a PE foil vapour barrier resulted in a low mould growth risk measure.
  • Cases 8–9 demonstrate the effects of different thicknesses when a vapour-open exterior building paper (E1 with sd value 0.040 m) was applied. Such a vapour-open exterior building paper, together with a PE foil vapour barrier, allowed for an internal retrofit thickness of 100 mm.
  • Case 10 demonstrated that the outdoor climate affects mould growth risk, as the location in Hamar had a lower mould growth risk than the location in Kristiansund (Case 7).
  • Cases 11–13 had no vapour barrier on the interior side of the internally retrofit insulation. The simulation showed that the mould growth risk was high in all of these cases, independent of the climate and the vapour impermeability of the exterior building paper.
  • Cases 14–16 included different thicknesses of wood fibre insulation in combination with exterior building paper E3 ( s d value: 5.293 m). This construction configuration allowed for an internal insulation thickness of 50 mm provided by a PE foil vapour barrier.
  • Cases 17–19 revealed that the mould growth risk was high for all cases with MAVB, independent of the thickness of the insulation.
  • Case 20 included a shortwave radiation absorptivity of 0.8, which matched the dark-coloured exterior cladding. This case revealed that the shortwave radiation absorptivity rate had a low impact on the mould growth risk of the wall, which was also the case when MAVB was applied. A shortwave radiation absorptivity of 0.8 did not contribute to a lower risk of mould growth compared to Case 17, with a shortwave radiation absorptivity rate of 0.4.
  • Case 21 shows that an indoor climate with a lower humidity class (i.e., lowering from class 3 to class 2) significantly reduced the mould growth risk.
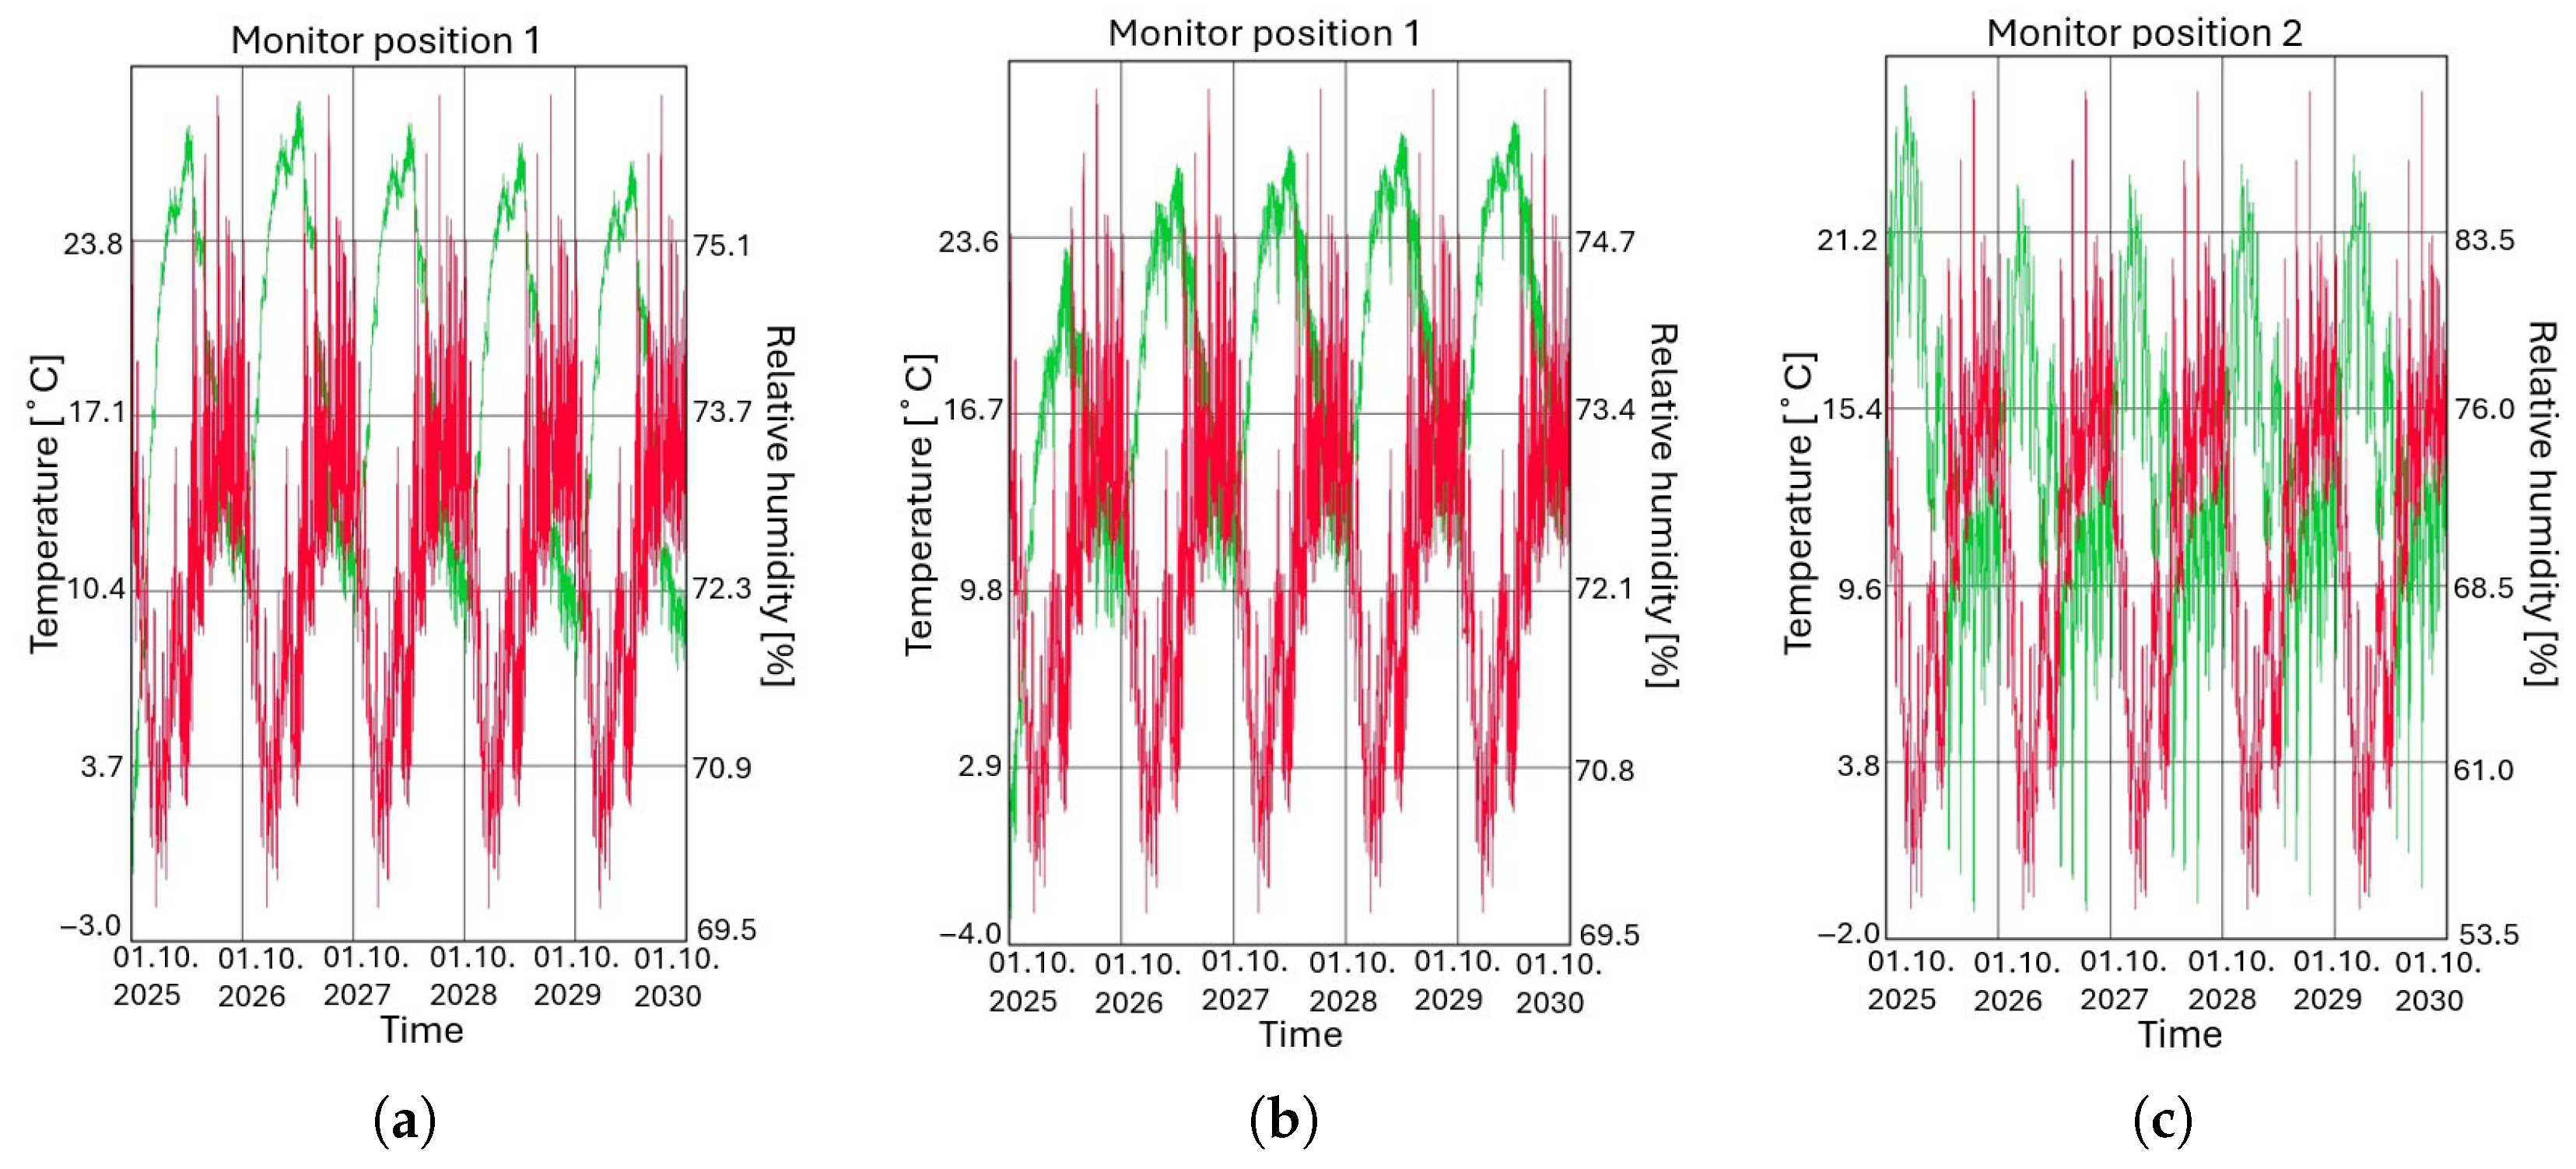
Figure 8 illustrates how Cases 5–7 were evaluated with respect to mould growth risk based on temperature and RH development over a 5-year period. The graphs present values from different positions within each case. In Cases 5 and 6, the most vulnerable location for mould growth was found to be on the exterior side of the timber plank behind the building paper layer. In Case 7, the highest risk was found in the added internal insulation applied to the original interior cladding. The monitor positions are shown in Figure 7. In each case, both positions were assessed to determine the overall mould growth risk. The green curve represents the relative humidity, and the red curve represents the temperature.

4. Discussion

4.1. Vapour Resistance of Types of Building Paper

Most of the collected samples of building paper originated from existing buildings. As a result, many of the samples showed various defects, such as small tears, nail holes, or creases. When preparing the test specimens, efforts were made to avoid areas with significant damage, which meant that parts of the submitted material were unsuitable for use. Due to the limited amount of building paper available, pieces with minor imperfections were still used. This may have influenced the measured s d values. However, most test results showed relatively little variation, suggesting that small imperfections had only a limited impact on the measurements.
For the newspaper samples (samples I3, I4, and I5), the grammage was quite even for all the samples (57 g/m2 to 58 g/m2). However, the sd values varied from 0.008 m to 0.014 m, where the lowest value was recorded for the thickest paper (0.12 mm versus 0.10 mm). A thicker paper with the same grammage indicates a more porous paper and, hence, a more vapour-open paper.
All internal building paper samples (I1–I8) had low s d values (<0.023 m), with minimal variation between the samples. A low s d value enables moisture to pass through; therefore, the interior building paper has little effect on the overall moisture transport within the wall structure. Unlike modern vapour barriers, they do not block moisture from indoor air from entering the construction.
The exterior building paper samples (E1–E4) demonstrated both higher s d values and a broader range of variation. Samples E2 to E4, all black in colour and likely asphalt-impregnated, showed s d values ranging from 0.435 m to 5.293 m. This is a substantial spread, especially considering their similar visual appearance, which makes it difficult to assess their vapour resistance through visual inspection alone. Samples E2 and E3 were collected together from the same location and only differed visually in terms of surface texture, with E3 having a grainier texture than E2. Despite this, their s d values differed significantly, being 0.881 m for E2 and 5.293 m for E3. This highlights the inconsistency in material properties, even among products that were used interchangeably in practice.
A key property of a wind barrier is the ability to allow moisture from the structure to dry out, which requires a sufficiently low s d value according to today’s standards. Uvsløkk [70] presented s d values for a range of commonly used wind barrier products. Product E1 exhibited a very low s d value compared to typical modern wind barriers. Asphalt-impregnated papers generally have s d values in the range of 0.5–0.6 m. Building paper samples E2 and E4 were close to this range, though not within it. Current recommendations state that wind barrier products used in modern timber frame walls should have an s d value no greater than 0.5 m [71]. Both E2 and E3 exceeded this limit. This is not necessarily a problem, provided that the walls have a good drying capacity due to substantial heat flow through the structure. However, internal insulation alters both the heat flow and the moisture behaviour of the wall. Therefore, understanding the vapour permeability of materials is crucial for avoiding moisture-related issues.
Tveit tested several building paper products in 1954 [18]. Because most of the products that he tested cannot be clearly identified, it was difficult to make direct comparisons between his results and those presented here. However, for some products where the type was indicated by the product name, a comparison was possible. The grammage of the products was also used to identify them. In these cases, the determined s d values appeared to align reasonably well with Tveit’s results.For newspaper samples I3 to I5, the measured grammage corresponded well to values provided by an expert in the field.

4.2. Moisture Performance of Internally Insulated Timber Plank Frame Walls

Depending on the vapour permeability of the exterior building paper, the results indicate that timber plank frame walls can be retrofitted with up to 100 mm of internal insulation when a PE foil vapour barrier is added; for more details, see Cases 5 and 8. It is, however, important to mention that this study did not take into account any amendments of the s d values due to changes in temperature and RH. The simulated original wall had a U-value of 0.81 W/m2K [49]. When 50 mm of mineral wool insulation was applied, the U-value was reduced to 0.35 W/m2K, and when 100 mm was added, it dropped further to 0.23 W/m2K [49]. These modifications represent U-value reductions of about 57% and 72%, respectively, significantly improving the building’s energy efficiency.
Cases 5 to 7 and Cases 14 to 16 only varied regarding the type of insulation material used. In both cases, there was a low risk of mould growth with 50 mm of internal insulation. With 100 mm of insulation, the risk increased to medium for mineral wool insulation and to high for wood fibre insulation. This is likely due to the material properties of the insulating materials: wood fibre tends to absorb more moisture than mineral wool, increasing the risk of mould growth.

4.3. Moisture Performance of the Internally Retrofitted Wall with MAVB

The diffusion properties of the MAVB are contingent on the relative humidity on both sides of the barrier. WUFI® Pro cannot accommodate this behaviour. In this study, the diffusion resistance was, therefore, simplified by assigning a water vapour diffusion factor, which was based on the average RH from both sides of the barrier. This simplification affected the directional flow of vapour diffusion through the barrier. The results for Cases 17–20,, which all involved MAVB, revealed a high risk of mould growth. This is likely due to the barrier becoming too vapour-permeable towards the exterior, allowing significant outward diffusion of water vapour during cold periods without sufficient inward drying to compensate in the summer.
Current recommendations for timber frame walls declare that vapour barrier products should have an s d value greater than 10 m [70]. The MAVB has a maximum s d value of 100 m and a minimum s d value of 0.2 m. The MAVB may exhibit s d values lower than the recommended threshold during certain periods, promoting inward drying during summer periods with intense sunlight on the exterior surface. The simulations indicate that the moisture-adaptive effect did not work as intended. Instead, the siumlations showed increasing moisture accumulation in the wall assembly when applying such a vapour barrier. However, the potential effect of MAVB should be investigated further, as the simulation model does not fully capture the actual material behaviour of the MAVB. The research project HeriTACE has established a test setup to further investigate the use of MAVB for the interior insulation of timber plank framed walls. Physical measurements are essential for understanding the impact of MAVB and for validating simulations.

4.4. Assumptions for the Simulations

Several assumptions were made for the simulated cases, which affected the results. For the original wall, it was assumed that oil-based paint had been applied to both the exterior and interior cladding. The exterior cladding was assumed to be well maintained, making the use of oil-based paint during past upkeep plausible, even if it is less common today [15]. Based on the assumption of regular maintenance, the cladding was assumed to be rain-tight, and we set the rain-tight setting for the rain absorption coefficient to 0. This is a simplification, as, in reality, exterior cladding is rarely completely sealed. White paint was assumed to be present on the exterior, as a conservative choice regarding solar heat gain, though simulations (namely, Case 20) showed a minimal impact of shortwave radiation on mould growth risk. The interior cladding was also assumed to be well preserved and retained during retrofitting, which is a common practice [16]. The vapour-tight interior paint layer was, therefore, assumed to remain intact, limiting moisture transport compared to a situation where the paint would have been removed before applying interior insulation.
Data on air exchange in slightly ventilated cavities behind old timber cladding are limited. The air exchange rate used in this study was based on a single short-term test with new cladding, which may not represent older assemblies and introduces uncertainties. However, the value is supported by measurements, offering a more reliable basis than a rough estimate. We assumed that an exchange rate of 0 h−1 is highly conservative, as it implies no moisture removal via airflow. For more details, see the Data Availability Statement.
Current Norwegian building guidelines recommend ventilated cladding [10]. However, older timber-framed walls may perform well without ventilation in parts of Norway with a moderate wind-driven rain load, since heat loss through the wall promotes drying [72]. In such cases, heat loss becomes part of the wall’s original moisture safety strategy. This was evident when comparing Case 2 and Case 13, which had identical assemblies except for the additional 50 mm of insulation in Case 13. Adding insulation without a vapour barrier increased the risk of mould growth. It was also demonstrated that unventilated timber facades may be durable, provided they have a vapour-tight interior barrier ( s d value: >10 m) [73]. This was observed in Cases 5 and 8. In WUFI® Pro, a vapour barrier without defects was assumed. In reality, achieving a completely sealed barrier can be challenging, which may affect moisture transport within the construction.
The amount of moisture affecting the timber structure was determined in the simulations by the exterior climate, the indoor humidity class, and the initial RH. The exterior conditions were based on weather files using design years. A design year is based on historical severe weather events, though such a year is unlikely to occur in reality (at least not repeatedly for 5 years in a row). One of the locations that we looked at was Kristiansund, which represents a very harsh and exposed climate with respect to moisture load. Historical timber plank frame structures are more commonly found in inland regions with milder climates [13]. Hence, the simulations also included comparisons with Hamar, a populated location with a dryer climate. There are, however, other areas in Norway with even more favourable climates with respect to mould growth risk, such as inland Finnmark and central parts of southern Norway [72], that could have been investigated. Those locations were not considered, as there are few timber frame plank structures there.
For indoor humidity, humidity class 3 was used as the base input, representing very humid indoor air [47]. As shown in Case 21, the indoor humidity class had a significant impact on the moisture levels in the construction, and it strongly influenced the risk of mould growth. The initial RH was set to 70%. In most cases, the initial RH did not impact the moisture conditions of the walls for the first year or so. In cases where the drying capacity was poor, the initial RH may have impacted, to a large degree, how much time the structure requires to dry out. If both the interior and exterior sides of the construction are highly vapour-tight, the initial RH can have a greater impact because of the longer drying time. Moisture accumulation can occur in several cases that show a high risk of mould growth.

4.5. Limitations and Future Studies

One issue requiring attention in further studies is the more comprehensive mapping of building paper samples. The tested samples were limited to the materials submitted to the project. It would be valuable to determine whether the collected building papers were representative of the period. This can be determined by testing a wider range of products and, therefore, mapping more widely the types of building paper used in timber plank frame walls. Since several tests were carried out using fewer samples than desired or using samples that fell outside the acceptable measurement uncertainty limit, it is also relevant to repeat some of the tests as full-scale trials to verify the consistency of the results.
While conservative assumptions were applied throughout this study to ensure that the results represented worst-case scenarios, these simplifications also introduced a degree of uncertainty. By systematically choosing input values that represent severe conditions, the simulations provided robust and broadly applicable insights. However, such an approach limits the precision of the findings for any specific case. In particular, one-dimensional simulations assumed ideal conditions, including continuous air- and vapour-tight layers, which may not reflect the performance of actual historical wall constructions.
The presented limitations highlight the importance of project-specific assessments. The hygrothermal behaviour of timber plank frame walls can vary significantly depending on the construction details, material properties, and boundary conditions. To reduce the risk of unintended moisture accumulation, especially in complex geometries or areas with air leakages, future studies should include more advanced modelling approaches, such as two- or three-dimensional simulations, and, where possible, validation through field measurements.
Additionally, the results indicated no benefit from using MAVB. However, this may be due to limitations in how these materials were represented in the simulations. Future research should explore models that can account for variable vapour diffusion properties on each side of the membrane, depending on local humidity and temperature conditions.
Finally, there is a clear need for empirical data. Field investigations and the long-term monitoring of retrofitted timber walls under real climate exposure would provide valuable insights into actual moisture performance and help to validate numerical models. Such studies would significantly improve the reliability of recommendations for moisture-safe retrofitting historic timber constructions.

5. Conclusions

The laboratory experiments revealed that the s d values for the historical building paper samples ranged from 0.008 m to 5.293 m. The s d values for the interior building paper samples ranged from 0.008 m to 0.023 m, and they were all classified as vapour-permeable. The s d values for the exterior building paper samples varied more greatly, ranging from 0.020 m to 5.293 m.
The hygrothermal simulations revealed that using vapour-tight exterior building paper (e.g., sample E3, s d value: 5.293) limited our ability to internally retrofit a 50 mm thick insulation layer of either mineral wool or wood fibre when a PE foil vapour barrier was applied on the interior side of the insulation. Following individual adaptations, the thickness of the insulation layer can be increased in some cases. Using building paper with a low s d value (e.g., 0.040 m) on the exterior side of the wall ensures better drying conditions for internally insulated timber plank walls. Two layers of exterior building paper, namely sample E1 ( s d value: 0.040 m) and a PE foil vapour barrier, allow for 100 mm of internal mineral wool insulation. Furthermore, a more vapour-tight exterior building paper, e.g., E3 ( s d value: 5.293 m), together with PE foil vapour barrier, reduced the acceptable internal mineral wool insulation to 50 mm. As the original timber plank frame wall was uninsulated, an additional 50 mm or 100 mm of mineral wool represents reductions in the U-value of about 57% and 72%, respectively, significantly improving the building’s energy efficiency.
Using MAVB together with internal insulation led to, according to the hygrothermal simulations, a higher risk of mould growth. The results indicate that the MAVB allows too much water vapour to diffuse outwards during colder periods, without the occurrence of sufficient inward drying to compensate during summer periods with intense sunlight on the exterior surface. There is, however, a key uncertainty associated with the result, since WUFI® Pro does not fully capture the actual material behaviour of MAVB. Therefore, the potential of MAVB should be further investigated using a more advanced simulation tool.

Author Contributions

Conceptualisation, M.E.H., S.K.A. and T.K.; methodology, M.E.H., S.K.A. and T.K.; validation, M.E.H. and S.K.A.; formal analysis, M.E.H.; investigation, M.E.H.; writing—original draft preparation, M.E.H.; writing—review and editing, M.E.H., S.K.A. and T.K.; visualisation, M.E.H.; supervision, S.K.A. and T.K. All authors have read and agreed to the published version of this manuscript.

Funding

This research was funded by support from HeriTACE through the European framework programme HORIZON-CL5-2023-D4-01.

Data Availability Statement

The supporting reported results will be made available at https://ntnuopen.ntnu.no/ntnu-xmlui/ in December 2025, three months after the censorship of the M.Sc thesis of Martha Eilertsen Harberg. Important supplementary results include the assessment of air exchange rates in the cavity behind the exterior cladding in timber plank frame walls, as well as other evaluated input parameters used in the WUFI® Pro simulations. All reports from the laboratory tests, along with excerpts from all simulations, are also included as appendices to the master’s thesis.

Acknowledgments

This research was conducted in collaboration with the research project HeriTACE through SINTEF. The authors would like to extend their gratitude to laboratory engineer Ole Aunrønning for their support during laboratory work.

Conflicts of Interest

The authors declare no conflicts of interest. The funders had no role in the design of this study; the collection, analysis, or interpretation of data; the writing of the manuscript; or the decision to publish the results.

References

  1. European Commission. European Climate Law. 2024. Available online: https://climate.ec.europa.eu/eu-action/european-climate-law_en (accessed on 7 March 2025).
  2. Bjelland, D.; Gullbrekken, L.; Hrynyszyn, B.D.; Kvande, T. Is Heritage Protection a Limiting Factor for Passive Deep Energy Retrofitting? A Cold-Climate Case Study of University Buildings. Heritage 2025, 8, 88. [Google Scholar] [CrossRef]
  3. The European Parliament and the Council of the European Union. DIRECTIVE (EU) 2023/1791 OF THE EUROPEAN PARLIAMENT AND OF THE COUNCIL of 13 September 2023, on Energy Efficiency and Amending Regulation (EU) 2023/955 (Recast) (Text with EEA Relevance). 2023. Available online: https://eur-lex.europa.eu/eli/dir/2023/1791/oj/eng (accessed on 7 March 2025).
  4. Norwegian Technical Requirements for Construction Works (TEK17). 2017. Available online: https://lovdata.no/dokument/SF/forskrift/2017-06-19-840 (accessed on 7 March 2025).
  5. Grytli, E.; Andresen, I.; Hermstad, K.; Knudsen, W. Fiin Gammel Aargang; SINTEF Bygg og miljø: Trondheim, Norway, 2004; Available online: https://www.sintef.no/globalassets/upload/fiin_gammel_aargang.pdf (accessed on 1 October 2024).
  6. Riksantikvaren. Råd om Energisparing i Gamle Hus. 2022. Available online: https://www.riksantikvaren.no/veileder/rad-om-energisparing-i-gamle-hus/#section1 (accessed on 3 February 2025).
  7. European Commission. Final Report Summary—EFFESUS (ENERGY EFFICIENCY FOR EU HISTORIC DISTRICTS SUSTAINABILITY). 2024. Available online: https://cordis.europa.eu/project/id/314678/reporting/it (accessed on 7 March 2025).
  8. Lovdata. Plan- og Bygningsloven. Lov om Planlegging og Byggesaksbehandling. LOV-2008-06-27-71. 2025. Available online: https://lovdata.no/dokument/NL/lov/2008-06-27-71 (accessed on 9 March 2025).
  9. Trondheim kommune. Kriterier for A, B og C-klassifisering. 2022. Available online: https://www.trondheim.kommune.no/tema/bygg-kart-og-eiendom/bygging/byantikvaren/aktsomhetskart-kulturminner/kriterier-for-abc-klassifisering/#bygninger_med_antikvarisk_verdi_ab_og_c (accessed on 9 March 2025).
  10. Edvardsen, K.I.; Ramstad, T.Ø. Trehusbygging i Norge. In Trehus håNdbok 5; Haug, T., Ed.; SINTEF akademisk forlag: Oslo, Norway, 2018; ISBN 978-82-536-1391-8. [Google Scholar]
  11. Ritchie, T. The Use of Planks in Wall Construction. Bull. Assoc. Preserv. Technol. 1974, 6, 26–34. Available online: https://www.jstor.org/stable/1493482 (accessed on 21 March 2025). [CrossRef]
  12. Drange, T.; Aanensen, H.O.; Brænne, J. Gamle Trehus; Universitetsforlaget AS: Oslo, Norway, 1996; pp. 117–118. ISBN 82-00-21389-7. [Google Scholar]
  13. Edvardsen, K.I. 723.305 Eldre Vegger av Reisverk. Metoder og Materialer; Byggforskserien; SINTEF: Trondheim, Norway, 2017; Available online: https://www.byggforsk.no/dokument/676/eldre_vegger_av_reisverk_metoder_og_materialer# (accessed on 3 February 2025).
  14. Bugge, A. Husbygningslære; H. Aschehoug & co: Oslo, Norway, 1918; pp. 381–428. Available online: https://www.nb.no/items/URN:NBN:no-nb_digibok_2016052707029?page=5 (accessed on 8 April 2025).
  15. Roede, L. Gode Råd om Yttervegger i Eldre Trehus; Fortidsminneforeningen: Oslo, Norway, 2009; ISSN 0332-7205. [Google Scholar]
  16. Bøhlerengen, T. 723.511 Etterisolering av Yttervegger av Tre; Byggforskserien: Oslo, Norway; SINTEF: Trondheim, Norway, 2023; Available online: https://www.byggforsk.no/dokument/679/etterisolering_av_yttervegger_av_tre#i9 (accessed on 9 April 2025).
  17. Bergheim, E.; Geving, S.; Gullbrekken, L. Bruk av Eldre Sperresjikt ved Etterisolering; Byggeindustrien: Oslo, Norway, 2020; p. 26. [Google Scholar]
  18. Tveit, A. Vanndampdiffusjonstall for Papp og Trefiberplater; Johan Grundt Tanum Forlag: Oslo, Norway, 1954; ISBN 532.72:691.14. [Google Scholar]
  19. Bottino-Leone, D.; Larcher, M.; Herrera-Avellansosa, D.; Haas, F. Evaluation of natural-based internal insulation systems in historic buildings through a holistic approach. Energy 2019, 181, 521–531. [Google Scholar] [CrossRef]
  20. NS-EN 16883:2017; Conservation of Cultural Heritage. Guidelines for Improving the Energy Performance of Historic Buildings. Standard Norge: Oslo, Norway, 2017.
  21. Lisø, K.R.; Kvande, T.; Thue, J.V. Learning from experience—An analysis of process induced building defects in Norway. In Proceedings of the 3rd International Building Physics Conference—Research in Building Physics and Building Engineering, Montreal, QC, Canada, 27–31 August 2006; Taylor & Francis: Montreal, QC, Canada, 2006; pp. 425–432. [Google Scholar]
  22. Knarud, J.I.B. Hygrothermal Modeling of Masonry with Interior Insulation Retrofit. Perspectives on Hygrothermal Performance and Modeling-Uncertainty. Doctoral Thesis, Norwegian University of Science and Technology, Faculty of Engineering, Department of Civil and Environmental Engineering, Trondheim, Norway, 2024. Available online: https://ntnuopen.ntnu.no/ntnu-xmlui/handle/11250/3115856 (accessed on 20 May 2025).
  23. Klõšeiko, P. Hygrothermal Performance of Masonry Walls Retrofitted with Interior Insulation in Cold Climate. Ph.D. Thesis, Department of Civil Engineering and Architecture, Tallinn University of Technology, Tallinn, Estonia, 2022. [Google Scholar]
  24. Gutland, M.J. Evaluating Uncertainty in Hygrothermal Modelling of Heritage Masonry Buildings. Ph.D. Thesis, Carleton University, Ottawa, Canada, 2022. [Google Scholar]
  25. Soulios, V. Hygrothermal Performance of Hydrophobized Brick and Mortar: Energy Renovation Through Internal Insulation-Can Hydrophobization Improve the Moisture Safety? Ph.D. Thesis, Department of the Build Environment, Aalborg University, Aalborg, Denmark, 2021. [Google Scholar]
  26. Jensen, N.F. Robust Solutions for Internal Retrofitting Solid Masonry Walls in Historic Buildings with Regards to Hygrothermal Performance. Ph.D. Thesis, Department of Civil Engineering, Technical University of Denmark, Lyngby, Denmark, 2021. [Google Scholar]
  27. Calle, K. Renovation of Historical Facades: The Rescue or the Kiss of Death? Doctoral Dissertation, Faculteit Ingenieurswetenschappen en Architectuur, Vakgroep Architectuur en Stedenbouw, Ghent University, Ghent, Belgium, 2020. [Google Scholar]
  28. Ruisinger, U. Das hygrothermische Verhalten von Balkenköpfen bei innen gedämmten Gebäuden. Ph.D. Thesis, Institut für Hochbau, Technischen Universität Graz, Dresden, Germany, 2019. [Google Scholar]
  29. Odgaard, T.R. Challenges When Retrofitting Multi-Storey Buildings with Interior Thermal Insulation. Ph.D. Thesis, Department of Civil Engineering, Technical University of Denmark, Lyngby, Denmark, 2019. [Google Scholar]
  30. Kolatis, D.I.; Malliotakis, E.; Kontogeorgos, D.A.; Mandilaras, I.; Katsourinis, D.I.; Founti, M.A. Comparative assessment of internal and external thermal insulation systems for energy efficient retrofitting of residential buildings. Energy Build. 2013, 64, 123–131. [Google Scholar] [CrossRef]
  31. Walker, R.; Pavía, S. Thermal performance of a selection of insulation materials suitable for historic buildings. Build. Environ. 2015, 94, 155–165. [Google Scholar] [CrossRef]
  32. Pagoni, P.; Møller, E.B.; Peuhkuri, R.H.; Jensen, N.F. Evaluation of the performance of different internal insulation systems in real-life conditions—A case study. Build. Environ. 2025, 267, 112319. [Google Scholar] [CrossRef]
  33. Lucchi, E.; Tabak, M.; Troi, A. The “Cost Optimality” Approach for the Internal Insulation of Historic Buildings. Energy Procedia 2017, 133, 412–423. [Google Scholar] [CrossRef]
  34. Harrestup, M.; Svendsen, S. Full-scale test of an old heritage multi-storey building undergoing energy retrofitting with focus on internal insulation and moisture. Build. Environ. 2015, 85, 123–133. [Google Scholar] [CrossRef]
  35. Finken, G.R.; Bjarløv, S.P.; Peuhkuri, R.H. Effect of façade impregnation on feasibility of capillary active thermal internal insulation for a historic dormitory—A hygrothermal simulation study. Constr. Build. Mater. 2016, 113, 202–214. [Google Scholar] [CrossRef]
  36. Alev, U.; Kalamees, T. Avoiding mould growth in an interiorly insulated log wall. Build. Environ. 2016, 105, 104–115. [Google Scholar] [CrossRef]
  37. Cho, H.M.; Wi, S.; Chang, S.J.; Kim, S. Hygrothermal properties analysis of cross-laminated timber wall with internal and external insulation systems. J. Clean. Prod. 2019, 231, 1353–1363. [Google Scholar] [CrossRef]
  38. Geving, S. 471.111 Beregningsmetode for å Unngå Kondens Eller Muggvekst på Innvendige Overflater; Byggforskserien; SINTEF: Trondheim, Norway, 1999; Available online: https://www.byggforsk.no/dokument/2758/beregningsmetode_for_aa_unngaa_kondens_eller_muggvekst_pa-a_innvendige_overflater#i8 (accessed on 20 February 2025).
  39. Viitanen, H. Factors affecting the development of biodeterioration in wooden constructions. Mater. Struct. 1994, 27, 483–493. [Google Scholar] [CrossRef]
  40. Mattsson, J. Råtesopp i Bygninger. Forekomst, Påvisning, Vurdering og Utbedring; Mycoteam AS: Oslo, Norway, 2010; pp. 70–78. ISBN 978-82-91070-14-8. [Google Scholar]
  41. Holme, J. Mould Growth in Buildings. Doctoral Thesis, Norwegian University of Science and Technology (NTNU), Trondheim, Norway, 2010. Available online: https://ntnuopen.ntnu.no/ntnu-xmlui/handle/11250/231669 (accessed on 19 May 2025).
  42. Gradeci, K.; Labonnote, N.; Time, B.; Köhler, J. Mould growth criteria and design avoidance approaches in wood-based materials—A systematic review. Constr. Build. Mater. 2017, 150, 77–88. [Google Scholar] [CrossRef]
  43. Ingebretsen, S.B.; Andenær, E.; Gullbrekken, L.; Kvande, T. Microclimate and Mould Growth Potential of Air Cavities in Ventilated Wooden Facade and Roof Systems—Case Studies from Norway. Buildings 2022, 12, 1739. [Google Scholar] [CrossRef]
  44. Mattsson, J.; Stensrød, O. Håndbok om Vannskader. Årsak, Undersøkelser, Tiltak og Gjenoppbygging; Mycoteam: Oslo, Norway, 2009; ISBN 978-82-91070-11-7. [Google Scholar]
  45. Viitanen, H.; Factors Affecting Mould Growth on Kiln Dried Wood. VTT Building and Transport, Finland, no Date. Available online: https://www.penthon.com/wp-content/uploads/2014/08/Vittanen-Mogelinex.pdf (accessed on 20 February 2025).
  46. NS-EN ISO 13788:2012; Hygrothermal Performance of Building Components and Building Elements—Internal Surface Temperture to Avoid Critical Surface Humidity and Interstitial Condensation—Calculation Methods. Standard Norge: Oslo, Norway, 2012.
  47. Bøhlerengen, T. 421.132 Fukt i bygninger. Teorigrunnlag; Byggforskserien; SINTEF: Trondheim, Norway, 2018; Available online: https://www.byggforsk.no/dok-ument-/184/fukt_i_bygninger_teorigrunnlag (accessed on 13 February 2025).
  48. NS-EN ISO 12572:2016; Standard Norge. Hygrothermal Performance of Building Materials and Products. Determination of Water Vapour Transmission Properties. Cup Method. Standard Norge: Oslo, Norway, 2016.
  49. Fraunhofer Institute for Building Physics. WUFI® Pro|WUFI (En); Fraunhofer Institute for Building Physics: Stuttgart, Germany, 2024. [Google Scholar]
  50. Bergheim, E. Risiko for Muggvekst ved Utvendig Etterisolering av Eldre Bindingsverksvegger. Master’s Thesis, Norwegian University of Science and Technology, Faculty of Engineering, Department of Civil and Environmental Engineering, Trondheim, Norway, 2020. Available online: https://ntnuopen.ntnu.no/ntnu-xmlui/discover (accessed on 18 June 2025).
  51. HeriTACE Future-Proofing Heritage Buildings by Optimising Comfort and Energy in Time and Space. 2024. Available online: https://www.heritace.eu/home (accessed on 21 May 2025).
  52. Rambæk, I. Verneverdige Trehus bør Også Etterisoleres. Men det må gjøRes Riktig for å Unngå Skader på Bygningen. 2024. Available online: https://www.forskning.no/bygningsmaterialer-partner-resirkulering/verneverdige-trehus-bor-ogsa-etterisoleres/2433258 (accessed on 21 May 2025).
  53. Sande, Ø. Orkmannen. Store Norske Leksikon. 2024. Available online: https://snl.no/Orkmannen (accessed on 17 February 2025).
  54. Thue, J.V. Bygningsfysikk Grunnlag; Fagbokforlaget: Trondheim, Norway, 2020; ISBN 978-82-450-1994-0. [Google Scholar]
  55. NS-EN 15026:2023; Hygrothermal Performance of Building Components and Building Elements. Assessment of Moisture Transfer by Numerical Simulation. Standard Norge: Oslo, Norway, 2023.
  56. Lunde, E. Trefiberbasert Isolasjon i Bindingsverkvegger—Undersøkelse av Fuktforhold i et Laboratorieforsøk og Sammenligning med Simuleringer i WUFI®. Master’s Thesis, Norwegian University of Science and Technology, Faculty of Engineering, Department of Civil and Environmental Engineering, Trondheim, Norway, 2014. Available online: https://ntnuopen.ntnu.no/ntnu-xmlui/handle/11250/233197 (accessed on 2 May 2025).
  57. Skogstad, H.B. SINTEF Technical Approval TG 20440; SINTEF: Oslo, Norway, 2021; Available online: https://www.sintefcertification.-no/product/index/3217 (accessed on 12 May 2025).
  58. Sletfjerding, E.B. Smart Vapour Barriers in Compact Timber-Framed Roofs. Parameter Analysis and Field Measurements. Master’s Thesis, Norwegian University of Science and Technology, Faculty of Engineering, Department of Civil and Environmental Engineering, Trondheim, Norway, 2019. Available online: https://ntnuopen.ntnu.no/ntnu-xmlui/handle/11250/2621273 (accessed on 20 May 2025).
  59. Tomren, J.H.; Andenæs, E.; Geving, S.; Kvande, T. Water Vapour Resistance of Ceiling Paints—Implications for the Use of Smart Vapour Barriers in Compact Wooden Roofs. Buildings 2023, 13, 2185. [Google Scholar] [CrossRef]
  60. Knarud, J.I.; Kvande, T.; Geving, S. Hygrothermal Simulation of Interior Insulated Brick Wall — Perspectives on Uncertainty and Sensitivity. Buildings 2023, 13, 1701. [Google Scholar] [CrossRef]
  61. NS 3031:2025; Bygningers Energiytelse—Beregning av Energi- og Effektbehov. Standard Norge: Oslo, Norway, 2025.
  62. Direktoratet for byggkvalitet. Byggteknsik Forskrifte (TEK17) § 13-4. Termisk Inneklima. 2020. Available online: https://www.dibk.no/regelverk/byggteknisk-forskrift-tek17/13/ii/13-4?_t_q=temperatur (accessed on 26 April 2025).
  63. DIN 4108-3; Thermal Protection and Energy Economy in Buildings—Part 3: Protection Against Moisture Subject to Climate Conditions—Requirements, Calculation Methods and Directions for Planning and Construction. German National Standard: Berlin, Germany, 2024.
  64. Rossebø, K.B. Determination of Vapour Resistance of Exterior Coatings—Impact on Moisture Drying Conditions in Wooden Claddings. Master’s Thesis, Norwegian University of Science and Technology, Faculty of Engineering, Department of Civil and Environmental Engineering, Trondheim, Norway, 2024. [Google Scholar]
  65. Rossebø, K.B.; Kvande, T. Water Vapour Resistance of Exterior Coatings—Influence on Moisture Conditions in Ventilated Wooden Claddings. Buildings 2024, 14, 2202. [Google Scholar] [CrossRef]
  66. Geving, S.; Torgersen, S.E.; Klimadata for Fuktberegninger. Referanseår for 12 Steder i Norge og Klimadata for Konstruksjoner mot Grunnen. Prosjektrapport 227, Norges Byggforskningsinstitutt, Norway, 1997. Available online: https://sintef.brage.unit.no/sintef-xmlui/handle/11250/2416041 (accessed on 21 May 2025).
  67. Storaas, K. Smart Dampsperre i Kompakte Tretak—Vurdering av Fuktsikkerhet. Master’s Thesis, Norwegian University of Science and Technology, Faculty of Engineering, Department of Civil and Environmental Engineering, Trondheim, Norway, 2020. Available online: https://ntnuopen.ntnu.no/ntnu-xmlui/handle/11250/2779405 (accessed on 2 May 2025).
  68. Fuglestad, F.E.; Andenæs, E.; Geving, S.; Kvande, T. Determining the Vapour Resistance of Breather Membrane Adhesive Joints. Materials 2022, 15, 6619. [Google Scholar] [CrossRef] [PubMed]
  69. Geving, S. Praktisk Bygningsfysikk; Fagbokforlaget: Trondheim, Norway, 2021; pp. 105–107. ISBN 978-82-450-2801-0. [Google Scholar]
  70. Uvsløkk, S. 573.121 Materialer til luft- og Damptetting; Byggforskserien; SINTEF: Trondheim, Norway, 2003; Available online: https://www.byggforsk.no/dok-ument/598/materialer_til_luft_og_damptetting#i4 (accessed on 19 May 2025).
  71. Elvebakk, K.; Gullbrekken, L. 523.255 Yttervegger av bindingsverk. Varmeisolering og tetting; Byggforskserien; SINTEF: Trondheim, Norway, 2020; Available online: https://www.byggforsk.no/dokument/361/yttervegger_av_bindingsverk_varmeisolering_og_tetting# (accessed on 19 May 2025).
  72. Nore, K. Hygrothermal Performance of Ventilated Wooden Cladding. Doctoral Thesis, Norwegian University of Science and Technology, Faculty of Engineering, Department of Civil and Environmental Engineering, Trondheim, Norway, 2009. Available online: https://ntnuopen.ntnu.no/ntnu-xmlui/handle/11250/231575 (accessed on 2 May 2025).
  73. Gudum, C. Moisture Transport and Convection in Building Envelopes. Ventilation in Light Weight Outer Walls. Doctoral Thesis, Technical University of Denmark, Lyngby, Denmark, 2003. Byg Rapport R-047. Available online: https://orbit.dtu.dk/en/publications/moisture-transport-and-convection-in-building-envelopes (accessed on 28 April 2025).
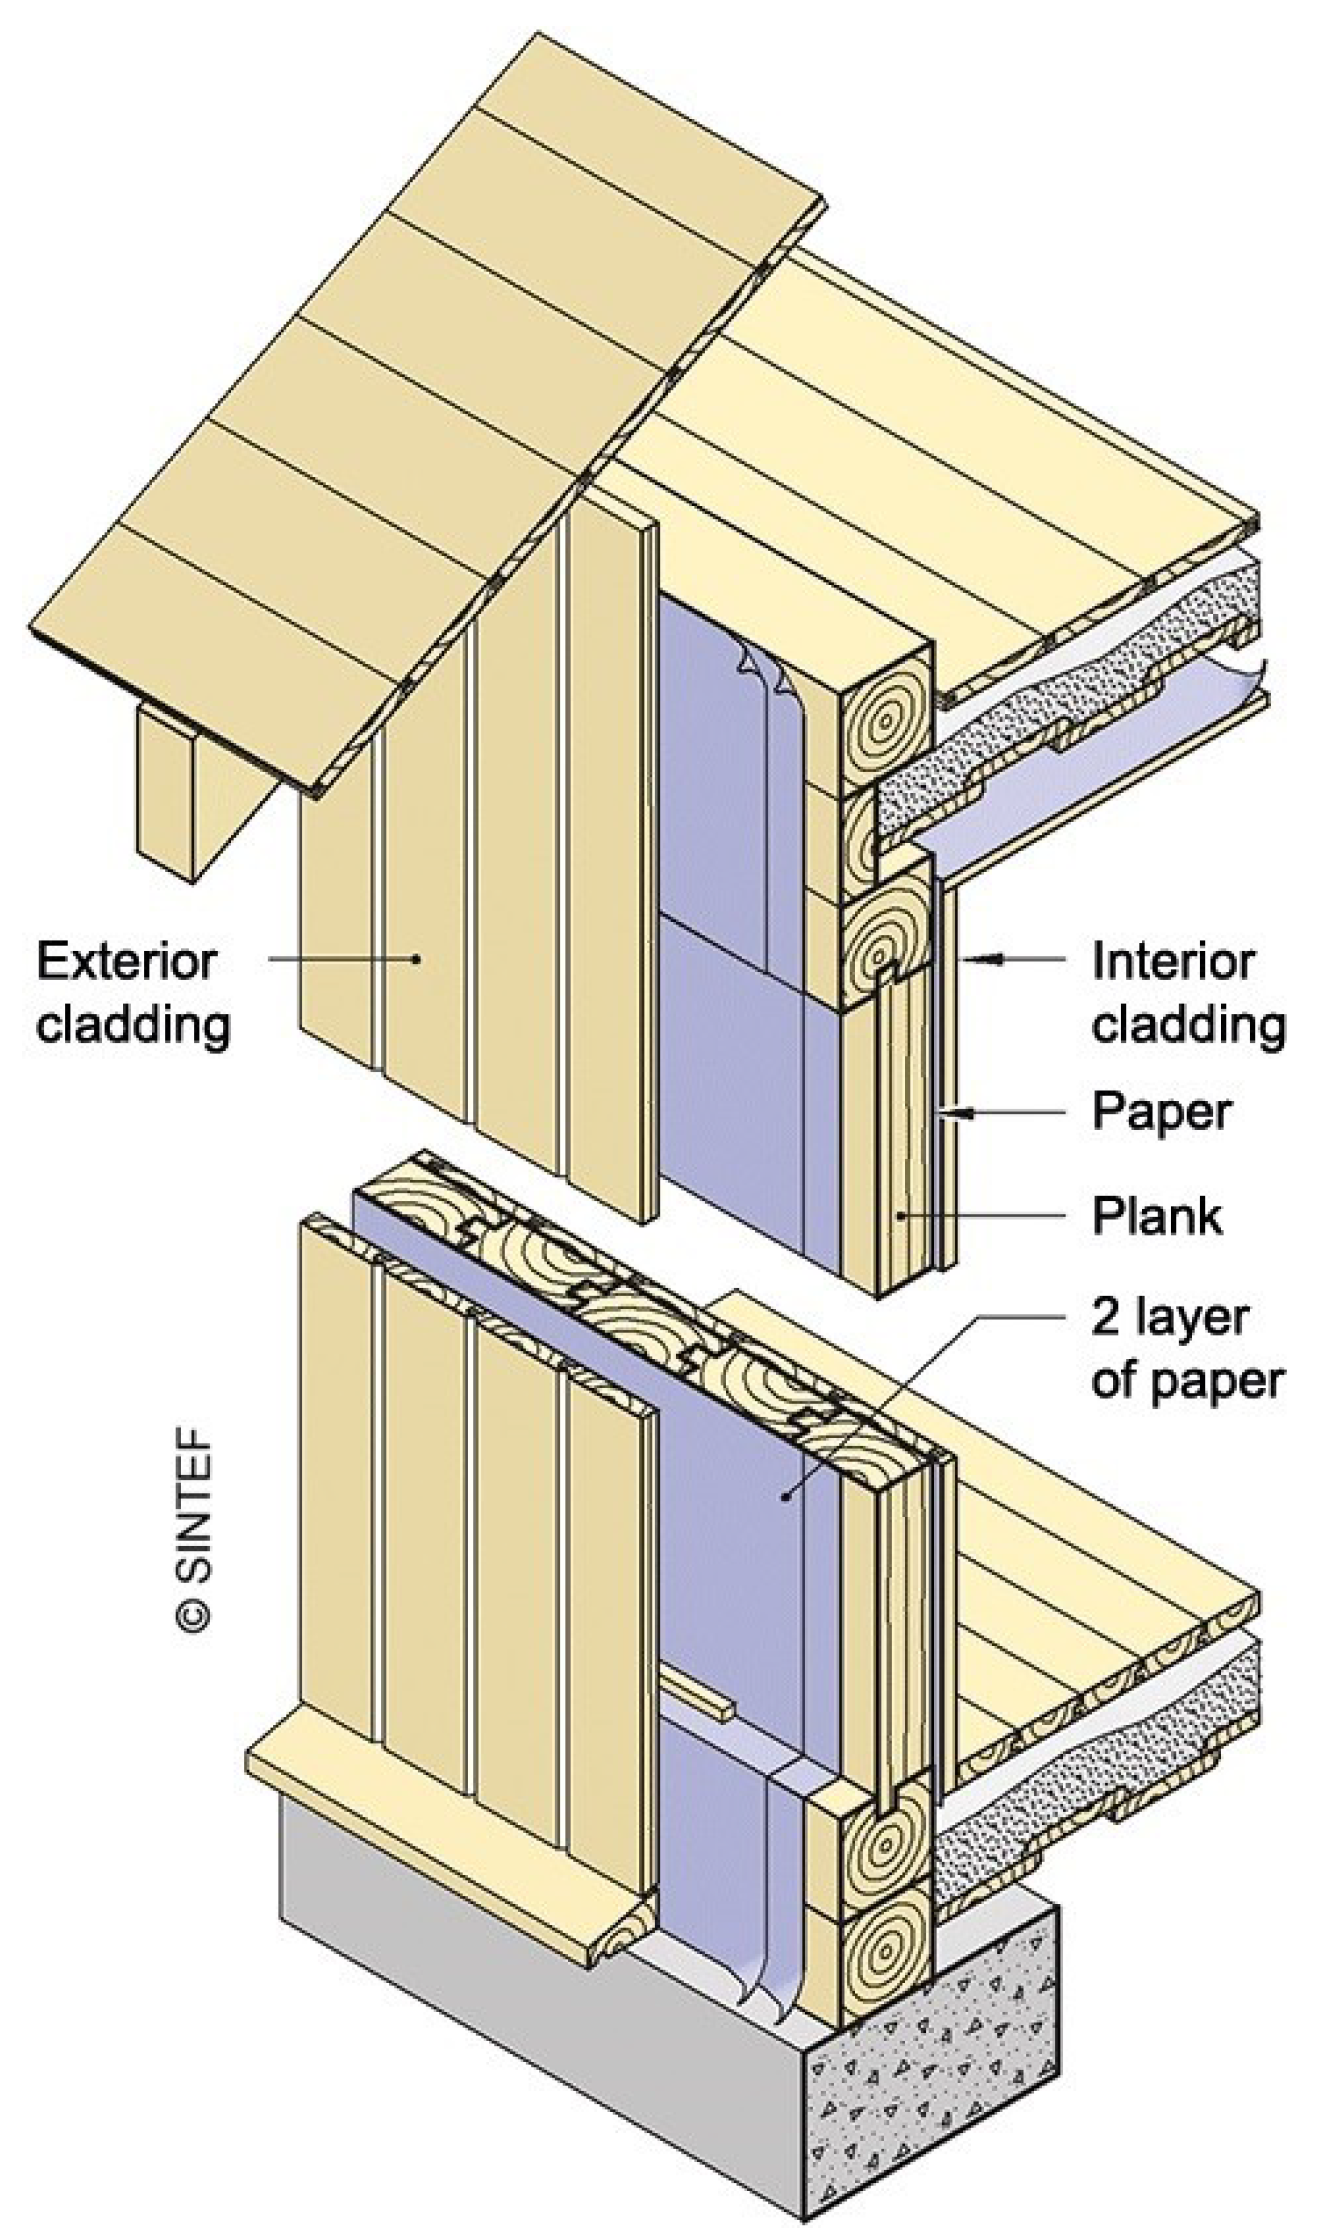
Figure 1. Timber plank frame wall. Figure adapted from [13].
Heritage 08 00278 g001
Figure 2. The sealing compound on the test specimens. (a) Mounting of test objects with a specimen diameter of 0.164 m. (b) Mounted test object with a specimen diameter of 0.164 m. (c) Mounted test object with a test specimen diameter of 0.075 m.
Heritage 08 00278 g002
Figure 3. Test object placed on shelves in test chamber.
Heritage 08 00278 g003
Figure 4. Gintronic GraviTest.
Heritage 08 00278 g004
Figure 5. The setup for weighing the test specimens inside the test chamber.
Heritage 08 00278 g005
Figure 6. The geometry and materials of the original timber plank frame wall. The monitor’s position is marked with a green dot.
Heritage 08 00278 g006
Figure 7. The geometry and materials for the internally retrofitted timber plank frame wall. Monitor positions are marked with green dots.
Heritage 08 00278 g007
Figure 8. The development of temperature and RH for Cases 5 to 7 during the 5-year simulation period for the most vulnerable locations of concern regarding mould growth risk. (a) Case 5 was monitored on the exterior side of the timber plank behind the building paper layer. (b) Case 6 was monitored on the exterior side of the timber plank behind the building paper layer. (c) Case 7 was monitored at the added insulation applied to the original interior cladding.
Heritage 08 00278 g008
Table 1. Most-used building paper product for timber plank frame wall [13].
MaterialTime ca.UseData
Tar- or asphalt-impregnated sheathing paper and cellulose board1870–OutsideAsphalt paper is available in both sanded and unsanded variants [14]. Sheathing paper is a thin type of paper produced as felt paper with added wood pulp, which is then impregnated. It weighs 250–300 g per m2.
Newspaper1850–1920InsideAround 50 to 55 g per m2, according to a specialist in paper materials.
Felt boards1870–1920InsideThese weigh around 350 g per m2 [14].
Unimpregnated cellulose boards1870–1950InsideThese are made from cellulose pulp [14] and used only in dry areas, as they absorb moisture.
Table 2. Tested building papers.
ProductPictureYearLocationDescription
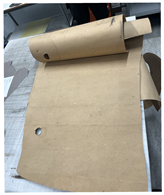
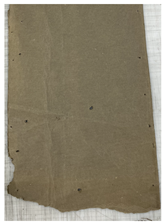
Exterior paperE1Heritage 08 00278 i0011908Orkanger train stationBrown paper. Taken from “the knee walls” on the outside.
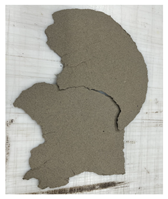
E2Heritage 08 00278 i0021938BelsnesAsphalt-impregnated paper. Black. Not grainy. House built in 1938 and renovated in the 1950s.
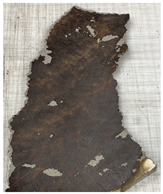
E3Heritage 08 00278 i0031938BelsnesAsphalt-impregnated paper. Black. More grainy than E2. House built in 1938 and renovated in the 1950s.
E4Heritage 08 00278 i0041938Vanvikan, Indre FosenBlack paper, probably asphalt-impregnated. Unknown origin and use. One roll found in a barn from 1938. The associated house was renovated in the 1950s–1960s.
Interior paperI1Heritage 08 00278 i0051908Orkanger train stationBrown-grey wool paper. Taken from “the knee walls” on the inside.
I2Heritage 08 00278 i0061908Orkanger train stationBrown-grey wool paper. Taken from “the knee walls” on the inside.
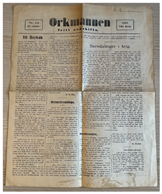
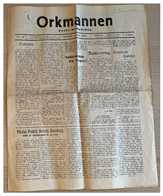
I3Heritage 08 00278 i0071932“Orkmannen” newpaperNewspaper from Orkdal in the south of Trøndelag in Norway [53]. A local newspaper from 1926 to 1945.
I4Heritage 08 00278 i0081933“Orkmannen” newspaperSame as above.
I5Heritage 08 00278 i0091936“Orkmannen” newspaperSame as above.
I6Heritage 08 00278 i0101880Northern Trøndelag, NorwayBrown paper. One smoother side and one rougher side. Found on the interior side of exterior walls in an 1880s log house. Assembly date unknown.
I7Heritage 08 00278 i011No dateOsloHaakon paper. Brown. The entire roll was stored in a basement and had not been used.
I8Heritage 08 00278 i0121880Northern Trøndelag, NorwayImpregnated wool paper. Black-brown colour on one side, grey on the other side. Found inside an 1880s log house. Assembly date unknown.
Table 3. Measured thickness of test samples.
No.E1E2E3E4I1I2I3I4I5I6I7I8
Thickness [mm]10.520.680.710.580.450.980.100.100.120.500.461.40
20.480.700.720.590.520.960.100.100.120.500.461.24
30.500.750.720.590.540.960.100.100.120.500.431.24
40.470.73 0.600.48 0.100.100.120.500.43
50.480.75 0.590.50 0.100.100.120.500.44
Average [mm]0.490.720.720.590.500.970.100.100.120.500.441.29
Grammage
[g/m2]322541541574--575857377261767
Table 4. The orientation of the test samples.
Sample No.Orientation
E1–E4, I1–I5, I7Identical on both sides. The orientation had no impact.
I6The smooth surface facing down to the salt solution.
I8The impregnated side facing down to the salt solution.
Table 5. Time intervals for weighing.
Time IntervalSamplesTest Chamber
Every 120 minI1 and I2Gintronic GraviTest
Every 24 hE1, E2, E3, E4, I6, I7, and I8Test enclosure with shelves
Every morning and afternoonI3, I4, and I5Test enclosure with shelves
Table 6. The input parameters kept constant in WUFI® Pro.
ParameterInputComment
Air exchanges in cavity0 h−1See the Data Availability Statement.
Initial temperature21 °C [61,62]
Initial RH0.7
Wall inclination90°
Exterior surface heat resistance, Rse0.0588 (m2K/W)Standard value in WUFI® Pro [63].
Interior surface heat resistance, Rsi0.125 (m2K/W)Standard value in WUFI® Pro [63].
Ground shortwave reflectivity0.2Standard value in WUFI® Pro [63].
Simulation startOctoberBeginning of wet season
Simulation duration5 years
Building height<10 mShort building
Driving rain coefficientsR1 = 0 R2 = 0.07Standard values in WUFI® Pro for short buildings [63].
Surface treatment of interior and exterior claddingOil painting s d value: 1.35 mOil paint has the highest level of vapour resistance, as measured in [64,65]. Three layers of paint.
Indoor temperature21 °C [61,62]
Orientation wallSouth
Timber cladding and timber planksScandinavian spruce, transversal direction IIMaterial in WUFI® Pro, taken from the NTNU database
Paper on interior sideTo layers of I6 ( s d value: 0.046 m)As all types of interior paper were vapour-permeable, the least vapour-permeable type was chosen.
Table 7. Variable input parameters in WUFI® Pro.
ParameterBasic InputVariable (s)
Outdoor climateKristiansundHamar
Insulation thickness50 mm100 mm 250 mm None
Insulation materialMineral wool
( λ = 0.034 W/(mK))
Wood fibre insulation
( λ = 0.038 W/(mK))
Vapour barrierPE foil 0.2 mm ( s d value: 87 m)MAVB No vapour barrier
Shortwave radiation absorptivity0.4 (white house)0.8 (dark house)
Paper on the exteriorE3 ( s d value: 5.293 m)Two layers of E1 ( s d value: 0.040 m)
Humidity class inside32
Table 8. Simplified system for assessing mould growth risk.
ColourRisk
RedHigh mould growth risk: RH over 80% and temperature between 5 and 30 °C for a continuous time period of minimum one day continuous.
YellowMedium mould growth risk: RH under 80% but exceeding 80 % for a short time period (<one day continuous); alternatively, RH increasing over the simulated 5-year time period (this needs to be investigated further over a longer time period); alternatively, RH over 80% at the beginning of the simulation but decreasing over the simulated 5-year time period.
GreenLow mould growth risk: RH under 80 %, and RH does not increase during the simulated 5-year time period.
Table 9. s d values for the tested types of building paper.
No.Description s d Value [m]
E1Brown paper.0.020
E2Asphalt-impregnated paper; not grainy.0.881
E3Asphalt-impregnated paper; grainy.5.293
E4Black; impregnated paper.0.435
I1Wool paper.0.018
I2Wool paper.0.021
I3Newspaper from 1932.0.013
I4Newspaper from 1933.0.014
I5Newspaper from 1936.0.008
I6Brown paper.0.023
I7Haakon paper; brown.0.017
I8Impregnated wool paper.0.022
Table 10. Combinations of the varied input parameters for Cases 1 to 11, with the mould growth risk evaluated.
Case
Input Parameters 1234567891011
Insulation thickness0 mm (original wall)xxxx
50 mm x x
100 mm x x
250 mm x xx
Outdoor climateKristiansundxx xxxxx x
Hamar xx x
Insulation materialGalva mineral wool xxxxxxx
Wood fibre insulation
Vapour barrierNormal xxxxxx
MAVB
Nonexxxx x
Shortwave radiation0.4xxxxxxxxxxx
absorptivity0.8
Paper exterior sideE3x x xxx x
Two layers of E1 x x xxx
Humidity class3xxxxxxxxxxx
inside2
Mould growth risk
Table 11. Combinations of the varied input parameters for Cases 12 to 21, with the risk of mould growth evaluated.
Case
Input Parameters 12131415161718192021
Insulation thickness0 mm (original wall) x
50 mmxxx x x
100 mm x x
250 mm x x
Outdoor climateKristiansund xxxxxxxx
Hamarx x
Insulation materialMineral woolxx xxxx
Wood fibre insulation xxx
Vapour barrierNormal xxx
MAVB xxxx
Nonexx x
Shortwave radiation0.4xxxxxxxx x
absorptivity0.8 x
Paper exterior sideE3x xxxxxxxx
Two layers of E1 x
Humidity class3xxxxxxxxx
inside2 x
Mould growth risk
Disclaimer/Publisher’s Note: The statements, opinions and data contained in all publications are solely those of the individual author(s) and contributor(s) and not of MDPI and/or the editor(s). MDPI and/or the editor(s) disclaim responsibility for any injury to people or property resulting from any ideas, methods, instructions or products referred to in the content.